Article

Research on Thermochemical and Gas Emissions Analysis for the Sustainable Co-Combustion of Petroleum Oily Sludge and High-Alkali Lignite

1
Shandong Key Laboratory of Green Electricity & Hydrogen Science and Technology, School of Chemical Engineering, Shandong Institute of Petroleum and Chemical Technology, Dongying 257061, China
2
National Engineering Research Center of Coal Preparation and Purification, University of Mining and Technology, Xuzhou 221116, China
3
School of Chemistry and Chemical Engineering, Shandong University, Jinan 250100, China
*
Authors to whom correspondence should be addressed.
Sustainability 2025, 17(15), 6703; https://doi.org/10.3390/su17156703
Submission received: 5 July 2025 / Revised: 20 July 2025 / Accepted: 21 July 2025 / Published: 23 July 2025
(This article belongs to the Special Issue Harmless Disposal and Valorisation of Solid Waste)

Abstract

Petroleum oily sludge (OLS), a hazardous by-product of the petroleum industry, and high-alkali lignite (HAL), an underutilized low-rank coal, pose significant challenges to sustainable waste management and resource efficiency. This study systematically investigated the combustion behavior, reaction pathways, and gaseous-pollutant-release mechanisms across varying blend ratios, utilizing integrated thermogravimetric-mass spectrometry analysis (TG-MS), interaction analysis, and kinetic modeling. The key findings reveal that co-combustion significantly enhances the combustion performance compared to individual fuels. This is evidenced by reduced ignition and burnout temperatures, as well as an improved comprehensive combustion index. Notably, an interaction analysis revealed coexisting synergistic and antagonistic effects, with the synergistic effect peaking at a blending ratio of 50% OLS due to the complementary properties of the fuels. The activation energy was found to be at its minimum value of 32.5 kJ/mol at this ratio, indicating lower reaction barriers. Regarding gas emissions, co-combustion at a 50% OLS blending ratio reduces incomplete combustion products while increasing CO2, indicating a more complete reaction. Crucially, sulfur-containing pollutants (SO2, H2S) are suppressed, whereas nitrogen-containing emissions (NH3, NO2) increase but remain controllable. This study provides novel insights into the synergistic mechanisms between OLS and HAL during co-combustion, offering foundational insights for the optimization of OLS-HAL combustion systems toward efficient energy recovery and sustainable industrial waste management.

1. Introduction

Petroleum is the vital lifeblood of global industry. It is an unavoidable consequence of the processes of crude oil extraction, storage, transportation, and product processing that waste will be generated. The primary byproduct of these processes is petroleum oily sludge (OLS) [1]. In China, the Organization for Economic Cooperation and Development (OECD) reports that OLS production accounts for approximately 0.5% to 1% of crude oil production. Each industry contributes an annual output of over 7 million tons of OLS, with historical stockpiles surpassing 143 million tons [2].
The composition of OLS is intricate and contains a substantial amount of petroleum hydrocarbons. The solid components of OLS consist of particles in various forms, including silica sand grains, calcium carbonate particles, coal particles, iron oxide particles, biomass residues, and mineral microparticles [3]. Concurrently, the emulsified aqueous phase of OLS contains impurities such as polymer oil displacement agents, bacteria, salts, acidic gases, microorganisms, and their metabolic products. OLS displays intricate spatiotemporal variation characteristics, exhibiting a complex interplay among oil, water, and solid phases [4]. Furthermore, OLS exhibits physical and chemical properties that include high viscosity, significant hydrophobicity, and interfacial adsorption capacity. However, its dehydration efficiency is limited, and it exhibits high solubility for aliphatic components [5]. This has resulted in a substantial enhancement of the complexity of OLS separation, and the technical complexity and cost of achieving resource-based crude oil recycling have increased considerably. Concurrently, OLS contains toxic and harmful substances such as benzene compounds, phenols, heavy metals, anthracene, pyrene, polychlorinated biphenyls, and dioxins [6], which exhibit significant adsorption affinity for soil colloids and organic matter components. The migration of these pollutants into the marine environment can induce a variety of ecological toxic effects, including carcinogenicity, teratogenicity, and mutagenicity. It is particularly noteworthy that, under the action of microbial metabolism, such pollutants can trigger the release of biogenic volatile organic compounds. These substances possess both flammable properties and gaseous byproducts that are irritating to humans and other organisms. These byproducts can compound the complexity of environmental remediation efforts. In China, OLS is classified as a hazardous waste, and its discharge without proper treatment is subject to legal penalties. Consequently, the implementation of effective and comprehensive disposal strategies is imperative for ensuring compliance with legal mandates and fostering sustainable development in the petroleum industry.
The contemporary OLS-disposal-technology system can be categorized into two primary domains: resource utilization and harmless treatment. The utilization of resources is primarily concerned with the implementation of solvent extraction, pyrolysis, ultrasonic treatment technology, and chemical washing methods. In contrast, the treatment of harmless resources entails combustion, solidification treatment, oxidation, and biological treatment methods [7]. Recent studies have demonstrated that different disposal technologies manifest distinctive technical characteristics in the treatment of OLS. While novel OLS treatment methods exhibit technical advantages in certain application scenarios, their overall treatment efficiency remains constrained, failing to meet the stringent requirements of environmental protection departments when applied to OLS in a systematic and large-scale manner [8]. The prevailing combustion technology continues to serve as the predominant process within the OLS-disposal system [7,9,10]. Combustion has been demonstrated to possess significant advantages, including simplicity, directness, and thoroughness [11]. Under conditions of a sufficient air supply, OLS undergoes complete combustion. Combustion has been demonstrated to markedly diminish the volume and treatment time of OLS while concomitantly carbonizing noxious substances. Despite its potential drawbacks, such as diminished resource recovery efficiency, incineration emerges as a viable treatment option for OLS, a conclusion that aligns with the prevailing treatment needs of the contemporary context [12].
Co-combustion is a prevalent disposal method in the domain of combustion technology. The primary benefit of this approach is the enhancement of combustion efficiency, the reduction of pollutants, and the promotion of resource recycling through fuel complementarity [13]. Co-combustion technology for solid waste and coal has been validated through research as a highly promising method for waste resource utilization. This technology has been demonstrated to be effective in reducing the volume of solid waste sent to landfills, while also recovering energy from the waste for use in power generation or heating [14]. However, the complex composition and unstable physical and chemical properties of solid waste result in significant fluctuations in fuel characteristics during co-combustion, posing challenges for achieving stable combustion and precise control [15]. In comparison with other categories of solid waste, OLS exhibits a comparatively higher content of petroleum hydrocarbons, a characteristic that contributes to enhancing the combustion stability of the co-combustion system. A substantial body of research has demonstrated that the co-combustion of OLS with fossil fuels, including coal, petroleum coke, and biomass, can enhance the combustion performance [16]. The technology of OLS co-combustion with coal has been commercialized in several countries, including Germany, Switzerland, Denmark, and Japan. The co-combustion of OLS from refineries with coal has emerged as a prevalent treatment method, with OLS technology being adopted in numerous refineries across China. This approach aims to achieve two key objectives: the safe disposal of OLS and the recovery of energy [7]. Moreover, thermogravimetric analysis (TGA) has found widespread application in investigating the intrinsic combustion reactivity of solid fuels [10]. The fundamental understanding of fuel thermal behavior derived from TGA is critical. It directly informs subsequent research on drop tube furnace (DTF) combustion performance and underpins the engineering design of industrial-scale combustion boilers, as well as the optimization of co-combustion fuel blending ratios [14]. Ma et al. [10]. Investigated the co-combustion characteristics of waste tire-modified oily sludge with coal. The findings of the study indicated that the co-combustion process with coal led to enhanced combustion characteristics, culminating in reduced ignition and burnout temperatures. The emission patterns of harmful gases were studied using mass spectrometry analysis, revealing that co-combustion reduced H2S and SO2 emissions but had a limited effect on nitrogen oxide emissions. Dong et al. [17] investigated the co-combustion of coal, biomass, and oil-contaminated sludge at varying ratios and discovered that the co-combustion of OLS with coal and biomass substantially decreased the ignition temperature and burnout temperature, thereby enhancing the combustion performance of OLS. This finding indicates that coal and biomass exhibit a synergistic effect on the combustion of OLS. The aforementioned studies collectively demonstrate that the co-combustion of OLS with coal can enhance combustion performance.
High-alkali lignite (HAL) is a low-rank coal that accounts for half of the world’s coal reserves. China possesses substantial reserves of brown coal, constituting 10–15% of the nation’s total coal reserves. However, the price of lignite is only 20% of that of high-rank coal [18]. HAL suffers from limited industrial utilization due to its high moisture content and proneness to weathering. Developing advanced utilization technologies for lignite constitutes a persistent industrial challenge and active research domain. The presence of alkali metals (e.g., Ca and Fe) in HAL significantly restricts its pyrolysis and gasification behavior. Marek et al. [19] circumvented agglomeration and enhanced combustion efficiency by incinerating sunflower biomass in conjunction with HAL, thereby augmenting the utilization rate of HAL in industrial contexts. However, the combination of HAL with biomass has been observed to spontaneously ignite, thereby constraining the large-scale application of HAL. Khan et al. [20] employed waste plastic and HAL for co-pyrolysis. The utilization of pyrolysis oil and char has been demonstrated to possess significant potential for application; however, due to the inherent costs and operational complexities associated with this technology, its large-scale implementation remains challenging. The co-combustion of OLS and HAL as a resource-recovery technology demonstrates dual potential in energy recovery and pollution control. The resource recovery of HAL and OLS through co-combustion technology can achieve the harmless treatment of OLS while providing a reference solution for the large-scale comprehensive utilization of HAL. However, the mechanisms underlying the co-combustion reaction process and the combustion characteristics of HAL and OLS remain to be elucidated, a state of affairs that hinders the development of industrial-scale utilization technology.
Previous studies indicate that the incomplete combustion of OLS and HAL generates carbon monoxide (CO) with peak concentrations reaching 100 mg/m3 and soot particulates. These pollutants primarily originate from the partial oxidation of hydrocarbons under localized oxygen-deficient conditions. Notably, when the combustion efficiency falls below 90%, CO emissions increase exponentially [21]. Concurrently, OLS nitrogen-containing organic compounds (e.g., pyrrole and amines) undergo thermal decomposition, yielding NH3 and HCN. These compounds are subsequently oxidized to form NO, contributing to a rate of 60–80% [22]. Sulfur is found in the form of sulfides (e.g., FeS) and organic sulfur. Under conditions abundant in oxygen, sulfur predominantly converts into SO2. Research has demonstrated that when the sulfur content of sludge surpasses 2%, the SO2 emission concentration can exceed 400 ppm [22]. The gaseous pollutants produced by OLS combustion have the potential to inflict considerable harm on humans and the environment. For instance, volatile organic compounds (VOCs), including benzene and formaldehyde, have been shown to inflict damage to DNA by competing with the cytochrome P450 enzyme system. Nitrogen oxides (NOx) and sulfur oxides (SO2) have been observed to potentiate respiratory inflammatory responses, resulting in increased IL-6 expression levels by a factor of 3 to 5 [23,24]. The reaction of emitted VOCs and NOx with sunlight leads to the formation of ozone and secondary organic aerosols (SOAs), with SOAs contributing to 30% to 50% of PM2.5 [25]. The release of gaseous pollutants during the combustion process can have a detrimental impact on the environment. Therefore, close attention should be paid to this release.
This study employed integrated thermogravimetry-mass spectrometry (TG-MS), interaction analysis, and kinetic modeling to investigate the combustion behavior, reaction evolution, and underlying mechanisms during the co-combustion of OLS and HAL. Special emphasis was placed on elucidating the emission profiles of hazardous gases and optimal blending ratios for enhanced performance. The findings aim to establish a theoretical foundation and provide technical support for the synergistic deployment of OLS and HAL.

2. Materials and Methodology

2.1. Sample Preparation

The OLS samples were obtained from SINOPEC Shengli Oilfield Co., Ltd., Dongying, China, and the HAL samples were obtained from Inner Mongolia, China. The OLS samples underwent a pretreatment that involved drying in an air oven at a temperature of 105 °C for a duration of 24 h. Subsequent to this, the materials were subjected to a crushing and grinding process, resulting in the formation of a powder-like substance. The prepared OLS and HAL were then homogenously blended in mass ratios of OLS: HAL of 10:0, 8:2, 6:4, 5:5, 4:6, 2:8, and 0:10, with the resulting blend samples named OLSx-HALy. Table 1 presents the naming convention for these blends.

2.2. Analysis of the Combustion Process

2.2.1. TG-MS Analysis

The present experiment employed a thermogravimetric analyzer (NETZSCH, STA449F5, Berlin, Germany) in conjunction with a quadrupole mass spectrometer (NETZSCH, QMS403D, Berlin, Germany) to conduct a thermogravimetric-mass spectrometry (TG-MS) analysis. The TG system has a sensitivity of 0.1 μg, a temperature measurement accuracy of 0.1 °C, and a heating rate range of 0.1–100 °C/min. An empty crucible was initially positioned within the thermogravimetric apparatus, operating under an air atmosphere at a heating rate of 10 °C/min. The gas flow rate was set at 250 mL/min, and the temperature range was configured to span from 30 °C to 800 °C. These parameters were selected to execute a blank thermogravimetric test. The precise weighing of 10 ± 1 mg of raw material and the blend was conducted, followed by their placement in the empty crucible. Subsequently, a thermal weight loss experiment was initiated to obtain the TG-DTG curve. During the thermal gravimetric analysis, the mass spectrometer was utilized to perform real-time full-scan monitoring of the mass-to-charge ratio (m/z) from 2 to 299. The following assertion is made based on the typical mass-to-charge ratios of gaseous pollutants. The mass spectrometry curve is plotted based on the following molecular weights: 44 for CO2, 28 for CO, 30 for NO, 46 for NO2, 17 for NH3, 64 for SO2, and 34 for H2S.

2.2.2. Combustion Characteristic Parameters

(1)
Ignition temperature (Ti)
The temperature at which OLS and HAL begin to burn is referred to as the ignition temperature [26]. The ignition temperature can be used to evaluate the ignition performance of OLS and HAL components. The duration required for the ignition temperature to be attained is denoted as the ignition time, ti.
(2)
Burnout temperature (Tf)
The temperature at which the mass of OLS and HAL combustion reaches 98% of the total weight loss is defined as the burnout temperature Tf. It is widely accepted that the lower the burnout temperature of OLS and HAL, the superior their combustion performance, and vice versa [10].
(3)
Maximum combustion rate (DTGmax)
The maximum reaction rate that occurs during the combustion of OLS and HAL is referred to as the maximum combustion rate. The maximum reaction rate of the sample is identified as the highest peak point on the DTG curve. It has been demonstrated that the magnitude of DTGmax is directly proportional to the intensity of the combustion reaction between OLS and HAL.
(4)
Maximum combustion rate temperature (Tmax)
The temperature at which the maximum combustion rate of OLS and HAL is achieved is referred to as the maximum combustion rate temperature, Tmax.
(5)
Average burning rate (DTGmean)
D T G m e a n = β × α T i α T f T f T i
in which, αTf represents the percentage of the OLS component and HAL corresponding to the ignition temperature, %; αTi represents the percentage of the OLS and HAL corresponding to the ignition temperature, %; Ti represents the ignition temperature of the sample, °C; Tf represents the burnout temperature of the sample, °C; and β represents the rate of temperature increase, °C/min.
(6)
Comprehensive combustion performance parameters (S)
To evaluate the combustion process of samples more rationally, a comprehensive oxidation index, S, was defined. This index considers the effects of Ti, Tf, the maximum mass loss rate DTGmax, and the average mass loss rate DTGmean. The calculation formula is as follows [27,28,29]:
S = D T G m e a n × D T G max T i 2 × T f
where Ti represents the ignition temperature, °C; Tf denotes the burnout temperature, °C; DTGmean signifies the average burning rate of the OLS and HAL components, %/min; and DTGmax is the maximum burning rate of the OLS and HAL components, %/min.

2.3. Sample Property Testing

The proximate and ultimate analyses of the samples were performed in accordance with the standard methods specified in the Chinese standards GB/T 212–2008 [30] and GB/T 31391–2015 [31], respectively. The higher heating value (HHV) was determined by the standard method specified in the Chinese standard GB/T 213–2008 [32]. The chemical composition of the samples was analyzed via X-ray fluorescence spectrometry (XRF, Bruker S8 Tiger, Berlin, Germany) following the standard methods specified by ASTM D4326–2013 [33] and ASTM D3174–12 [34].

2.4. Analysis of Co-Combustion Interaction

The interaction between OLS and HAL plays an important role in their co-combustion process. The combustion conversion rate curves of OLSx-HALy at varying ratios were examined to establish a basis for comparison with the experimentally measured conversion rates. This approach was undertaken to ascertain the synergistic and antagonistic effects of OLSx-HALy during combustion. The calculation formula is as follows:
X = m i m t m i m f
X e x p = α X O L S + ( 1 - α ) X H A L
Δ X = X c a l X exp
where X represents the reaction conversion rate of OLS and HAL,%, mi is the initial mass of the OLS and HAL, mg; mt is the mass of the OLS and HAL at time t, mg; and mf is the mass of the OLS and HAL after the reaction, mg. Xexp is the experimentally measured conversion rate of the OLS and HA, α is the proportion of OLS in the mixed sample, XOLS is the conversion rate for the separate combustion of OLS, XHAL is the conversion rate for the combustion of HAL in isolation, and Xcal represents the calculated reaction conversion rate of the OLS-HAL blend, while ΔX denotes the difference between the experimental and theoretical combustion conversion rates of the blend.
ΔX quantifies interactions within the blend during co-combustion. When ΔX > 0, it signifies synergistic effects between the components; when ΔX < 0, it indicates antagonistic effects within the blend; when ΔX = 0, no significant interaction occurs between the constituents [35]. Concurrently, the absolute value of ΔX can also be indicative of the strength of the interaction between the two substances. When the absolute value of ΔX is larger, it is indicative of a stronger interaction between OLS and HAL, and vice versa.

2.5. Kinematic Analysis and Calculation Method

To elucidate the reaction pathways during OLS-HAL co-combustion, a kinetic analysis was performed to determine the activation energy (E). The magnitude of E reflects the intrinsic reactivity of the OLS-HAL blend, where lower values indicate enhanced combustibility. According to the Arrhenius equation (Equation (7)), the combustion rate is expressed as a function of the temperature [36,37].
d x d t = K f ( x )
K = A exp ( E R T )
where K is the reaction rate constant, min−1; A is the pre-exponential factor, min−1; E is the activation energy for OLS and lignite combustion, kJ·mol−1; R is the universal gas constant (8.314 × 10⁻³ kJ·mol−1·K−1); and T is the thermodynamic temperature, K.
The Coats–Redfern method was employed to calculate the co-combustion reaction kinetics under varying mixing ratios. The relevant model equations are presented below [10,36].
ln [ f ( x ) T 2 ] = ln ( A R β E ) E R T
where β is the heating rate, °C/min; f(x) is the co-combustion reaction mechanism function in Table S1 and corresponds to different diffusion and reaction models. The activation energy is calculated by using the l n [ f ( x ) T 2 ] and 1 T functions over the tangent point as a linear equation and taking the slope of the linear equation when the R2 is at its maximum value.

3. Results and Discussion

3.1. Chemical Property Analysis

The results of the chemical properties are presented in Table 2 and Table 3.
The above results reveal that HAL exhibits significantly superior fuel characteristics in comparison to OLS. Specifically, HAL has been found to have higher fixed carbon and gross calorific values when compared to oil-contaminated sludge. However, it should be noted that OLS has a higher volatile matter content than HAL. This disparity provides the thermodynamic foundation for the OLS and HAL co-combustion system. Moreover, it can be observed from Table 3 that the characteristic of HAL is a high content of alkali metals and alkaline earth metals, while in OLS, the contents of silicon, aluminum, and iron are relatively high. This indicates that the two fuels may be able to overcome the disadvantages of a single fuel through the complementary advantages of the co-combustion process. Moreover, the contrasting ash compositions (OLS: Si/Al/Fe-rich; HAL: Ca/Na/K-rich) may mitigate individual ash-related issues, offering inherent advantages for ash management.

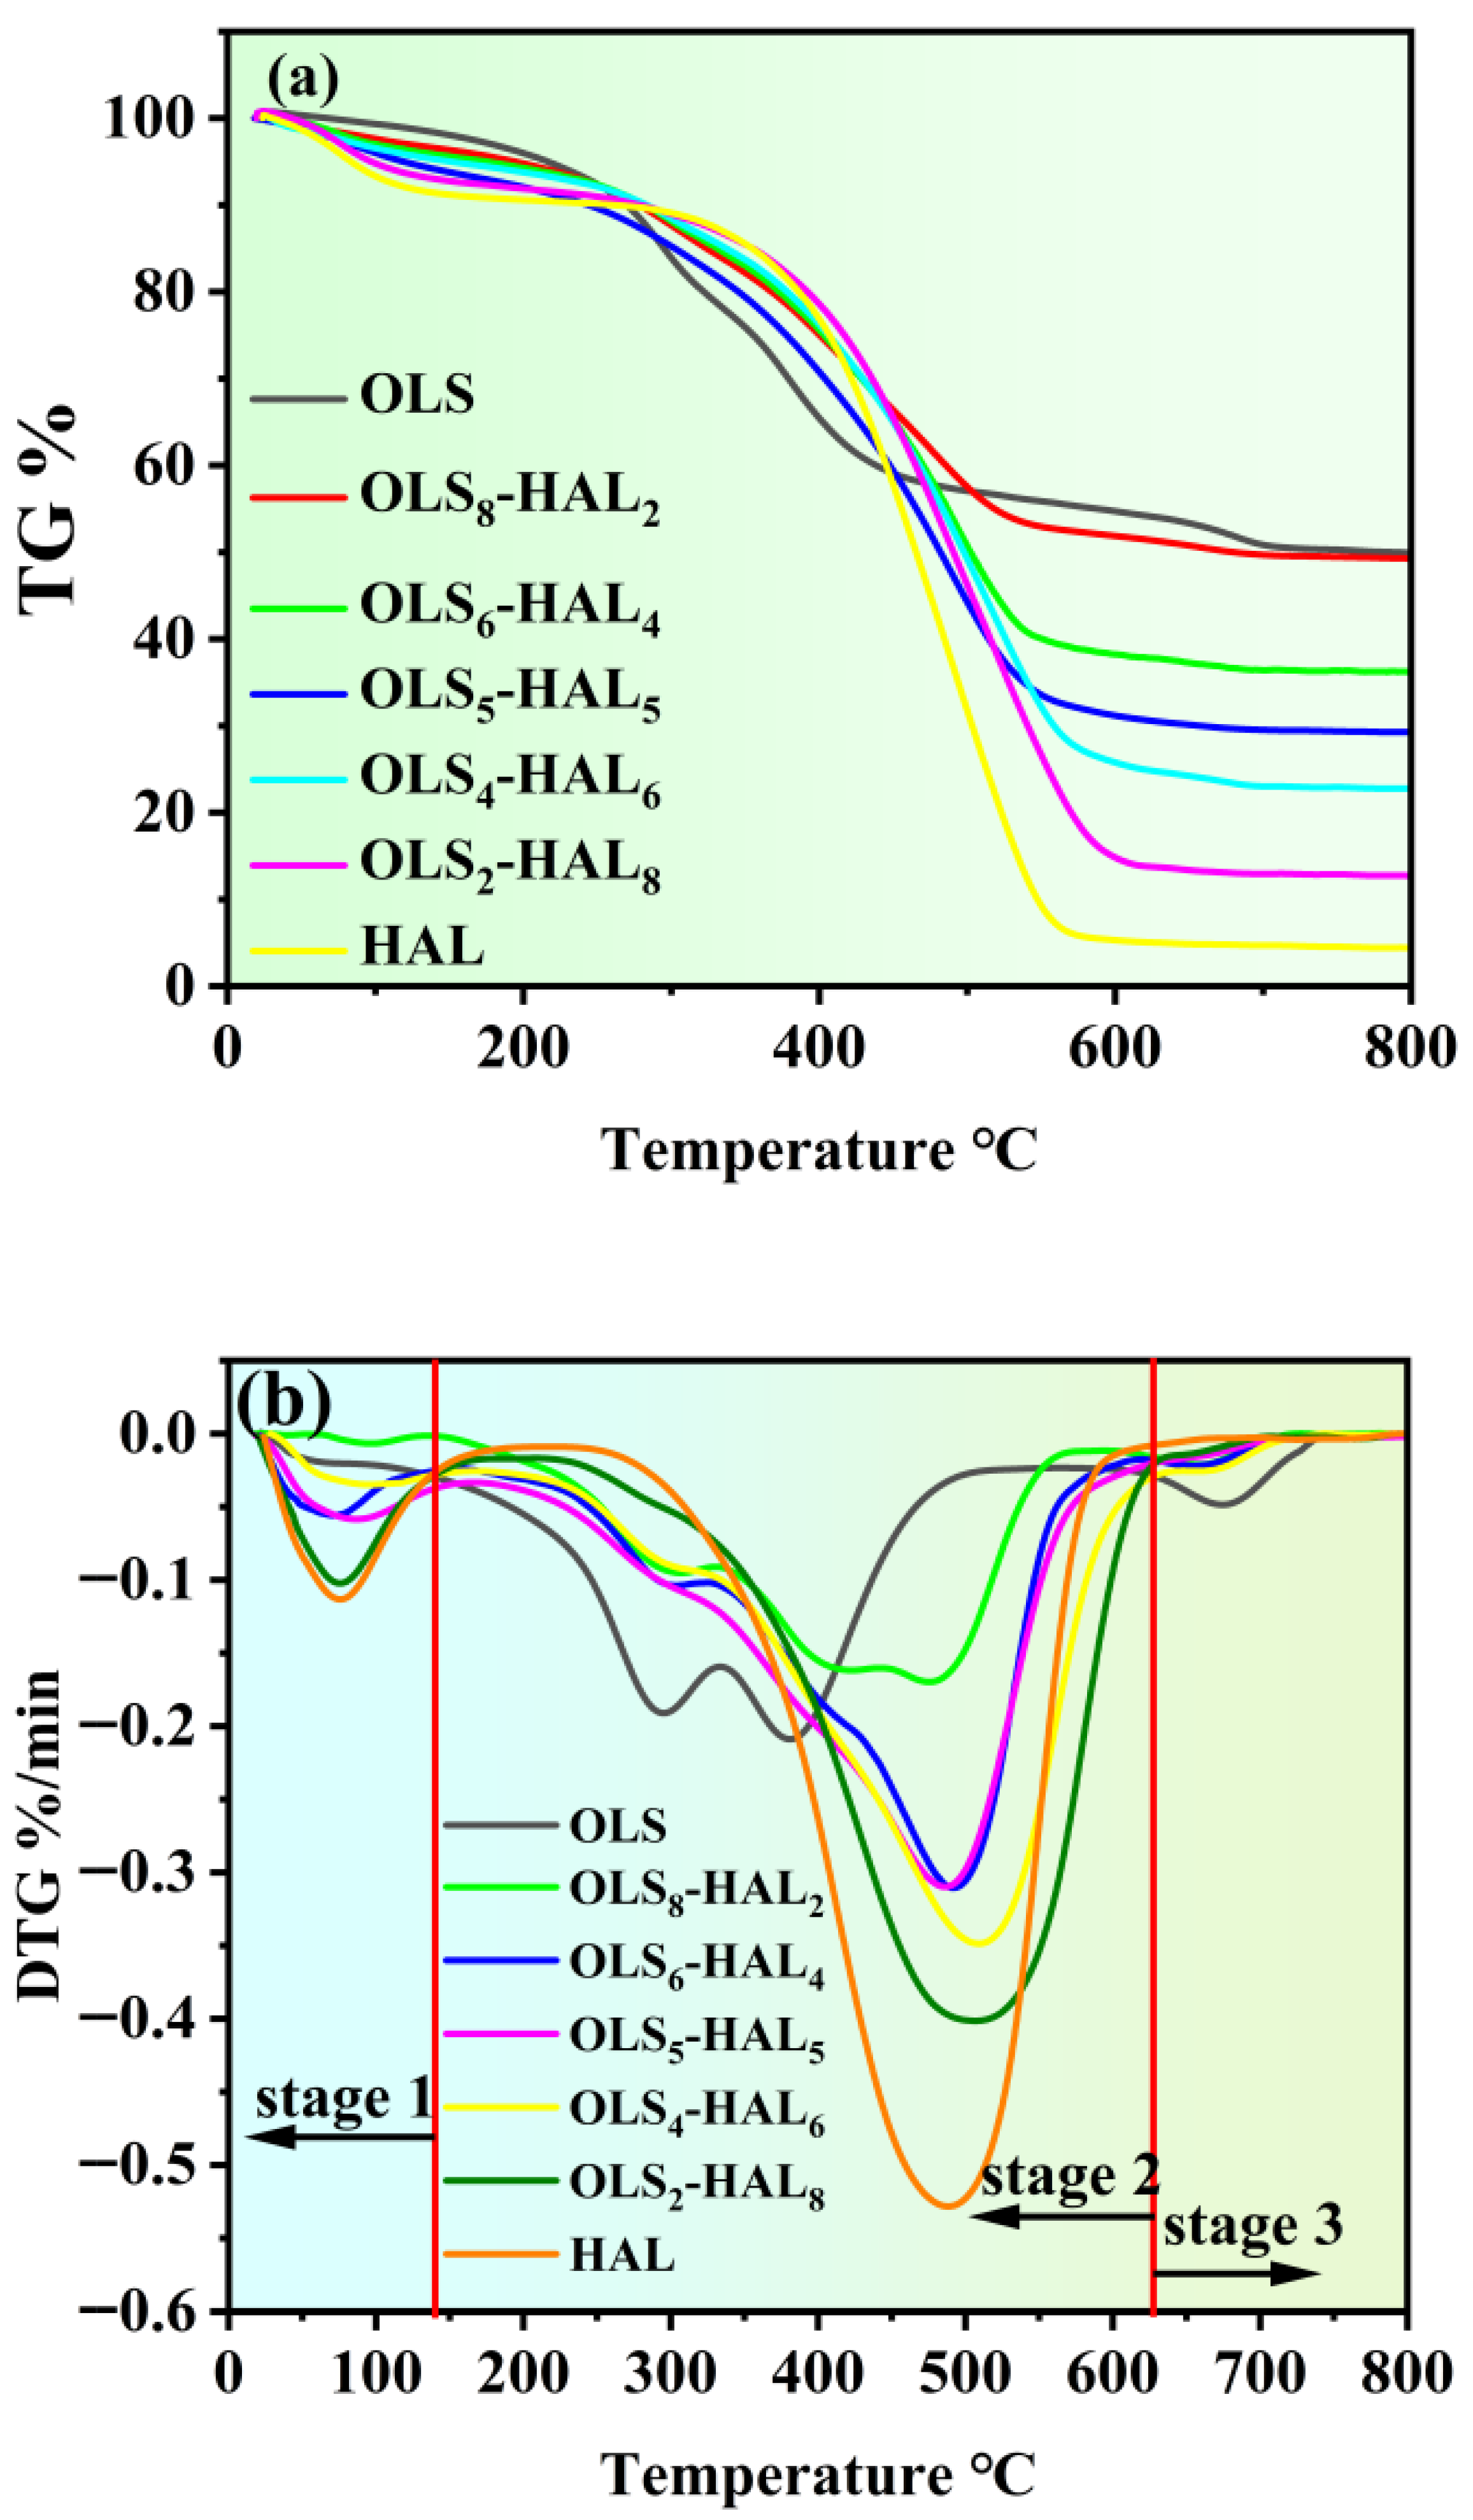
3.2. Co-Combustion Performance Analysis

As illustrated in Figure 1, the TG and DTG curves of OLS and HAL blended at varying ratios are presented. TG and DTG analyses indicate that the final weight loss rate and maximum reaction rate of OLS are significantly lower than those of HAL. Specifically, the final weight loss rate and maximum reaction rate of OLS are 50.1% and 2.09%/min, respectively, while the final weight loss rate and maximum reaction rate of HAL are 95.6% and 5.28%/min, respectively. The final weight loss rate and maximum reaction rate of the blends fall between those of OLS and HAL. This result indicates that HAL has a significant impact on the combustion performance of OLS [16], as HAL contains more substances available for combustion decomposition and exhibits a higher combustion decomposition rate [10]. As illustrated in Figure 1a, the curve of the blended sample resides between the OLS curve and the HAL curve, exhibiting a gradual downward trend as the HAL blending ratio increases. This result suggests that increasing the HAL ratio in the binary blend system of OLS and HAL can reduce the weight loss rate of co-combustion products. Figure 1b shows that the combustion of OLS can be categorized into three distinct stages. The initial stage, spanning from 40 to 330 °C, is characterized by the release and combustion of small-molecule petroleum hydrocarbons, resulting in the formation of peaks. The subsequent stage, ranging from 330 to 510 °C, is attributed to the volatilization, cracking, and combustion of complex petroleum hydrocarbons [16]. The final stage, between 630 and 740 °C, is associated with weight loss resulting from the high-temperature decomposition of carbonate components in OLS [38].
The co-combustion process is comprised of three distinct stages. Stage one of the process occurs at temperatures ranging from 30 to 150 °C. An analysis of the DTG curves of OLS and HAL reveals that OLS does not demonstrate a substantial weight loss peak in stage one, which is attributable to the drying of OLS during the sample preparation stage. In contrast, the DTG curve of HAL exhibits a discernible weight loss peak in stage one due to the absence of drying during sample preparation. This finding indicates that the weight reduction observed in the co-combustion sample during stage one is attributable to the moisture carried by HAL, which is evaporated by the heat generated during the process. Stage II, situated within the temperature range of 150 to 620 °C, is identified as the primary phase of combustion. An analysis of the DTG curve for this stage indicates that OLS exhibits two weight loss peaks in Stage II, while HAL exhibits one weight loss peak. The DTG curve for the co-combustion sample demonstrates a progressive convergence with that of the HAL sample as the HAL proportion is augmented. The presence of two weight loss peaks in the OLS curve is attributed to the high volatile matter content in the OLS sample. The initial weight loss phase is characterized by the combustion of volatile matter and small molecules. The elevated content of volatile matter leads to a more pronounced reaction during the initial peak. The incorporation of HAL during the co-combustion process results in a modulation of the initial peak reaction, leading to a more gradual progression. Concurrently, the secondary peak reaction experiences an enhancement in intensity and shifts the subsequent reaction interval towards the high-temperature range. In the third stage, the DTG curve of the co-combustion sample does not show a distinct weight loss peak. This finding indicates that brown coal contains almost no carbonate components. The weight loss peak observed during this stage is attributable to the presence of sand and silt carried by the OLS.
As demonstrated in Table 4, the ignition temperature (Ti) of OLS is 238.47 °C, which is significantly lower than that of HAL (Ti = 370.94 °C). This phenomenon is primarily attributed to the higher volatile matter content in OLS, which renders it more conducive to ignition combustion than HAL [39]. The combustion temperature (Tf) of OLS is 699.31 °C, while that of HAL is 568.81 °C. This outcome suggests that the combustion temperature range of HAL is considerably more constrained than that of OLS. Furthermore, an analysis of the comprehensive combustion performance index S reveals that HAL exhibits superior combustion performance compared to OLS. Moreover, research findings indicate that the Tf of co-combustion samples exhibits a decrease in comparison to OLS samples, while DTGmax, DTGmean, and S demonstrate higher values than those observed in OLS samples. This observation signifies that the incorporation of HAL enhances the comprehensive combustion performance of co-combustion samples [38]. However, it is found that the comprehensive combustion performance index S of the co-combustion samples increases with the rise in the HAL blending ratio. This indicates that the better reactivity and combustion stability of HAL can significantly improve the combustion reactivity of OLS.

3.3. Interaction Analysis

To compare the strength of synergistic and antagonistic interactions between different components, the difference between the experimental and calculated conversion rates (denoted as ΔX) is used to illustrate the interaction between the two components more intuitively. Figure 2 illustrates the interaction between the two substances under study. A positive ΔX value indicates a synergistic interaction, while a negative value indicates an antagonistic interaction. Figure 3 shows that synergistic and antagonistic effects coexist during co-combustion. During the initial stage of combustion, as the temperature gradually increases, the interaction exhibits synergistic effects, and the calculated conversion rate is lower than the experimental value. However, between 250 °C and 500 °C, the calculated conversion rate exceeds the experimental value. At this point, the value of ΔX is negative, indicating antagonistic effects between the two components [35]. The synergistic effects reappear after 500 °C. Moreover, Figure 2 shows that synergistic and antagonistic effects coexist during the combustion of OLS and HAL. Some samples exhibit more pronounced antagonistic effects. The 300–500 °C range is the primary combustion zone for co-combustion. The presence of antagonistic effects in this zone may be related to the combustion properties of the OLS and HAL themselves. OLS has a complex composition, has a low calorific value, and contains multiple heavy metal elements. During combustion, OLS forms particle agglomerates and produces a large amount of ash. This impedes oxygen diffusion and heat transfer, thereby inhibiting overall combustion [40]. Meanwhile, due to its high content of alkali and alkaline earth metals, HAL exhibits coking during combustion. This causes the surface of the blended sample to become covered, thereby reducing the contact area with oxygen and inhibiting combustion [41]. The interaction between OLS and HAL combustion varies with different blending ratios. Notably, the synergistic effect is strongest and the antagonistic effect is weakest at a 50% OLS blending ratio. In summary, both synergistic and antagonistic effects coexist during the co-combustion of OLS and HAL, with a 50% OLS blending ratio exhibiting a strong synergistic effect.

3.4. Analysis of Combustion Kinetics

This study used the Coats–Redfern method to calculate the combustion kinetic parameters of the OLS, HAL, and blending samples. Table 5 presents the reaction mechanism models under various co-combustion mixture ratios. The Coats–Redfern method is a classic non-isothermal kinetic analysis tool that focuses on precisely extracting thermal decomposition kinetic parameters through mathematical modeling [42]. Additionally, calculating the activation energy of the reaction allows one to compare the ease of combustion. A lower activation energy indicates that the combustion reaction requires fewer energy barriers to be overcome, making the reaction easier. Combining the results of the combustion kinetic analysis allows us to analyze the ease of the co-combustion reaction and the differences in overcoming energy barriers during the OLS and HAL co-combustion reactions.
The activation energy for the combustion of HAL alone is higher than that of OLS. This indicates that the combustion reaction of HAL alone requires a higher energy barrier to be overcome. This may be because the crude oil in OLS is a liquid fuel with a high volatile content. Such fuels have relatively low stability, resulting in a lower E value of 50.2. This finding is consistent with those of many scholars [10]. The activation energy for co-combustion is significantly lower than for OLS or HAL combustion individually. This suggests that the co-combustion of OLS and HAL reduces the reaction energy barrier and facilitates the combustion process [43]. As shown in Table 4, the activation energy gradually increases with an increase in the HAL mixing ratio. However, it is worth noting that the activation energy is lowest at an OLS mixing ratio of 50%. Additionally, based on previous analyses, the synergistic effect is stronger at this mixing ratio, with lower ignition and burnout temperatures. These results collectively indicate that combustion efficiency is higher at this mixing ratio. On the one hand, the low ignition point of OLS provides heat for the combustion of the high-ignition-point HAL. Conversely, the alkali metal elements carried by HAL catalyze the combustion of OLS [36,44]. Given the elevated levels of alkali metal elements present in HAL relative to coal, the activation energy derived in this study exhibits a substantial decrease compared to the values reported by other researchers for the co-combustion reaction between OLS and coal [45]. This finding serves to further substantiate the notion that the catalytic effect of alkali metals on combustion reactions is indeed advantageous to the co-combustion reaction between OLS and HAL. This outcome thereby demonstrates the considerable potential for the advancement of co-combustion technology between HAL and OLS. In summary, co-combusting OLS and HAL reduces the energy barrier of the combustion reaction, thereby facilitating its progression. Additionally, the results of the kinetic analysis indicate that the combustion reactions of all samples adhere to the discrete model. Specifically, OLS adheres to the D3 model, OLS5-HAL5 adheres to the D2 model, and the remaining samples adhere to the D1 model. These results are closely related to the complex physicochemical and chemical structures and properties of the co-combustion system. The linear regression coefficient R2 reflects how well the model fits the reaction mechanism. Therefore, a comprehensive analysis of combustion performance indicators, interactions, and kinetic analysis results shows that co-combusting OLS and HAL significantly improves the combustion performance of OLS when burned alone. It is recommended to control the OLS blending ratio at 50%.

3.5. Release Behavior for Typical Gaseous Pollutants

3.5.1. Emission Characteristics of Carbon-Containing Gaseous Pollutants

According to the results of the elemental analysis, both the OLS and the HAL contain the elements carbon (C), nitrogen (N), and sulfur (S). For substances containing these elements, typical gaseous pollutants were selected for a thermogravimetric-mass spectrometry (TG-MS) analysis during the combustion process. CO, the main product of incomplete combustion, is a typical gaseous pollutant resulting from the combustion of substances containing carbon. CO is ranked alongside CO2 as a typical pollutant generated from the combustion of C-containing substances, making it worthy of close monitoring.
Figure 3a,b depict the temperature-dependent release profiles of CO and CO2 during the combustion of different samples. An analysis of the individual combustion curves of OLS and HAL reveals that the CO release curve of OLS exhibits a single emission peak, whereas that of HAL displays a dual-peak pattern. Notably, the emission peaks of HAL are lower than those of OLS, with the release temperatures being higher, predominantly concentrated within the range of 200–600 °C. Specifically, the peak CO release temperature of OLS is 340 °C, while that of HAL is 500 °C. The overall CO release process aligns well with the combustion mass loss profiles of OLS and HAL. Overall, the CO release intensities of the co-combustion samples demonstrate significant variations. As the mixing ratio of HAL increases, the CO release interval of the co-combustion samples shifts towards higher temperature regions. Under the optimal mixing ratio of 50% OLS, determined in the previous section, the CO release curve of the co-combustion sample presents a single-peak pattern. The peak value is slightly lower than that of OLS during individual combustion, and the release interval narrows. A comprehensive analysis indicates that the CO release concentration is reduced under this mixing ratio, suggesting that the co-combustion reaction is more complete, effectively controlling the release of CO, an incomplete combustion product.
As demonstrated in Figure 3b, the release intensity of CO2 gas is approximately 10 times that of CO, indicating that CO2 is the primary carbon-containing gaseous pollutant emitted during the combustion process of the samples. The release of CO2 can also indirectly reflect the completeness of the combustion reaction. The curve demonstrates that the CO2 release intensity of HAL is significantly higher than that of OLS, which can be attributed to the higher carbon content of HAL compared to OLS [46]. The CO2 release curve generally aligns with the combustion weight loss intervals of the samples, and the peak release intensity corresponds to the peak combustion weight loss. These findings indicate the reliability of the results. In summary, the co-combustion process demonstrates a consistent pattern of increasing CO2 release with the incorporation of HAL, resulting in a single-peak release profile. The incorporation of HAL has been demonstrated to enhance the CO2 release intensity of co-combustion samples and shift the release peak temperature towards higher values. The release curves of CO and CO2 are similar to those reported by other researchers. However, the release curves of CO and CO2 from the co-combustion of OLS and low-rank coal vary with the OLS blending ratio. This finding is generally consistent with trends reported by other researchers [47]. These results further confirm the validity of the experimental data. Additionally, HAL exhibits a stronger tendency toward complete combustion.
In summary, the incorporation of HAL into OLS results in an augmentation of the release concentration of CO2, thereby inducing minor variations in the release concentration of CO. The overall release range undergoes a shift toward the high-temperature zone. At the optimal mixing ratio of 50% OLS, the release concentration of CO2 increases while the release concentration of CO decreases, indicating more complete combustion reactions.
Figure 3. (a) The release curves of CO during the combustion reaction process. (b) The release curves of CO2 during the combustion reaction process.
Sustainability 17 06703 g003

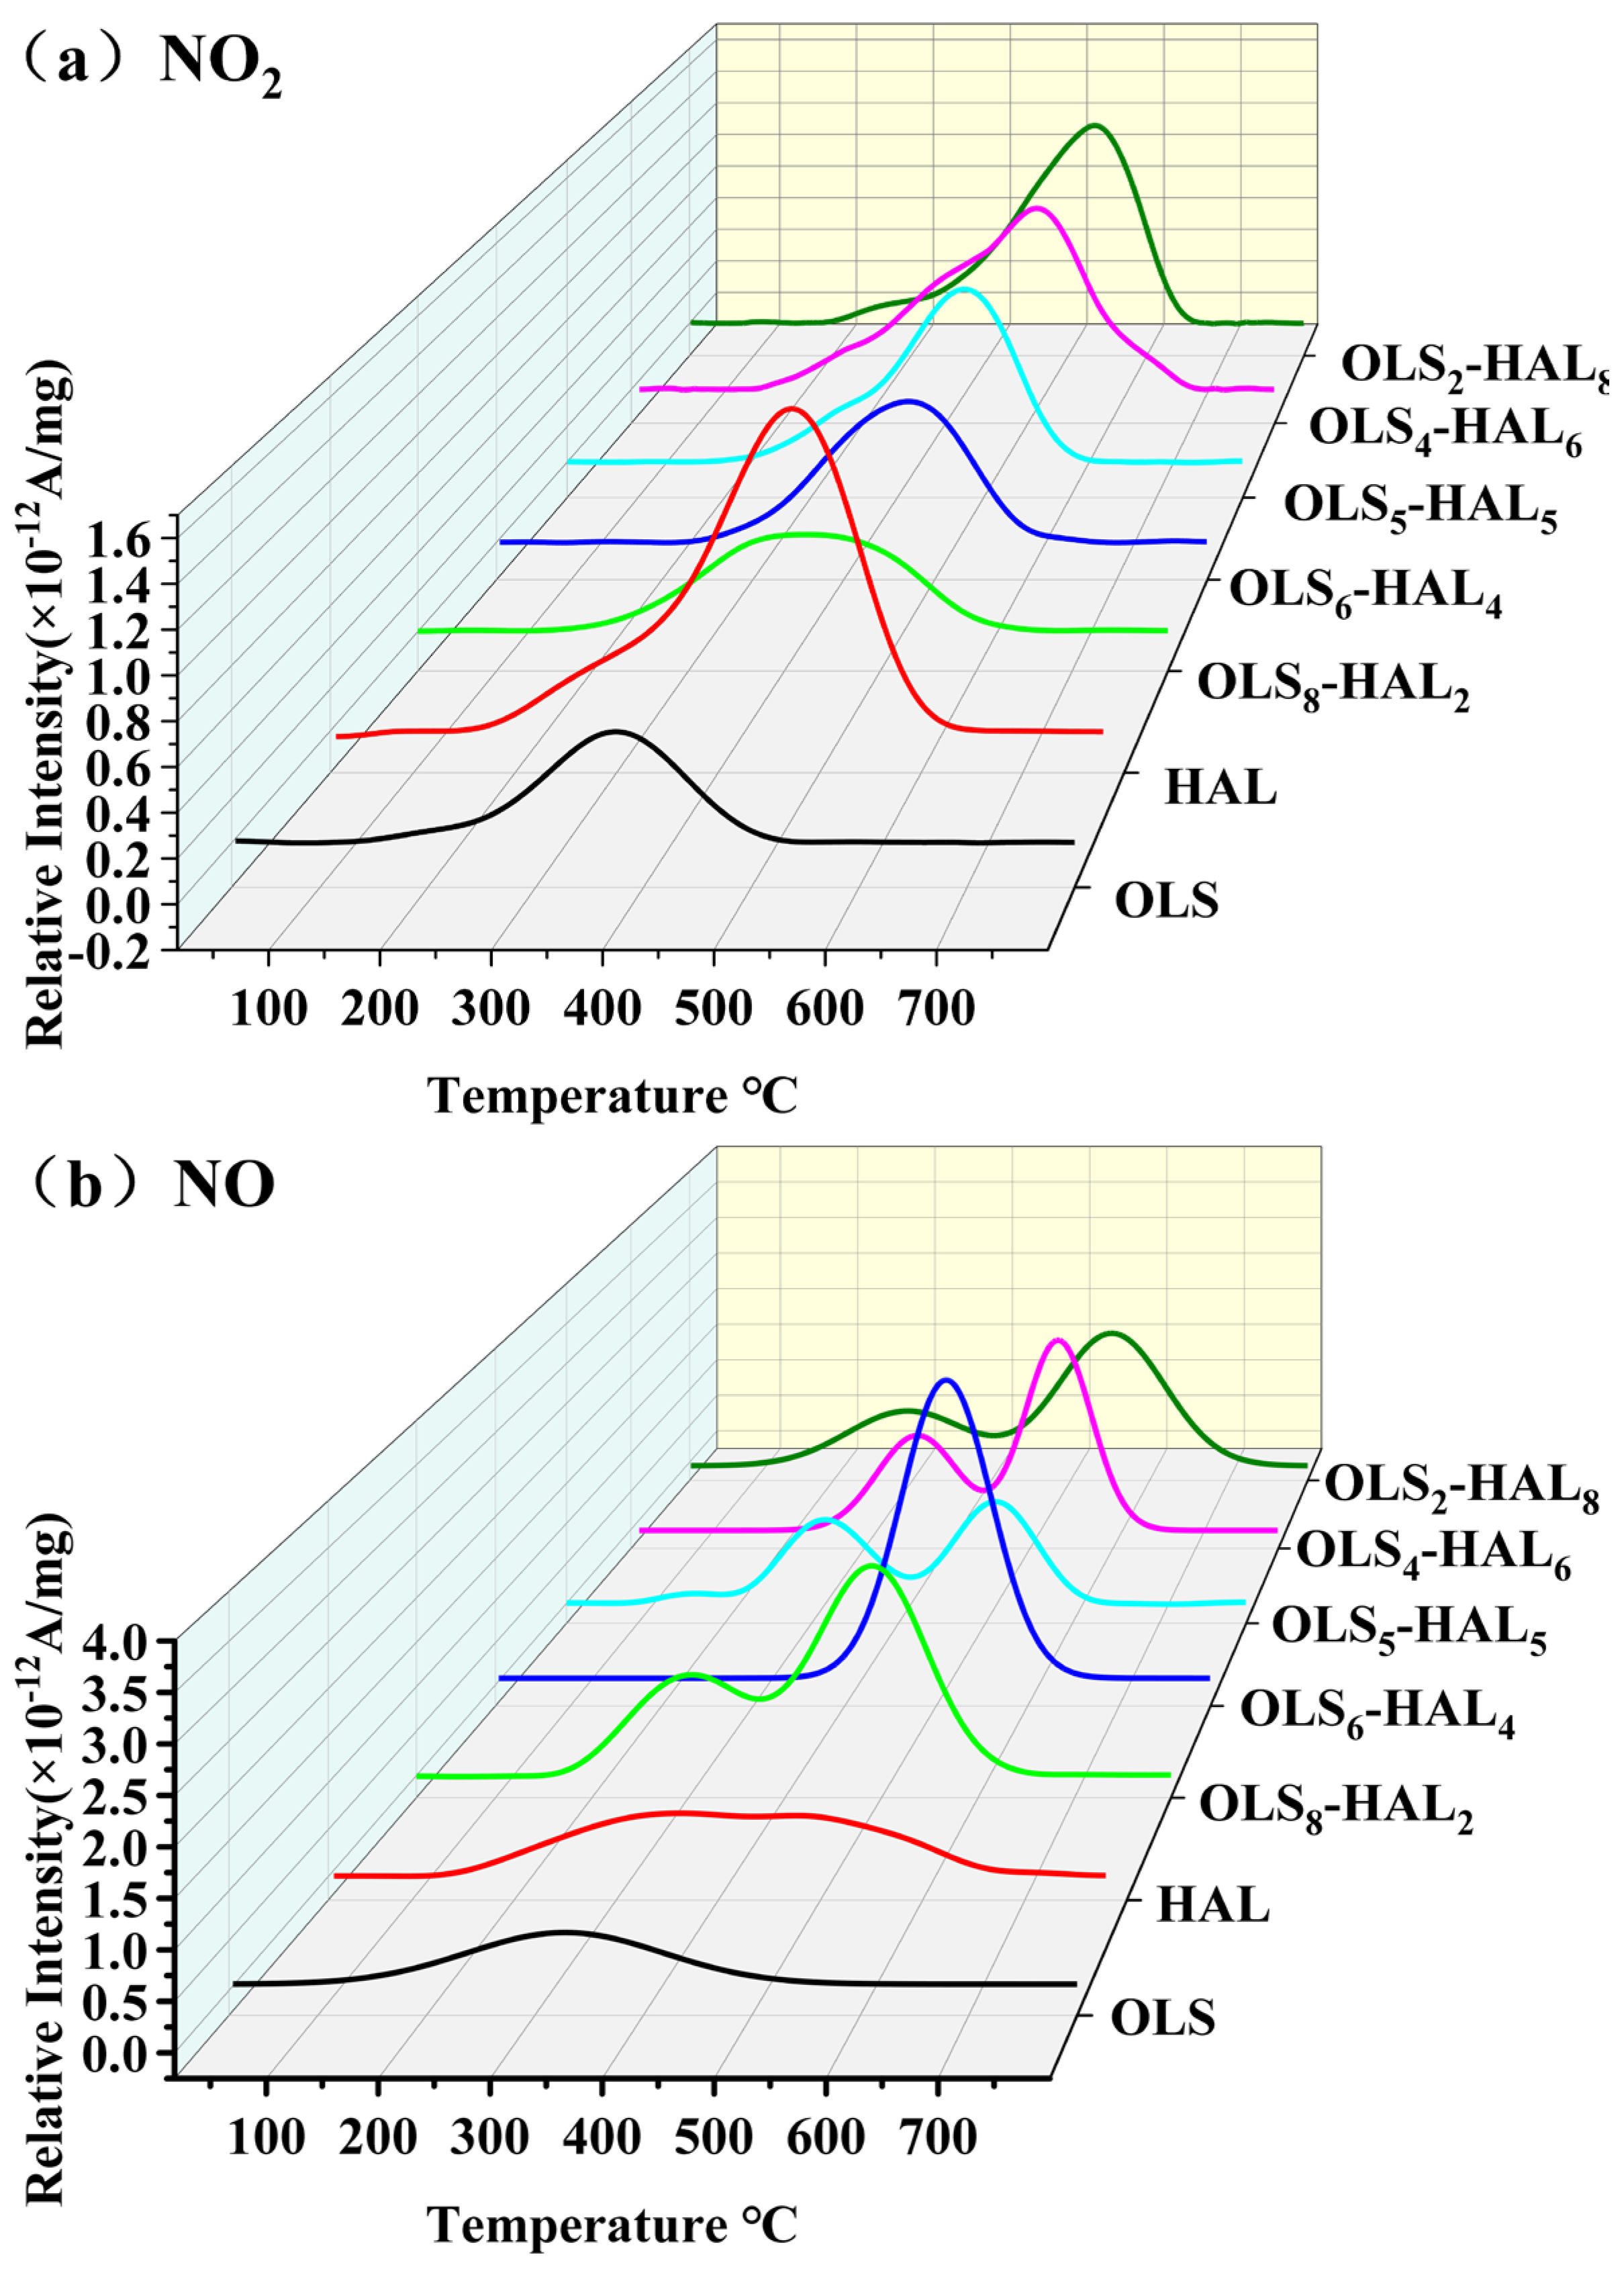
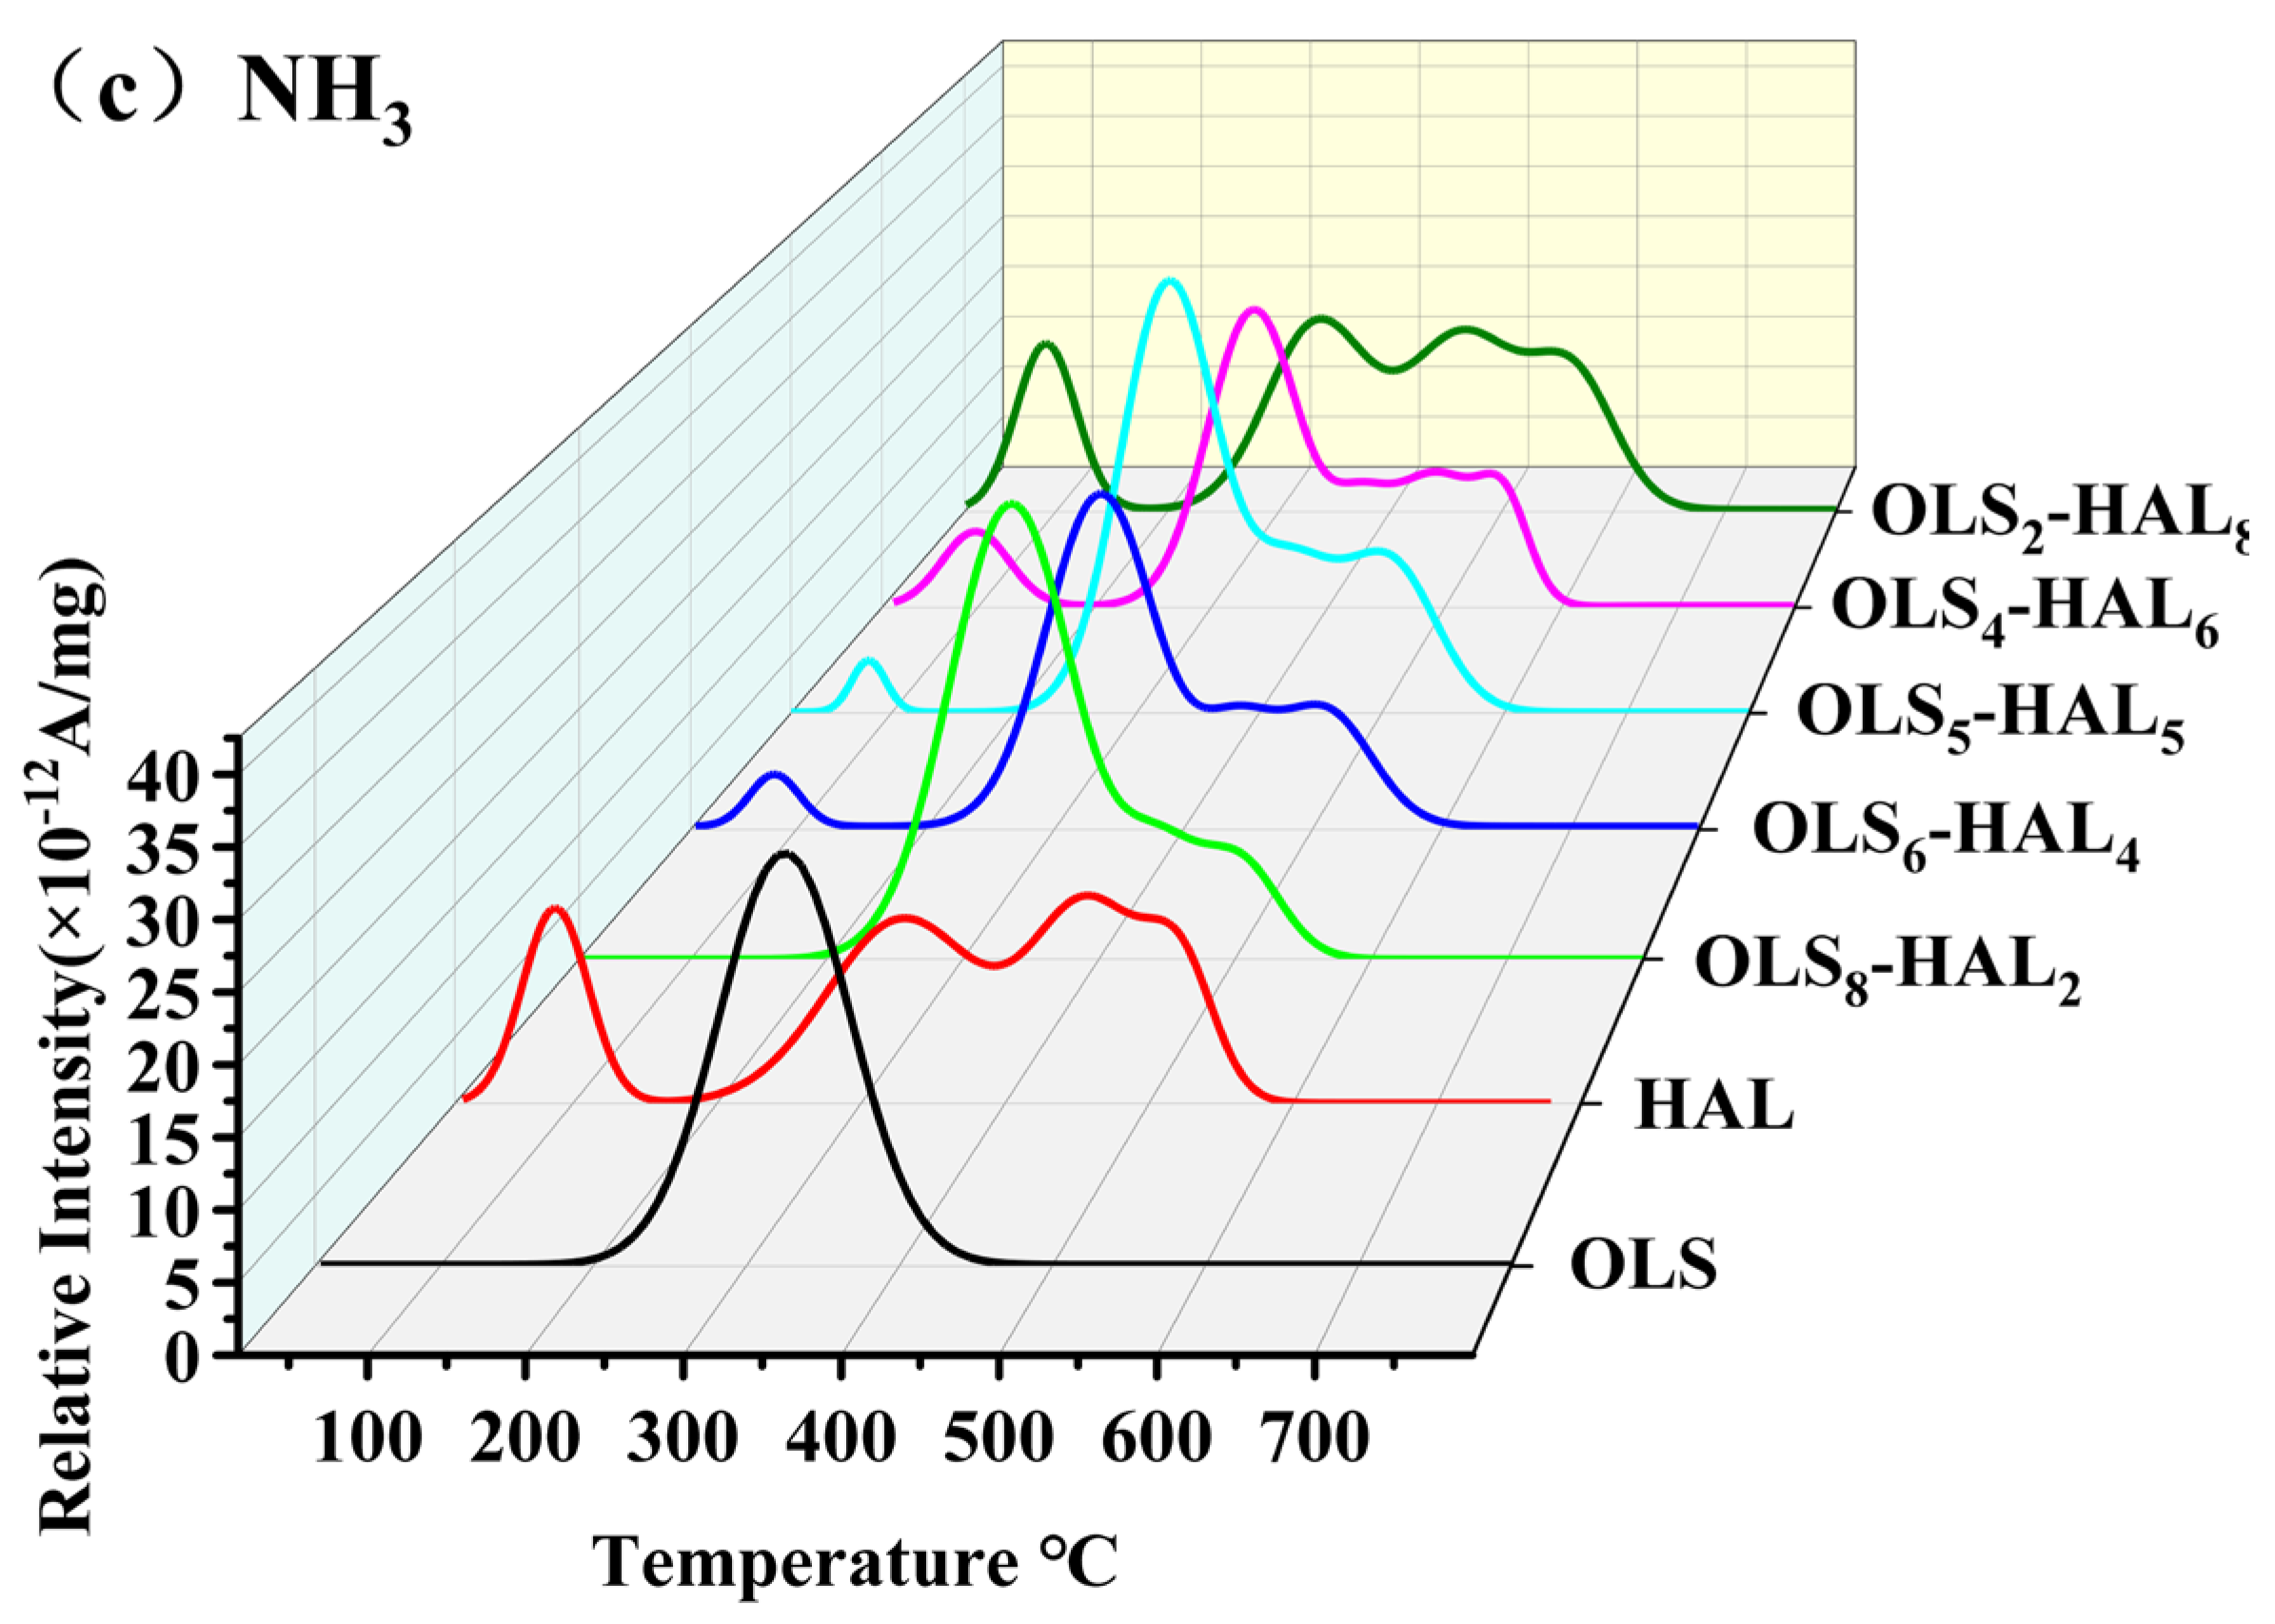
3.5.2. Emission Characteristics of Nitrogen-Containing Gaseous Pollutants

The results of the elemental analysis indicate the presence of nitrogen (N) in both OLS and HAL, albeit in trace amounts. Nitrogen oxides (NO, NO2) and sulfur dioxide (SO2) are typical gaseous pollutants that contain nitrogen. Their release characteristics necessitate close monitoring. As illustrated in Figure 4a–c, the temperature-dependent release curves for NO2, NO, and SO2 are evident.
The NO2 release curve demonstrates that emissions from OLS combustion are notably lower than those from HAL combustion. The release range for OLS combustion is 200–500 °C, whereas HAL combustion exhibits a release range of 150–600 °C, indicating a broader temperature span for HAL. During the low-temperature stage of HAL combustion, a small quantity of unstable nitrogen-containing components decomposes and burn to produce NOX. Owing to the low volatile content in HAL, the release concentration remains low at the low-temperature stage. In the high-temperature stage, the majority of stable nitrogen-containing components in HAL undergo combustion, leading to NOx release with elevated and concentrated emissions. Organic nitrogen compounds in OLS—including proteins, amines, and pyrrole/pyridine heterocyclic compounds—decompose during pyrolysis and combustion, generating intermediate products like HCN and NH3 [10]. These intermediates then undergo further oxidation to form NO and NO2. During the process of co-combustion, the release of NO2 gas exhibits a pattern of increasing concentration as the blending ratio of HAL is augmented. With the blending of HAL, the NO2 release curve of the co-combustion samples exhibits an expansion in both its breadth and height. This observation suggests that the blending of HAL results in an augmentation of the temperature range for NO2 release and an escalation in the concentration of NO2 gas released. At the optimal co-combustion blend ratio of 50% OLS, the gas release curve exhibits a pattern analogous to that of NO2 released during HAL sample combustion, and the NO2 release concentration at this point is considerably higher than that of NO2 released during OLS combustion alone. In summary, the blending of HAL has been demonstrated to enhance the NO2 concentration released during OLS combustion, while concomitantly extending the temperature range at which NO2 gas release occurs.
As demonstrated in Figure 4b, the NO gas concentrations released during the combustion of OLS and HAL are relatively low. The temperature range for NO release from HAL (150–650 °C) is significantly broader than that of OLS (150–550 °C). Furthermore, the peak area of the NO release curve for HAL samples is significantly larger than that of OLS, indicating that the amount of NO released during HAL combustion is significantly greater than that of OLS. In the co-combustion samples, the NO release peak values demonstrated a substantial increase, exhibiting two discernible release peaks at approximately 300 °C and 500 °C. A comprehensive evaluation reveals that the co-combustion of OLS and HAL leads to a substantial surge in NO gas emissions. The NO release curves of the co-combustion samples demonstrate discernible variations in response to alterations in the HAL blending ratio. The sample with the highest NO gas emissions is the OLS6-HAL4 sample, while the sample with the lowest NO emissions is the OLS5-HAL5. This particular sample has demonstrated its superior performance in the comprehensive analysis of combustion. While the NO gas release of the present sample is considerably higher than that of OLS or HAL combustion alone, it exhibits the lowest NO release among the co-combustion samples. This phenomenon may be attributed to the sample’s superior combustion performance, which leads to more complete combustion processes. Consequently, at elevated temperatures, the sample converts NO into NO2 gas [16]. In summary, the co-combustion of OLS and HAL results in an increase in NO gas emissions, with the concentration of NO emissions varying depending on the blending ratio.
Figure 4c illustrates the relationship between the concentration of NH3 gas and the temperature during combustion for each specimen. The overall release concentration of NH3 is approximately one order of magnitude higher than that of NO and NO2, indicating that NH3 is the primary gaseous pollutant containing nitrogen in co-combustion [48]. The NH3 gas release range for OLS combustion is primarily concentrated in the 200–450 °C temperature range, exhibiting a single-peak distribution with a concentrated and high peak. This indicates that NH3 release is more significant during this period. The release curve for NH3 in the context of HAL combustion is more intricate, encompassing a low-temperature region (30–150 °C) and a high-temperature region (200–600 °C). The release peak in the low-temperature region may be attributed to the thermal decomposition of nitrogen-containing substances during heating, resulting in the production of NH3 gas. The low volatile matter content results in a comparatively low concentration of NH3 gas released in the low-temperature region. In the high-temperature region, the release of NH3 gas occurs due to the thermal combustion of nitrogen-containing substances and their reaction with hydrogen (H) elements. During the process of co-combustion, the blending of HAL in the low-temperature region results in a gradual escalation in the release of NH3. This observation suggests that the release of NH3 gas in the low-temperature region is attributable to the thermal decomposition of HAL. In the elevated-temperature domain, the emission of NH3 demonstrates variability; nevertheless, in general, the release range shifts toward the high-temperature domain, and the release concentration increases. The optimal co-combustion blend ratio sample OLS5-HAL5 demonstrates the highest peak intensity in the high-temperature region and the largest overall peak area during combustion, indicating that the NH3 gas release concentration is maximized at this blend ratio. The blending of HAL leads to an augmentation in the release of NH3 gas during OLS combustion, thereby shifting the release temperature range towards higher temperatures. This, in turn, results in an enhancement of overall release variability.
In order to address the issue of increased emissions of nitrogen-containing gas pollutants, it is recommended that a staged combustion method be adopted. The release of nitrogen-containing gases can be significantly reduced by optimizing the air–fuel ratio and temperature in the rich and lean fuel zones [49]. Moreover, the above analysis has identified the emission ranges of nitrogen-containing gas pollutants at different ratios. This approach facilitates the targeted regulation of nitrogen-containing gas emissions within temperature ranges where emissions are substantial, thereby providing a foundational framework for future studies on the control of pollutants.
In summary, the blending of HAL has been demonstrated to enhance the release of nitrogen-containing gaseous pollutants during OLS combustion. The primary gaseous pollutants are NH3 and NO2, for which release increases with the HAL blending ratio. However, NO and NH3 demonstrate divergent trends. The findings of this study indicate the heightened release of conventional nitrogen-containing gaseous pollutants, necessitating meticulous scrutiny of their emission and regulation during OLS and HAL co-combustion processes.

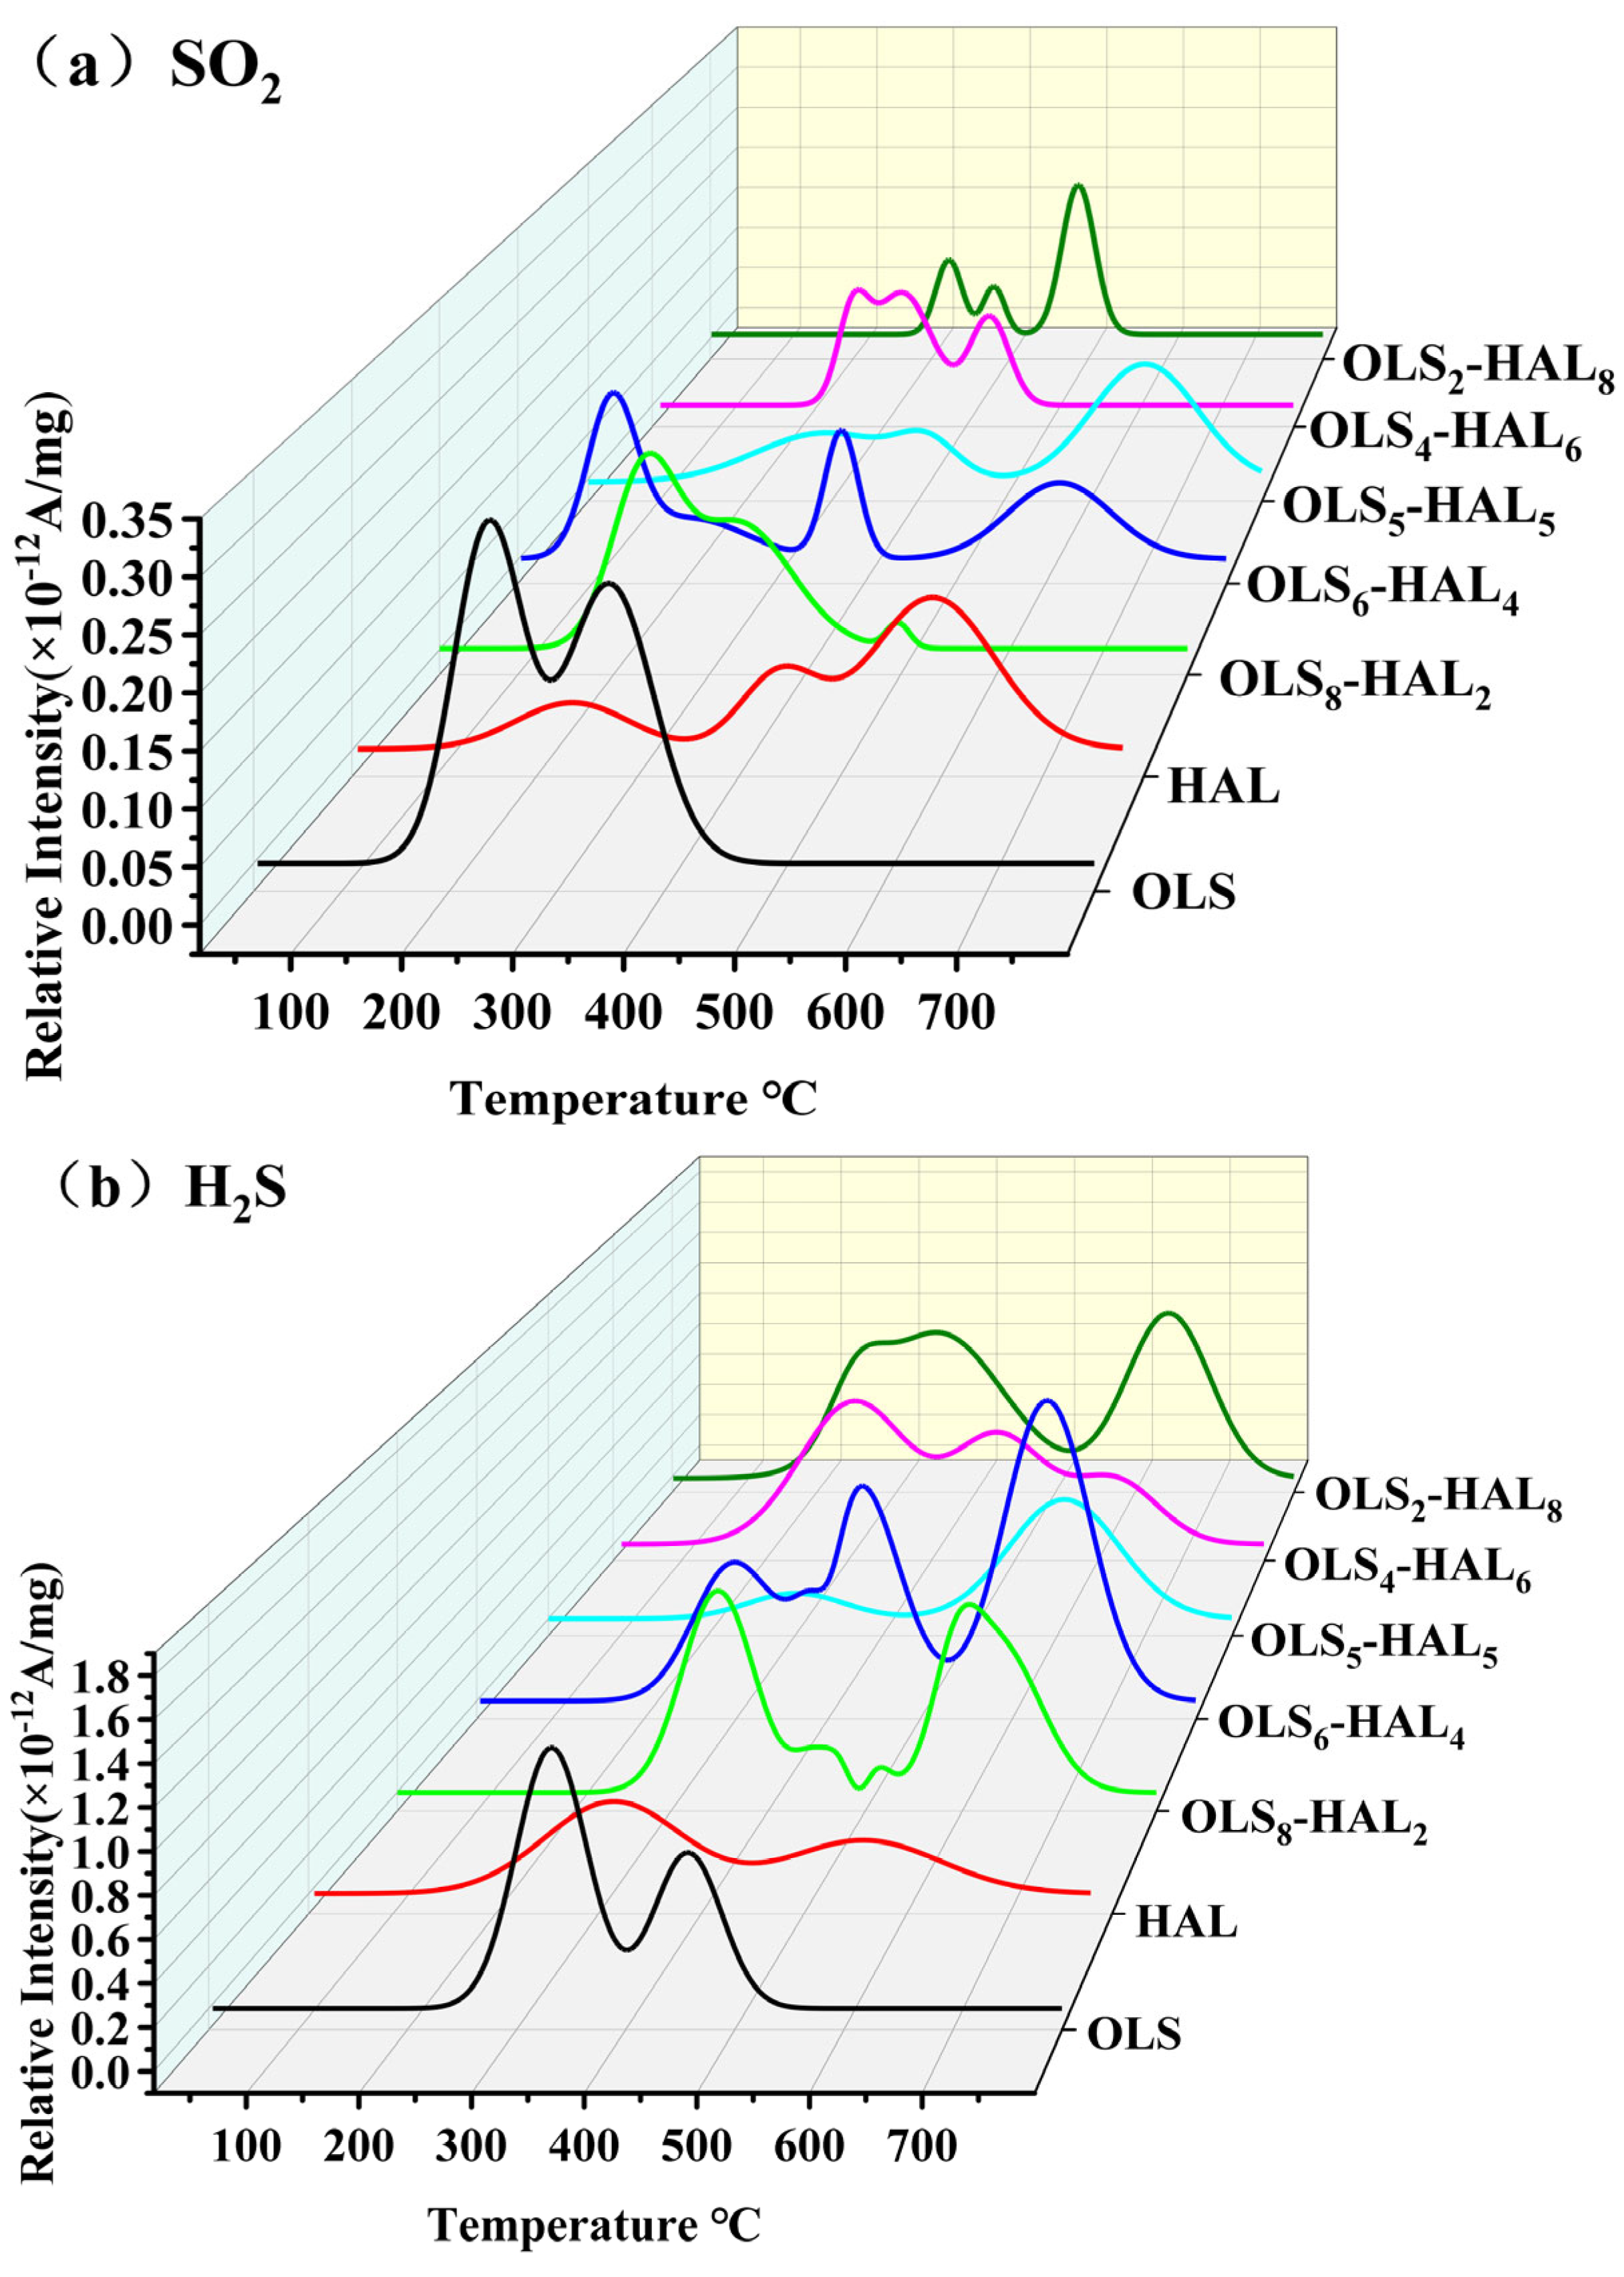
3.5.3. Emission Characteristics of Sulfur-Containing Gaseous Pollutants

As illustrated in Figure 5a, the release of SO2 during co-combustion is evident. The release of SO2 in OLS is relatively simple, exhibiting a bimodal distribution within the temperature range of 150–450 °C. In the low-temperature region (150–300 °C), the release concentration is relatively high, but its relative ionic activity intensity is 1–2 orders of magnitude lower than that of other gases. This finding suggests that, despite the release of SO2 gas, the overall magnitude of its release is relatively negligible. The release of SO2 during HAL combustion is primarily divided into three stages, with SO2 gas release occurring across the 100–700 °C temperature range, primarily concentrated in the 500–700 °C range, synchronized with the oxidation and decomposition of metallic sulfur. This observation suggests that the release of SO2 during HAL combustion is predominantly attributable to the oxidation and decomposition of sulfur present within HAL, leading to the formation of SO2 [50]. In the context of co-combustion, the release of SO2 is characterized by a more intricate pattern, exhibiting irregular fluctuations contingent on the varying proportions of HAL blended. The release pattern exhibited under optimal co-combustion performance blend ratio conditions (i.e., OLS blend ratio of 50%) demonstrated similarity to that of SO2 release during HAL combustion. The release levels exhibited relatively low values, ranging from 120 to 500 °C, with a primary concentration from 500 to 800 °C. At this blend ratio, the combustion completion temperature of the co-combustion sample is 620 °C. A thorough examination of the combustion completion temperature and release curve discloses that the SO2 release curve shifts towards the high-temperature region at this blend ratio, with a portion of it exceeding the combustion completion temperature. This outcome leads to a reduction in SO2 release in comparison to OLS combustion alone at this blend ratio.
Figure 5b presents the H2S release curve for the co-combustion sample. When OLS is burned in isolation, the H2S release pattern is analogous to that of SO2, with a release range of 230–530 °C and a bimodal distribution. The H2S release range is concentrated in the lower temperature range, and the H2S release concentration is approximately one order of magnitude higher than that of SO2, indicating that H2S is the primary sulfur-containing gaseous pollutant. When subjected to thermal degradation in isolation, the release temperature range of HAL is relatively extensive, ranging from 180 to 800 degrees Celsius. Within this temperature range, the H2S release curve exhibits minimal variation, suggesting that H2S release is negligible during HAL combustion. The release of H2S occurs in two primary stages during the process of co-combustion. As the HAL blending ratio changes, the H2S release curve demonstrates a similar complex variability as SO2. In the release curve of the optimal co-combustion blend ratio sample OLS5-HAL5, the initial stage occurs between 300 and 450 °C, with a relatively flat release peak, indicating that H2S release is minimal at this stage, primarily concentrated between 450 and 800 °C. This phenomenon can be attributed to the high metal oxide content (e.g., CaO and Fe2O3) present in the ash of HAL. These metal oxides possess the capacity to adsorb H2S at elevated temperatures, thereby converting it into stable sulfides (e.g., CaS). This process serves to mitigate the release of H2S gas during the initial stage of combustion [51]. In the second stage, the decomposition of sulfides, such as CaS, occurs at elevated temperatures, resulting in the production of gases, including H2S and SO2. It has been observed that the reaction rate increases in proportion to the increase in temperature [52]. Furthermore, research has demonstrated that at temperatures exceeding 600 °C, CO2 functions as an effective oxidizing agent for sulfides, thereby expediting the release of H2S and SO2 gases [53]. The analysis of the H2S release volume in relation to combustion temperature has been demonstrated to facilitate the effective control of H2S release within this blend ratio. In summary, the blending of HAL into OLS combustion processes has been demonstrated to result in a significant reduction in the emission of gaseous pollutants containing sulfur elements. However, given the significant hazard posed by these gaseous pollutants, their control should be emphatically considered in co-combustion processes.

4. Conclusions

This study uncovers the intrinsic synergistic mechanisms between OLS and HAL during co-combustion, providing a sustainable pathway for optimizing fuel blending ratios for efficient energy recovery from hazardous OLS and underutilized HAL. The findings lay a theoretical basis for the development of environmentally benign and energy-efficient co-combustion systems, thereby contributing to the sustainable management of waste and the utilization of resources in the petroleum and coal industries. The key conclusions are as follows:
The co-combustion of OLS and HAL significantly enhances the combustion performance compared to individual fuel combustion. The optimal blend ratio of 50% OLS reduces the ignition temperature (324.65 °C) and burnout temperature (620.31 °C) while also increasing the comprehensive combustion index S (0.754 × 10⁻⁷), thereby demonstrating superior combustion efficiency and stability.
An interaction analysis reveals the complex interplay of synergistic and antagonistic effects during co-combustion. The peak synergistic effect occurs at a 50% blend of OLS, which is attributed to the complementary fuel properties of the OLS: its high volatile content facilitates ignition, while the alkali/alkaline earth metals in the HAL catalyze the combustion of the OLS hydrocarbons. This synergy minimizes the apparent activation energy to 32.5 kJ/mol (D2 diffusion model), indicating lowered reaction barriers.
Co-combustion at a 50% OLS blend reduces incomplete combustion products while increasing CO2, indicating a more complete reaction. Notably, sulfur-containing pollutants (SO2, H2S) are effectively suppressed, likely due to the adsorption and conversion of alkali metals in HAL. Conversely, nitrogen-containing emissions (NH3, NO2) increase, though they remain within controllable limits. The enhanced combustion completeness at 50% OLS promotes the oxidation of NO to NO2, resulting in the lowest NO release among the blends and providing a feasible basis for pollutant mitigation strategies.
Limitations: This study is based primarily on a TG-MS analysis under controlled laboratory conditions, which may not fully replicate the complex dynamics of industrial-scale combustion systems (e.g., fluidized beds and boilers), where factors such as the heat/mass transfer efficiency and ash deposition behavior could affect the performance of combustion and the emission of pollutants.

Supplementary Materials

The following supporting information can be downloaded at: https://www.mdpi.com/article/10.3390/su17156703/s1, Figure S1: Fitted curves of kinetics at each stage from the Coats-Redfern method. Table S1: Optimal mechanism function model for combustion reactions. References [54,55,56] are citied in the Supplementary Materials.

Author Contributions

Conceptualization, Y.G.; Methodology, Y.G. and Y.Z.; Software, D.W., P.Z., M.L. and S.Y.; Validation, P.Z. and Y.Z.; Formal analysis, J.Z. and D.W.; Investigation, J.Z.; Resources, D.W. and Y.Z.; Data curation, J.Z.; Writing—original draft, J.Z.; Writing—review & editing, Y.G. and Y.Z.; Visualization, M.L.; Supervision, Y.G.; Project administration, S.Y.; Funding acquisition, Y.G. All authors have read and agreed to the published version of the manuscript.

Funding

This research was funded by the Dongying Science Development Fund (DJB2023035).

Institutional Review Board Statement

Not applicable.

Informed Consent Statement

Not applicable.

Data Availability Statement

The original contributions presented in this study are included in the article/Supplementary Materials. Further inquiries can be directed to the corresponding authors.

Conflicts of Interest

The authors declare no conflict of interest.

References

  1. Liu, W.; Nie, C.; Li, W.; Ao, Z.; Wang, S.; An, T. Oily sludge derived carbons as peroxymonosulfate activators for removing aqueous organic pollutants: Performances and the key role of carbonyl groups in electron-transfer mechanism. J. Hazard. Mater. 2021, 414, 125552. [Google Scholar] [CrossRef] [PubMed]
  2. Hu, G.; Li, J.; Zeng, G. Recent development in the treatment of oily sludge from petroleum industry: A review. J. Hazard. Mater. 2013, 261, 470–490. [Google Scholar] [CrossRef] [PubMed]
  3. Wang, Y.; Zhao, J.; Liu, X.; Tang, X.; Li, T.; Zhu, Y. Optimization and mechanism of oily sludge treatment by a synergistic approach of high-speed stirring cleaning integrated with thermal-activated Na2S2O8 oxidation. J. Environ. Manag. 2025, 381, 125230. [Google Scholar] [CrossRef] [PubMed]
  4. Zhang, X.; Yang, J.; He, C.; Tian, Y.; He, L.; Sui, H.; Li, X. Universal low-carbon strategy for deep-resourcilization of industrial oily sludges. J. Clean. Prod. 2025, 496, 145097. [Google Scholar] [CrossRef]
  5. Xia, P.; Jing, S.; Zhao, Z.; Dou, T.; Gao, J.; Guo, Z.; Xu, L.; Guo, H.; Zhang, M.; Qiao, W. Enhancement of dewatering performance and effective degradation of petroleum hydrocarbons in biological oily sludge using atmospheric pressure plasma jet. Bioresour. Technol. 2025, 418, 131974. [Google Scholar] [CrossRef] [PubMed]
  6. Nie, H.; Chen, L.; Zhang, Q.; Guo, D.; Yin, Q.; Nie, M.; Wang, L.; Guo, Y. Study on the bacteria consortium for treating tank cleaning oily sludge and its synergistic degradation mechanism. J. Environ. Chem. Eng. 2023, 11, 110803. [Google Scholar] [CrossRef]
  7. Teng, Q.; Zhang, D.; Yang, C. A review of the application of different treatment processes for oily sludge. Environ. Sci. Pollut. Res. 2021, 28, 121–132. [Google Scholar] [CrossRef] [PubMed]
  8. Gou, X.; Zheng, G.; Tang, J.; Tao, C.; Liu, R.; Liu, Z. Electric field efficiently enhanced thermochemical cleaning for oil recovery from oily sludge. Chem. Eng. Process.-Process Intensif. 2023, 185, 109314. [Google Scholar] [CrossRef]
  9. Chen, Z.; Zheng, Z.; He, C.; Liu, J.; Zhang, R.; Chen, Q. Oily sludge treatment in subcritical and supercritical water: A review. J. Hazard. Mater. 2022, 433, 128761. [Google Scholar] [CrossRef] [PubMed]
  10. Ma, W.; Lv, Y.; Li, S.; He, C.; Gong, Z.; Wen, X.; Dan, J.; Li, X. Study on thermal behavior and gas pollutant emission control during the co-combustion of waste tire-modified oily sludge and coal. Fuel 2025, 391, 134758. [Google Scholar] [CrossRef]
  11. Yu, H.; Li, J.; Lin, F.; Zeng, M.; Li, R.; Yan, B.; Chen, G. Pyrolysis/combustion potential and heavy metal risk of oily sludge and derived products in industrial scale. Fuel 2023, 344, 128044. [Google Scholar] [CrossRef]
  12. Chen, H.; Wang, X.; Liang, H.; Chen, B.; Liu, Y.; Ma, Z.; Wang, Z. Characterization and treatment of oily sludge: A systematic review. Environ. Pollut. 2024, 344, 123245. [Google Scholar] [CrossRef] [PubMed]
  13. Xu, J.; Huang, Q.; Wang, F. Co-combustion of municipal solid waste and coal for carbon emission reduction: A bi-level multi-objective programming approach. J. Clean. Prod. 2020, 272, 121923. [Google Scholar] [CrossRef]
  14. Liu, L.; Memon, M.Z.; Xie, Y.; Gao, S.; Guo, Y.; Dong, J.; Gao, Y.; Li, A.; Ji, G. Recent advances of research in coal and biomass co-firing for electricity and heat generation. Circ. Econ. 2023, 2, 100063. [Google Scholar] [CrossRef]
  15. Majeed, A.; Kanwal, S.; Batool, S.A.; Chaudhry, M.N.; Zeb, H.; Abbasi, G.H.; Malik, Z.; Munir, A. Physio-chemical evaluation and co-combustion efficiency of different biomass waste fractions with indigenous coal blends for utilization as alternative fuel. Glob. NEST J. 2022, 24, 97–104. [Google Scholar] [CrossRef]
  16. Li, X.; Li, S.; Lv, Y.; Jiang, W.; He, C.; Hou, S.; Ma, W.; Dan, J. Study on thermal behavior and gas pollutant emission control during the co-combustion of rice straw-modified oily sludge and coal. Renew. Energy 2024, 230, 120857. [Google Scholar] [CrossRef]
  17. Dong, L.; Huang, X.; Ren, J.; Deng, L.; Da, Y. Thermogravimetric assessment and differential thermal analysis of blended fuels of coal, biomass and oil sludge. Appl. Sci. 2023, 13, 11058. [Google Scholar] [CrossRef]
  18. Liu, P.; Le, J.; Zhang, D.; Wang, S.; Pan, T. Free radical reaction mechanism on improving tar yield and quality derived from lignite after hydrothermal treatment. Fuel 2017, 207, 244–252. [Google Scholar] [CrossRef]
  19. Kułażyński, M.; Jabłoński, S.; Kaczmarczyk, J.; Świątek, Ł.; Pstrowska, K.; Łukaszewicz, M. Technological aspects of sunflower biomass and brown coal co-firing. J. Energy Inst. 2018, 91, 668–675. [Google Scholar] [CrossRef]
  20. Khan, A.; Iqbal, N.; Noor, T.; Hassan, M.; Akhter, J. Synergistic production of fuels from co-pyrolysis of lignite coal and waste plastic. J. Energy Inst. 2024, 113, 101527. [Google Scholar] [CrossRef]
  21. Zhang, S.; Zhong, L.; Chen, X.; Liu, Y.; Zhai, X.; Xue, Y.; Wang, W.; Liu, J.; Xu, K. Emissions characteristics of hazardous air pollutants from the incineration of sacrificial offerings. Atmosphere 2019, 10, 332. [Google Scholar] [CrossRef]
  22. Wang, Z.; Wang, Z.; Sun, J.; Wang, Y.; Sun, Z.; Ma, K.; Wei, L. Investigation of oxygen-enriched atmosphere combustion of oily sludge: Performance, mechanism, emission of the S/N-containing compound, and residue characteristics. J. Clean. Prod. 2022, 378, 134233. [Google Scholar] [CrossRef]
  23. Sharma, A.K.; Sharma, M.; Sharma, A.K.; Sharma, M.; Sharma, M. Mapping the impact of environmental pollutants on human health and environment: A systematic review and meta-analysis. J. Geochem. Explor. 2023, 255, 107325. [Google Scholar] [CrossRef]
  24. Shetty, S.S.; Deepthi, D.; Harshitha, S.; Sonkusare, S.; Naik, P.B.; Madhyastha, H. Environmental pollutants and their effects on human health. Heliyon 2023, 9, e19496. [Google Scholar] [CrossRef] [PubMed]
  25. Zhu, T.; Shang, J.; Zhao, D. The roles of heterogeneous chemical processes in the formation of an air pollution complex and gray haze. Sci. China Chem. 2011, 54, 145–153. [Google Scholar] [CrossRef]
  26. Deng, S.; Wang, X.; Tan, H.; Mikulčić, H.; Yang, F.; Li, Z.; Duić, N. Thermogravimetric study on the co-combustion characteristics of oily sludge with plant biomass. Thermochim. Acta 2016, 633, 69–76. [Google Scholar] [CrossRef]
  27. Wang, X.; Li, S.; Adeosun, A.; Li, Y.; Vujanović, M.; Tan, H.; Duić, N. Effect of potassium-doping and oxygen concentration on soot oxidation in O2/CO2 atmosphere: A kinetics study by thermogravimetric analysis. Energy Convers. Manag. 2017, 149, 686–697. [Google Scholar] [CrossRef]
  28. Guo, Y.; Ma, C.; Zhang, Y.; Zhou, L.; Guo, Z.; Miao, Z.; Zhao, X.; Wu, J.; Guo, F. Comparative study on the structure characteristics, combustion reactivity, and potential environmental impacts of coal gasification fine slag with different particle size fractions. Fuel 2022, 311, 122493. [Google Scholar] [CrossRef]
  29. Guo, Y.; Guo, F.; Zhou, L.; Guo, Z.; Miao, Z.; Liu, H.; Zhang, X.; Wu, J.; Zhang, Y. Investigation on co-combustion of coal gasification fine slag residual carbon and sawdust char blends: Physiochemical properties, combustion characteristic and kinetic behavior. Fuel 2021, 292, 120387. [Google Scholar] [CrossRef]
  30. GB/T 212–2008; Method for Proximate Analysis of Coal. Standardization Administration of the People’s Republic of China: Beijing, China, 2008.
  31. GB/T 31391–2015; Ultimate Analysis of Coal. Standardization Administration of the People’s Republic of China: Beijing, China, 2015.
  32. GB/T 213–2008; Determination of Calorific Value of Coal. Standardization Administration of the People’s Republic of China: Beijing, China, 2008.
  33. ASTM D4326–2013; Standard Test Method for Major and Minor Elements in Coal and Coke by X-Ray Fluorescence. American Society for Testing and Materials (ASTM): West Conshohocken, PA, USA, 2013.
  34. ASTM D3174–12; Standard Test Method for Ash in Analysis Samples of Coal and Coke. American Society for Testing and Materials (ASTM): West Conshohocken, PA, USA, 2012.
  35. Liu, X.; Hu, J.; Zhao, S.; Wang, W.; Zhang, Q.; Yan, X. Chemical looping co-gasification of wheat straw and lignite with calcium-enhanced iron-based oxygen carrier for syngas production. Fuel Process. Technol. 2022, 227, 107108. [Google Scholar] [CrossRef]
  36. Guo, Y.; Wang, D.; Liu, X.; Wu, J.; Guo, F.; Zhang, Y.; Yuan, S.; Du, C.; Lin, M.; Liu, J. Insights into the co-combustion attributes and mutual effects of high-alkali lignite and flotation carbon-rich fractions from coal gasification fine slag. Results Eng. 2025, 26, 105310. [Google Scholar] [CrossRef]
  37. Guo, Y.; Wu, J.; Guo, F.; Zhang, Y.; Yuan, S.; Du, C.; Chen, J.; Lin, M. Recycling of flotation residual carbon from coal gasification fine slag through thermal combustion reaction: Insight into the spatial and temporal multi-scale evolution of typical heavy metals. Fuel 2025, 381, 133378. [Google Scholar] [CrossRef]
  38. Cheng, S.; Takahashi, F.; Gao, N.; Yoshikawa, K.; Li, A. Evaluation of oil sludge ash as a solid heat carrier in the pyrolysis process of oil sludge for oil production. Energy Fuels 2016, 30, 5970–5979. [Google Scholar] [CrossRef]
  39. Baqain, M.; Neshumayev, D.; Konist, A. TG-MS analysis and kinetic study of co-combustion of ca-rich oil shale with biomass in air and oxy-like conditions. Carbon Capture Sci. Technol. 2024, 10, 100162. [Google Scholar] [CrossRef]
  40. Liu, C.; Gong, Z.; Zhang, H.; Wang, Z.; Chu, Z.; Liu, L.; Li, X.; Guo, Y.; Zhang, J.; Li, G.; et al. Combustion characteristics and kinetic analysis of oil sludge with CaO additive. J. Environ. Sci. Health Part A 2021, 56, 937–945. [Google Scholar] [CrossRef] [PubMed]
  41. Dai, B.-Q.; Wu, X.; De Girolamo, A.; Zhang, L. Inhibition of lignite ash slagging and fouling upon the use of a silica-based additive in an industrial pulverised coal-fired boiler. Part 1. Changes on the properties of ash deposits along the furnace. Fuel 2015, 139, 720–732. [Google Scholar] [CrossRef]
  42. Nounou, R.S.A.; Shaban, I.A.; Labeeb Ali Altarawneh, M.; Elgendi, M. Kinetic and thermodynamic analysis of the PET-date seed mixture co-pyrolysis using coats-redfern method. Renew. Energy 2024, 237, 121524. [Google Scholar] [CrossRef]
  43. Raza, M.; Abu-Jdayil, B.; Al-Marzouqi, A.H.; Inayat, A. Kinetic and thermodynamic analyses of date palm surface fibers pyrolysis using coats-redfern method. Renew. Energy 2022, 183, 67–77. [Google Scholar] [CrossRef]
  44. Guo, Y.; Wu, J.; Jia, W.; Guo, F.; Qiu, G.; Wang, R.; Zhang, Y.; Dai, B. Evaluation of the thermal behavior, synergistic catalysis, and pollutant emissions during the co-combustion of sewage sludge and coal gasification fine slag residual carbon. Catalysts 2021, 11, 1142. [Google Scholar] [CrossRef]
  45. Zou, H.; Liu, C.; Evrendilek, F.; He, Y.; Liu, J. Evaluation of reaction mechanisms and emissions of oily sludge and coal co-combustions in O2/CO2 and O2/N2 atmospheres. Renew. Energy 2021, 171, 1327–1343. [Google Scholar] [CrossRef]
  46. Mohsin, I.U.; Hofmann, A.; Ziebert, C. Exploring the reactivity of Na3V2(PO4)3/C and hard carbon electrodes in sodium-ion batteries at various charge states. Electrochim. Acta 2024, 487, 144197. [Google Scholar] [CrossRef]
  47. Zhao, R.; Qin, J.; Chen, T.; Wang, L.; Wu, J. Experimental study on co-combustion of low rank coal semicoke and oil sludge by TG-FTIR. Waste Manag. 2020, 116, 91–99. [Google Scholar] [CrossRef] [PubMed]
  48. Huang, Y.; Chang, K.; Yao, J.; Guo, X.; Shen, C.; Yan, S. Effect of fluoroalcohol chain extension modified HTPB binder on the combustion performance of aluminized propellants. Crystals 2024, 14, 258. [Google Scholar] [CrossRef]
  49. Dai, M.; Gu, B.; Su, P.; Zhou, Y.; Meng, Q.; Li, D.; Zhu, M.; Chun, T. Examining low nitrogen oxides combustion in iron ore sintering: Utilization of reductants. Renew. Sustain. Energy Rev. 2024, 205, 114864. [Google Scholar] [CrossRef]
  50. Chen, G.; Li, J.; Li, K.; Lin, F.; Tian, W.; Che, L.; Yan, B.; Ma, W.; Song, Y. Nitrogen, sulfur, chlorine containing pollutants releasing characteristics during pyrolysis and combustion of oily sludge. Fuel 2020, 273, 117772. [Google Scholar] [CrossRef]
  51. Liu, H.; Yi, L.; Zhang, Q.; Hu, H.; Lu, G.; Li, A.; Yao, H. Co-production of clean syngas and ash adsorbent during sewage sludge gasification: Synergistic effect of Fenton peroxidation and CaO conditioning. Appl. Energy 2016, 179, 1062–1068. [Google Scholar] [CrossRef]
  52. Ng, K.H.; Liew, S.C.; Zhang, S. Thermodynamic analysis of CaS production from various Ca-based precursors: A prequel to SO2 reduction mediated by CaS/CaSO4 redox agents. Process Saf. Environ. Prot. 2021, 147, 900–911. [Google Scholar] [CrossRef]
  53. Garcıía-Calzada, M.; Marbán, G.; Fuertes, A.B. Decomposition of CaS particles at ambient conditions. Chem. Eng. Sci. 2000, 55, 1661–1674. [Google Scholar] [CrossRef]
  54. Sbirrazzuoli, N. Kinetic analysis of complex chemical reactions by coupling model-free and model-fitting analysis. Thermochim. Acta 2023, 719, 179416. [Google Scholar] [CrossRef]
  55. Qin, C.; Dang, M.; Meng, Y.; Zhao, D. Fusion calorimetric experiments and QSPR modeling to inversely explore the accuracy of thermodynamic methods: A case study of the apparent activation energies of 18 aromatic nitro compounds. Process Saf. Environ. Prot. 2023, 172, 659–680. [Google Scholar] [CrossRef]
  56. Li, P.; Wang, B.; Hu, J.; Zhang, Y.; Chen, W.; Chang, C.; Pang, S. Research on the kinetics of catalyst coke formation during biomass catalytic pyrolysis: A mini review. J. Energy Inst. 2023, 110, 101315. [Google Scholar] [CrossRef]
Figure 1. (a) TG curves for co-combustion. (b) DTG curves for co-combustion.
Sustainability 17 06703 g001
Figure 2. Interaction curve of co-combustion samples.
Sustainability 17 06703 g002
Figure 4. (a) NO2 release curves during the combustion reaction process. (b) NO release curves during the combustion reaction process. (c) NH3 release curves during the combustion reaction process.
Sustainability 17 06703 g004aSustainability 17 06703 g004b
Figure 5. (a) SO2 release curves during the combustion reaction process. (b) H2S release curves during the combustion reaction process.
Sustainability 17 06703 g005
Table 1. Sample blending ratio and naming.
SamplesOily Sludge Content (wt%)Lignite Content (wt%)
OLS1000
OLS8-HAL28020
OLS6-HAL46040
OLS5-HAL55050
OLS4-HAL64060
OLS2-HAL82080
HAL0100
Table 2. Proximate, ultimate, and high heating value analysis of samples.
SamplesProximate Analysis (wt%)Ultimate Analysis (wt%)HHV
(ad, MJ/kg)
MadAdVdFCdCdHdOdNdSd
OLS21.1053.1942.724.0935.894.4813.970.611.4316.21
HAL21.357.6438.1654.271.893.6015.550.890.4321.31
Note: M: moisture, A: ash, V: volatile matter, FC: fixed carbon, d: dry basis, ad: air dry basis.
Table 3. Chemical composition of samples.
Compositions wt%
SamplesSiO2Al2O3Fe2O3CaONa2OK2OMgOOthers
OLS24.3819.5820.6318.875.321.035.684.51
HAL17.2519.648.3823.5910.636.7511.282.48
Table 4. Combustion reaction characteristics.
SamplesTi (°C)Tf (°C)Tmax (°C)DTGmax
(%/min)
DTGmean
(%/min)
S
(×10−7, %2/(min2 °C3))
OLS238.47699.31380.812.090.920.484
OLS8-HAL2273.33667.45475.001.841.020.376
OLS6-HAL4341.63638.27491.773.111.560.651
OLS5-HAL5324.65620.31486.313.141.570.754
OLS4-HAL6357.59646.59509.093.492.020.853
OLS2-HAL8366.15607.60506.604.022.881.421
HAL370.94568.81488.315.283.872.611
Table 5. The results of kinetic parameters based on the Coats–Redfern method.
SamplesModelsy = ax + bR2E (KJ/mol)
HALD1y = −6687.8x−5.580.95855.6
OLSD3y = −6039.91x−8.960.99150.2
OLS8-HAL2D1y = −3607.69x−9.160.98530.0
OLS6-HAL4D1y = −3939.83x−8.980.97232.7
OLS5-HAL5D2y = −3912.74x−9.310.96232.5
OLS4-HAL6D1y = −4751.92x−8.170.98139.5
OLS2-HAL8D1y = −5185.07x−7.760.95343.1
Disclaimer/Publisher’s Note: The statements, opinions and data contained in all publications are solely those of the individual author(s) and contributor(s) and not of MDPI and/or the editor(s). MDPI and/or the editor(s) disclaim responsibility for any injury to people or property resulting from any ideas, methods, instructions or products referred to in the content.

