Calculation of Greenhouse Gas Emissions from Tourist Vehicles Using Mathematical Methods: A Case Study in Altai Tavan Bogd National Park
Abstract
1. Introduction
1.1. International Approaches to Estimating GHG Emissions from Vehicles
1.2. Limitations of Existing Methods for Remote Regions
- -
- Tier 1: Estimates based on total national fuel use;
- -
- Tier 2: accounts for fuel/vehicle types and technology;
- -
- Tier 3: uses highly detailed operational data.
1.3. Field-Based Studies on GHG Emissions and Tourism in Altai Tavan Bogd National Park
2. Materials and Methods
2.1. Research Data Collection
2.2. Field Research Expeditions
2.3. Route Segmentation and Elevation Profiling
2.4. Vehicle Categories
- -
- UAZ-3909 (44.5%);
- -
- UAZ-315108 (7.4%);
- -
- Medium-sized SUVs (44.1%, with 70% being the Toyota Land Cruiser 200);
- -
- Sedans (2.2–3.6 L), mostly Toyota Prius 30 (78%);
- -
- Large trucks, mostly ZIL-131.
2.5. Fuel Consumption Estimation
2.6. Methodology Development for Emission Estimation
2.7. GHG Emissions Calculation
- -
- Gasoline: 2.33969 kg CO2 per liter, CH4 = 0.38 g, N2O = 0.08 g;
- -
- Diesel: 2.70553 kg CO2 per liter.
3. Results
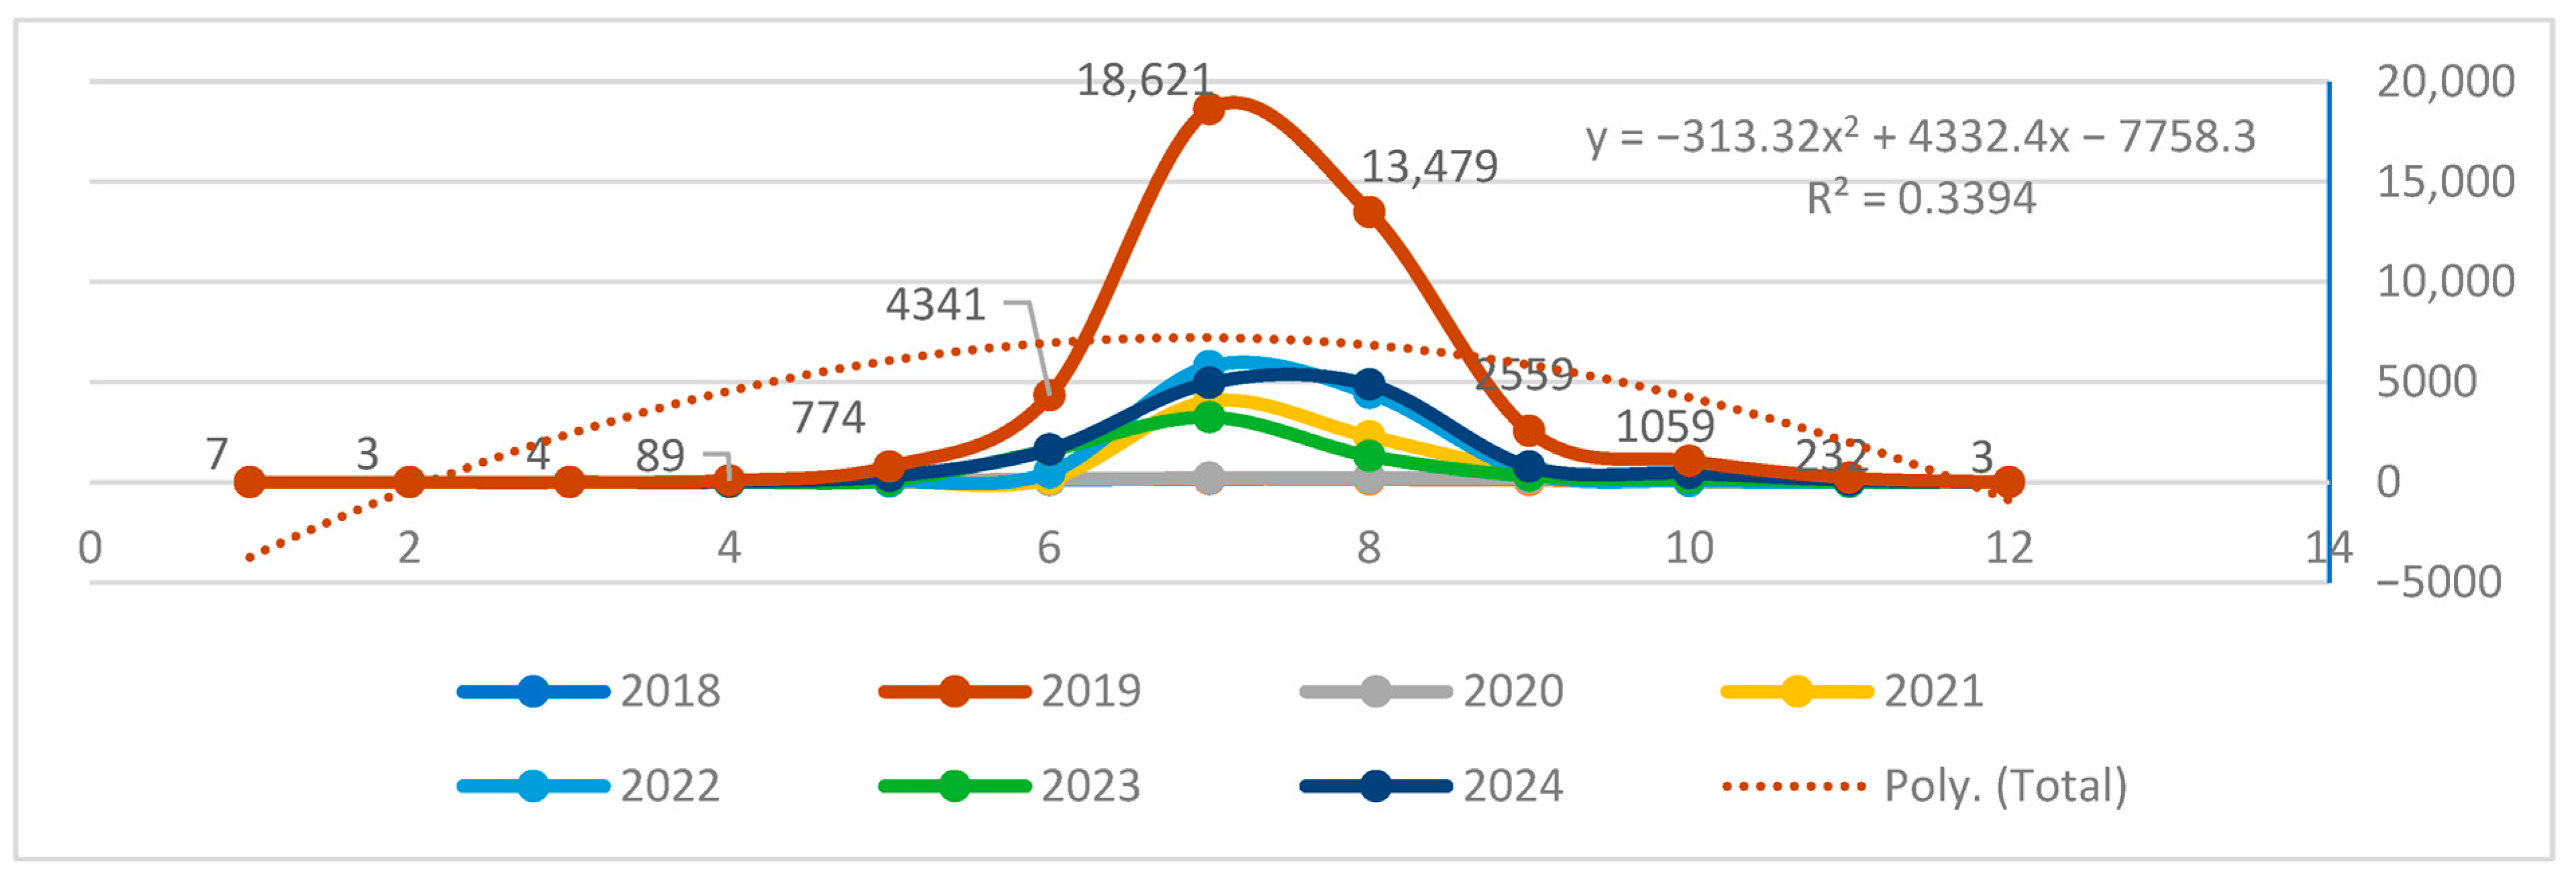
3.1. Tourism and Route Features in Altai Tavan Bogd National Park
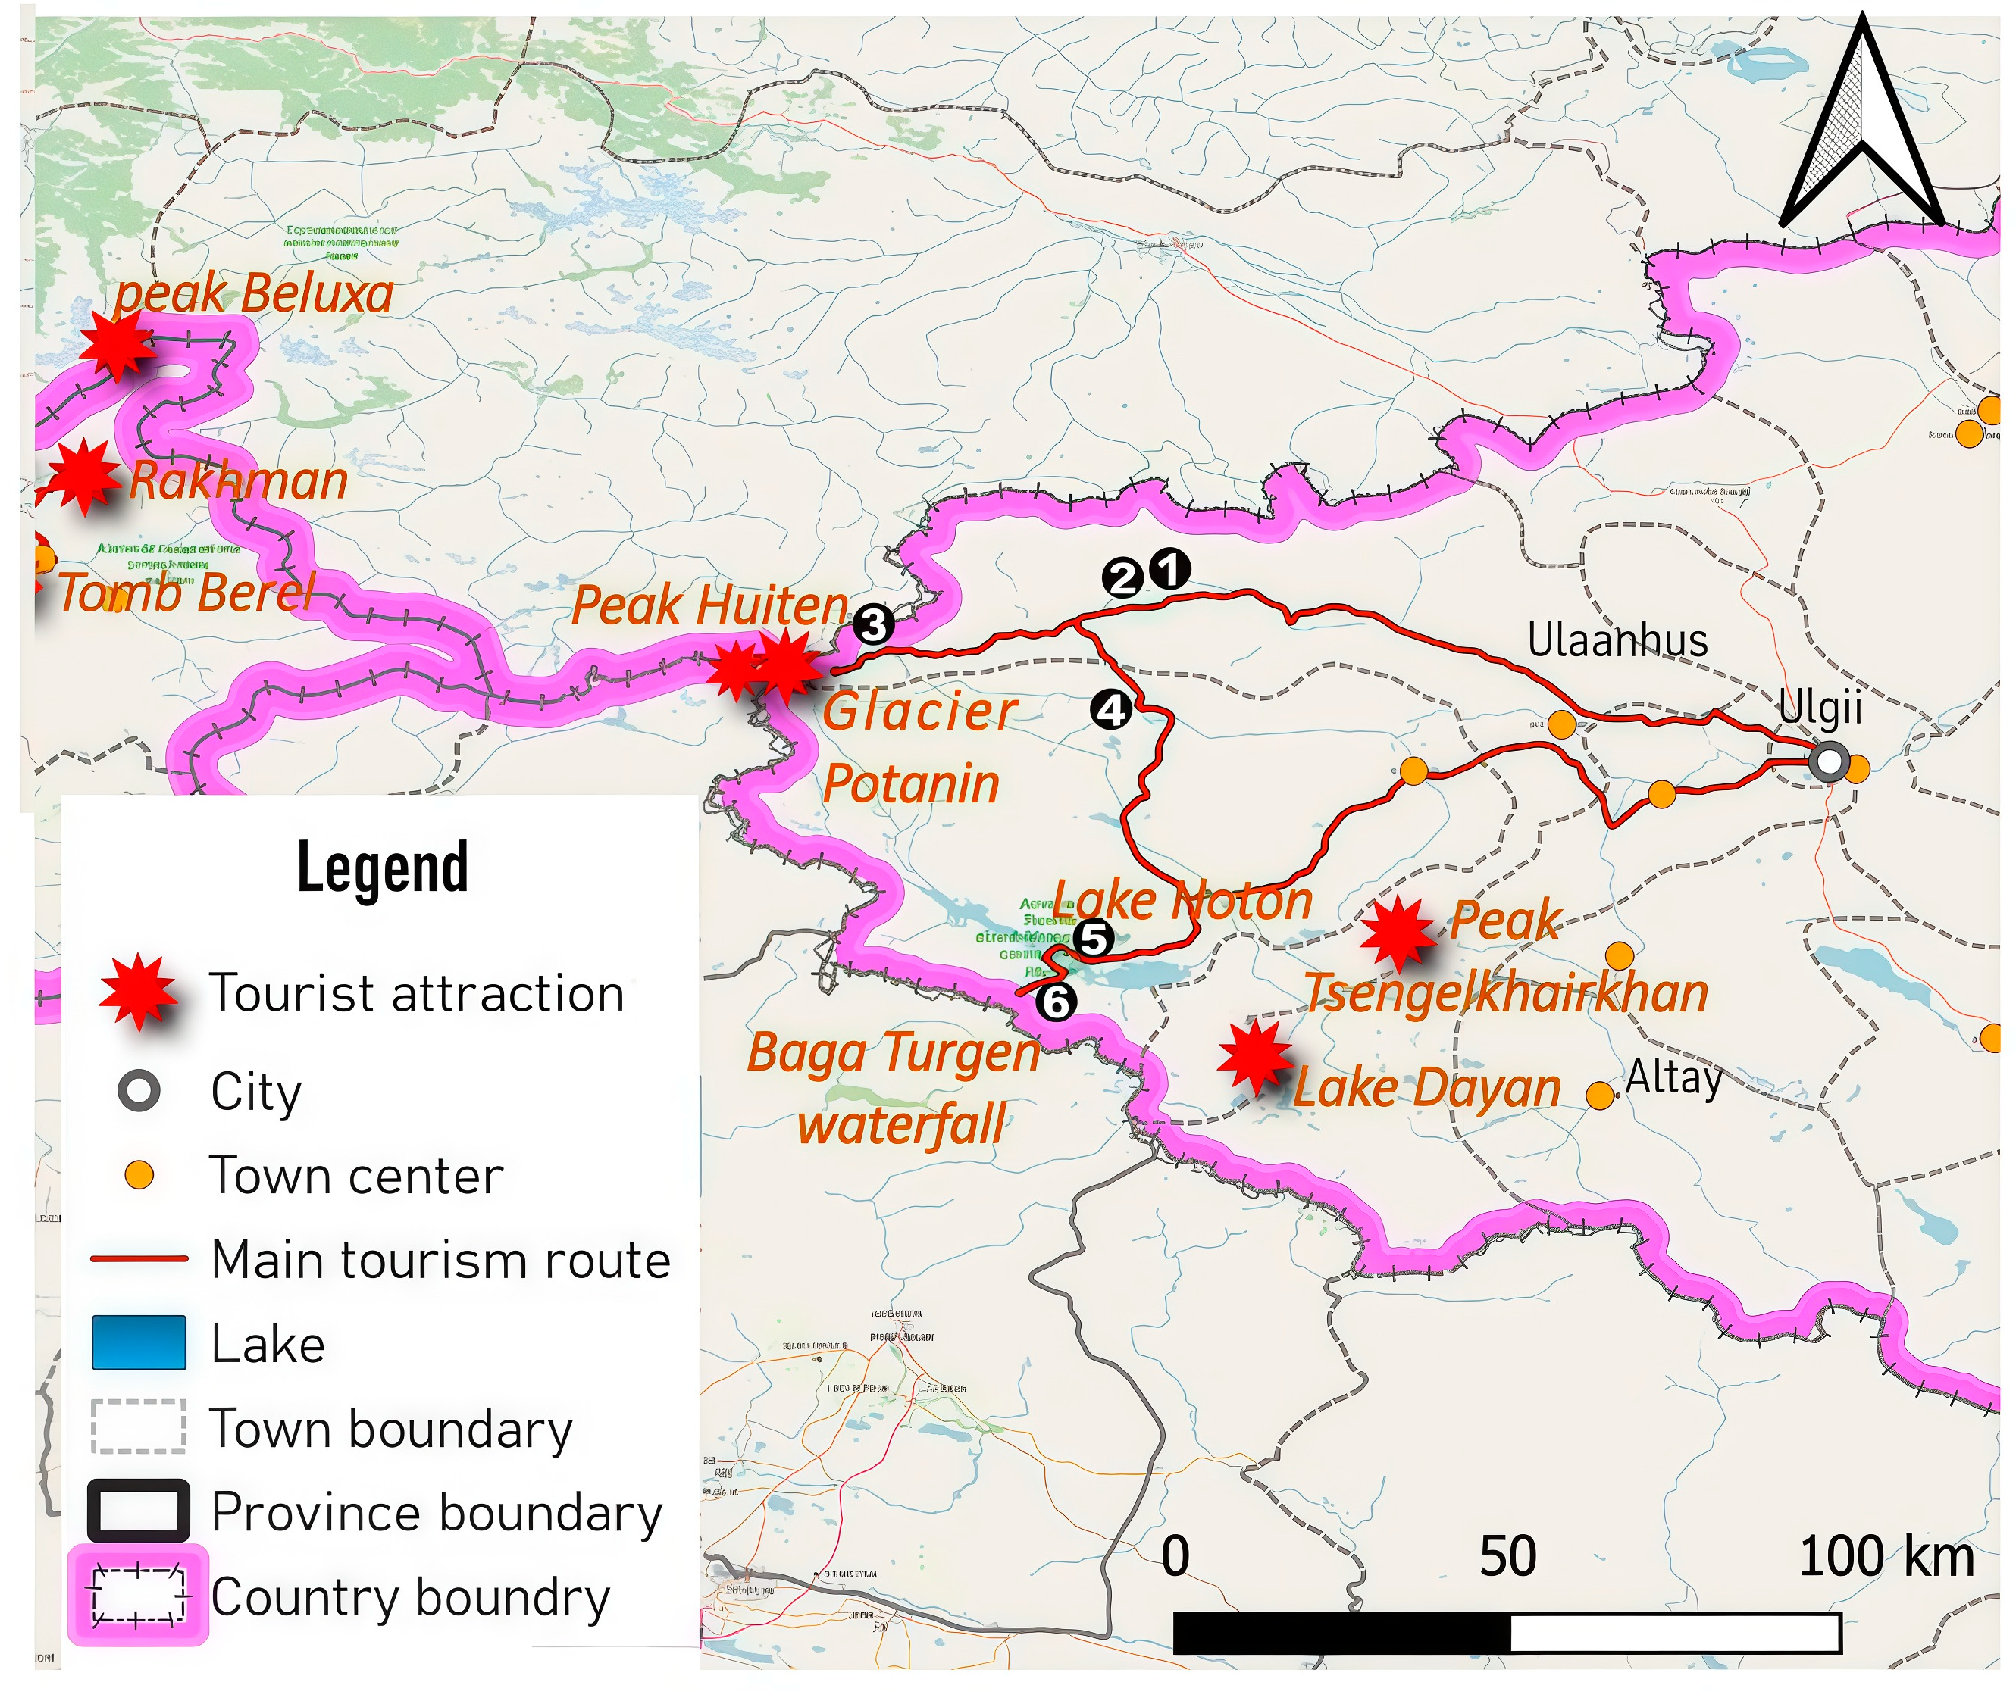
3.2. Route Overview and Elevation Profile
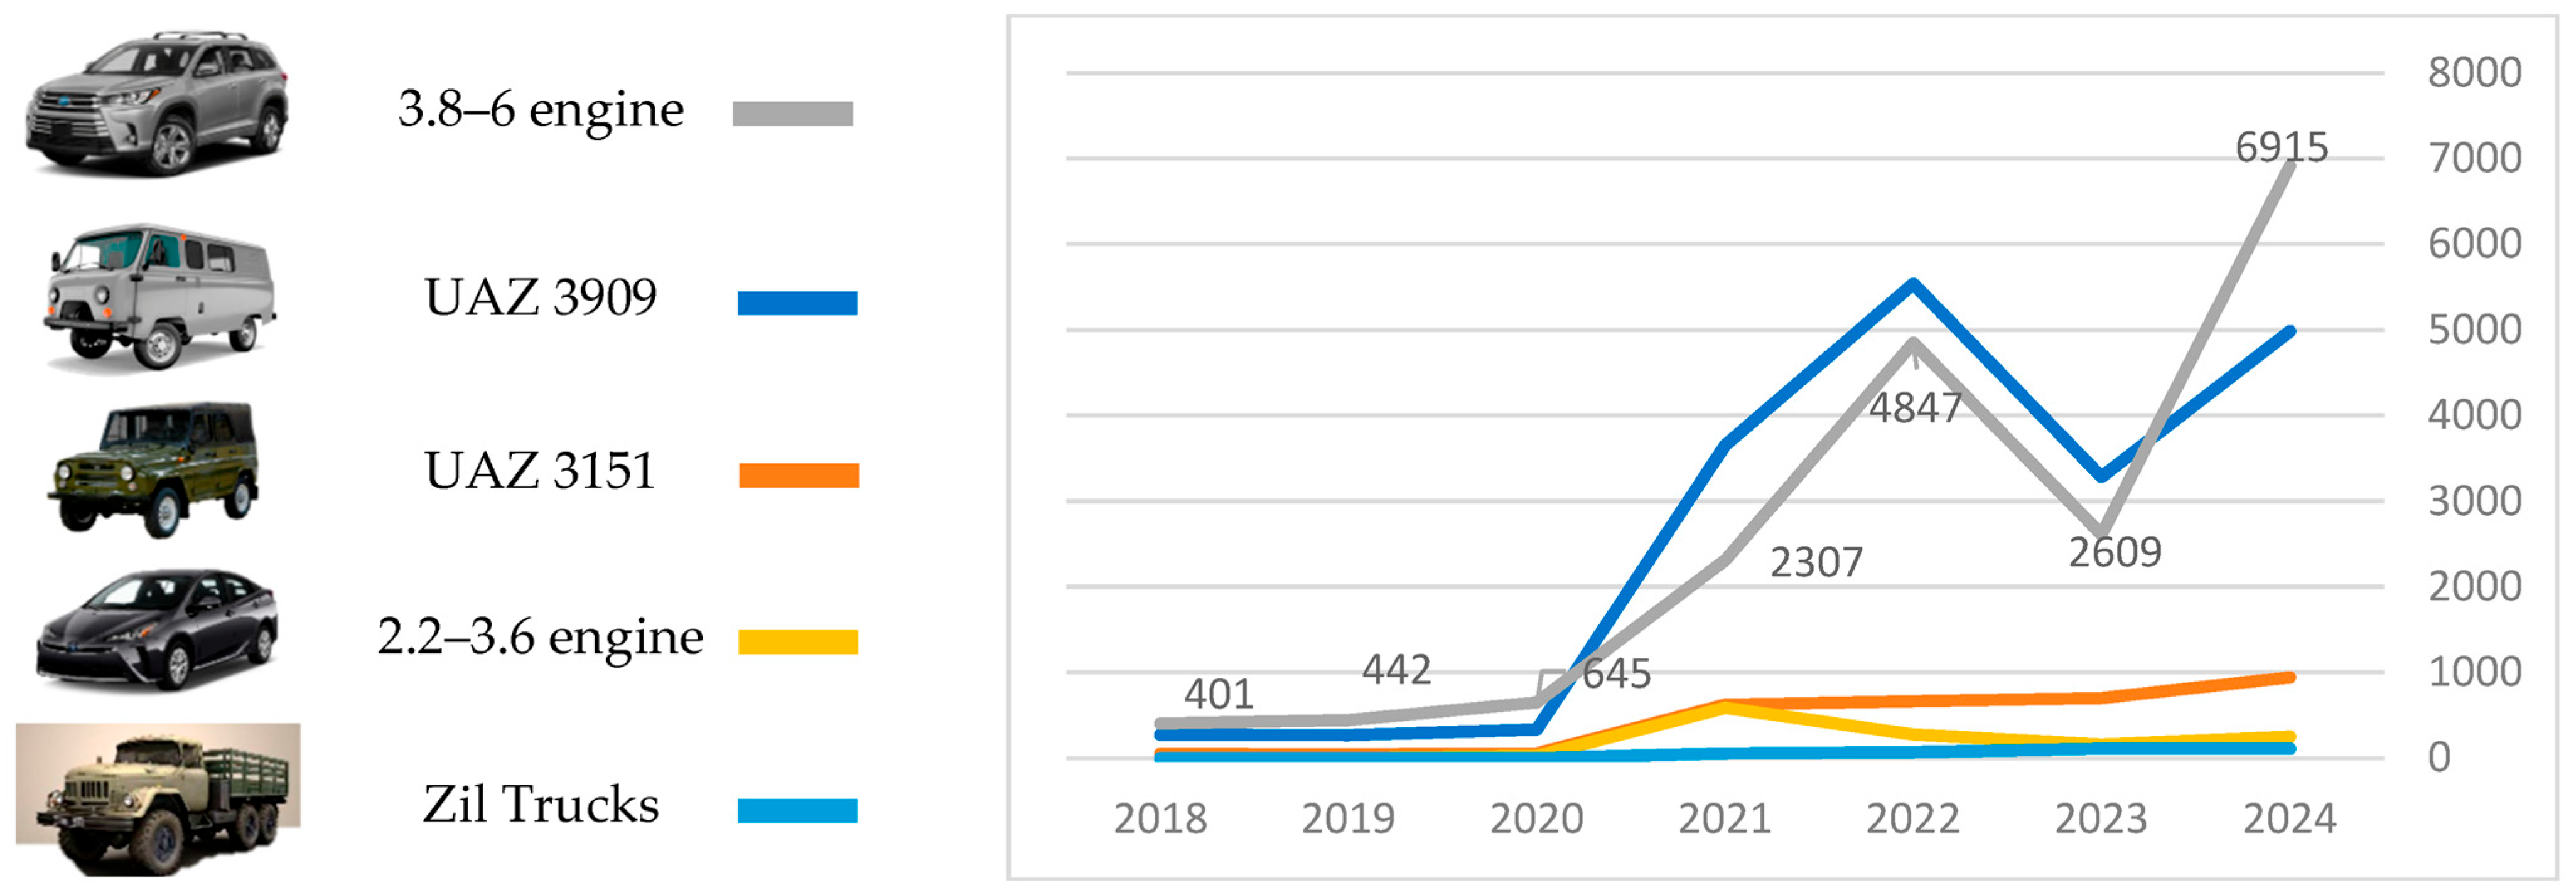
3.3. Vehicle Share and Type Distribution
- -
- UAZ-3909 vans—44.5%;
- -
- Medium-sized SUVs, primarily Land Cruiser 200—44.1% (reaching 6915 vehicles in 2022; 52.4% share that year);
- -
- UAZ-315108—7.4% (declining in recent years);
- -
- Sedans, mostly Toyota Prius (2.2–3.6 L)—~3.0%;
- -
- ZIL-131 trucks, typically used for supply transport—~1.0%.
3.4. Fuel Consumption Estimations
- -
- Land Cruiser-200: 62.6 L (gasoline);
- -
- UAZ-3909: 68.5 L (gasoline);
- -
- UAZ-315108: 82.2 L (gasoline);
- -
- Prius 20: 26.1 L (gasoline);
- -
- ZIL-131 truck: 332.6 L (diesel).
- -
- Total fuel usage (2016–2022):
- -
- Gasoline: 2,886,493 L;
- -
- Diesel: 111,088 L.
3.5. GHG Emissions from Fuel Use
- -
- Gasoline: 2.33969 kg CO2 per liter;
- -
- Diesel: 2.70553 kg CO2 per liter.
- -
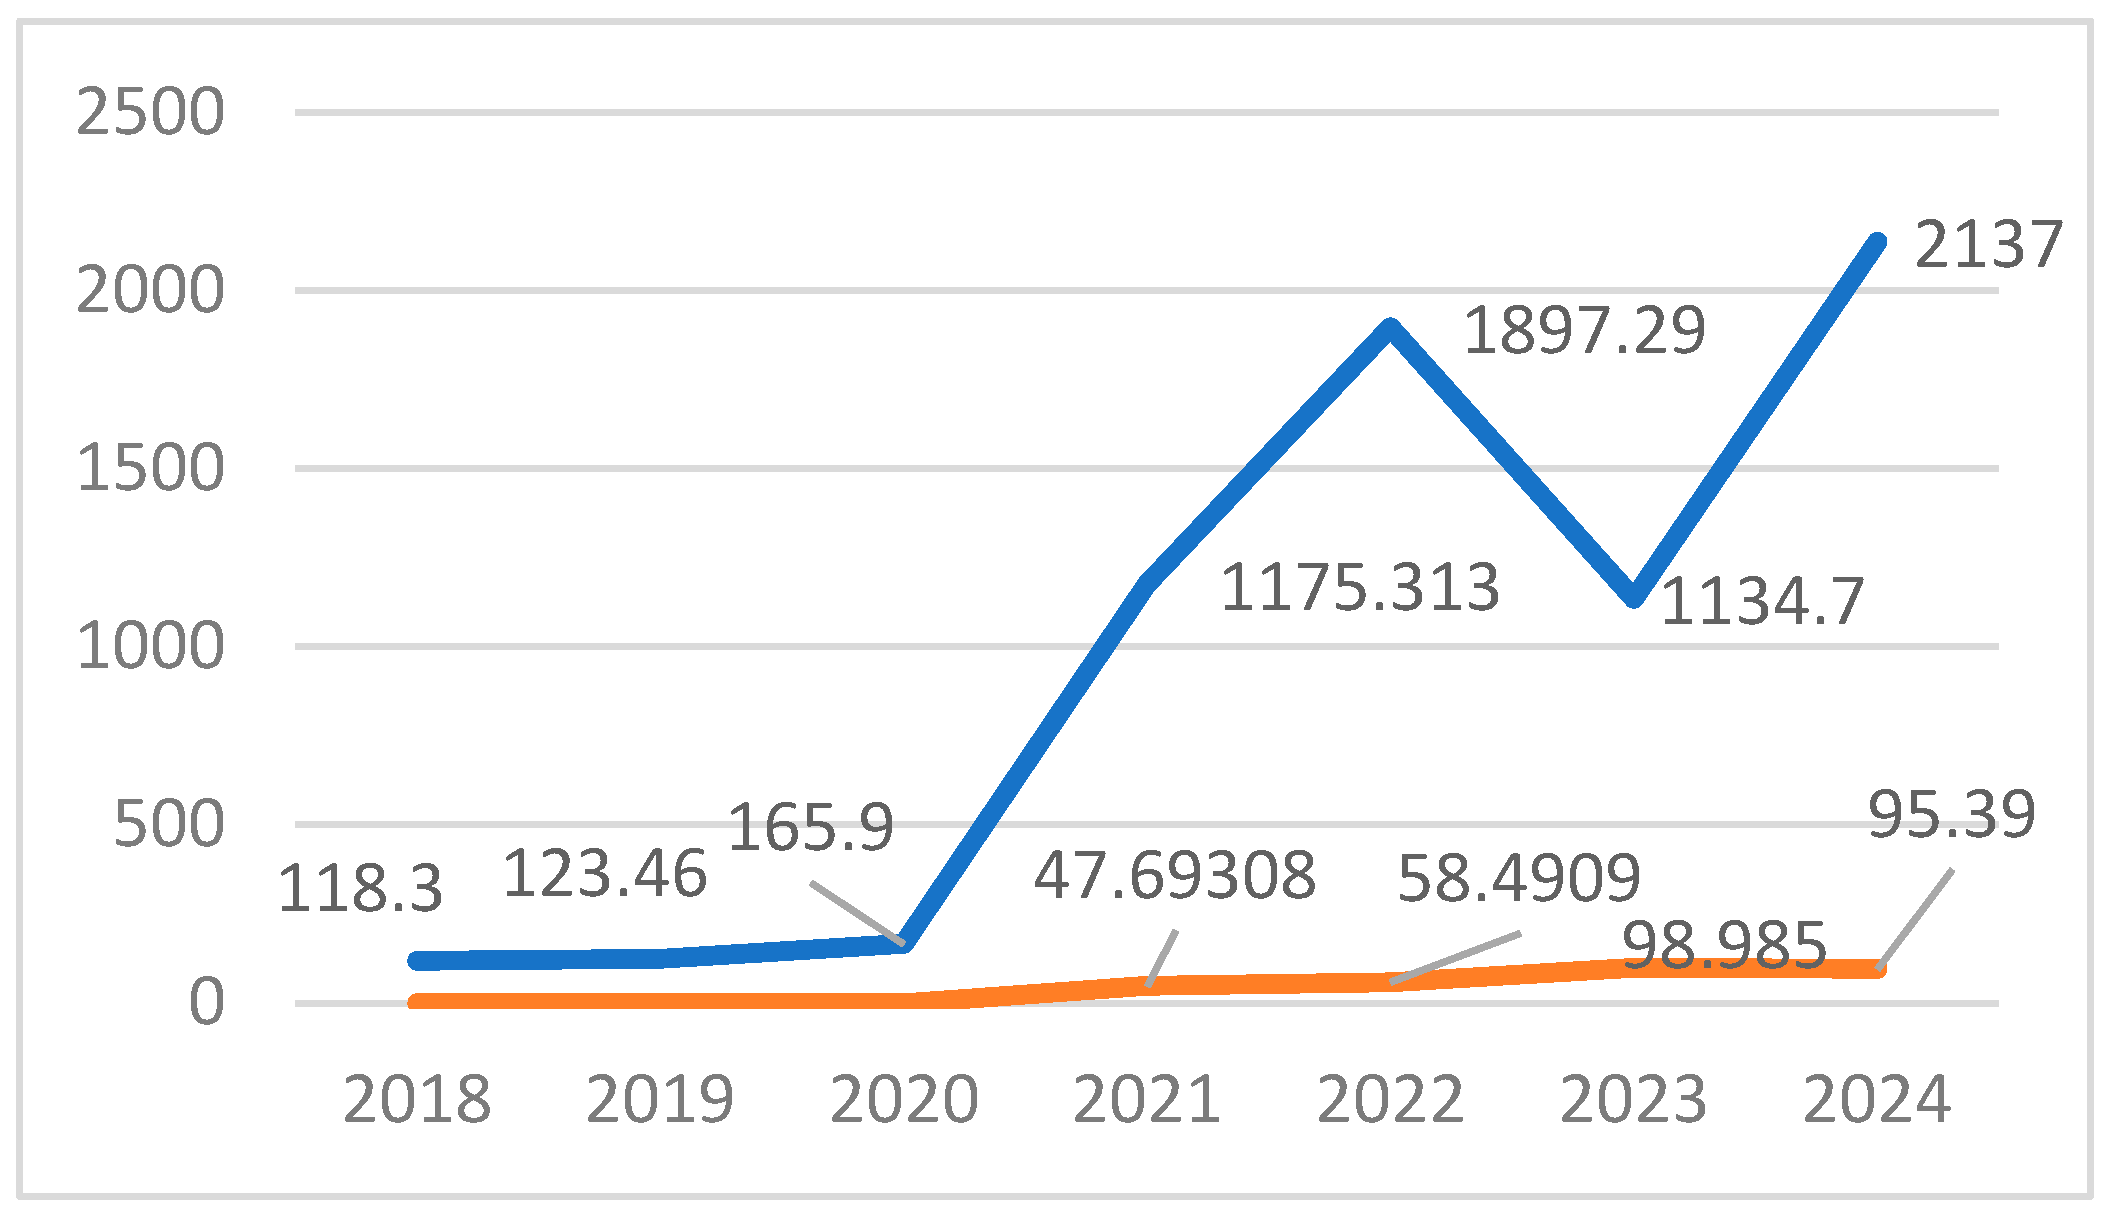
- In 2024: CH4 = 43.5 kg (SUVs), 41.1 kg (UAZ-3909), and N2O = 20.0 kg.
- -
- Seven-year totals (2018–2024): CH4 = 300.9 kg and N2O = 45.75 kg.
3.6. Summary of Key Environmental Findings
- -
- Adjusting tourist transport policies to reduce reliance on high-consumption vehicles;
- -
- Introducing fuel or entry restrictions in the most emission-intensive segments;
- -
- Prioritizing infrastructure upgrades in steep or degraded road sections.
4. Discussion
4.1. Significance of Findings
4.2. Contributions and Methodological Value
- -
- Dividing the 580 km tourist route into sections based on slope, surface type, and elevation;
- -
- Applying fuel adjustment coefficients to each segment, using terrain characteristics and local travel conditions;
- -
- Estimating fuel use by vehicle category using official park entry records and observed vehicle shares.
4.3. Methodological Innovation
4.4. Theoretical Contribution
4.5. Policy Recommendations
4.6. Implications and Applications
- -
- Introducing vehicle limits or fuel restrictions on high-impact;
- -
- Prioritizing infrastructure upgrades or rerouting in swampy or steep areas;
- -
- Adjusting tourism transport guidelines to reduce the dominance of high-consumption vehicles;
- -
- Incorporating terrain-adjusted emission coefficients into national inventories for remote parks.
4.7. Limitations and Future Work
- -
- Conducting sensitivity analyses with ±10–15% variation in key assumptions;
- -
- Comparing modeled fuel use with GPS-based vehicle data, if available;
- -
- Integrating seasonal and behavioral variability into correction factors.
5. Conclusions
Author Contributions
Funding
Institutional Review Board Statement
Informed Consent Statement
Data Availability Statement
Conflicts of Interest
Abbreviations
| GHG | Greenhouse Gas |
| FEC | Fuel and Emissions Calculator |
| BEVs | Battery Electric Vehicles |
| FCVs | Fuel Cell Vehicles |
| NGVs | Natural Gas Vehicles |
| SUVs | Sport Utility Vehicle |
References
- Konečný, V.; Zuzaniak, M.; Jonasíková, D. Greenhouse Gas Emissions from Road Transport and Their Economic Value in the Assessment of Transport Projects Using a Cost–Benefit Analysis: Approaches Implemented in the Slovak Republic and Selected Central European Countries. Appl. Sci. 2025, 15, 1283. [Google Scholar] [CrossRef]
- Chocholac, J.; Hruska, R.; Machalik, S.; Sommerauerova, D.; Sohajek, P. Framework for Greenhouse Gas Emissions Calculations in the Context of Road Freight Transport for the Automotive Industry. Sustainability 2021, 13, 4068. [Google Scholar] [CrossRef]
- Solaymani, S.; Botero, J. Reducing Carbon Emissions from Transport Sector: Experience and Policy Design Considerations. Sustainability 2025, 17, 3762. [Google Scholar] [CrossRef]
- Yessimova, D.; Faurat, A.; Belyi, A.; Yessim, A.; Sadykov, Z. Environmental Sustainability and Carbon Footprint of Tourism: A Study of a Natural Park in Northeastern Kazakhstan. Sustainability 2025, 17, 1723. [Google Scholar] [CrossRef]
- Susanty, A.; Puspitasari, N.B.; Saptadi, S.; Siregar, S.D. Using system dynamics approach to build policy scenario for reducing CO2; emission resulted from tourism travel to Karimunjawa. Emerald Insides 2021, 50, 1277–1302. [Google Scholar] [CrossRef]
- Baysan, S. The attitudes of tourism establishments toward the development of tourism and toward tourism’s impact on the environment in Ören (Milas), Türkiye. In Natural Environment and Culture in the Mediterranean Culture; Cambridge Scholars Publishing: Newcastle upon Tyne, UK, 2008; Available online: https://www.researchgate.net/publication/364315777_The_attitudes_of_toursim_establishments_toward_the_development_of_tourism_and_toward_tourism’s_impact_on_the_environment_in_Oren_Milas_Turkiye (accessed on 23 May 2025).
- Belsoy, J.; Korir, J.; Yego, J. Environmental impacts of tourism in protected areas. J. Environ. Earth Sci. 2012, 2, 64–73. [Google Scholar]
- Charlie, T.C.; Sawina, J.P. The Carbon Footprint of Tourist Transportation in Gettysburg National Military Park; Student Publications, Gettysburg College: Gettysburg, PA, USA, 2023; Available online: https://cupola.gettysburg.edu/student_scholarship/1103 (accessed on 23 May 2025).
- Gara, V.; Tarnay, L.; Campbell, E.; Gabarrell, X. A life-cycle carbon footprint of Yosemite National Park. Energy Policy 2013, 62, 1336–1343. [Google Scholar] [CrossRef]
- Giampiero, G.; Vitali, A.; Bernabucci, U.; Lacetera, N.; Nardone, A. Greenhouse Gas Emissions and Carbon Sinks of an Italian Natural Park. Front. Environ. Sci. 2021, 9, 706880. [Google Scholar] [CrossRef]
- Godwell, N.; Dube, K.; Chapungua, L.; Chikodzi, D. Quest for NetZero emissions in South African national parks: A tourism perspective. Heliyon 2023, 9, e16410. [Google Scholar] [CrossRef] [PubMed]
- Yembuu, B. The Physical Geography of Mongolia; Springer: Cham, Switzerland, 2021; Available online: https://link.springer.com/book/10.1007/978-3-030-61434-8 (accessed on 22 June 2025).
- Parliament of Mongolia. Concept of Sustainable Development of Mongolia–2030. No. 19 of 2016; Ulaanbaatar. Available online: https://legalinfo.mn/mn/detail?lawId=207105&showType=1 (accessed on 23 May 2025).
- Parliament of Mongolia. “Vision-2050” Long Term Development Policy of Mongolia; No. 52 of 2020; Great Khural of Mongolia: Ulaanbaatar, Mongolia, 2020. Available online: https://www.vision2050.gov.mn/ (accessed on 23 May 2025).
- UNDP (United Nations Development Programme); MNR (Ministry of Natural Resources of the Russian Federation). Biodiversity Conservation in the Russian Portion of the Altai-Sayan Ecoregion; UNDP MNR of the Russian Federation: Moscow, Russia, 2011. [Google Scholar]
- Chlachula, J.; Zhensikbayeva, N.Z.; Yegorina, A.V.; Kabdrakhmanova, N.K.; Czerniawska, J.; Kumarbekuly, S. Territorial assessment of the East Kazakhstan geo/ecotourism: Sustainable travel prospects in the Southern Altai area. Geosciences 2021, 11, 156. [Google Scholar] [CrossRef]
- IPCC (Intergovernmental Panel on Climate Change). 2006 IPCC Guidelines for National Greenhouse Gas Inventories, Chapter 3, Mobile Combustion. Available online: https://www.ipcc-nggip.iges.or.jp/public/2006gl/pdf/2_Volume2/V2_3_Ch3_Mobile_Combustion.pdf (accessed on 23 May 2025).
- Eggleston, S.; Michael, W. Good Practice Guidance and Uncertainty Management in National Greenhouse Gas Inventories. IPCC. 2006. Available online: https://www.ipcc-nggip.iges.or.jp/public/gp/bgp/2_3_Road_Transport.pdf (accessed on 23 May 2025).
- USEPA (U.S. Environmental Protection Agency). Greenhouse Gas Emissions from a Typical Passenger Vehicle. 2011. Available online: https://www.epa.gov/greenvehicles/greenhouse-gas-emissions-typical-passenger-vehicle (accessed on 23 May 2025).
- ICCT (International Council on Clean Transportation). Calculating Electric Drive Vehicle Greenhouse Gas Emissions; ICCT: Washington, DC, USA, 2012; Available online: https://theicct.org/sites/default/files/publications/ICCT_CalculatingEdriveGHG_082012.pdf (accessed on 23 May 2025).
- Xu, X.; Xu, Y.; Zhao, Y.; Liu, H.; Cheng, H.; Rodgers, M.O.; Guensler, R. Fuel and Emissions Calculator (FEC) Version 2.0. Available online: https://escholarship.org/uc/item/4qg1s2jq (accessed on 23 May 2025).
- Graham, L.A.; Rideout, G.; Rosenblatt, D.; Hendren, J. Greenhouse gas emissions from heavy-duty vehicles. Atmos. Environ. 2008, 42, 4665–4681. [Google Scholar] [CrossRef]
- Nealer, R.; Nealer, R.; Hendrickson, T.P. Review of Recent Lifecycle Assessments of Energy and Greenhouse Gas Emissions for Electric Vehicles. Transportation 2015, 2, 66–73. [Google Scholar] [CrossRef]
- Ellingsen, L.A.W.; Singh, B.; Strømman, A.H. The size and range effect: Lifecycle greenhouse gas emissions of electric vehicles. Environ. Res. Lett. 2016, 11, 54010. [Google Scholar] [CrossRef]
- Akihiro, W.; Leaver, J.; Ishida, H.; Shafiei, E. Impact of low emissions vehicles on reducing greenhouse gas emissions in Japan. Energy Policy 2019, 130, 227–242. [Google Scholar] [CrossRef]
- Li, W.; Wang, M.; Cheng, X.; Cui, K.; Li, Q.; Chen, S. Travel intensity of private electric vehicles and implications for GHG emission reduction in China. Environ. Impact Assess. Rev. 2025, 112, 107770. [Google Scholar] [CrossRef]
- Ehsani, M.; Ahmadi, A.; Fadai, D. Modeling of vehicle fuel consumption and carbon dioxide emission in road transport. Renew. Sustain. Energy Rev. 2016, 53, 1638–1648. [Google Scholar] [CrossRef]
- Tsokolis, D.; Tsiakmakis, S.; Dimaratos, A.; Fontaras, G.; Pistikopoulos, P.; Ciuffo, B.; Samaras, Z. Fuel consumption and CO2 emissions of passenger cars over the New Worldwide Harmonized Test Protocol. Appl. Energy 2016, 179, 1152–1165. [Google Scholar] [CrossRef]
- Burgess, S.C.; Choi, J.M.J. A parametric study of the energy demands of car transportation: A case study of two competing commuter routes in the UK. Transp. Res. Part D Transp. Environ. 2003, 8, 21–36. [Google Scholar] [CrossRef]
- Pérez-Martínez, P.J.; Ming, D.; Dell’Asin, G.; Monzón , A. Evaluation of the influence of toll systems on energy consumption and CO2 emissions: A case study of a Spanish highway. J. King Saud Univ. Sci. 2011, 23, 301–310. [Google Scholar] [CrossRef]
- Hayashi, Y.; Kato, H. A model system for the assessment of the effects of car and fuel green taxes on CO2 emission. Transp. Res. Part D Transp. Environ. 2001, 6, 123–139. [Google Scholar] [CrossRef]
- Peeters, P.; Szimba, E.; Duijnisveld, M. Major environmental impacts of European tourist transport. J. Transp. Geogr. 2007, 15, 83–93. [Google Scholar] [CrossRef]
- Becken, S.; Simmons, D.G.; Frampton, C. Energy use associated with different travel choices. Tour. Manag. 2003, 24, 267–277. [Google Scholar] [CrossRef]
- Guo, S.; He, P.; Bayaraa, M.; Li, J. Greenhouse gas emissions embodied in the Mongolian economy and their driving forces. Sci. Total Environ. 2020, 714, 136378. [Google Scholar] [CrossRef] [PubMed]
- Namkhainyam, T.; Ovgor, B.; Jargal, D.; Malley, C. Modelling long-term greenhouse gas mitigation pathways for Mongolia. Environ. Res. Commun. 2024, 6, 125010. [Google Scholar] [CrossRef]
- Namkhainyam, B.; Tsolmon, N. Improvement of estimates of GHG emissions from mobile sources in Mongolia. In Proceedings of the 2008 Third International Forum on Strategic Technologies, Novosibirsk, Russia, 23–29 June 2008; pp. 542–544. [Google Scholar] [CrossRef]
- Yerbakhyt, B.; Onerkhan, G.; Kapsalyamov, B.A.; Saspugayeva, G.Y.; Durmekbayeva, S.N. Damage of Soil Cover Due to the Impact of Tourism in the Altai Mountains. Eurasian J. Ecol. 2022, 73, 37–49. [Google Scholar] [CrossRef]
- Yerbakhyt, B.; Kapsalyamov, B.A.; Yusupova, Z.B. Heavy metal pollution from tourism in the Altai Mountains. NNC RK Bull. 2022, 1, 15–24. [Google Scholar] [CrossRef]
- Mongolian Border Department. Monthly Report of Border Zone, Report of Tourist, Transport to Travel to the Border Altai Besbogda Nature Reserve; By letter. No 2a/2518 of 12 December 2022; Mongolian Border Department: Ulaanbaatar city, Mongolia, 2022.
- Order of the Minister of Transport Development of Mongolia. Standard Norm of Fuel Consumption for a 100 km Run per Car. Mongolian Unified Legal Information System. 2019. Available online: https://legalinfo.mn/mn/detail/14976 (accessed on 23 May 2025).
- Unger, R.; Abegg, B.; Mailer, M.; Stampfl, P. Energy consumption and greenhouse gas emissions resulting from tourism travel in an alpine setting. Mt. Res. Dev. 2016, 36, 475–483. [Google Scholar] [CrossRef]
- Babri, S.; Díez-Gutiérrez, M.; Aspen, D.M.; Johansen, B.H. A simulation model to assess emission reduction policies in tourism transport: Case study of the Geiranger fjord UNESCO world heritage site in Norway. Int. J. Sustain. Transp. 2023, 17, 1006–1019. [Google Scholar] [CrossRef]
- Phophe, P.A.; Masubelele, M.L. Carbon footprint assessment in nature-based conservation management estates using South African national parks as a case study. Sustainability 2021, 13, 13969. [Google Scholar] [CrossRef]


| Indicator | Altai Tavan Bogd Route |
|---|---|
| Reason | A popular domestic tourism route since 2021 |
| Location | Western Mongolia, Bayan-Ulgii Province |
| Route and Destinations | Ulgii → Khokhhotol → Tavanbogd Peak → Potanin Glacier → Hoton-Hurgan Lakes → Baga Turgen Waterfall → Tsengel soum → Ulgii |
| Route Length | 580 km |
| Typical Duration | 3–4 days |
| Road Type | Unpaved, bumpy roads; accessible only by high-engine or UAZ vehicles; reaches elevations up to 3200 m |
| Route Type | Nature sightseeing; cultural pilgrimage to the Tavanbogd peaks |
| Main Attractions | Khüiten Peak (highest in Mongolia), Potanin Glacier, Hoton-Hurgan Lakes, Baga Turgen Waterfall |
| Annual Domestic Tourists | 2020—4071; 2021—44,653; 2022—51,183; 2023—29,683; 2024—56,096 |
| Travel Season | 10 June to 25 July |
| Common Transport | UAZ and other high-engine vehicles only |
| Step | Description |
|---|---|
| Map roads and gather elevation data | Compiling road network information and associated elevation profiles to define the study route. |
| Segment roads by terrain difficulty | Dividing the route into segments based on elevation, slope, and road surface. Classify each as flat, ascending, or descending. |
| Estimate fuel consumption per segment | Calculating fuel use for each segment and vehicle type using terrain correction factors (from Order No. 390) and standard fuel rates. * |
| Aggregate total fuel use | Summing up terrain-adjusted fuel use across all segments to obtain total consumption per vehicle type. |
| Scale by vehicle entry volume | Multiplying per-vehicle segment fuel use by recorded entries for each vehicle type to estimate fleet-level totals. |
| Convert to GHG emissions | Applying IPCC Tier 1 emission factors and U.S. EPA coefficients to convert total fuel into CO2, CH4, and N2O emissions by vehicle class and fuel type. |
| № | Name of the Section | Length, Km | Road Difficulty and Off-Road Levels (1–10 Points) | Height Difference | Elevation Change, m/km | Possible Max Speed, km/h | Average Speed, km/h | Percentage Increase in the Standard Norm [40] |
|---|---|---|---|---|---|---|---|---|
| 1 | Ulgii City–First Pass | 26 | Unpaved, washboard road, steep uphill, (3 points) | (449 m) 1715 m–164 m | ↑ 17.2 m per 1 km | 50 | 30 | The first zone, +15% |
| 2 | First Pass–Ulaankhus Soum | 45 | Unpaved, washboard road, (1 point) | (−381 m) 2164 m–1783 m | ↓ 20.0 m per 1 km | 80 | 50 | Road difficulty −5% |
| 3 | Ulaankhus Soum–Khukh Khotol Town–Songinot Pass | 130 | Unpaved, washboard road, long uphill, (2 points) | (991 m) 1783 m–2774 m | ↑ 11.7 m per 1 km | 80 | 60 | The first zone, +15% |
| 4 | Songinot–Ranger Post | 180 | Washboard road, all-terrain road (2 points) | (−65 m) 2774 m–2709 m | ↓ 20.0 m per 1 km | 70 | 55 | 0% |
| 5 | Ranger Post–President’s Ovoo Worship Site | 194 | Muddy roads with steep uphill, some swampy roads (10 points) | (454 m) 2709 m–3163 m | ↑ 32.4 m per 1 km | 30 | 15 | The first zone, +15% Road difficulty +10% |
| 6 | President’s Ovoo Worship Site–Bridge of Oigor River | 244 | Muddy roads with downhill, all-terrain road (6 points) | (−769 m) 3163 m–2394 m | ↓ 15.4 m per 1 km | 60 | 35 | The first zone, +15% |
| 7 | Bridge of Oigor River–Taldag Pass | 270 | Uphill steep roads, washboard road, (6 points) | (180 m) 2394 m–2574 m | ↑ 7 m per 1 km | 50 | 30 | The first zone, +15% Road difficulty +5% |
| 8 | Taldag Pass–Bridge of Tsagaan River | 300 | Downhill road with short turns, rocky road (4 points) | (−471 m) 2574 m–2103 m | ↓ 15.7 m per 1 km | 60 | 45 | The first zone, +15% |
| 9 | Bridge of Tsagaan River–Pass | 315 | Uphill steep roads, straight road without bumps, (8 points) | (776 m) 2103 m–2879 m | ↑ 51.7 m per 1 km | 35 | 15 | The first zone, +15% Road difficulty +5% |
| 10 | Pass–Baga Turgen–Tsengel Soum | 495 | All-terrain roads, (5 points) | (−991 m) 2879 m–1888 m | ↓ 5.5 m per 1 km | 60 | 40 | The first zone, +15% |
| 11 | Tsengel Soum–Mushgiraa Pass | 508 | Washboard road, long uphill (4 points) | (356 m) 1888 m–2244 m | ↑ 27.4 m per 1 km | 50 | 35 | First zone, +15% |
| 12 | Mushgiraa Pass– Sagsai Soum | 558 | Washboard road, (4 points) | (−484 m) 2244 m–1760 m | ↓ 20.0 m per 1 km | 70 | 50 | Road difficulty +5% |
| 13 | Sagsai Soum–Pass | 566 | Washboard road, long uphill, (4 points) | (389 m) 1760 m–2149 m | ↑ 48.6 m per 1 km | 60 | 40 | Road difficulty +5% |
| 14 | Pass–Ulgii city | 580 | Washboard road, graded road (4 points) | (−434 m) 2149 m–1715 m | ↓ 31 m per 1 km | 60 | 50 | 0% |
| Types of Cars | Represented Car Type | Fuel Consumption per 100 km, Liters | Gasoline to be Spent at the Route, Liters | 2018 (Liters) | 2019 (Liters) | 2020 (Liters) | 2021 (Liters) | 2022 (Liters) | 2023 (Liters) | 2024 (Liters) | Total |
|---|---|---|---|---|---|---|---|---|---|---|---|
| 3.8–6 engine | Land Cruiser-200 | 9.6 | 62.6 | 25,103 | 27,669 | 40,377 | 144,418 | 303,422 | 163,323 | 432,879 | 1,137,191 |
| UAZ-3909 | UAZ-3909 | 10.5 | 68.5 | 22,112 | 21,947 | 27,044 | 300,112 | 455,224 | 269,698 | 409,520 | 1,505,657 |
| UAZ-3151 | UAZ-315108 | 12.6 | 82.2 | 3357 | 3151 | 3494 | 42,539 | 45,142 | 47,882 | 64,596 | 210,161 |
| 1.8–3.2 engine | Prius 20 | 4.0 | 26.1 | 0 | 0 | 600 | 15,269 | 7125 | 4072 | 6421 | 33,487 |
| ZIL trucks | ZIL-131 | 51 | 332.6 | 0 | 0 | 0 | 17,628 | 21,619 | 36,586 | 35,256 | 111,089 |
| Total | Gasoline | (l) | 50,572 | 52,767 | 71,515 | 502,338 | 810,913 | 484,975 | 913,416 | 2,886,493 | |
| Diesel | (l) | 0 | 0 | 0 | 17,628 | 21,619 | 36,586 | 35,256 | 111,088 | ||
| Gases | 2018 | 2019 | 2020 | 2021 | 2022 | 2023 | 2024 | Total |
|---|---|---|---|---|---|---|---|---|
| CH4 | 5.0 | 5.3 | 7.2 | 52.2 | 83.6 | 52.3 | 95.3 | 300.9 |
| N2O | 1.1 | 1.1 | 1.5 | 11.0 | 17.6 | 11.0 | 20.0 | 45.7 |
Disclaimer/Publisher’s Note: The statements, opinions and data contained in all publications are solely those of the individual author(s) and contributor(s) and not of MDPI and/or the editor(s). MDPI and/or the editor(s) disclaim responsibility for any injury to people or property resulting from any ideas, methods, instructions or products referred to in the content. |
© 2025 by the authors. Licensee MDPI, Basel, Switzerland. This article is an open access article distributed under the terms and conditions of the Creative Commons Attribution (CC BY) license (https://creativecommons.org/licenses/by/4.0/).
Share and Cite
Badyelgajy, Y.; Doszhanov, Y.; Kapsalyamov, B.; Onerkhan, G.; Sabitov, A.; Zhumazhanov, A.; Doszhanov, O. Calculation of Greenhouse Gas Emissions from Tourist Vehicles Using Mathematical Methods: A Case Study in Altai Tavan Bogd National Park. Sustainability 2025, 17, 6702. https://doi.org/10.3390/su17156702
Badyelgajy Y, Doszhanov Y, Kapsalyamov B, Onerkhan G, Sabitov A, Zhumazhanov A, Doszhanov O. Calculation of Greenhouse Gas Emissions from Tourist Vehicles Using Mathematical Methods: A Case Study in Altai Tavan Bogd National Park. Sustainability. 2025; 17(15):6702. https://doi.org/10.3390/su17156702
Chicago/Turabian StyleBadyelgajy, Yerbakhyt, Yerlan Doszhanov, Bauyrzhan Kapsalyamov, Gulzhaina Onerkhan, Aitugan Sabitov, Arman Zhumazhanov, and Ospan Doszhanov. 2025. "Calculation of Greenhouse Gas Emissions from Tourist Vehicles Using Mathematical Methods: A Case Study in Altai Tavan Bogd National Park" Sustainability 17, no. 15: 6702. https://doi.org/10.3390/su17156702
APA StyleBadyelgajy, Y., Doszhanov, Y., Kapsalyamov, B., Onerkhan, G., Sabitov, A., Zhumazhanov, A., & Doszhanov, O. (2025). Calculation of Greenhouse Gas Emissions from Tourist Vehicles Using Mathematical Methods: A Case Study in Altai Tavan Bogd National Park. Sustainability, 17(15), 6702. https://doi.org/10.3390/su17156702


