Article

Spatial–Temporal Differences in Land Use Benefits and Obstacles Under Human–Land Contradictions: A Case Study of Henan Province, China

Institute of Urban Construction and Management, Tianjin University of Commerce, Tianjin 300134, China
*
Author to whom correspondence should be addressed.
Sustainability 2025, 17(15), 6693; https://doi.org/10.3390/su17156693
Submission received: 17 June 2025 / Revised: 17 July 2025 / Accepted: 18 July 2025 / Published: 22 July 2025

Abstract

Against the background of intensifying human–land contradictions, evaluation of land use benefits and identification of obstacles are crucial for sustainable land management and socioeconomic development. Taking Henan Province as an example, this research employed the entropy weight method and TOPSIS model to assess the land use benefits across its cities from 2011 to 2020, a period of rapid land use transformation, analyzed their spatiotemporal evolution, and identified key obstacles via an obstacle degree model. The results showed the following. (1) The social land use benefits consistently exceeded the ecological and economic benefits, with steady improvements observed in both the individual and comprehensive benefits. Spatially, the benefits showed a “one city dominant” pattern, decreasing gradually from the central region to the south, north, east, and west, with this spatial gradient further intensifying over time. (2) Economic factors were the primary obstacles, with significantly higher obstruction degrees than social or ecological factors. The main obstacles were the general budget revenue of government finance per unit land area, domestic garbage removal volume, and total retail sales of social consumer goods per unit land area. (3) The policy implications focus on strengthening regional differentiated development by leveraging Zhengzhou’s core role to boost the land-based economic benefits, integrating social–ecological strengths with agricultural modernization, and promoting “core–periphery linkage” to narrow gaps through targeted industrial and infrastructure strategies. This study could provide region-specific insights for sustainable land management in agricultural provinces undergoing rapid urbanization.

Graphical Abstract

1. Introduction

As the fundamental basis for human survival and development, land serves multiple critical functions in social–ecological systems. It primarily provides essential space for agriculture, facilitates industrial development, and sustains urban–rural settlement systems, along with the associated infrastructure and public facilities, thereby supporting social stability. Furthermore, land delivers vital ecological services, including ecological habitat formation, biodiversity maintenance, climatic regulation, and water–soil resource conservation, which synergistically enhance environmental quality. This functional multiplicity establishes land as a complex system characterized by complex couplings and feedback mechanisms among economic, social, and ecological factors. Notably, land sustainability exerts profound influences on social development, economic operations and ecosystem stability, functioning as a pivotal interface where anthropogenic activities and natural processes intersect [1]. This system complexity highlights the need for spatiotemporally explicit evaluation frameworks to quantify the land use benefits and identify their constraining factors.
In recent decades, China has experienced rapid urbanization and industrialization [2,3], accompanied by intensifying land use pressures [4,5,6]. This development trajectory has generated several notable challenges, including extensive land utilization, unplanned expansion of developed areas, and gradual land functional degradation [7,8,9]. Given China’s large population, such intensive land use has significantly exacerbated human–land conflicts [10,11] and worsened human–nature relationships [12]. A representative case is soil erosion, with affected areas increasing dramatically from 1.16 million km2 in the 1950s to 2.6534 million km2 in the 2020s according to national surveys. These changes present important challenges for sustainable land management and ecological conservation, with implications for regional development. Concurrently, China has implemented stringent policy frameworks to promote sustainable land utilization. For example, the revised Regulations on the Implementation of the Land Administration Law (2021) established stringent controls over cultivated land use, including prohibitions on non-agricultural construction and non-grain crop cultivation on protected farmland, with the goal of maintaining the national strategic threshold of 1.8 billion mu (approximately 120 million hectares) of cultivated land. The ecological conservation redline system, requiring designation of protected zones covering 30% of China’s land area by 2022, prioritizes conservation of key ecological areas. More recently, the Ministry of Natural Resources (2024) further advanced integrated land management through the Guidelines on Implementing the Experience of the “Green Rural Revival Program” for Comprehensive Land Management in the whole region, coordinating agricultural land improvement, construction land optimization, and ecological restoration. To address the multidimensional land use challenges, developing a multi-scale evaluation framework is imperative.
Land use benefit refers to the material output or effective achievements of land inputs and consumption per unit area in the social, economic, ecological and environmental aspects of regional development [13,14]. As a key approach for enhancing land use intensity and sustainability [15], improving land use benefit has become a crucial pathway to sustainable land management [16]. The theories of sustainable land use, human–land relationship coordination, regional development differentiation, and obstacle factor diagnosis, as proposed by scholars both domestically and internationally, have laid a solid theoretical foundation for the evaluation of land use benefits. The assessment framework has evolved from unidimensional economic analyses to integrated evaluations: Initially focused on economic benefits tied to agricultural productivity and fiscal revenues [17]; subsequent studies incorporated social equity and ecological security concerns, thereby developing frameworks that integrate social benefits (e.g., urban synergy benefits, livelihood welfare) and ecological benefits (e.g., habitat quality, ecosystem service flows) [18,19,20]. Recent researchers have employed spatial econometrics and multi-objective decision models to clarify the systemic mechanisms underlying regional development disparities and green transition barriers [21,22,23]. Methodologically, weight determination has evolved from subjective approaches (e.g., Delphi method, analytic hierarchy process) to objective or integrated methods (e.g., coefficient of variation, entropy weight method) [23,24,25]. Currently, evaluation frameworks incorporate diverse analytical tools, including TOPSIS, DEA and its advanced variants (SBM-DEA, super-SBM) [26,27,28,29]. These tools have been applied across multiple spatial scales, ranging from village-level to national-scale analyses [30,31], including the county, city [32], province [33], urban agglomeration [34], and river basin [21]. Consequently, a comprehensive “dimension–method–scale” analytical framework has been established. Notably, the combined entropy weight–TOPSIS approach has become predominant in land use benefit assessments due to its minimal data information loss [35,36]. Although comprehensive regional evaluations have been systematically implemented [37], inadequate identification of land use obstacle factors significantly limits the policy applicability of the assessment outcomes [38]. Precise identification of these obstacle factors during land use benefit evaluations is therefore essential for developing targeted land governance strategies.
Henan Province, functioning as a pivotal national grain security base and a critical land–sea intermodal hub within the Belt and Road Initiative framework, holds strategic significance for China’s agricultural sustainability and regional connectivity. As one of China’s top-three provinces in terms of arable land area, Henan faces unique pressure to balance the protection of its massive arable land (critical for national food security) with the development needs of its nearly 100 million people—boasting the highest population density among major arable land provinces. This duality epitomizes the most representative and structurally complex human–land conflicts in China, where intensive human–land interactions have given rise to three systemic challenges. (1) Acute human–land conflict: With a population density of 595 persons/km2—four times the national average—Henan struggles with the paradox of being an arable land giant yet facing scarce per capita land resources, making the high population density and land resource constraints particularly pronounced. (2) Suboptimal urbanization and industrial transition: The lagging urbanization (58.08%, 8.9% below the national level) and industrial path dependence (82% of GDP from traditional/high-energy sectors) result in industrial land productivity at 63% of the eastern provinces’ levels. (3) Land ecological degradation: A high multiple cropping index (1.8 vs. the national average of 1.3) reduces the soil organic matter to 1.2–1.5%, and this degradation is further exacerbated by 3.02 × 10⁴ km2 of eroded land (18.1% of the provincial territory), now approaching natural regeneration thresholds [39,40]. This “high intensity, low efficiency, high risk” highlights the fundamental conflict between the current land utilization model and the goals of sustainable development. There is an urgent need in this region to establish a comprehensive land use benefit evaluation system to analyze the social–ecological–economic trade-offs and identify the main obstacle factors. This will provide a theoretical basis and practical reference for agricultural-dominated regions to achieve institutional compatibility between food security and ecological sustainability.
Thus, this study investigated Henan Province during 2011–2020, a period characterized by rapid urbanization and land use transformation. Indicators were selected from the economic, social, and ecological dimensions. First, the land use benefit across cities in Henan Province was calculated by the entropy method and TOPSIS model, and its spatial–temporal evolution was revealed. Second, by constructing an obstacle degree model, the main obstacle factors that restricted the land use benefit were revealed. Targeted policy recommendations will be proposed to enhance the land use benefit, providing actionable insights for optimizing land governance in agricultural-dominant regions.

2. Materials and Methods
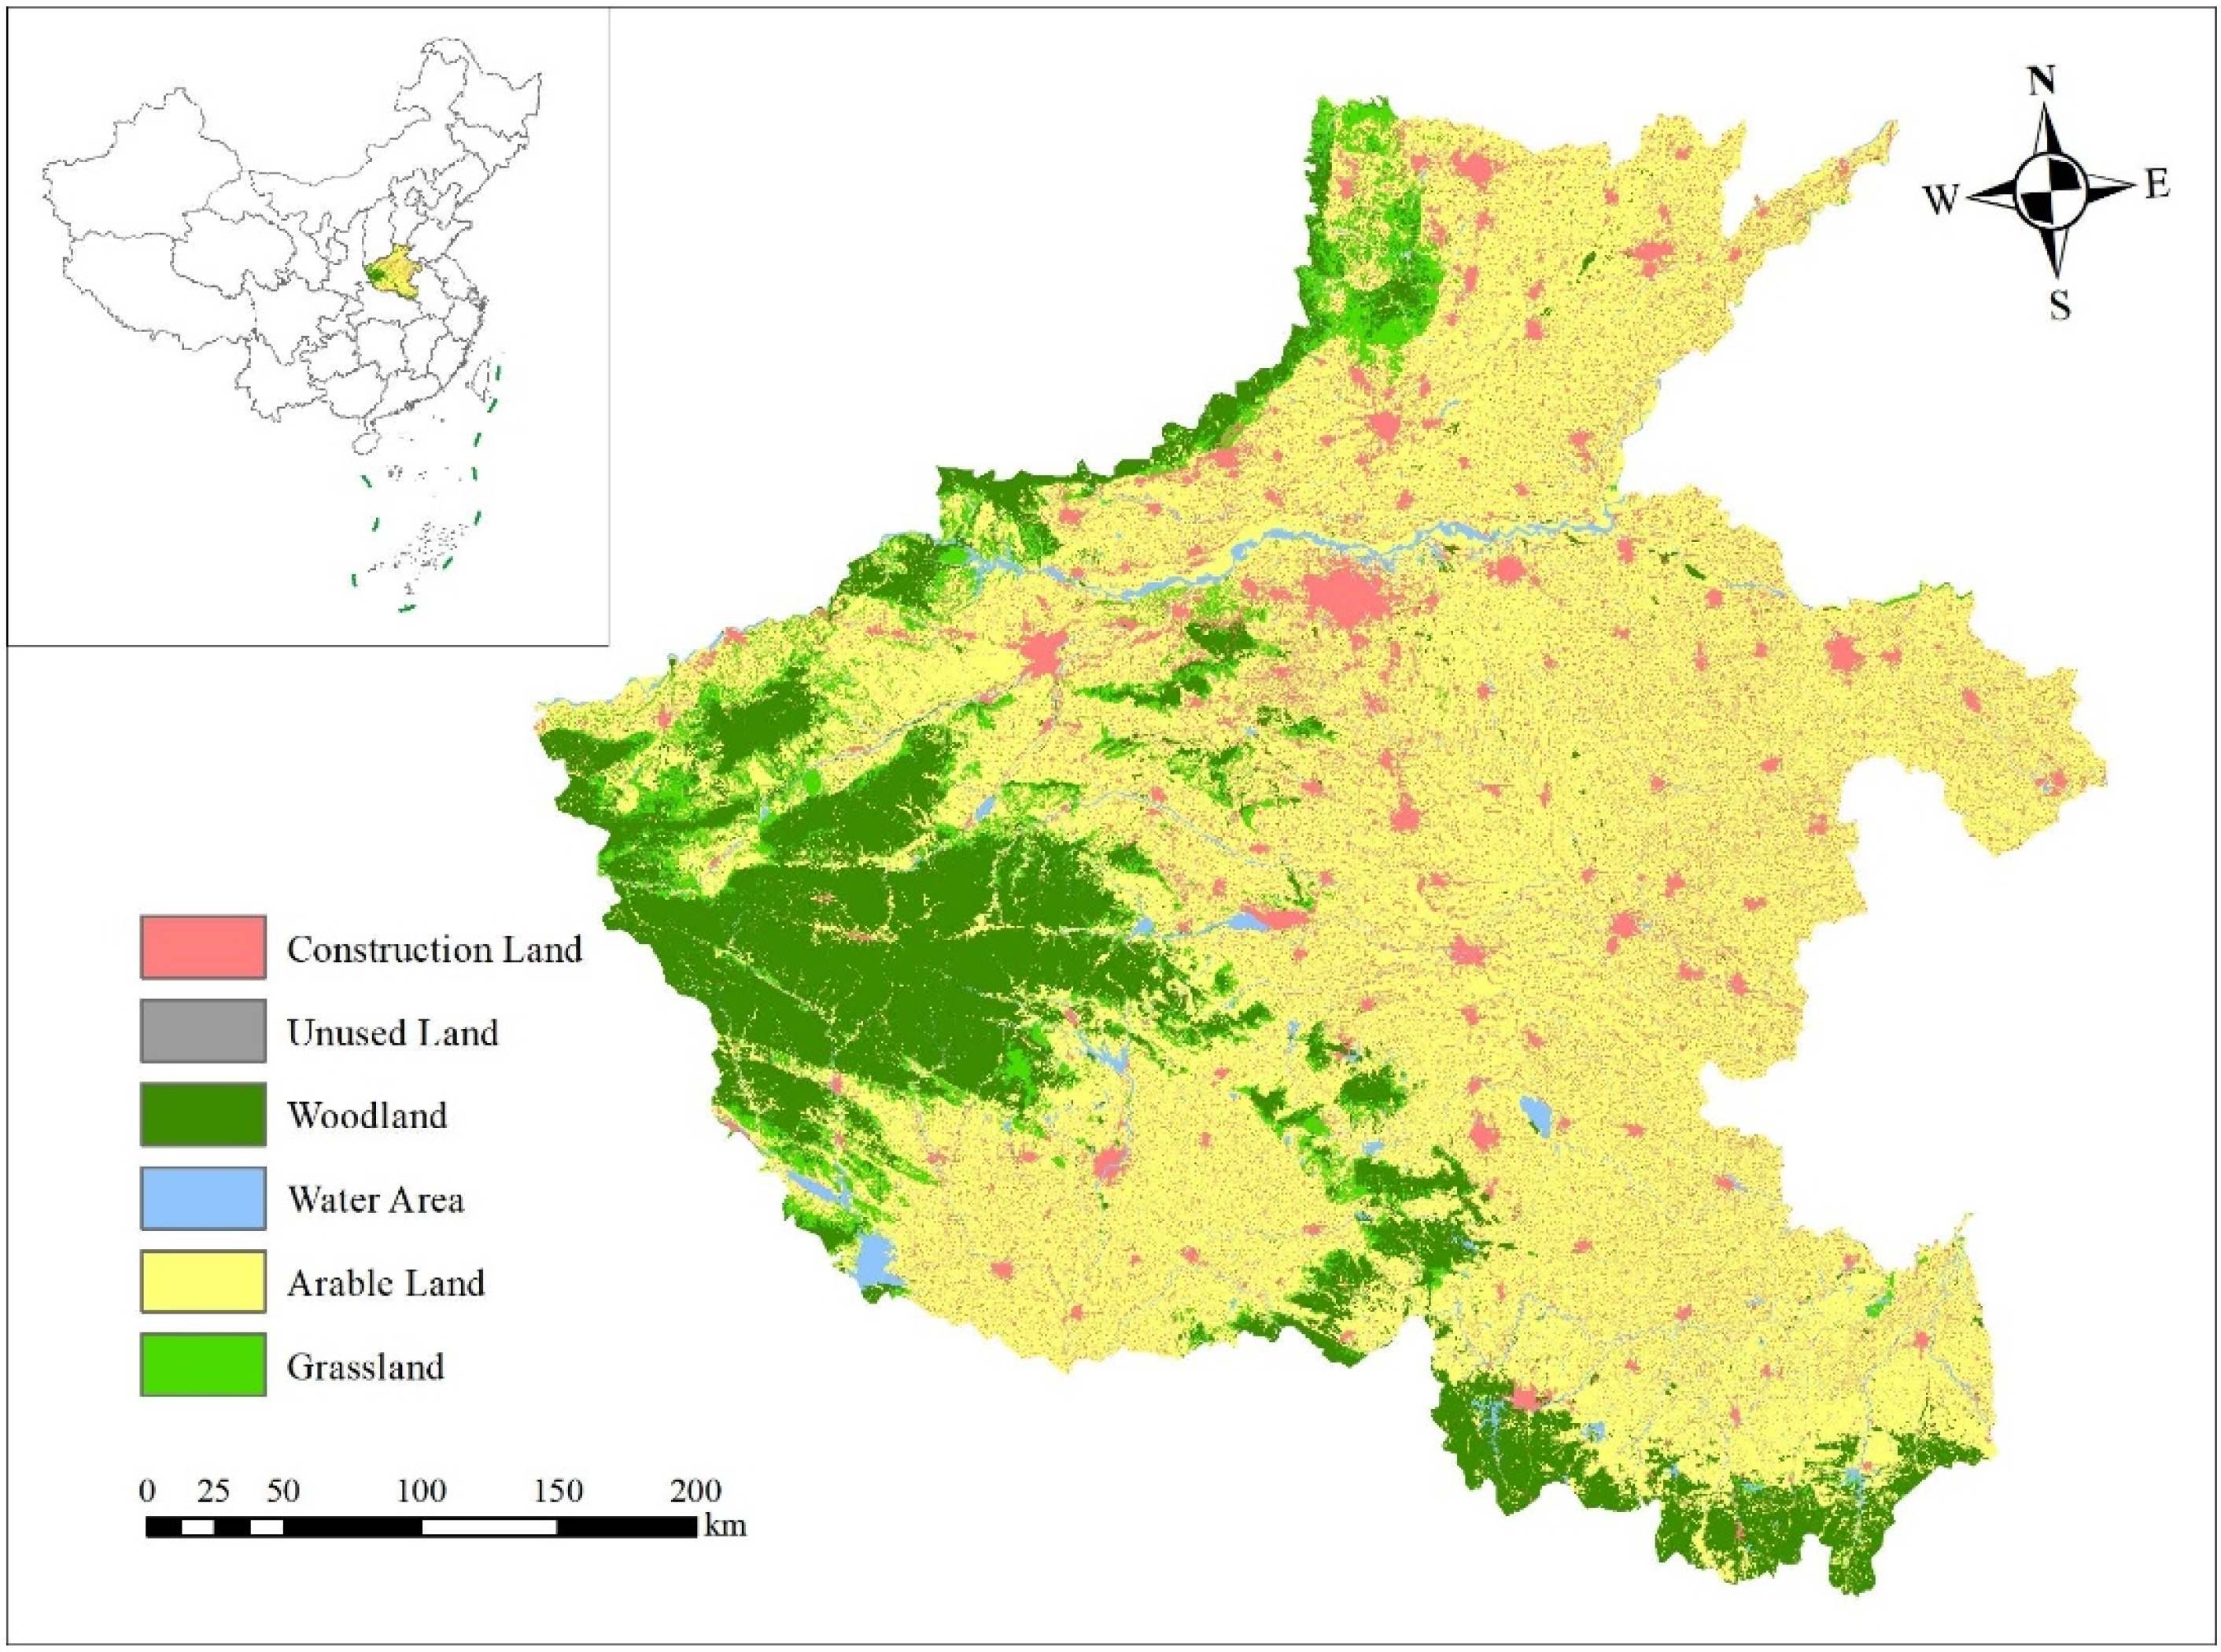
2.1. Study Area

Henan Province, located in east–central China (110°21′–116°39′ E, 31°23′–36°22′ N; Figure 1), has a temperate continental monsoon climate with a mean annual temperature of 12–16 °C and annual precipitation of 600–1200 mm. In 2020, its total land area was 16.57 million hectares, with cultivated land as the dominant land use type (45.35%), followed by woodland (26.53%). The province’s population was 99.41 million (6.9% of the national total), giving a population density of 595 inhabitants per square kilometer—well above the national average of 147. Its urbanization rate (55.43%) was slightly lower than the national average. In 2011–2020, the GDP of Henan Province increased rapidly, with an average annual increase of 7.99%, and increased to CNY 5.43 trillion in 2020. The development of the GDP mainly relies on traditional industries and high-consumption industries, with contributions of 46.2% and 35.8%, respectively. The per capita disposable income was CNY 26.8 thousand, 22.92% below the national average. Ecologically, the province had a per capita urban green space of 14.43 m2 (1.22 m2 below the national average) and suffered significant soil erosion (3.02 × 10⁴ km2, 18.1% of its territory). The proportion of days with excellent air quality (excluding Jiyuan) was 67.0% in 2020, and the centralized treatment rate of the sewage plant reached 97.65%. To sum up, the contradiction between human and land in Henan Province is more prominent, the consumption of industrial development is large, while the centralized sewage treatment rate reaches 97.65%. In summary, Henan Province faces acute human–land contradictions, high industrial resource consumption, and severe pressures on the ecological carrying capacity. Data were primarily sourced from the Henan Statistical Yearbook of 2021 [40].

2.2. Theoretical Foundation

(1)
Sustainable land use theory
The concept of “sustainable development” was proposed in Our Common Future in 1987 [41], which was further reinforced at the United Nations Conference on Environment and Development in 1992. As the ultimate goal of land use benefit research, this theory emphasizes meeting the needs of the present without compromising the ability of future generations to meet their own needs, and it pursues the coordinated unification of economic, social, and ecological benefits [42].
(2)
Human–land relationship coordination theory
Derived from the “possibilism” put forward by French geographers P. Vidal de la Blache and J. Brunhes, this theory holds that humans can selectively utilize resources and interact with nature. Focusing on the balance between human activities and land resources, it serves as a core support for addressing human–land contradictions, with the key concerns including alleviating human–land conflicts, rational land utilization, and improving land use efficiency [43].
(3)
Regional development differentiation theory
Originating from Western regional economics, such as the growth pole theory proposed by F. Perroux in 1950, this theory posits that regions exhibit unbalanced development due to differences in resources, location, and other factors. It provides a theoretical basis for analyzing the spatial differentiation of land use benefits, understanding the root causes of imbalance, and formulating differentiated improvement strategies [33].
(4)
Obstacle factor diagnosis theory
Derived from the law of limiting factors proposed by Blackman in 1905 (stating that limiting factors determine the rate or intensity of biological–physiological processes), this theory offers a methodological basis for identifying the key limiting factors in a system. It locates “shortboards” by quantifying and analyzing the degree of obstacles. In the evaluation of land use benefits, it can identify key bottlenecks restricting the improvement of comprehensive benefits (e.g., specific indicators in the economic, social, or ecological dimensions), providing a scientific basis for targeted policy-making [38].

2.3. Indicator Selection and Description

According to the research objectives, the evaluation indicators were selected from three aspects: economic (X1), social (X2) and ecological (X3). For a region, the land investment intensity and public service provision capacity reflect the economic input level, while the regional economic development, resident income, consumption capacity, and industrial structure transformation reflect the economic output level. Based on this framework, six indicators were chosen to measure the land economic benefits [14,27,29,38,44,45]: GDP per unit land area (X11), fixed asset investment per unit land area (X12), total retail sales of social consumer goods per unit land area (X13), general budget revenue of government finance per unit land area (X14), urban registered unemployment rate (X15) and the proportion of added value of tertiary industry to GDP (X16).
The social benefits of land use are mainly reflected in the improvement of residents’ quality of life and the promotion of social stability and development. Therefore, the per capita road mileage (X21), number of employed people (X22), number of beds in health facilities per thousand people (X23), population density (X24) and income disparity between urban and rural residents (X25) were selected to measure the social benefits of land use [12,33].
The ecological benefits of land use are mainly reflected in the sustainability of land use, which covers three fields, production space, living space, and ecological space, and involves the regional pollution status, pollution treatment capacity, environmental status and so on. Accordingly, we selected the industrial sulfur dioxide emissions (X31), sewage treatment volume (X32), domestic garbage removal volume (X33), per capita park green space area (X34) and green coverage rate of built-up areas (X35) as the evaluation indicators for the land use ecological benefits [23,46,47].
The research period of this paper is from 2011 to 2020 for the following reason: it covers the key stage of China’s urbanization transformation from “speed expansion” to “quality improvement”, which has a unique historical significance. Here, 2011 was the first year of China’s 12th Five-Year Plan, marking the first time that “intensive land use” was included in the core goal at the national level, and a binding target of a 30% reduction in construction land per unit of GDP was proposed. Importantly, 2020 is not only the final year of the 13th Five-Year Plan but also the turning point for the convergence of the poverty alleviation and rural revitalization strategies. Therefore, this timeframe can adequately reflect the long-term dynamics, and the changes in land use benefits in this time period offer strong representative and practical enlightenment.
Data were primarily sourced from the corresponding years of the China Statistical Yearbook (https://www.stats.gov.cn/sj/ndsj/ (accessed on 18 May 2023)) and Henan Statistical Yearbook (http://www.henan.gov.cn/ (accessed on 18 May 2023)). In order to solve the problem of missing data for some indicators in the study, this study comprehensively used trend extrapolation and mean imputation to overcome the problem based on the data distribution characteristics and available auxiliary information. For continuous variables with significant temporal trends or serial correlations, the linear or nonlinear regression model for historical data was used to predict missing values (trend extrapolation). For indicators with relatively stable distribution, the mean value of the index in the complete sample was used as the substitute value (mean imputation method). For example, the 2020 fixed asset investment data for Henan’s cities were estimated using the 2019 values and a five-year (2015–2019) average growth rate, while the sulfur dioxide emissions in Jiyuan City were imputed using the provincial average. These methods may ignore external shocks and structural changes, affecting the overall statistics. However, because the amount of missing data is small, the overall impact is manageable. Descriptive statistics for all the indicators are presented in Table 1.

2.4. Methods

2.4.1. Entropy Weight Method and Calculation of Land Use Benefit

The entropy weight method can quantify indicator importance by calculating the entropy utility values [48]. The core principle is that the determination of the weight of the indicator is entirely based on the discrete degree of the indicator data itself. The greater the dispersion of the index, the smaller the entropy value, and the larger the information utility value, the greater its weight. This method avoids errors from subjective weighting approaches, thereby enhancing the result objectivity. The entropy method used to calculate the land use benefits is as follows.
First, the maximum–minimum value standardization method was used to standardize each index, and the value after processing ( x i j , i represents the sample and j represents the indicator) is between 0 and 1.
The ratio of the value of the indicator j of the sample i to the value of the indicator j of all the samples ( P i j ) was calculated as:
P i j = x i j i = 1 m x i j
The entropy value of indicator j ( e j ) was then calculated as:
e j = 1 ln n i = 1 m P i j ln P i j
The weight of indicator j ( w j ) was calculated as:
w j = 1 e j j = 1 n 1 e j
The weighted sum method was used to calculate the economic, social and ecological benefit of land use ( F i k , k = 1, 2, 3).
F i k = i = 1 m x i j w j
Finally, the values from Equation (4) were substituted into Equations (1)–(3) to calculate the criterion layer weights ( v k ), and the weighted sum method was reapplied to derive the comprehensive land use benefits.

2.4.2. TOPSIS Model

TOPSIS is a classic multi-attribute decision analysis method. The mechanism of the TOPSIS model is to compare and sort samples by calculating the relative distance between the actual value of the sample and the positive and negative ideal solution [47]. The basic principle is based on the geometric distance, and the relative proximity of the calculation scheme to the ideal optimal solution and the ideal worst solution is ranked. Higher relative proximity indicates greater land use benefits. The relative proximity of the economic, social, ecological and comprehensive benefits of land use was calculated as follows.
The indicator matrix of the sample (X) was listed as:
X = x 11 x 1 n x m 1 x m n
Using vector normalization and incorporating the indicator weights, the weighted normalized matrix (D) was derived:
D = d 11 d 1 n d m 1 d m n = w 1 g 11 w 1 g 1 n w n g m 1 w n g m n
where g m n = x i j x i j 2 .
The distances between the sample values were calculated by the following functions:
D i k + = w j × ( d j + x m j ) 2
D i k = w j × ( d j x m j ) 2
where D i k + and D i k represent the positive and negative ideal solutions, respectively.
The relative proximity of each sample’s land use benefit ( C i k ) was calculated as:
C i k = D i k D i k + + D i k
Finally, the land use benefit levels were classified into five grades—Low (L), Medium–Low (M–L), Medium (M), Medium–High (M–H), and High (H)—based on the relative proximity values (Table 2).

2.4.3. Obstruction Model

Following the comprehensive evaluation, this study employed an obstruction model to quantify the obstacle degree of each indicator, thereby identifying the key limiting factors affecting the land use benefits based on their obstacle degrees. The main steps were as follows [46].
The contribution degree of indicator j ( C j ), defined as the product of the indicator weight ( w j ) and criterion layer weight ( v k ), was calculated as:
C j = w j × v k
The deviation of indicator j ( I j ) was calculated as:
I j = 1 x i j
The obstacle degree of indicator j ( O j ) was then calculated as:
O j = C j I j i = 1 n C j I j × 100 %
Summing the obstacle degrees of all the indicators yielded the criterion layer obstacle degree ( U k ):
U k = j = 1 m O j

2.5. Statistical Analysis

A one-way analysis of variance (ANOVA) was performed to assess whether there were significant differences in each category of land use benefits among three typical years, with data from all the cities combined. The statistical analyses were performed using SPSS 24.0 (SPSS, IBM, 2020, Chicago, IL, USA). Graphs were prepared using Origin profession version 2019 (OriginLab, Northampton, MA, USA). A heat map was used to show the change in the obstacle factors in the criterion layer in three typical years for each city in Henan Province. The “ggplot2” package of R, version 4.3.0, was used for the above analyses.

3. Results

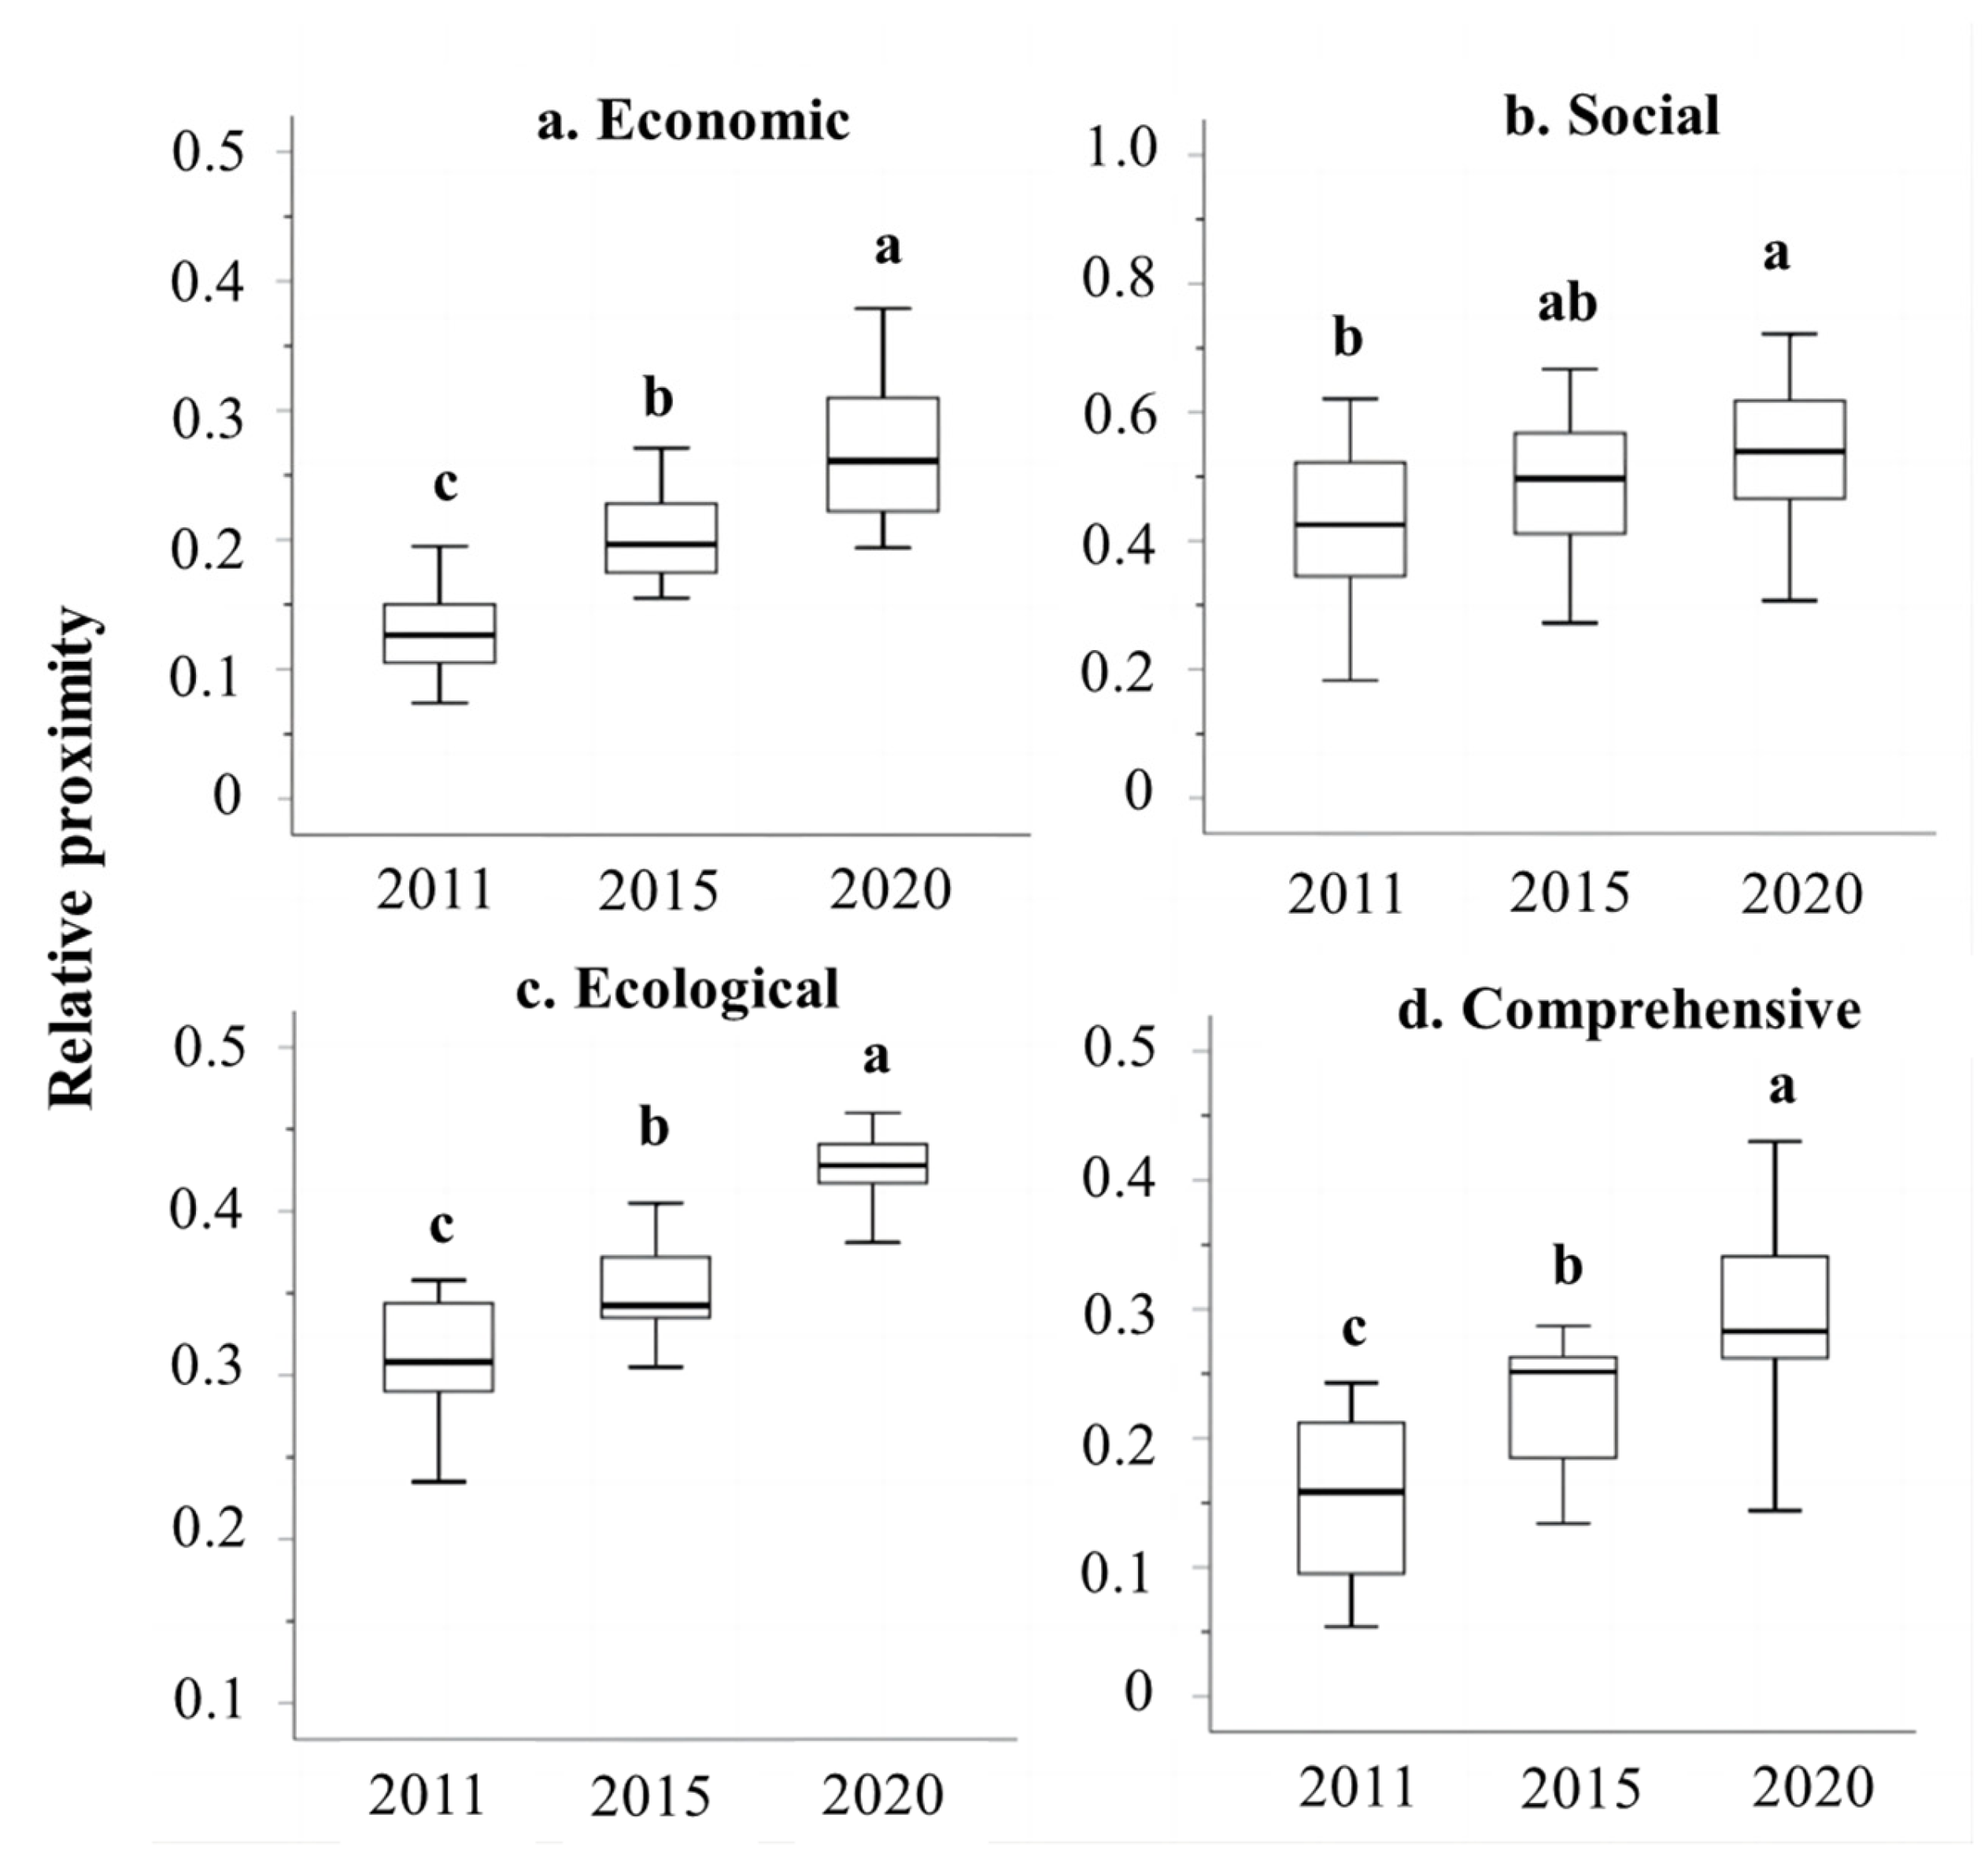
3.1. Temporal Changes in Land Use Benefits

Based on the entropy weight method, the weights of the economic, social and ecological benefits of land use in Henan Province, along with the weights of each index, were calculated. Subsequently, the TOPSIS model was employed to compute the land use benefits. The results showed that the relative proximity of land use’s economic, social and ecological benefits in Henan Province in 2011 was 0.14, 0.43 and 0.32, respectively (Figure 2). The benefit grades were L, M, and M–L, respectively, suggesting that the social benefits were higher than the ecological benefits, which in turn were higher than the economic benefits. Constrained by the economic benefits, the relative proximity of comprehensive land use benefits in Henan Province in 2011 was only 0.17, and the benefit level was L.
From 2011 to 2015, the economic, social and ecological benefits of land use in Henan Province increased by varying degrees, resulting in an increase in the comprehensive benefits. The benefit level increased to M–L, with a relative proximity of 0.24. From 2015 to 2020, the economic, social and ecological benefits of land use continued to improve, and the relative proximity of the comprehensive benefits further increased to 0.32. In general, during 2011–2020, the economic, social, ecological and comprehensive benefits of land use in Henan Province have shown a steady improvement trend. Moreover, it can also be found that the standard deviation of the relative proximity of land use benefits in Henan Province increased by varying degrees, indicating that the imbalance in land use benefits between regions has intensified.

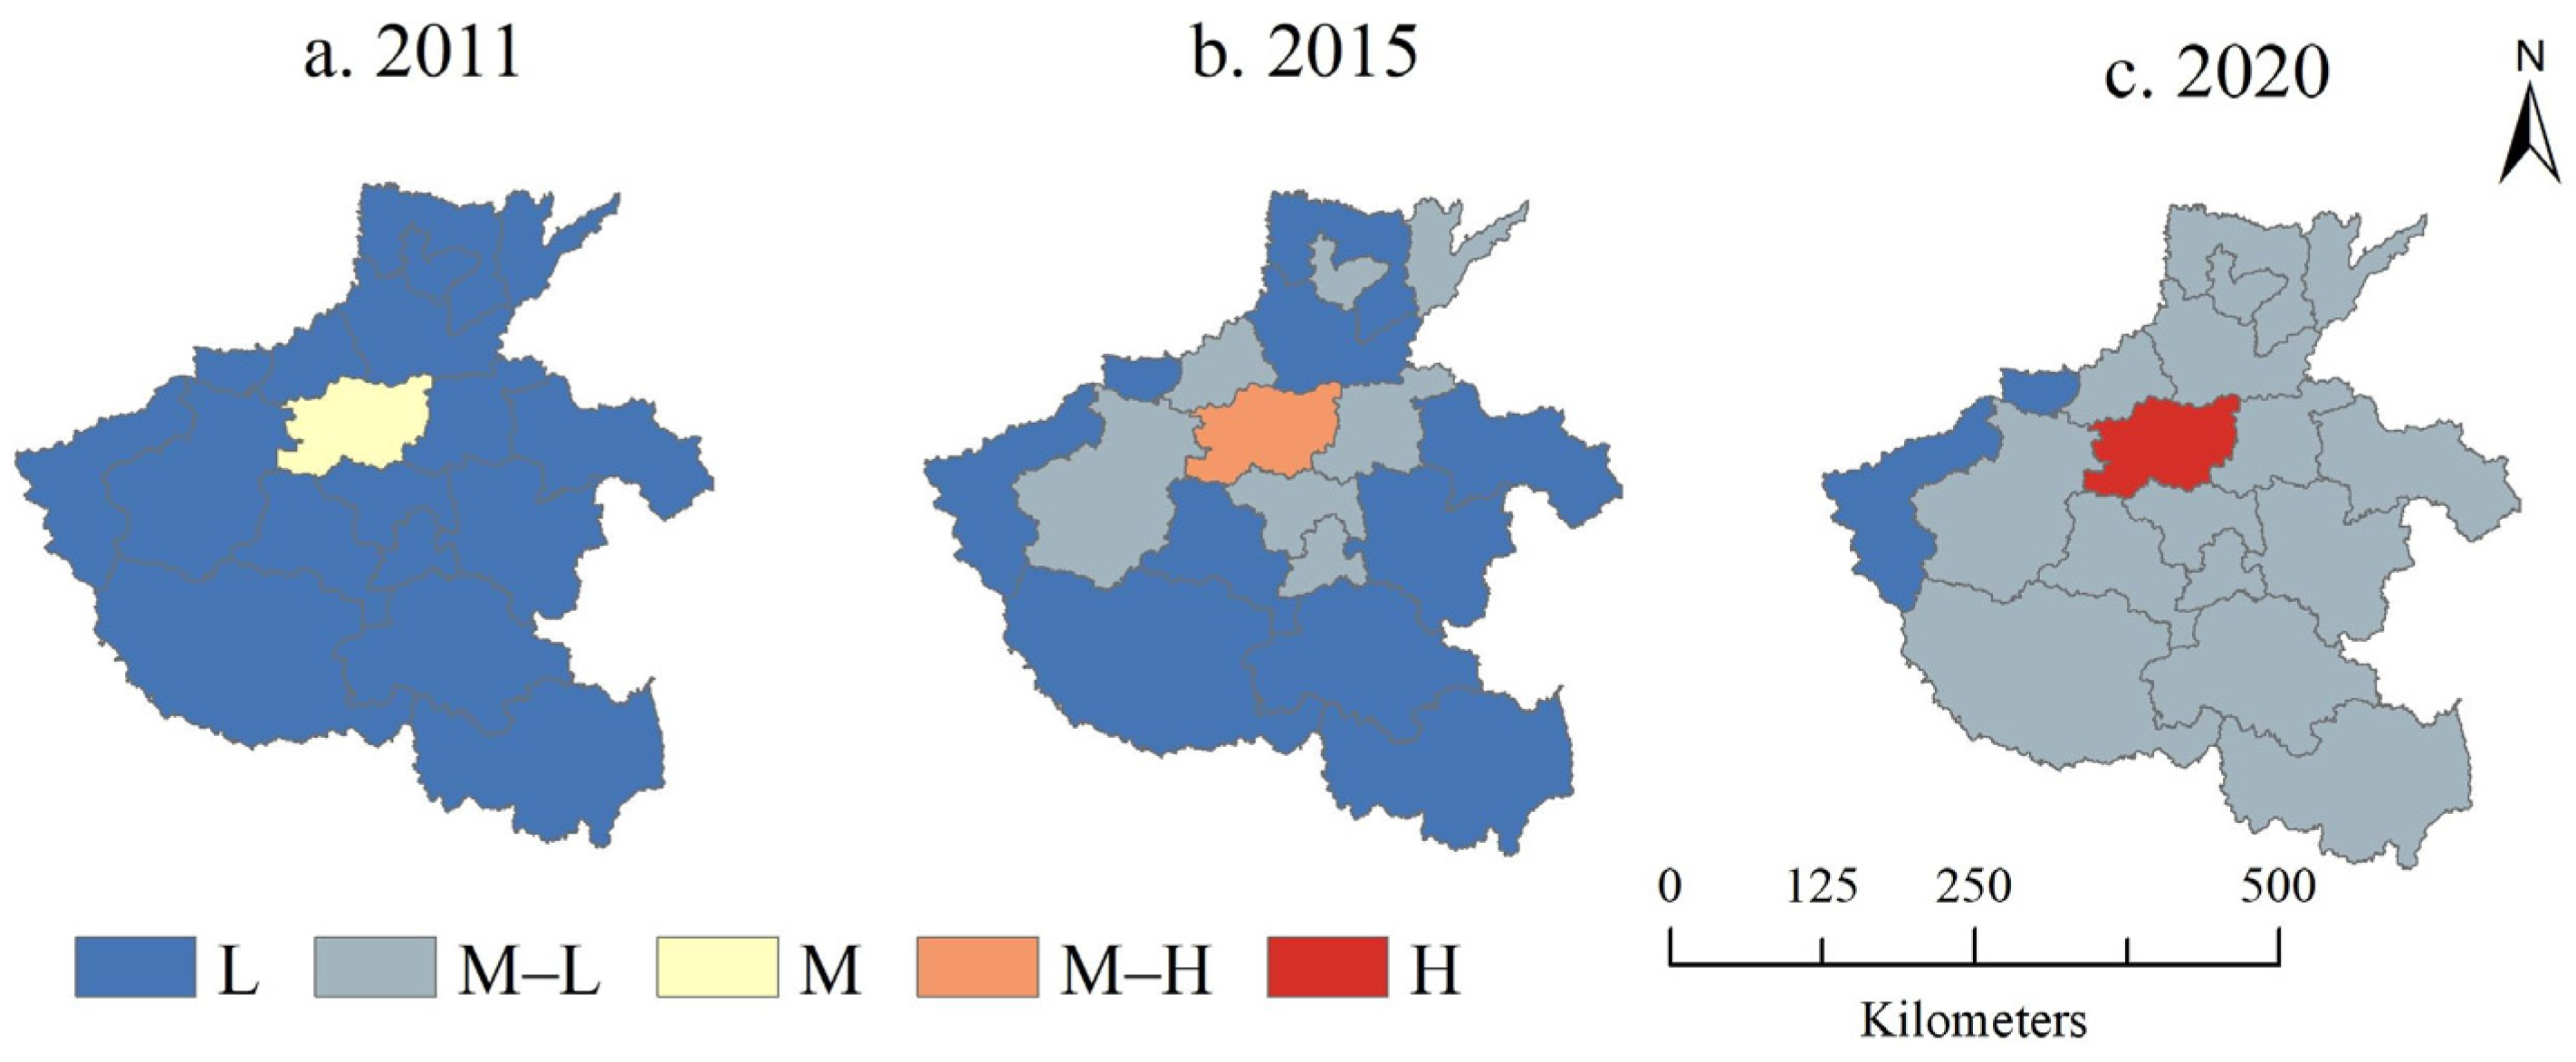
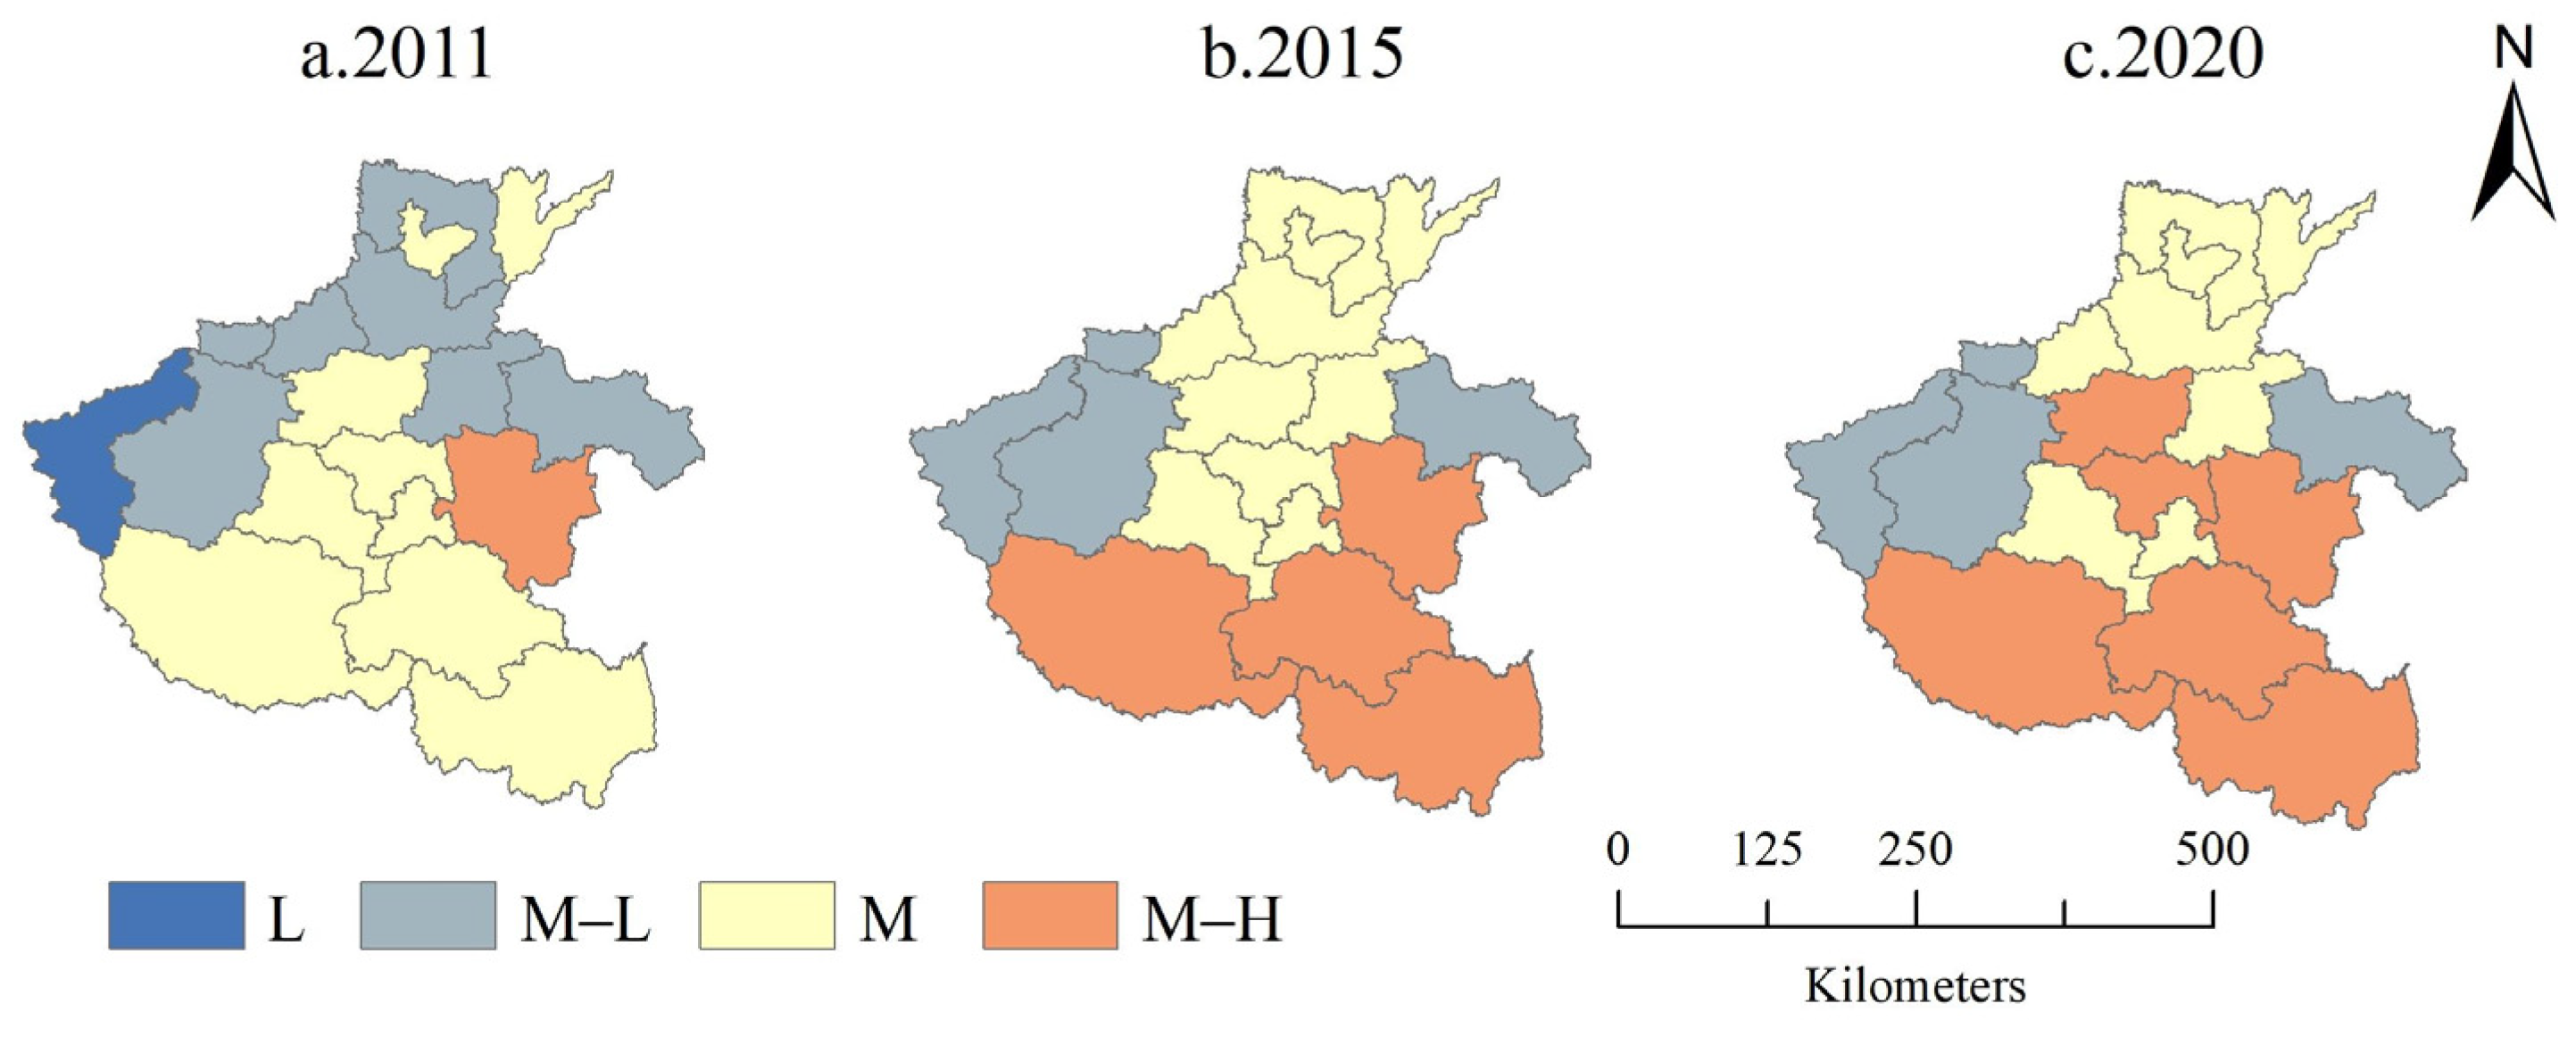
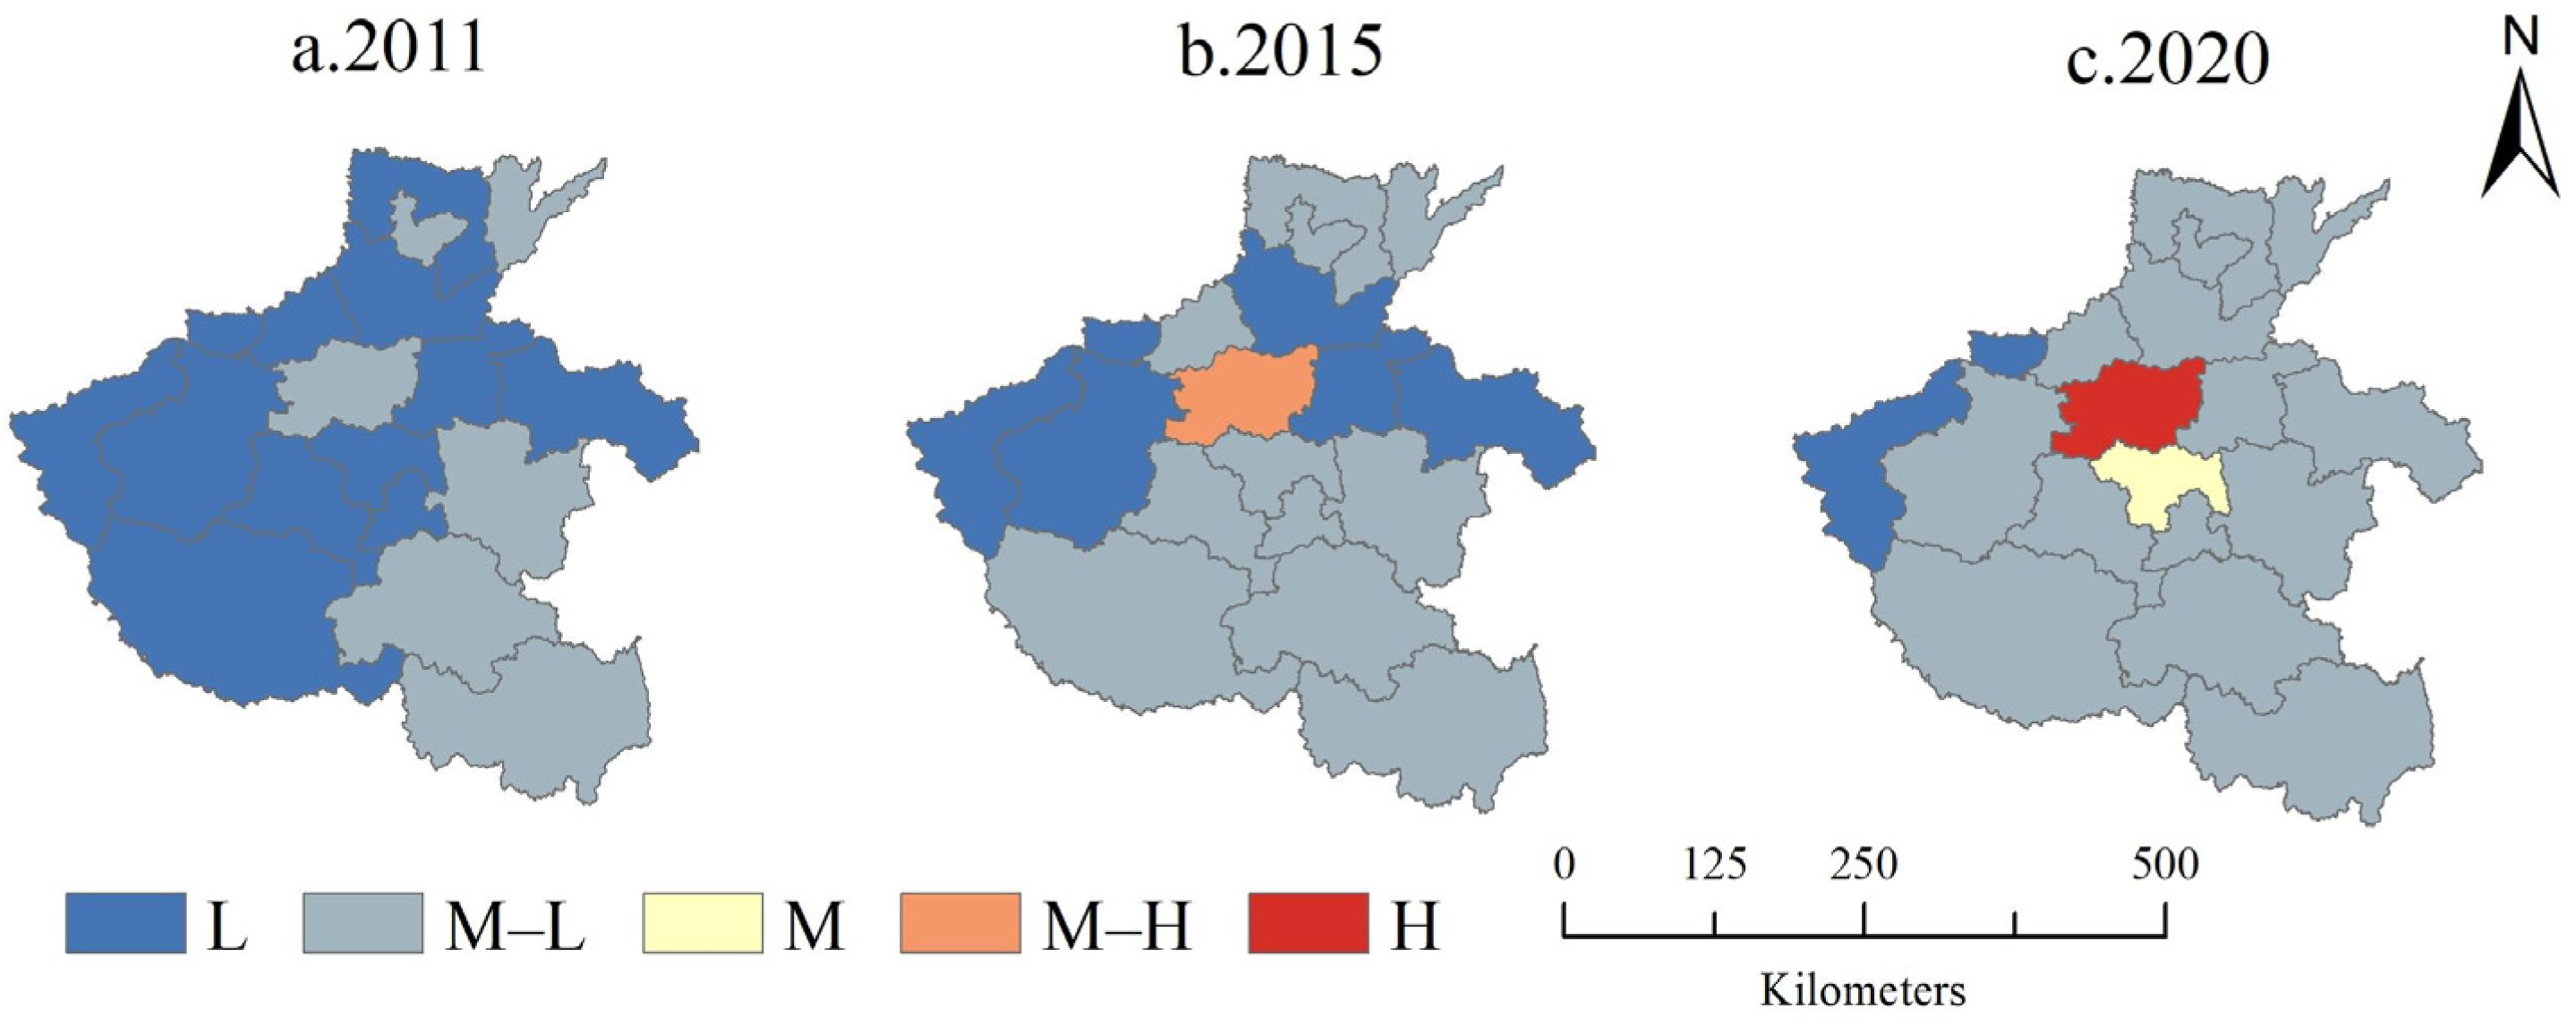
3.2. Spatial Changes in Land Use Benefits

From a spatial perspective, the economic benefits of land use in Henan Province show an obvious distribution pattern of “one city dominant”. Zhengzhou’s land use economic benefits were significantly higher than those of other regions, with the benefits gradually decreasing outward from Zhengzhou as the core (Figure 3). In general, the social land use benefits were higher in the south and lower in the north, and this pattern became more pronounced (Figure 4). The spatial pattern of the land use ecological benefits also follows a “one city dominant” model, with Zhengzhou’s ecological benefits being at least two levels higher than those of other cities, and this disparity was further accentuated (Figure 5). Cities with high comprehensive land use benefits are primarily concentrated in the central region centered on Zhengzhou, followed by the southern and northern regions, with the eastern and western regions trailing. Specifically, the benefits exhibit a gradient of decreasing from the central region to the south, north, east, and west, and this distribution pattern has been further strengthened in the study period (Figure 6).

3.3. Obstacle Factors for Land Use Benefits

In 2011, 2015 and 2020, the mean obstacle degree of the economic factors of land use was 0.63, 0.63 and 0.61; the mean obstacle degree of the social factors was 0.16, 0.15 and 0.18; and the mean obstacle degree of the ecological factors was 0.21, 0.22 and 0.20, respectively (Figure 7). These results indicate that from 2011 to 2020, the primary obstacle factors in relation to land use benefits in Henan Province were economic factors, with obstacle degrees significantly higher than those of the social and ecological factors. Meanwhile, the obstacle degrees of the economic and ecological factors slightly decreased, whereas that of the social factors increased.
Using the obstacle degree model, the obstacle degrees of the land use benefits for each city were calculated. The confidence intervals were set for 0.18–0.2, 0.16–0.18, 0.14–0.16, 0.12–0.14, and 0.1–0.12, and the top five main obstacle factors were determined. The results show that the top five factors were generally consistent across cities, though their rankings varied. Overall, the top-five factors limiting the land use benefits in Henan Province were the general budget revenue of government finance per unit land area (X14), domestic garbage removal volume (X33), total retail sales of social consumer goods per unit land area (X13), fixed asset investment per unit land area (X12) and GDP per unit land area (X11) (Table 3).

4. Discussion

4.1. Causes of Changes in Land Use Benefits

From the analysis results, the comprehensive benefits of land utilization in Henan Province showed a good growth trend, and the social benefits of land use in Henan Province were higher than the ecological and economic benefits. This is closely related to regional development strategies, resource allocation characteristics, and the evolution of social needs. From the perspective of social benefits, Henan Province has always adhered to the people-centered approach, continuously strengthening infrastructure construction, improving social service levels, and promoting the enhancement of land use’s social benefits. From 2011 to 2020, the per capita road mileage increased by 20.8%, the number of hospital beds per thousand people rose by 87.5%, and the urban–rural income gap narrowed by 16.7% [40]. In terms of the ecological benefits, Henan Province has adhered to the green development concept of “lucid waters and lush mountains are invaluable assets” over the study decade. The government accelerated the construction of ecological civilization, continuously carried out comprehensive environmental rectification of heavily polluting industries, and consistently improved the ecological environment quality. From 2011 to 2020, the industrial sulfur dioxide emissions decreased by 95.3%, the sewage treatment rate and domestic waste removal increased by 20.8% and 51.7%, respectively, and the per capita park green space area and built-up area green coverage rate increased by 43.0% and 12.1% [40]. Regarding the economic benefits, after the implementation of the Central Plains Rise Strategy, Henan Province adopted the construction of the Central Plains Economic Zone as its overarching strategy to accelerate regional development. In 2011, the province initiated this economic zone construction, prioritizing development as the foundation for solving all issues and emphasizing economic restructuring. During the study period, the average fixed asset investment tripled, the per capita retail sales of consumer goods and government general budget revenue increased by 1.5 times, and the GDP per unit land area doubled, significantly promoting land use’s economic benefits. However, the relatively lagging characteristics of the economic benefits are manifested as follows: despite a 9.2% increase in the tertiary industry proportion, the GDP output per unit construction land remains only 58% of the average level in Yangtze River Delta cities [49]. Moreover, the reliance on land finance consistently exceeded 60% [40], a ratio notably higher than that of other central provinces with similar development scales—for instance, Shandong and Shanxi reported average land finance dependence of 38.7% and 33.4%, respectively, in 2020 [50]. This discrepancy highlights Henan’s stronger reliance on land-centered revenue models compared to its regional peers, partly stemming from its heavier burden of balancing agricultural protection (as a major grain-producing province) and urbanization funding gaps. The benefits gradient in this study not only demonstrates the progress of the people-centered urbanization approach in the Central Plains Economic Zone but also highlights the institutional path dependencies hindering the transition from the conventional to the high-quality development paradigm.
The significant spatial heterogeneity in land use benefits in Henan Province was clarified in our study. This variation can be primarily attributed to regional disparities in economic endowments, policy frameworks, and resource allocation. The Zhengzhou-centered metropolitan area possesses distinct locational advantages, attracting capital, enterprises, and human resources. Consequently, this has accelerated land use intensification and economic growth while enhancing living standards and ecological quality. Southern Henan is primarily agricultural, characterized by high-intensity land use. With lower population density, southern cities face less pressure in meeting social security and infrastructure demands compared to their northern counterparts. Hebi, a key industrial hub in northern Henan, has experienced robust growth through integration with the Beijing–Tianjin–Hebei urban agglomeration. In contrast, eastern Henan, constrained by limited industrial resources and high population density, exhibits slower growth in the land use economic output. Luoyang in western region has both historical and cultural resources and industrial resources, with relatively robust economic development. However, Sanmenxia and Jiyuan, also located in western Henan, exhibit low land use benefits due to the industrial structure homogeneity, falling resource prices, and extensive land management. In addition, land use generates positive spillover effects: cities with high land use benefits can significantly stimulate the development of surrounding areas and enhance their comprehensive land use benefits. Consequently, the land use benefit in Henan Province exhibits a distinct “single-core dominance” pattern, characterized by a gradual decline from the central metropolis to peripheral areas in both the north–south and east–west directions.

4.2. Analysis of Obstacle Degree of Indicators

The main obstacles to land use benefits in Henan Province are economic factors. From the various indicators of the land use benefit obstacles, four out of the top-five indicators are economic factors. The general budget revenue of government finance and the amount of domestic garbage removal are the main factors affecting the level of land use benefit in Henan Province. First, due to the relatively low financial self-sufficiency rate and poor regional linkage, the investment in public services is low, and the gap between urban and rural fiscal revenue is too large. This hinders the improvement of land use benefit. Meanwhile, the inadequate sanitation equipment quantity and poor equipment quality in some cities weaken the environmental governance capabilities, disrupting the coordination between urban sanitation and economic development and further limiting efficiency gains. The third indicator is the total retail sales of consumer goods per unit land area, which reflects the regional economic vitality. Although its proportion has increased since 2011, the growth rate of urban–rural living consumption and public spending still lags behind economic development. The fourth indicator, the average investment in fixed assets, reveals imbalanced investment structures in Henan Province, directly impacting land use benefits. The last indicator, the GDP per unit land area, highlights persistent gaps in economic development levels and growth rates, underscoring the need to prioritize high-quality economic transformation.
Regional comparisons show that Zhengzhou’s economic and social obstacle intensity fluctuates more drastically than that of other Henan cities, whose dynamics remain relatively stable. This suggests provincial-level obstacle patterns are primarily driven by Zhengzhou’s role as the core of the Central Plains Urban Agglomeration and a national strategic hub under the Airport Economy Zone initiative [51]. Further analysis of Zhengzhou’s land use benefits reveals that during the rapid development period of land utilization from 2011 to 2020, the primary obstacle factors shifted from the economic to social dimensions, followed by ecological considerations. This transitional phase was characterized by rapid urbanization that induced substantial population migration, leading to exponentially growing demands for public services (particularly in terms of housing, transportation, education, and healthcare sectors), which revealed imbalances in land resource allocation. Simultaneously, improved living standards generated more diverse societal needs, including higher expectations for ecological conservation, public space quality, and cultural preservation, thereby necessitating a fundamental transition from single-dimensional economically driven land utilization to integrated multifunctional land use optimization [52]. Furthermore, systemic inefficiencies in the land resource allocation emerged, manifesting as (1) persistent regional development gaps, (2) inadequate stakeholder coordination mechanisms, and (3) socio-spatial inequities exemplified by inadequate resident rights protection during urban renewal and infrastructure deficits in urban–rural fringe areas. These structural constraints collectively amplified the negative impacts of social dimensions on the land use benefit. Despite robust economic growth, this transition has resulted in suboptimal land use outcomes (e.g., 46% lower industrial productivity than the national average) [53] and infrastructure gaps, highlighting the urgent need to institutionalize a tripartite governance framework that simultaneously addresses economic competitiveness, social inclusion and ecological resilience. For other cities, economic factors are still the primary barriers to land use benefits. Therefore, promoting economic development is still their primary task to improve the land use benefit.

4.3. Comparisons with Existing Studies and Research Limitations

In this study, we employed the entropy weight method and TOPSIS model to evaluate the land use benefits of cities in Henan Province from 2011 to 2020, and we constructed an obstacle degree model to identify the primary limiting factors affecting efficient land use. Approved by similar evaluation studies, the selection of these methods is justified by their wide application in land use benefit assessment due to their objectivity in terms of weight determination (entropy weight method) and effectiveness in multi-criteria decision-making (TOPSIS model) [36,38]. Combined with the use of official statistical data (e.g., Henan Statistical Yearbook), the methodological rigor and data reliability enhance the scientific credibility of the results.
Although our findings indicate a steady improvement in Henan’s land use benefits over the past decade, there remains substantial room for improvement when compared with developed regions of China. For instance, Zhejiang Province has adopted an evaluation system centered on the input–output efficiency of construction land, leveraging market-oriented mechanisms to significantly boost industrial land performance—its industrial land tax revenue per unit area is 2.6 times that of Henan [54]. Similarly, Jiangsu Province has promoted mixed industrial land use policies, raising the plot ratio to 4.0, whereas comparable pilot projects in Zhengzhou (Henan) have only achieved a plot ratio of 2.5 [55].
From an international perspective, the Ruhr region in Germany offers a notable example of transforming industrial wastelands into multifunctional landscape parks through ecological restoration and cultural integration. This strategy not only rehabilitates degraded ecosystems but also integrates design, cultural, and tourism functions, fostering mixed-use industrial land development and substantially improving the land use benefits [56]. In contrast, Henan’s industrial wastelands remain underutilized, with limited functional diversification. For agricultural land, the Brazilian Cerrado—a rainfed agricultural region analogous to Henan—has effectively enhanced the agricultural land efficiency through reduced tillage frequency and legume-based nitrogen fixation [57]. Drawing parallels, Henan’s agricultural land currently faces the challenges of soil compaction and declining ecological benefits, suggesting potential to adopt Brazil’s model of conservation tillage combined with precision fertilization.
Overall, optimizing the land use benefits in Henan requires integrating domestic best practices and international experiences, while also aligning with its dual positioning as a major grain-producing area and an emerging industrial hub. However, a notable limitation of this study is that it does not explicitly incorporate the direct impacts of key land use policies—particularly the cultivated land protection redline and ecological protection redline—into the analysis of land use benefits. The cultivated land protection redline, established in 2006 as a legally binding target to safeguard 1.8 billion mu of arable land [58], imposes stringent constraints on land conversion in Henan, a major grain-producing province, potentially limiting the flexibility of land allocation for economic development. Similarly, the ecological protection redline, formally introduced in 2017 to demarcate critical ecological zones, further regulates land use within ecologically sensitive areas of the province [59]. These dual policy redlines undoubtedly shape the trade-offs between agricultural security, ecological preservation, and economic gains in land utilization. However, due to the complexity of quantifying their policy effects and data constraints regarding the intensity of regional policy implementation, this study has not fully unpacked how these redlines directly influence the observed patterns of the comprehensive, social, ecological, and economic benefits of land use in Henan. Future research could integrate policy instruments (e.g., ecological compensation mechanisms) into the analytical framework to better disentangle the policy-driven impacts on land use benefits.

5. Conclusions and Implications

This study analyzed the land use benefits in Henan Province (2011–2020) using the entropy method, TOPSIS model, and obstacle degree model. The key findings include the following. (1) Between 2011 and 2020, the economic, social, ecological, and comprehensive land use benefits exhibited steady growth, with the social benefits consistently surpassing the ecological and economic dimensions. A “single-city dominance” pattern emerged, with the benefits declining gradually from the central region (led by Zhengzhou) to the south–north–east–west peripheries, a trend further reinforced over time. (2) The obstacle factor to land use benefit in Henan Province is mainly the economic factor, and the obstacle degree is significantly higher than that of the social and ecological factors. The main obstacle indicators were the general budget revenue of government finance per unit land area, domestic garbage removal volume, total retail sales of social consumer goods per unit land area, fixed asset investment per unit land area and the GDP per unit land area.
This study’s findings suggest several policy implications. First, given that economic factors dominate the obstacles to land use benefits, targeted measures are required. Strengthen the agglomeration of high value-added industries (e.g., advanced manufacturing, digital economy) in Zhengzhou to leverage its “single core” radiation effect, thereby improving the land-based economic indicators. For peripheral regions such as the eastern and western areas, compensate for the insufficient fixed asset investment per unit land by developing infrastructure-linked industrial clusters, aiming to narrow the “center periphery” gap. Explore financing models suitable for an agricultural province to reduce reliance on land finance and enhance the government fiscal revenue per unit land.
Second, utilizing the characteristics of the leading social benefits and growing ecological benefits. Integrate high-quality social services (e.g., healthcare, education) in southern Henan with agricultural modernization, such as upgrading agricultural product logistics, to increase the total retail sales of social consumer goods per unit land. Promote ecological practices, including pollution control and green space construction, and establish ecological compensation mechanisms in sensitive areas to reward low pollution and high output industries, achieving coordinated improvement of ecological and economic benefits.
Third, in response to the “single-city dominance” and regional imbalance, implement a “core–periphery linkage” strategy to promote the transfer of land-intensive industries from Zhengzhou to surrounding areas, improving the fixed asset investment per unit land in peripheral regions. Based on regional characteristics, advance industrial upgrading in northern Henan to raise the GDP per unit land, develop high-efficiency agriculture in southern Henan, and leverage resources in eastern and western Henan to develop low land consumption tourism, thereby alleviating the economic obstacles in a targeted manner.

Author Contributions

Conceptualization, F.X. and Y.X.; methodology, F.X. and Y.X.; software, F.X. and Y.X.; validation, Y.C.; formal analysis, F.X. and Y.X.; investigation, F.X. and Y.X.; resources, F.X. and Y.X.; data curation, F.X. and Y.X.; writing—original draft preparation, F.X. and Y.X.; writing—review and editing, S.L. and Y.C.; visualization, F.X. and Y.X.; supervision, F.X.; project administration, F.X.; funding acquisition, F.X. and Y.X. All authors have read and agreed to the published version of the manuscript.

Funding

This work was supported by the Tianjin College Students Entrepreneurship Training Program, funder Yiwei Xu, funding number 202210069022.

Institutional Review Board Statement

Not applicable.

Informed Consent Statement

Not applicable.

Data Availability Statement

The dataset associated with this study is available upon request to the corresponding author.

Conflicts of Interest

The authors declare no conflicts of interest.

References

  1. Karp, D.S.; Tallis, H.; Sachse, R.; Halpern, B.; Thonicke, K.; Cramer, W.; Mooney, H.; Polasky, S.; Tietjen, B.; Waha, K.; et al. National Indicators for Observing Ecosystem Service Change. Glob. Environ. Change 2015, 35, 12–21. [Google Scholar] [CrossRef]
  2. Chandra Voumik, L.; Sultana, T. Impact of Urbanization, Industrialization, Electrification and Renewable Energy on the Environment in BRICS: Fresh Evidence from Novel CS-ARDL Model. Heliyon 2022, 8, e11457. [Google Scholar] [CrossRef]
  3. Lin, B.; Zhu, J. Energy and Carbon Intensity in China during the Urbanization and Industrialization Process: A Panel VAR Approach. J. Clean. Prod. 2017, 168, 780–790. [Google Scholar] [CrossRef]
  4. Li, W.; An, M.; Wu, H.; An, H.; Huang, J.; Khanal, R. The Local Coupling and Telecoupling of Urbanization and Ecological Environment Quality Based on Multisource Remote Sensing Data. J. Environ. Manag. 2023, 327, 116921. [Google Scholar] [CrossRef] [PubMed]
  5. Zhao, J.; Chen, W.; Liu, Z.; Liu, W.; Li, K.; Zhang, B. Urban Expansion, Economic Development, and Carbon Emissions: Trends. Patterns, and Decoupling in Mainland China ’ s Provincial. Ecol. Indic. 2024, 169, 112777. [Google Scholar] [CrossRef]
  6. Song, M.; An, M.; He, W.; Wu, Y. Research on Land Use Optimization Based on PSO-GA Model with the Goals of Increasing Economic Benefits and Ecosystem Services Value. Sustain. Cities Soc. 2025, 119, 106072. [Google Scholar] [CrossRef]
  7. Jiang, L.; Bao, A.; Jiapaer, G.; Liu, R.; Yuan, Y.; Yu, T. Monitoring Land Degradation and Assessing Its Drivers to Support Sustainable Development Goal 15.3 in Central Asia. Sci. Total Environ. 2022, 807, 150868. [Google Scholar] [CrossRef]
  8. Peng, K.; Jiang, W.; Wang, X.; Hou, P.; Wu, Z.; Cui, T. Evaluation of Future Wetland Changes under Optimal Scenarios and Land Degradation Neutrality Analysis in the Guangdong-Hong Kong-Macao Greater Bay Area. Sci. Total Environ. 2023, 879, 163111. [Google Scholar] [CrossRef]
  9. Da Silva, M.V.; Pandorfi, H.; de Oliveira-Júnior, J.F.; da Silva, J.L.B.; de Almeida, G.L.P.; de Montenegro, A.A.A.; Mesquita, M.; Ferreira, M.B.; Santana, T.C.; Marinho, G.T.B.; et al. Remote Sensing Techniques via Google Earth Engine for Land Degradation Assessment in the Brazilian Semiarid Region, Brazil. J. S. Am. Earth Sci. 2022, 120, 104061. [Google Scholar] [CrossRef]
  10. Liu, H.; Soares-Filho, B.S.; Leite-Filho, A.T.; Zhang, S.; Du, J.; Yi, Y. How to Balance Land Demand Conflicts to Guarantee Sustainable Land Development. iScience 2023, 26, 106641. [Google Scholar] [CrossRef]
  11. Shi, Y.; Feng, C.C.; Yu, Q.; Han, R.; Guo, L. Contradiction or Coordination? The Spatiotemporal Relationship between Landscape Ecological Risks and Urbanization from Coupling Perspectives in China. J. Clean. Prod. 2022, 363, 132557. [Google Scholar] [CrossRef]
  12. Wu, K.; Wang, D.; Lu, H.; Liu, G. Temporal and Spatial Heterogeneity of Land Use, Urbanization, and Ecosystem Service Value in China: A National-Scale Analysis. J. Clean. Prod. 2023, 418, 137911. [Google Scholar] [CrossRef]
  13. Kruseman, G.; Ruben, R.; Kuyvenhoven, A.; Hengsdijk, H.; Van Keulen, H. Analytical Framework for Disentangling the Concept of Sustainable Land Use. Agric. Syst. 1996, 50, 191–207. [Google Scholar] [CrossRef]
  14. Yang, X.; Wu, Y.; Dang, H. Urban Land Use Efficiency and Coordination in China. Sustainability 2017, 9, 410. [Google Scholar] [CrossRef]
  15. Song, W.; Cao, S.; Du, M.; Lu, L. Distinctive Roles of Land-Use Efficiency in Sustainable Development Goals: An Investigation of Trade-Offs and Synergies in China. J. Clean. Prod. 2023, 382, 134889. [Google Scholar] [CrossRef]
  16. Cao, W.; Zhou, W.; Wu, T.; Wang, X.; Xu, J. Spatial-Temporal Characteristics of Cultivated Land Use Eco-Efficiency under Carbon Constraints and Its Relationship with Landscape Pattern Dynamics. Ecol. Indic. 2022, 141, 109140. [Google Scholar] [CrossRef]
  17. Rabbinge, R.; Van Diepen, C.A. Changes in Agriculture and Land Use in Europe. Eur. J. Agron. 2000, 13, 85–99. [Google Scholar] [CrossRef]
  18. Wang, B.; Oguchi, T.; Liang, X. Evaluating Future Habitat Quality Responding to Land Use Change under Different City Compaction Scenarios in Southern China. Cities 2023, 140, 104410. [Google Scholar] [CrossRef]
  19. Karrasch, L.; Klenke, T.; Kleyer, M. Land-Use Elements and Attributed Ecosystem Services: An Archetype Approach to Land-Use Evaluation at the German North Sea Coast. Ecol. Soc. 2019, 24, 13. [Google Scholar] [CrossRef]
  20. Geng, Y.; Li, X.; Chen, J. Integration of Land Use Resilience and Efficiency in China : Analysis of Spatial Patterns, Differential Impacts on SDGs, and Adaptive Management Strategies. Appl. Geogr. 2025, 175, 103490. [Google Scholar] [CrossRef]
  21. Xiao, Y.; Zhong, J.L.; Zhang, Q.F.; Xiang, X.; Huang, H. Exploring the Coupling Coordination and Key Factors between Urbanization and Land Use Efficiency in Ecologically Sensitive Areas: A Case Study of the Loess Plateau, China. Sustain. Cities Soc. 2022, 86, 104148. [Google Scholar] [CrossRef]
  22. Guo, Z.; Zhang, J.; Fan, J.; Yang, X.; Yi, Y.; Han, X.; Wang, D.; Zhu, P.; Peng, X. Does Animal Manure Application Improve Soil Aggregation? Insights from Nine Long-Term Fertilization Experiments. Sci. Total Environ. 2019, 660, 1029–1037. [Google Scholar] [CrossRef] [PubMed]
  23. Qian, L.; Yi, H.; Shen, M.; Wang, M. Coupling Coordination and Spatio-Temporal Evolution of Land-Use Benefits under the Dual Carbon Goal: A Case Study in Anhui, China. Sci. Total Environ. 2023, 903, 166123. [Google Scholar] [CrossRef] [PubMed]
  24. Yiğit Uzunali, Ş.; Berberoğlu, S. Agricultural Land Suitability Analysis with Parametric and Nonparametric Techniques: The Case of Büyük Menderes River Basin, Türkiye. Comput. Electron. Agric. 2025, 229, 109754. [Google Scholar] [CrossRef]
  25. Chen, S.Y.; Liu, Y.L.; Chen, C.F. Evaluation of Land-Use Efficiency Based on Regional Scale—A Case Study in Zhanjiang, Guangdong Province. J. China Univ. Min. Technol. 2007, 17, 215–219. [Google Scholar] [CrossRef]
  26. lo Storto, C.; Evangelista, P. Infrastructure Efficiency, Logistics Quality and Environmental Impact of Land Logistics Systems in the EU: A DEA-Based Dynamic Mapping. Res. Transp. Bus. Manag. 2023, 46, 100814. [Google Scholar] [CrossRef]
  27. Li, Q.; Wei, J.; Gao, W. Spatial Differentiation and Influencing Factors of Land Eco-Efficiency Based on Low Carbon Perspective: A Case of 287 Prefecture-Level Cities in China. Environ. Chall. 2023, 10, 100681. [Google Scholar] [CrossRef]
  28. Kuang, B.; Lu, X.; Zhou, M.; Chen, D. Provincial Cultivated Land Use Efficiency in China: Empirical Analysis Based on the SBM-DEA Model with Carbon Emissions Considered. Technol. Forecast. Soc. Change 2020, 151, 119874. [Google Scholar] [CrossRef]
  29. Gao, J.; Song, J.; Wu, L. A New Methodology to Measure the Urban Construction Land-Use Efficiency Based on the Two-Stage DEA Model. Land Use Policy 2022, 112, 105799. [Google Scholar] [CrossRef]
  30. Xiang, S.; Zhou, M.; Huang, L.; Shan, L.; Wang, K. Assessing the Dynamic Land Utilization Efficiency and Relevant Driving Mechanism in In-Situ Urbanized Rural Areas: A Case Study of 1979 Administrative Villages in Hangzhou. Environ. Impact Assess. Rev. 2023, 101, 107111. [Google Scholar] [CrossRef]
  31. He, T.; Song, H. A Novel Approach to Assess the Urban Land-Use Efficiency of 767 Resource-Based Cities in China. Ecol. Indic. 2023, 151, 110298. [Google Scholar] [CrossRef]
  32. Li, X.; Lei, L.; Li, J. Integrating Ecosystem Service Value into the Evaluation of Sustainable Land Use in Fast-Growing Cities: A Case Study of Qingdao, China. Ecol. Indic. 2023, 153, 110434. [Google Scholar] [CrossRef]
  33. He, W.; Yang, J.; Li, X.; Sang, X.; Xie, X. Research on the Interactive Relationship and the Optimal Adaptation Degree between Land Use Benefit and Industrial Structure Evolution: A Practical Analysis of Jiangsu Province. J. Clean. Prod. 2021, 303, 127016. [Google Scholar] [CrossRef]
  34. Ruan, L.; He, T.; Xiao, W.; Chen, W.; Lu, D.; Liu, S. Measuring the Coupling of Built-up Land Intensity and Use Efficiency: An Example of the Yangtze River Delta Urban Agglomeration. Sustain. Cities Soc. 2022, 87, 104224. [Google Scholar] [CrossRef]
  35. Peng, W.; Sun, Y.; Li, Y.; Yuchi, X. An Evaluation and Promotion Strategy of Green Land Use Benefits in China: A Case Study of the Beijing-Tianjin-Hebei Region. Land 2022, 11, 1158. [Google Scholar] [CrossRef]
  36. Zhang, Y.; Zhang, Y.; Zhang, H.; Zhang, Y. Evaluation on New First-Tier Smart Cities in China Based on Entropy Method and TOPSIS. Ecol. Indic. 2022, 145, 109616. [Google Scholar] [CrossRef]
  37. Koroso, N.H. Urban Land Policy and Urban Land Use Efficiency: An Analysis Based on Remote Sensing and Institutional Credibility Thesis. Land Use Policy 2023, 132, 106827. [Google Scholar] [CrossRef]
  38. Zhu, J.; Li, X.; Zeng, X.; Zhong, K.; Xu, Y. Cultivated Land-Use Benefit Evaluation and Obstacle Factor Identification: Empirical Evidence from Northern Hubei, China. Land 2022, 11, 1386. [Google Scholar] [CrossRef]
  39. National Bureau of Statistics of China. China Statistical Yearbook; China Statistics Press: Beijing, China, 2024.
  40. Statistics Bureau of Henan Province. Henan Statistical Yearbook; China Statistics Press: Beijing, China, 2021.
  41. Brundtland, G.H. Report of the World Commission on Environment and Development: Our Common Future Acronyms and Note on Terminology Chairman’s Foreword; United Nations Digital Library: New York, NY, USA, 1987. [Google Scholar]
  42. Han, B.; Jin, X.; Sun, R.; Li, H.; Liang, X.; Zhou, Y. Understanding Land-Use Sustainability with a Systematical Framework: An Evaluation Case of China. Land Use Policy 2023, 132, 106767. [Google Scholar] [CrossRef]
  43. Li, D.; Fan, K.; Lu, J.; Wu, S.; Xie, X. Research on Spatio-Temporal Pattern Evolution and the Coupling Coordination Relationship of Land-Use Benefit from a Low-Carbon Perspective: A Case Study of Fujian Province. Land 2022, 11, 1498. [Google Scholar] [CrossRef]
  44. Zhang, L.; Zhang, L.; Xu, Y.; Zhou, P.; Yeh, C.H. Evaluating Urban Land Use Efficiency with Interacting Criteria: An Empirical Study of Cities in Jiangsu China. Land Use Policy 2020, 90, 104292. [Google Scholar] [CrossRef]
  45. Song, Y.; Yeung, G.; Zhu, D.; Xu, Y.; Zhang, L. Efficiency of Urban Land Use in China’s Resource-Based Cities, 2000–2018. Land Use Policy 2022, 115, 106009. [Google Scholar] [CrossRef]
  46. Zhuang, X.; Li, X.; Xu, Y. How Can Resource-Exhausted Cities Get Out of “The Valley of Death”? An Evaluation Index System and Obstacle Degree Analysis of Green Sustainable Development. Int. J. Environ. Res. Public Health 2022, 19, 16976. [Google Scholar] [CrossRef]
  47. Xu, X.; Zhang, Z.; Long, T.; Sun, S.; Gao, J. Mega-City Region Sustainability Assessment and Obstacles Identification with GIS–Entropy–TOPSIS Model: A Case in Yangtze River Delta Urban Agglomeration, China. J. Clean. Prod. 2021, 294, 126147. [Google Scholar] [CrossRef]
  48. Cunha-Zeri, G.; Guidolini, J.F.; Branco, E.A.; Ometto, J.P. How Sustainable Is the Nitrogen Management in Brazil? A Sustainability Assessment Using the Entropy Weight Method. J. Environ. Manag. 2022, 316, 115330. [Google Scholar] [CrossRef] [PubMed]
  49. National Bureau of Statistics of China. China City Statistical Yearbook; China Statistics Press: Beijing, China, 2021.
  50. Ministry of Finance of the People’s Republic of China. Finance Yearbook of China; China Finance Magazine Agency: Beijing, China, 2021.
  51. Zhao, X.; Miao, C. Spatial-Temporal Changes and Simulation of Land Use in Metropolitan Areas: A Case of the Zhengzhou Metropolitan Area, China. Int. J. Environ. Res. Public Health 2022, 19, 14089. [Google Scholar] [CrossRef] [PubMed]
  52. Luo, J.; Zhai, S.; Song, G.; He, X.; Song, H.; Chen, J.; Liu, H.; Feng, Y. Assessing Inequity in Green Space Exposure toward a “15-Minute City” in Zhengzhou, China: Using Deep Learning and Urban Big Data. Int. J. Environ. Res. Public Health 2022, 19, 5798. [Google Scholar] [CrossRef]
  53. Yuan, K.; Zhang, F.; Zhao, X. Annual Report on Industrial Development of Henan; Social Sciences Academic Press: Beijing, China, 2018. [Google Scholar]
  54. Cheng, X.; Li, X.; He, W.; Ni, H.; Zhao, Z. Spatial Pattern Characteristics of Suitability of Land Use and Regional Regulation in Henan Province. J. Southwest Univ. Sci. Ed. 2022, 44, 153–165. [Google Scholar]
  55. Shi, H.; Li, Q.; Zhang, S.; Chen, W.; Wang, Y.; Shen, Y. Does Urban Construction Land in China Achieve Sustainable Allocation and Utilization? Land Use Policy 2024, 144, 107223. [Google Scholar] [CrossRef]
  56. Radzi, A. The Ruhr Innovation Ecosystem—From Industrial Brownfields to Regenerative Smart Environments; Liechtenstein Institute for Strategic Development: Berlin, Germany, 2022; ISBN 9780128202470. [Google Scholar]
  57. Rada, N. Assessing Brazil’s Cerrado Agricultural Miracle. Food Policy 2013, 38, 146–155. [Google Scholar] [CrossRef]
  58. Zhou, Y.; Li, X.; Liu, Y. Cultivated Land Protection and Rational Use in China. Land Use Policy 2021, 106, 105454. [Google Scholar] [CrossRef]
  59. Yue, W.; Xia, H.; Liu, Y.; Xu, J.; Xiong, J. Assessing Ecological Conservation Redline from Element, Structure, and Function Dimensions: A Case of Zhejiang Province, China. Environ. Impact Assess. Rev. 2024, 106, 107485. [Google Scholar] [CrossRef]
Figure 1. The location of Henan Province and its land use types in 2020.
Sustainability 17 06693 g001
Figure 2. Land use benefits in Henan Province in 2011, 2015 and 2020. The black line within the box is the mean value. Numbers with different lowercase letters indicate significant difference among different years for an individual land use benefit (p < 0.05).
Sustainability 17 06693 g002
Figure 3. Relative proximity of land use’s economic benefits in Henan Province.
Sustainability 17 06693 g003
Figure 4. Relative proximity of land use’s social benefits in Henan Province.
Sustainability 17 06693 g004
Figure 5. Relative proximity of land use’s ecological benefits in Henan Province.
Sustainability 17 06693 g005
Figure 6. Relative proximity of land use’s comprehensive benefits in Henan Province.
Sustainability 17 06693 g006
Figure 7. The thermal map of the obstacle degree of the obstacle factors in the criterion layer. Different depths of red, blue and green colors indicate different obstacle degrees of economic, social and ecological factors.
Sustainability 17 06693 g007
Table 1. Basic statistical descriptions of all the indicators.
IndicatorUnitNMin.Max.MeanStd. Dev.
X11Million CNY/sq. km.546.44161.2130.2625.10
X12Million CNY/sq. km.544.88175.5931.8829.93
X13Million CNY/sq. km.542.2868.1711.3510.71
X14Million CNY/sq. km.540.2316.912.182.78
X15%541.614.493.220.67
X16%5418.0859.0436.049.72
X21Thousand people/sq. km.541.8115.065.452.62
X22Km/thousand people540.090.640.340.16
X23Million540.367.083.311.85
X24--541.682.962.230.33
X25Zhang/thousand people540.091.550.720.36
X31Kiloton540.56174.8640.7043.57
X3%5465.13100.0092.827.77
X33Megaton540.092.650.410.45
X34Sq. m./people545.3817.9712.253.14
X35%5425.5947.8539.754.14
Table 2. The relative proximity of different grades of land use benefits.
GradeLowMedium–LowMediumMedium–HighHigh
Relative proximity[0, 0.2)[0.2–0.4)[0.4–0.6)[0.6–0.8)[0.8–1.0]
Table 3. The top-5 obstacle indicators for each city.
RegionObstacle Factor 1Obstacle Factor 2Obstacle Factor 3Obstacle Factor 4Obstacle Factor 5
201120152020201120152020201120152020201120152020201120152020
AnyangX14X14X33X33X33X14X13X13X13X12X12X12X11X11X11
HebiX33X33X33X14X14X14X13X13X13X12X12X11
<X12>
X11X11X11
<X12>
JiyuanX33X33X33X14X14X14X13X13X13X12X12X12X11X11X11
JiaozuoX33X33X33X14X14X14X13X13X13X12X11
<X12>
X11X11X11
<X12>
X12
KaifengX14X14
<X33>
X14
<X33>
X33X14
<X33>
X14
<X33>
X12X12X12X13X13X13X11X11X11
LuoyangX14X14X14X13
<X33>
X12
<X13,X33>
X33X13
<X33>
X12
<X13,X33>
X12
<X13>
X12X12
<X13,X33>
X12
<X13>
X11X11X11
LuoheX33X33X33X14X14X14X12
<X13>
X12
<X13>
X12
<X13>
X12
<X13>
X12
<X13>
X12
<X13>
X11X11X11
NanyangX14X14X14X12X12<X33>X33X13
<X33>
X12
<X33>
X12X13
<X33>
X13X13X11X11X11
PingdingshanX14
<X33>
X14
<X33>
X14
<X33>
X14
<X33>
X14<X33>X14
<X33>
X12
<X13>
X12
<X13>
X12X12
<X13>
X12
<X13>
X13X11X11X11
PuyangX33X33X14
<X33>
X14X14X14
<X33>
X13X13X13X12X12X11X11X11X12
SanmenxiaX14
<X33>
X33X14
<X33>
X14
<X33>
X14X14
<X33>
X12
<X13>
X12
<X13>
X12
<X13>
X12
<X13>
X12
<X13>
X12
<X13>
X11X11X11
ShangqiuX14X14
<X33>
X14
<X33>
X33X14
<X33>
X14
<X33>
X12
<X13>
X12
<X13>
X12X12
<X13>
X12
<X13>
X13X11X11X11
XinxiangX33X14
<X33>
X14X14X14
<X33>
X33X13X12
<X13>
X12X12X12
<X13>
X13X11X11X11
XinyangX14X14X14X33X33X33X12
<X13>
X12
<X13>
X12X12
<X13>
X12
<X13>
X13X11X11X11
XuchangX33X33X33X14X14X14X13X13X13X12X12X11
<X12>
X11X11X11
<X12>
ZhengzhouX21X21X21X34X34X34X23X23X31X22X31X24X31X22X35
ZhoukouX14
<X33>
X14
<X33>
X33X14
<X33>
X14
<X33>
X14X12X12X12X13X13X13X11X11X11
ZhumadianX14X14
<X33>
X14
<X33>
X33X14
<X33>
X14
<X33>
X12X12X12X13X13X13X11X11X11
Note: The obstacle degree of the indicator in parentheses is the same as that of the indicator outside parentheses.
Disclaimer/Publisher’s Note: The statements, opinions and data contained in all publications are solely those of the individual author(s) and contributor(s) and not of MDPI and/or the editor(s). MDPI and/or the editor(s) disclaim responsibility for any injury to people or property resulting from any ideas, methods, instructions or products referred to in the content.

