Article

The Influence of Labels on the Front of In Vitro Chicken Meat Packaging on the Choice Behavior of German Consumers

by
Julia Völker
*,
Hannah Maria Oestreich
and
Stephan G. H. Meyerding
Department of Nutritional Sciences, Hamburg University of Applied Sciences (HAW Hamburg), 20002 Hamburg, Germany
*
Author to whom correspondence should be addressed.
Sustainability 2025, 17(15), 6685; https://doi.org/10.3390/su17156685
Submission received: 2 June 2025 / Revised: 13 July 2025 / Accepted: 19 July 2025 / Published: 22 July 2025
(This article belongs to the Section Sustainable Food)

Abstract

In vitro meat presents a promising alternative to conventional meat production by addressing environmental and animal welfare concerns. However, broader market adoption depends on increasing consumer acceptance. Labels on product packaging have been shown to be effective in influencing consumer behavior in previous studies. This paper examines the impact of different front-of-package labels on German consumers’ choices regarding in vitro chicken meat, with the goal of identifying effective labeling strategies. To investigate this, an online choice experiment was conducted with 200 participants from Germany. In addition to the label, products varied in terms of price, origin, and calorie content. The data were analyzed using latent class analysis, which identified four distinct consumer segments characterized by their preferences, attitudes, and personal characteristics. The results were used to simulate market scenarios, evaluating the effectiveness of different labeling strategies for in vitro chicken meat. These insights provide a foundation for targeted marketing approaches that promote consumer acceptance and inform the introduction of in vitro meat products in Germany.

1. Introduction

Current food production systems face enormous challenges. By 2050, the world population to be fed is expected to grow to 10 billion people [1]. In addition to increasing demand for food due to the ever-growing population, livestock production causes major negative environmental impacts in the face of increasing deforestation and land use, as well as the pollution of water bodies, among other factors [2,3,4,5]. For feed production purposes only, 71% of the world’s arable land is used [6]. In addition, livestock production is a major contributor to climate change, accounting for 14.5% to 51% of global greenhouse gas emissions. However, ethical factors are also a reason for reducing meat consumption [7,8]. Animals must be killed to produce conventional meat, and current mass production cannot guarantee animal welfare [9]. In addition, high meat consumption poses an increased risk of cardiovascular disease and cancer [10,11,12,13]; Therefore, the expansion of livestock production is not an appropriate solution to meet the growing population. Due to this, alternatives to conventional meat production must be created to counteract this problem, consisting of three factors: nutrition, environment, and health [14,15].
More sustainable plant-based alternatives such as tofu, seitan, tempeh, and mycoproteins, as well as insects, have already come into focus in recent years [14,16,17]. Nevertheless, most consumers do not (yet) seem willing to significantly reduce meat consumption and turn to the growing range of plant-based protein alternatives [18]. However, the acceptance of alternatives to conventionally produced meat could change if the quality of these alternatives improves. One solution could be the production of in vitro meat (IVM) [19]. Compared to plant-based alternatives that mimic the taste of meat, animal muscle tissue is used to produce IVM. To generate IVM, harvested stem cells from a livestock animal are cultivated by propagating a small number of muscle cells in a bioreactor to produce a large muscle mass. IVM is thus a product of cellular agriculture [20,21].
In 2013, the first IVM was launched as a beef burger patty [22]. Since then, over 150 companies have been founded, through which over 2.6 billion US dollars in investments have flowed into cultured products by the end of 2022 [23]. This was followed in 2020 by the launch of chicken nuggets from IVM in Singapore [24]. In the European market, there is so far no approval for lab-grown meat due to legal and technical reasons, yet companies from European countries, such as Germany or the Netherlands, as well as from the United States and Israel, expect and plan to enter the market in the future [25,26,27]. The German company Wiesenhof is already collaborating with the Israeli start-up SuperMeat to produce IVM [27]. The German government assumes IVM will be marketable in 10 to 20 years [28].
However, the production and further development of IVM face ethical challenges in addition to technical challenges, such as meeting nutrient requirements, since ideally, an alternative component of the culture medium must be found to replace the fetal bovine serum that has been used so far [22,25,29]. In addition, the current high energy consumption for IVM production is another challenge. Still, with the help of using sustainable energy sources, the environmental footprint of IVM may be lower than that of pork and beef, showing a similar footprint to chicken meat [30]. In addition, given the low land and water use, IVM may have a lower overall environmental impact [25,31]. Accurate predictions of the potential positive effects on the environment cannot be made at this time because the industrial status of IVM production is still in its early stages. Furthermore, IVM may offer a higher health value than conventional meat in terms of its low fat content and the possibility of adding nutrients [25].
The current prices of IVM are not yet competitive [32,33]. However, according to the A.T. Kearney forecast, IVM offers commercial potential in terms of market share, expected growth, and price competitiveness over the next decade. The report also predicts that IVM will grow significantly in importance worldwide and will even generate more sales than vegan meat substitutes by 2040. This would put IVM sales at an almost similar level to conventional meat, which will decline significantly by 2040 [34].
For IVM to be successfully integrated into the market, consumer acceptance is essential despite the expected positive environmental, health, and economic impacts [15]. Decisively crucial and an important obstacle to overcome for the success of IVM is the willingness to buy [19,35]. Researchers found that consumer attitudes play a key role in accepting novel food technologies [36,37,38]. Due to this, it is important to understand the factors that influence consumer acceptance early in the development process of this technology [19]. Past studies show mixed results regarding consumer acceptance of IVM. Some of them conclude that there is a high willingness to consume or try IVM, while others show that the majority would continue using conventional meat, and consumers are still skeptical about IVM [36,39,40,41]. The study conducted by forsa, as part of the German Ministry of Food and Agriculture’s (BMEL) Nutrition Report 2022, shows that 26% of the German population considers lab-produced meat as a possible measure to feed the growing world population [42,43]. On the other hand, according to the Nutrition Report 2021, the younger German population group of 14- to 29-year-olds already considered the production of IVM to have more potential as a solution (46%) than they did in 2020 (33%) [44]. In order for IVM to exist as a component of the food market in the future, it is still essential to increase acceptance, and in the course of this, to also identify the factors influencing choice behavior [45].
The study by Grunert, Bredahl, and Brunsø (2004) showed that both intrinsic and extrinsic quality factors exert an influence on consumers’ purchase decisions for meat products [46]. The intrinsic factors describe the direct product characteristics, such as meat color, fat content, or sensory properties. Extrinsic factors, on the other hand, are more subjective and refer to characteristics such as price, origin, sustainability, animal welfare, health, production methods, and safety [46]. According to the Nutrition Report 2022 by the BMEL, food packaging information is important to German consumers when choosing food [47]. Information on animal husbandry conditions, origin, environmentally friendly production methods, or nutritional information, among other things, was identified as essential or very important by a large proportion of respondents (>62%). When shopping, seals on packaging are an important feature for many respondents [43]. In past studies, the use of labels on food products has already been shown to have a strong influence on purchasing decisions, thus confirming the use of labels as a suitable tool for influencing consumers’ choice behavior [48,49,50].
While factors such as price and education level have been shown to influence the acceptance of novel foods [19,30], front-of-package labeling provides a remarkably accessible and immediate tool to shape consumer perceptions and build trust. Especially for emerging technologies like in vitro meat, targeted labeling can serve as an effective gateway to broader consumer acceptance [51].
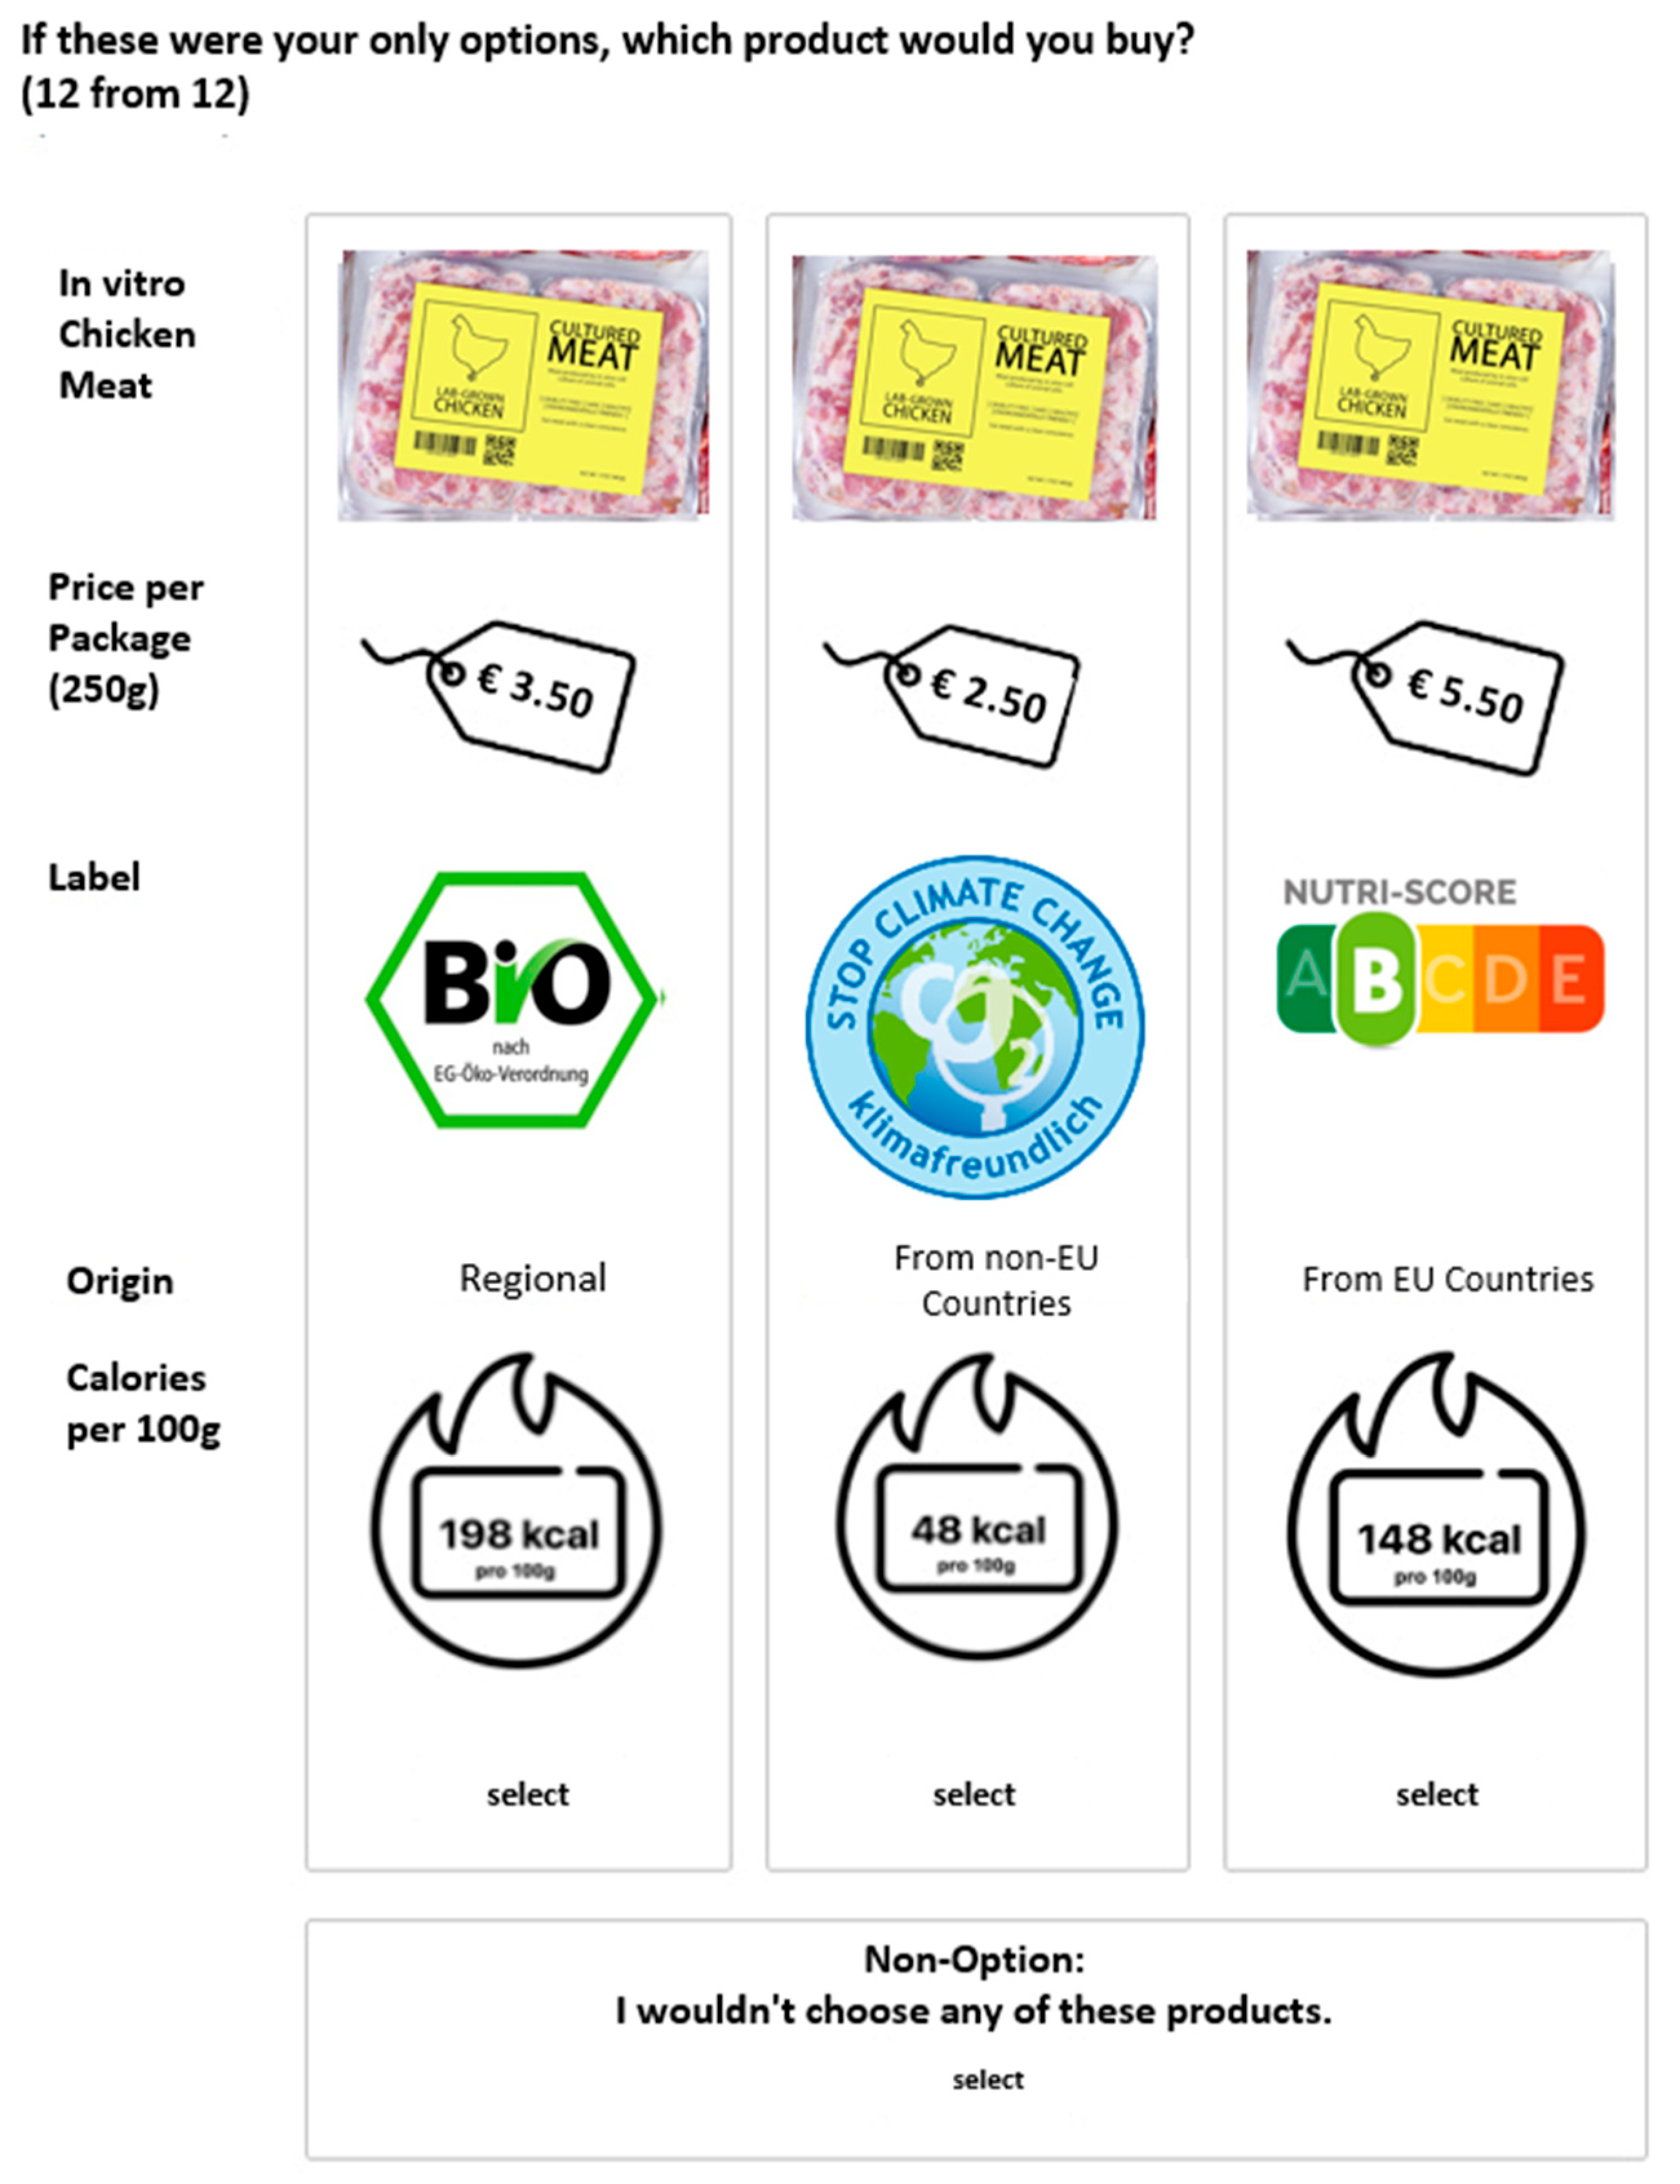
Given the anticipated introduction of IVM in the European market, this paper sheds light on the current acceptance of IVM by German consumers. It investigates the extent to which labels on the front of IVM product packaging influence the choice behavior of the German population. The effect of the use of different labels, as well as the characteristics, price, origin, and calorie information, is analyzed using the example of chicken meat and then discussed to what extent the choice behavior of the surveyed participants can be influenced and which other factors might have an impact. Consequently, conclusions are drawn about the positive influence of labels on the front of product packaging of in vitro chicken meat (IVCM) on the selection decision of German consumers in terms of establishing IVM in the German market.

2. Materials and Methods

2.1. Data Collection

The sample data were collected between April 2022 and February 2023. Participants were recruited via e-mail and social networks by sharing the link to the online survey. Participation was voluntary at all times and could be terminated by respondents without any negative consequences.
To reflect the German population in terms of sociodemographic characteristics of age, gender, and education, sampling quotas were applied during survey creation. In addition, a screening question was used at the beginning of the survey to exclude participants who stated that they could not imagine buying or consuming in vitro meat (IVM), as this study specifically focused on early adopters—consumers who are fundamentally open to novel food technologies. This focus ensured that the data collected in the choice experiment would reflect realistic decision-making in a purchase simulation scenario.
A total of 757 individuals accessed the online survey. Of these, 415 were excluded for a combination of reasons: not meeting quota requirements, not consenting to data protection terms, indicating an unwillingness to consider IVM consumption, or completing the survey implausibly fast. In total, 660 individuals responded to the initial screening and quota-based questions. After further data cleaning regarding survey completion time and completeness, a final sample of 200 valid responses was included in the analysis, which is considered sufficient for discrete choice experiments and segmentation analyses. According to Johnson and Orme (2003), a sample size of approximately 200 participants meets the recommended threshold for reliable parameter estimation given the number of attributes, levels, and choice tasks included in the study [52]. Furthermore, this sample size allowed for latent class analysis with a moderate number of segments and ensured statistical efficiency within the defined target group.
Individuals who reported not consuming meat (e.g., vegetarians or vegans) were excluded from the sample, as they are not considered potential adopters of in vitro meat (IVM). This ensured that the choice experiment reflected realistic purchase decisions among a relevant target group—meat-eating consumers with at least a fundamental openness to IVM. This focus was intentional and aligns with diffusion theory, which suggests that market entry strategies for novel food technologies should initially target early adopters. These consumers are typically more open-minded, less neophobic, and more receptive to innovation. They also play a key role in facilitating wider societal acceptance by acting as opinion leaders and reducing uncertainty [19,53]. While reaching skeptical consumers remains essential for long-term diffusion, such efforts become more relevant in the later stages of the product life cycle once familiarity has increased [30].

2.2. Survey Design

The survey was divided into four interactive sections that participants had to complete one after the other. Before starting the survey, each participant was required to accept the conditions of participation and the data protection information. In addition, a short informational text on the topic of IVM enabled participants to gain an overview and first impression of the product. In the first interactive section, participants answered the quota questions on age, gender, education level, and their willingness to consume or purchase IVM products to ensure representativeness. The choice experiment followed this in section two, which asked participants to select the product they would be most likely to purchase from each of three different options in various choice sets. If none of the options were suitable for the participants, they were able to choose the non-option ‘none’. In the third section, respondents were asked to state their attitudes on various topics by rating several statements according to the meaning of the item on a scale from ‘strongly disagree’ (1) to ‘strongly agree’ (5) or in the opposite direction from ‘strongly agree’ (1) to ‘strongly disagree’ (5). This was followed by the fourth and final part of the survey, which asked about the sociodemographic characteristics ‘number of children’, ‘frequency of eating freshly cooked meals’, ‘a number of meals eaten in company per day’, ‘frequency of meat product consumption’, ‘diet’, and ‘net income per month’.

2.2.1. Design of the Choice Experiment

To determine consumer preferences, a conjoint analysis in the form of a choice experiment was conducted. This experiment examines the choice behavior of the study participants for different characteristics and the associated characteristic values.
The choice experiment was created using Sawtooth Software Lighthouse Studio (version 9.13.2). For each participant, the software generated 12 individual choice sets using a randomized balanced design with minimum overlap and level balancing across tasks. The experimental design followed an incomplete block structure, ensuring that each participant evaluated a manageable number of product profiles while maintaining statistical efficiency. Each choice task consisted of three product alternatives plus a no-purchase option. A separate, randomized design was generated for each participant to minimize order effects and to improve external validity. The experimental design was tested in Sawtooth Lighthouse Studio using the built-in advanced CBC test tool. This included a simulation with 250 synthetic respondents, a D-efficiency test, and logit efficiency analysis. A non-option was specified to occur in approximately 15% of simulated choices. The test confirmed that the design achieved balanced level representation and minimal overlap while ensuring acceptable statistical efficiency.
Choice experiments are the most commonly used evaluation method in food research to determine consumer preferences, willingness to pay, and willingness to accept. By simulating the purchase decision in a store, they allow comparison of the different product alternatives and attributes available for choice. The method is widespread for meat, organic and functional foods, and foods with nutrition or health claims [54]. In past studies, the discrete choice experiment has proven to be a successful tool for determining participant preferences regarding products with different attribute levels.
When conducting the choice experiment, the participant is asked to select a product from several alternatives. These alternatives each have various combinations of product characteristics, the so-called attributes. The main attribute of this survey, which is assumed to influence the choice behavior, is the label. In addition, this attribute was supplemented by the product attributes price per package (250 g), origin, and calories per 100 g since these represent essential characteristics of a product in the selection of food and are of great importance for the analysis of the results by putting the part-worth utilities of the main attribute label into perspective and enabling the segmentation of different consumer groups. With the background of focusing on one type of meat and creating a realistic purchase simulation, the attribute ‘product’ in the form of in vitro chicken meat (IVCM) was also used to illustrate a picture of a package. Chicken meat is one of the most popular meats in Germany in terms of per capita consumption and is already available for sale as IVM in Singapore [24,44]. Due to this, this type of meat has been classified as suitable for representing the product within this study.
A total of five attributes were used for the experiment, of which an influence on consumer choice behavior was assumed for the four attributes investigated (attribute ‘product’ not included). Particular attention was paid to the selection of the labels in order to generate the highest possible and most meaningful values for the utility of the labels. The results of the representative survey of the German population conducted by forsa for the Nutrition Report 2021 show that many German consumers always or usually pay attention to the regional label, the Bio label, the Fairtrade label, the sustainable fishing label, and the animal welfare label when shopping for food [55]. Based on these findings of consumer preferences, and IVM’s associated potential beneficial attributes, labels customized to the IVM product could be selected. The first label used is ‘Stop Climate Change—climate friendly’, which refers to the potential positive effect of IVM on the environment compared to conventional meat production and addresses German consumers’ preferences for regional labels as well as the associated concern about climate change [25,31,44,56]. The second label, called ‘Cruelty-Free,’ is part of the ‘Global Beauty Without Bunnies’ program of the organization PETA (People for the Ethical Treatment of Animals) and is currently used for labeling animal-free cosmetic products without animal ingredients [57]. Since the production of IVM can significantly reduce animal suffering and completely avoid animal death, provided that the cells are cultured in a plant serum instead of an animal blood serum, this label would be an option for labeling beyond the cosmetics product category and a meaningful alternative to the common animal welfare label [58,59,60,61]. Another label chosen is the Bio seal, which identifies products that have been produced and inspected in accordance with EU organic farming legislation and confirms organic production and animal welfare. It is the most widely used seal in Germany and belongs to the labels that German consumers pay the most attention to when shopping [44,62,63]. The Nutri Score represents the fourth and last label used in this study. According to the study by forsa (2021), this food label, which allows a comparison to be made between nutritional values within a product group, gained attention in the short time following its approval in November 2020 [55]. A total of 44% of respondents already perceived the Nutri Score on a package, of which 45% stated that it had influenced their decision when shopping. Based on these data, the decision to use the label in this study was made, and an increase in the importance of this label was assumed, which is reflected in the Nutrition Report by the BMEL (2022) [47].
All attributes, with the exception of the product, had 5 values each. The experiment also included the options without the values ‘no label’ and ‘no information’ (for origin). Equal distances between the attributes for the attribute price per package (250 g) and the attribute calories per 100 g were considered. All of the attributes and attribute levels used are listed in Table 1.
When conducting the choice experiment, survey participants were asked to choose the product they preferred and would purchase from three alternatives. If none of the products came into consideration for a purchase, the participants could select the non-option ‘no purchase’. The different products of the twelve generated choice sets had various combinations of attribute levels. An exception was the attribute product, which had the same level (IVCM) in each set and was only used to illustrate the purchase simulation. This product attribute was set as a constant attribute and, therefore, was not included in all subsequent analyses. Sawtooth Software was also used to generate a separate randomized choice set design for each participant. Figure 1 shows an example of a choice set.

2.2.2. Design of the Lifestyle Constructs

The subsequent part of the survey involved identifying and ranking participants’ attitudes toward specific topics (lifestyle constructs) using various statements. The statements referred to represented items that participants had to rate using a Likert scale based on their own self-assessments. The Likert scales used in this study were 5-point response scales with the response options ranging from ‘strongly disagree’ (1) to ‘strongly agree’ (2), and in the opposite direction, from ‘strongly agree’ (1) to ‘strongly disagree’ (5) (reverse Likert scale). The answers were assigned numerical codes from 1 to 5 to enable further analyses and calculations to be conducted and thus represent the participants’ attitudes. The statement sets to be rated were related to the topics ‘price consciousness’, ‘environmental awareness’, ‘health consciousness’, ‘empathy’, ‘positive attitude towards in vitro meat’, ‘positive attitude towards carnism’, and ‘food neophobia’, which were selected based on the previous literature research on suitable factors and corresponding variables. These statement items have been proven to be effective in past studies in determining consumer attitudes. A total of 30 statements were included in this survey for the seven topics suspected to be related to the choice decision, as well as the influence of the labels used in the choice experiment.
The first construct on price consciousness came from the study by Lichtenstein, Ridgway, and Netemeyer (1993), which examined consumers’ price perceptions and purchasing behavior [64]. To determine environmental awareness, items were used from Haws, Winterich, and Naylor’s (2014) research, which was developed to measure the tendency to express the value of environmental protection through personal consumption and purchasing behavior [65]. The created scale was found to be reliable and valid in determining environmentally conscious consumption values. Furthermore, the construct examined in Schifferstein and Oude Ophius’ study (1998) served to assess participants’ health consciousness [66]. To analyze the empathy of the participants, statement items from Davis’s (1980) study were used [67]. The positive attitude toward IVM, another relevant construct to examine the effect on choice behavior, has been measured using items from Bryant and Barnett (2019) that assess the perception of IVM under different names [68]. Complementing this, the construct of a positive attitude toward carnism from the study by Cordts, Nitzko, and Spiller (2014) provides comparative values by reflecting participants’ views on consuming conventional meat [69]. The last items utilized are part of the Food Neophobia Scale, developed by Pliner and Hobden (1992), and is the most widely used measurement method to determine food neophobia [70,71]. With the help of these statement items, the fear or loathing of novel foods such as IVM and the accompanying rejection can be described [19]. Siegrist and Hartmann (2020) already found significant effects of neophobia on the acceptance of IVM in some countries [19]. Table 2 provides the results of the factor analysis, along with an overview of all constructs and their associated items.

2.3. Statistical Method

2.3.1. Analysis in Sawtooth Software

Following the collection of data via the online survey, the dataset was transferred to the program Lighthouse Studio (version 9.13.2) by Sawtooth Software. For the analysis, only those data sets were selected that included a full implementation of the choice experiment and completed the study in a reasonable amount of time.
First, a Hierarchical Bayes (HB) analysis was performed on the 200 usable datasets to determine participants’ preferences regarding the choice experiment attributes. HB methods are widely used in statistics and are standard and powerful techniques for analyzing data [72]. The result of this analysis represents part-worth utilities that can be useful for market segmentation, market summarization, and the development of new product ideas, among other applications [73]. By representing these values, the HB model offers the advantage of examining heterogeneity in preferences and specific individuals ([74], pp. 118–119).
The subsequent latent class analysis (LCA) was applied to form consumer segments. This analysis identifies class-specific part-worth utilities, the size of the segment, and the individual probabilities of belonging to each segment based on the participants’ responses in the choice experiment [54]. This method of analysis is used in many scientific studies. For example, Peschel et al. (2016) used latent class choice modeling to analyze consumers’ knowledge and lifestyle profiles and preferences regarding environmentally labeled food [75]. Furthermore, in the research of Grymshi et al. (2021), this model allowed to understand better the attitudes and purchase motivations of study participants towards eco-labeled food [76].
The market simulator was used for the final data analysis with Sawtooth Software. This is also an important tool in evaluating a conjoint analysis, which can convert the previously determined part-worth utilities into simulated market decisions. The acceptability of products with different attribute values can be tested in a simulated market by calculating the percentage of participants who are expected to choose the products ([77], pp. 89–92). The products created in this study were based on the characteristics of the product preferences of the segments previously formed in the LCA, which resulted in two market strategy variants, one with three and one with four products. Both were examined in the market simulator and then compared. In addition, the range of the price indication (EUR 1.50–EUR 5.50) has been investigated concerning the sensitivity of the respondents in order to conclude hypothetical adjustments of this characteristic for the market.

2.3.2. Analysis in SPSS

Further analyses were performed in the Statistical Package for Social Sciences (SPSS) program (version 28.0.1.1) and were based on the HB model and the LCA. At first, the participants’ sociodemographic characteristics were analyzed using descriptive statistics. In order to examine the data of all participants who answered the quota questions (N = 660), in terms of determining the acceptance of IVM in the German population, this method was used first. On the one hand, the screener question on a willingness to try IVM was investigated. On the other hand, the sociodemographic characteristics of gender, age, and professional education of these participants were determined. Subsequently, both frequencies and percentages of the selected sample (N = 200) were determined with these three characteristics, as well as to the variables ‘number of children’, ‘frequency of eating freshly cooked meals’, ‘number of meals eaten in company per day’, ‘frequency of meat product consumption’, and ‘diet’. In addition, the mean and Standard Deviation (SD) were presented for the variable net income per month. Table 3 shows all the sociodemographic characteristics investigated and the values calculated for the selected sample, compared with the percentage and mean value of the German population in this overview for classification purposes. In the following, the sociodemographic analysis was applied similarly to each of the four consumer groups.
Thereafter, the mean part-worth utilities and relative importance of all attributes of the choice experiment were determined in SPSS for the whole sample and the consumer segments. In the next step, the factor analysis was used, which already proved to be an appropriate method for the analysis of lifestyle constructs in the study of Tuorila et al. (2001) on food neophobia and in the study of Verbeke and Vackier (2004) on the profile and effects of consumer participation in fresh meat, enabling the factor loadings of the lifestyle items to be represented [78,79]. In addition to the factor loadings, the mean and SD of all statement sets and the Cronbach’s Alpha of each construct (price consciousness, environmental awareness, health consciousness, empathy, positive attitude towards in vitro meat, positive attitude towards carnism, and food neophobia) were determined. These values were calculated based on the predetermined coding (1–5), which also served as the basis for the subsequent Analysis of Variance (ANOVA) and Post Hoc Test (Tukey). These two methods of analysis allowed the comparison of participant attitudes of different segments using the mean factor scores and the associated SD. Among others, they were also used in the research of Januszewska, Pieniak, and Verbeke (2011) as an efficient tool to compare the motives of food choices of different samples [80].
In a further step, the regression analysis served to show correlations between different variables. For this purpose, a dependent variable was defined that is to be explained based on this analysis, and several independent variables are suspected of exerting an influence on the dependent variable. For example, Grunert, Hieke, and Wills (2014) already used the method to identify determinants of understanding of sustainability issues [81]. For the evaluation of this study, the label (relative importance) was chosen as the dependent variable and the constructs as the independent variables to be able to explain their relationship to each other. By using this method, it is possible to show whether there is an influence, how large the possible influence is, and whether it has significant values.
Table 3. Summary of the sociodemographic analysis for the sample (N = 200).
VariablesDescriptionFrequency SampleShare (%) SampleShare (%) Germany
Gender 1Male7638.049.3
Female12462.050.7
Age 218–295226.019.8
30–394824.019.4
40–493216.018.0
50–594120.523.7
60–692713.519.1
Vocational qualification 3No vocational qualification3919.525.2
Vocational training9246.046.6
Professional school diploma2110.59.3
University degree4723.518.5
Not specified10.50.4
Number of children 4010653.072.1
1–27135.524.4
3–4178.53.2
>400.00.2
Frequency of eating freshly cooked meals 5Several times per month168.03.0
Once per week147.07.0
Several times per week10753.534.0
Every day5728.546.0
Number of meals eaten in company per day02412.0N.A.
19246.0N.A.
25929.5N.A.
3199.5N.A.
Frequency of meat product consumption 6Never3718.520.0
Several times per month3115.52.0
Once per week3919.510.0
Several times per week6934.545.0
Every day189.023.0
Diet 7Omnivore8743.551.0
Vegetarian105.06.0
Vegan115.53.0
Flexitarian6532.518.0
Pescatarian73.53.0
Other diet147.019.0
VariableUnit of MeasurementMeanStandard Deviation (SD)Mean Germany
Available net income per month 8EUR1229.771093.662164.75
Note. 1 Source: [82] Census Data in the version of 30 September 2021 (Federal Statistical Office, 2021). 2 Source: [83] Census Data in the version of 31 December 2020 (Federal Statistical Office, 2020). 3 Source: [84] Census Data in the version of 2019 (Federal Statistical Office, 2019). 4 Source: [85] Microcensus Data in the version of 2019 (Federal Statistical Office, 2019). 5 Source: [47] Germany as it eats—The BMEL Nutrition Report 2022 (Federal Ministry of Food and Agriculture (BMEL, 2022). 6 Source: [86] Statista Consumer Insights—Nutrition, food and hot beverages 2019 (Statista, 2019). 7 Source: [87] Statista Consumer Insights—Global Consumer Survey 2022 (Statista, 2022). 8 Source: [88] National accounts—Domestic product calculation of the 4th quarter 2022 (Federal Statistical Office, 2022).

3. Results

3.1. Results of the In Vitro Meat Acceptance Test

At the beginning of the survey, participants were sorted based on quotas. One quota included the question about the willingness to try IVM and served to identify the participants’ general consumer acceptance. The data sets of all individuals who answered this question were analyzed and sorted according to their answers (see Table 4).
The results show that most participants (68.4%) are willing to try IVM. However, 31.6% of this group of German consumers, thus almost one-third, are skeptical about IVM. A total of 16.8% of the participants reject IVM because they generally do not eat meat, and 14.8%, on the other hand, are not convinced by IVM due to the product type and do not want to buy or eat it. Accordingly, the acceptance of IVM still has room for improvement and relies on measures to improve this for IVM to survive in the market in the future. To describe these consumers more precisely, the sociodemographic attributes of gender, age, and vocational qualification have been analyzed. An overview of these variables is shown in Table 5.
Comparing the sociodemographic attributes of the groups of people in the various responses with the average of the total participants (N = 660), it is noticeable that women indicated ‘no’ more frequently and thus have a lower acceptance of IVM products than men. The female share predominates mainly because they generally do not eat meat. In addition, a comparatively large number of young persons between 18 and 29 years of age and a few older persons between 50 and 69 years of age also generally rejected meat as a reason for refusing IVM. In contrast, the age distribution for the answer ‘no, because I do not want to buy/eat something like that’ is precisely the opposite. Accordingly, younger consumers are more likely to be critical of meat consumption in general, whereas older consumers are more likely to reject the product type. This result could also explain why most people who dislike IVM products have a professional education. In comparison, among those who do not consume meat, there is a higher proportion of people who have not completed vocational training, but also of people with university degrees.

3.2. Sample Description

The data sets of the qualified participants served as the basis for all further analyses, so 200 respondents aged 18–69 were considered for this purpose. The sociodemographic characteristics of these participants are shown in Table 3. At 62%, the proportion of women is greater than that of men (38%). Exactly half of the participants are between 18 and 39 years, the second half is in the age group of 40 to 69 years, while the group of 60–69 years is the smallest part with 13.5% and the group of 18–29 years is the largest part with 26% of the respondents. Most participants have completed professional education (46%), followed by a university degree (23.5%). The average net income is EUR 1229.77, which is available to the participants monthly after deducting all fixed costs. However, it is subject to large variations within the sample, with an SD of 1093.66. Over half of the respondents do not have children and cook several times a week. In addition, the majority of participants (46%) eat one meal per day in company, whereas only a few (9.5%) eat three times per day in company. The attribute of the frequency of meat consumption shows a stronger percentage distribution. Most participants (34.5%) consume meat products several times a week, 19.5% resort to meat once a week, 18.5% never eat meat, and the smallest part of the sample, with 9%, consume meat products daily. Regarding diet, the proportion of omnivores, the group of people who eat both plant and animal foods, predominates at 43.5%. This value is followed by the group of flexitarians (people who eat meat only occasionally) with a percentage of 32.5%. All other diets have only single-digit values, of which the rate of vegetarians is the lowest at 5%, which is even lower than the value for vegans (5.5%). Compared to the German population, it is noticeable that women and flexitarians are overrepresented. Overall, the study participants are somewhat younger, have a slightly higher level of education, have more children, eat meat less frequently and freshly cooked meals, and have less income than the average German citizen.

3.3. Results of the Hierarchical Bayes Model

The HB analysis was applied to identify participants’ average preferences for price per package (250 g), label, origin, and calories per 100 g. 
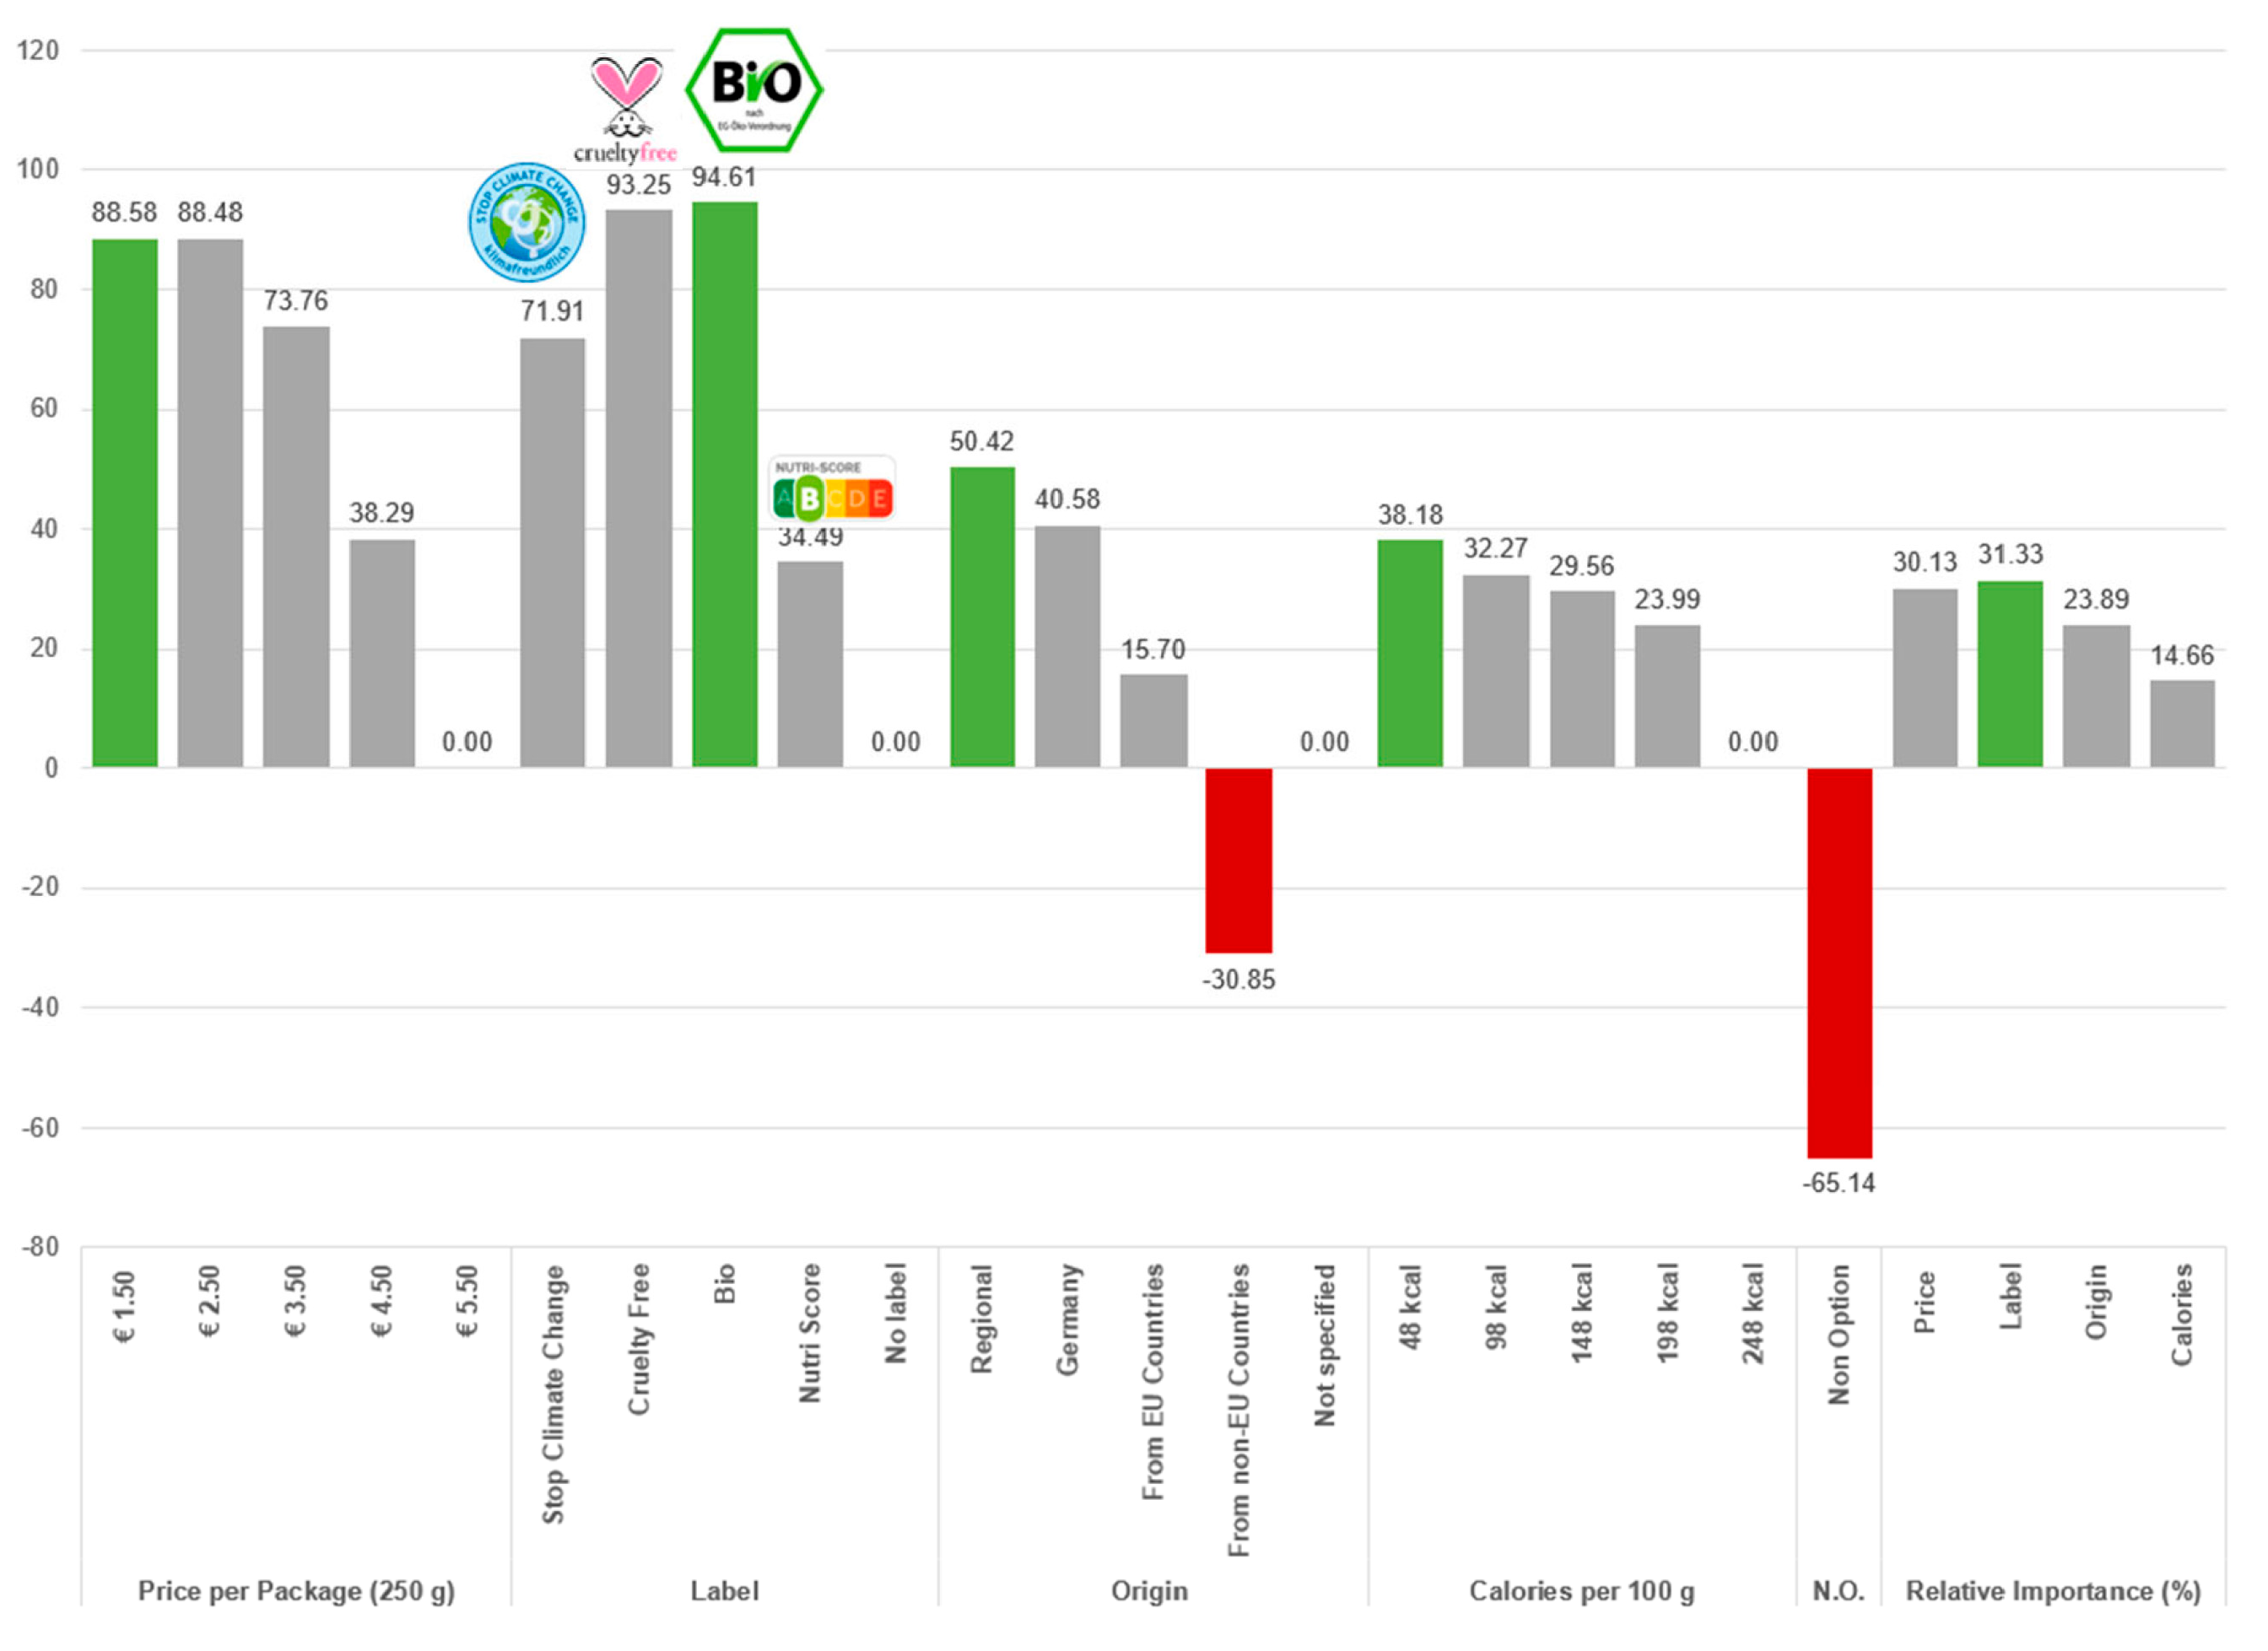
Figure 2 shows the part-worth utilities of all attributes and the relative importance to the sample in total. Higher part-worth utilities describe a greater benefit for the consumer. The greater this benefit, in turn, the higher the probability of selecting the product in the presence of the respective attribute levels. To achieve better comparability of the values, one level was set to zero for each characteristic. In this case, the levels with the highest (EUR 5.50 per package and 248 kcal per 100 g) or no expression (‘no label’ and ‘no indication’) were selected.
The average participant prefers to choose the cheapest (EUR 1.50 per package) and lowest calorie (48 kcal per 100 g) IVCM product from the region that is marked with a Bio label. Similarly popular as the Bio label is the label Cruelty-Free, and the label Stop Climate Change has a positive effect on the purchase decision in relation to the option ‘no label’. The Nutri Score shows the smallest but also positive part-worth utility value, which consequently has the lowest benefit for the average consumer compared to the other three labels. The part-worth utilities for price and calories fall as the value increases, indicating that, on average, low prices and low-calorie quantities are preferred. In addition, people prefer to choose a product without an indication of origin rather than a product from a non-EU country. The lowest part-worth utility value is shown for the non-option, indicating that overall, participants would prefer to buy an IVCM product with the attributes used rather than none at all.
With a relative importance of 31.33%, the label is the most significant for the average respondent when buying IVCM, followed by price, origin, and calories with the lowest value of 14.66%. These results show that the label can greatly influence a product’s choice decision, which in this case even exceeds the relative importance of the price when choosing an IVCM product.

3.4. Results of the Latent Class Analysis

With the aim of revealing the heterogeneity in a population and forming meaningful groups of individuals that are similar in their responses to the measured variable, the LCA is performed [89]. To do this, a suitable number of these groups must first be determined, but so far, the literature has not clearly defined the best criterion for selecting the number of consumer segments. Commonly used criteria are the Consistent Akaike Information Criterion (CAIC), the Bayesian Information Criterion (BIC), and the Akaike Information Criterion (AIC). Nylund et al. (2007) described BIC and CAIC as appropriate tools for determining the number of groups [90].
Table 6 shows the values of the criteria listed above for the number of groups from 2 to 5. The values for CAIC and BIC decrease up to the four-group solution and increase again to the five-group solution. Since the lowest value indicates the best-fitting model and thus determines the model selection, this was considered suitable and was selected for further evaluation of this study [90,91].
Based on their choices in the choice experiment, the participants were thus divided into four segments using LCA. The analysis results are shown in Table 7 and include part-worth utilities for all groups for each attribute level. The relative importance at the end of the table provides information about the influence of each attribute for the different consumer groups.
The consumer groups show partly significant differences in some of the part-worth utilities and relative importance. However, slight parallels can be drawn between Group 1 and Group 4, both of which have similar relative importance and prefer regional and Bio-labeled products.
Group 1, the ‘environmentally conscious consumers’, consists of 36.5% of the participants of the entire sample. To them, the label and origin are most important when purchasing IVCM. The Bio label is most preferred, followed by the Stop Climate Change label, which has an above-average part-worth utility value. In addition, great value is placed on the labels of origin ‘regional’ and ‘Germany’. Based on these four preferences, it can be seen that this consumer segment pays more attention to sustainable and ecological choices in IVCM products compared to the other groups. Price and calories in the middle segment (EUR 3.50 and 148 kcal) are preferred, which symbolizes a higher willingness to pay and to consume calories.
The second group was described as ‘animal protectors’ and included 15.5% of the sample. In this group, the label is of great importance for selecting the IVCM product. Especially the high part-worth utility value for the Cruelty-Free label stands out firmly, which accordingly represents a decisive factor for the purchase decision of these participants. Together with the Bio label, which also has a fairly high part-worth utility value, a preference can be derived for purchasing products in which the welfare of the animals is controlled or ensured. All three attributes are of comparatively little importance to this group in the choice of IVCM.
The ‘price-conscious consumers’ represent the third group with 31% of the total participants. The selection of an IVCM product in this part of the sample is strongly influenced by price, which reaches by far the highest percentage of all attributes with a value of 51.35% in relative importance. The cheapest price (EUR 1.50) is the most preferred, which has a very high part-worth utility value of 203.02. An increase in price is associated with a corresponding decrease in part-worth utility, indicating a negative relationship between price and consumer preference. Furthermore, this group prefers to choose the lowest calorie value, the label Stop Climate Change and the origin Germany. It is also noticeable that the non-option ‘no purchase’ was most rejected in this group.
The last group, with a 17% share of participants, is the ‘value-oriented consumers’, whose choice behavior for IVM, similar to Group 1, is most strongly influenced by the indication of origin and label, but hardly by calories. This consumer group has a strong preference for regional labeling and products with Bio or Cruelty-Free labels. These product attributes stand out from the others in their attribute groups with high part-worth utilities and indicate a value-oriented selection by the consumer group in the areas of animal welfare, regionality, and controlled organic or ecological production. They are also the only consumer segment that tends to choose the non-option if an IVCM product does not meet their requirements, which is expressed in a positive part-worth value.
Overall, it is noticeable that only among the price-conscious group does the lowest price have the highest part-worth utility value. This suggests that the price of IVCM products is of less importance to the other consumers. The Nutri Score has the lowest part-worth value for all four segments, making it a less suitable label for influencing choice behavior than the other three. In addition, the part-worth utility values of the origin label ‘not EU countries’ are exclusively in the negative range, which expresses a general rejection of this level.

3.5. Results of the Sociodemographic Variables for the Estimated Segments

Part of the survey included responses to several general sociodemographic variables, such as gender, age, and income, as well as food-related variables such as dietary pattern or meat consumption. Table 8 shows the results of the sociodemographic analysis of all variables for each consumer segment formed in the LCA.
Comparing the groups with each other, it is noticeable that the group of price-conscious consumers includes a little more male than female participants, although the number of women predominates in the entire sample as well as in the three other segments. Group 2, the ‘animal protectors’, has the highest proportion of women. The value-oriented consumers have the largest proportion of young people between the ages of 18 and 29, at just under one-third, although this segment also has the highest proportion of older participants between the ages of 50 and 69. In contrast, very few participants in the highest age category of 60–69 years are to be found among the environmentally conscious consumers and the animal protectors. Middle-aged, mostly employed persons between 30 and 59 years of age are least represented in the price-conscious consumer group, which at the same time has the most participants without vocational education, the smallest share of persons with university degrees, and therefore also the lowest net income on average. High proportions of participants with university degrees are found among the environmentally conscious consumers as well as among the animal protectors. This most likely has an effect on net income, which is highest in these two groups. In addition, it is evident from the results that the majority of all segments do not have children, cook fresh meals several times a week, and eat in company 1–2 times a day. Group 3 (price-conscious consumers) stands out with a comparatively high value (14.5%) for the number of 3–4 children. Among the animal protectors, the largest proportion of participants never consumes meat products. For this reason, there is a remarkably high proportion of vegetarians and vegans in this group, with a combined value of 35.5%. With 19.4%, just as many participants have a vegan diet as an omnivorous diet. This value could only be exceeded by the number of flexitarians, with 25.8%. In comparison, the price-conscious group eats meat products significantly more often. Among the segments, it has the highest value for daily meat consumption as well as for consumption several times a week. More than half of the members of this group and the environmentally conscious group eat an omnivorous diet, whereas almost half of the value-oriented consumers prefer a flexitarian diet, and no one in this segment eats meat products every day.

3.6. Results of the Factor Analysis for the Lifestyle Items

Two principal component factor analyses with varimax rotation were applied in the SPSS program to evaluate the items used to measure different attitudes of the participants. The validation of the results was conducted using the Kaiser–Meyer–Olkin (KMO) criterion and the Bartlett Test for Sphericity (BTS). The KMO values range from 0 to 1, with 0 representing the worst and 1 the best value. Above 0.5, the value is considered acceptable [92]. The KMO value of this study in the first factor analysis for the constructs ‘price consciousness’, ‘environmental awareness’, ‘health consciousness’, and ‘empathy’ was 0.816, which is classified as ‘meritorious’ according to Kaiser. In the second factor analysis, a KMO value of 0.753 was identified for the constructs ‘positive attitude towards in vitro meat’, ‘positive attitude towards carnism’, and ‘food neophobia’. According to Kaiser, this is to be classified as ‘middling’. The BTS is used to assess the equality of variance in different populations and tests the null hypothesis that the variances of the populations are equal ([93], p. 87). Because the BTS is significant in both analyses here, the null hypothesis could be rejected, which made a factor analysis possible. Table 2 shows an overview of the results of the factor analyses and all the items used to describe the consumer segments in more detail.
In addition to factor loading, the mean and SD were determined for each item. To measure internal consistency, the Cronbach’s Alpha criterion was used, which is expressed as a number between 0 and 1. Internal consistency is the extent to which all items measure the same construct [94]. As Griethuijsen et al. (2015) recommend, Cronbach’s Alpha values should not be below acceptable levels of 0.6 [95]. Therefore, based on the values identified in this study in the range of 0.691 to 0.888, all constructs could be used. Subsequently, the extracted factors from Table 2 were used to describe the four consumer segments. Table 9 shows the results in the form of the mean factor scores and the SD.
The group designated as ‘environmentally conscious consumers’ on the basis of the results of the choice experiment has the lowest value for the factor ‘price consciousness,’ which indicates that these consumers are most willing to pay higher prices for the IVCM compared to the other groups and thus explains the part-worth utility values of this segment identified in the experiment. It is also noticeable that the value for ‘environmental awareness’ is surprisingly low. This suggests that the decision to buy IVCM products with environmental labels may have backgrounds other than a concern for the environment.
The animal protectors show the highest mean factor scores for health consciousness and a positive attitude towards IVM. In addition, they have the lowest score for food neophobia, which indicates these participants’ openness to novel products, and a high score for empathy, which reflects their empathy towards animals. They also stand out with a significantly lower value for a positive attitude towards carnism, illustrating their strong rejection of conventional meat consumption.
The highest mean score within this factor confirms the price consciousness of Group 3. In contrast to the animal protectors, these participants have the most positive attitude towards carnism. On the other hand, environmental awareness, health awareness, and empathy are the least distinctive in this consumer segment compared to the other groups.
Value-oriented consumers represent the group with the greatest environmental awareness, the greatest level of empathy, and the greatest level of food neophobia. This critical perspective toward novel products is also reflected in the lowest mean factor score for a positive attitude toward IVM. However, the consumption of conventional meat is also viewed critically, as it may also violate the values of this group.
Significant differences between the four segments are found in environmental awareness, health awareness, and a positive attitude towards carnism. Due to their high level of environmental awareness, the value-oriented consumers differ significantly from Group 3, the price-conscious consumers, who make the least environmentally conscious decisions. In the category of health consciousness, the animal protectors perform best, whereas Group 3 also shows significantly lower consciousness here. Group 3 and Group 1 tend to defend carnism significantly more compared to Group 2. In all three constructs with significant differences, the groups not mentioned in the comparison each have participants who show values of both tendencies (in the positive and negative direction) of the construct and thus can be assigned to both groupings (a and b).

3.7. Results of the Regression Analysis

Regression analysis is used to investigate the relationships between dependent and independent variables. For this purpose, a dependent variable is to be explained, and one or more independent variables, which are assumed to influence the dependent variable, are determined ([96], pp. 210–211). This study examined the extent to which lifestyle constructs influence the relative importance of the label. Table 10 shows the regression analysis results in the form of the standardized beta and the significance level for each construct and the R2.
This table shows that environmental awareness, health awareness, and empathy, as well as a positive attitude towards carnism, have a significant influence on the relative importance of the label. Accordingly, the higher the environmental awareness, health awareness, or empathy, the greater the importance of the label in product selection. The greatest positive effect is attributed to health awareness, with a standardized beta of 0.233 and a significance level of 0.002. The positive attitude of consumers towards carnism shows the lowest standardized beta with −0.142 and thus the most negative influence on the importance of the label. Therefore, the greater the positive attitude towards carnism, the lower the relative importance of the label. Using the R2, the proportion of the variance of the dependent variable that is explained by all independent variables is indicated [97]. Consequently, the R2 in this analysis expresses that the constructs can explain the variance of the relative importance of the label to 13.6%.

3.8. Results of the Market Simulation

The market simulator was used to conclude product design in the market. It is intended to investigate consumer acceptance of products with different attributes by testing them on a simulated market [77]. The products compiled for the analysis from the attribute levels are based on the highest part-worth utilities of the consumer segments. On this basis, two variants could be examined (see Table 11). The first variant consists of four products, each matching the preferred product characteristics of each of the four groups. For the second variant, an alternative solution with three products was investigated, combining the preferences of Groups 1 and 4, since they are pretty similar in their most preferred product attributes and are even the same for the attributes label and origin. All attribute levels of the cross-group product are thereby the same in the preferences of Group 1, as Group 4 also has high part-worth utilities in all of these characteristics. Group 4 has almost the same high value for the price of EUR 3.50 as for its highest value at EUR 2.50. In addition, the calorie specification 148 kcal also has the second-highest part-worth utility value. However, the relative importance of this specification is lowest in this group, which means that this characteristic, preferred by the first group, must be weighted higher (see Table 6). In addition, the environmentally conscious consumers are the largest segment, which makes it reasonable to adjust to their preferences.
Table 12 shows the results of both simulations, once with all the attributes used in the choice experiment and once without including the attribute calories, since this had the lowest relative importance on average.
The results show that in the variant with four products, 98.7% of consumers would choose one of the offered products. The variant with three products is only 0.5% lower at 98.2%. In Variant 1, the third product is chosen most frequently, and the first product is chosen least frequently. In Variant 2, on the other hand, the proportions are distributed more equally across all products, with the third product being the most popular here as well, although the first product combines the preferences of consumers from both Group 1 and Group 4. In comparison, without calorie information, the simulation has slightly higher values for the non-option (no purchase). Nevertheless, the difference between the values is so minimal that the omission of this indication on the front of IVCM packages could be considered for these variants. For further investigation in the market simulator, the calorie information was nevertheless considered to determine the best possible acceptability results and retain all labels used in the choice experiment. In order to obtain a more detailed overview of the product choice (including the calorie information), the percentages of preferences for the four consumer segments have been broken down for each product and captured in Table 13.
The calculated proportions confirm the preferences of the groups for the respective product. The greatest agreement in both variants is found in Group 2 (animal protectors), with 85.4% for four products to choose from and even 90.9% for three products. It is also noticeable that the participants in Groups 1 (environmentally conscious consumers) and 4 (value-oriented consumers) vary the most in their choice of products. With the help of Variant 2, the percentage of both groups for the common product increases, but Group 1 still only achieves just under 46% here. In addition, the environmentally conscious consumers and, above all, the value-oriented consumers are a little more frequently persuaded to refrain from purchasing when selecting the three products. In general, Group 2 as well as Group 4 are most averse to the third product, the cheapest variant. In further investigation, the price sensitivity of the participants was determined. The results of this analysis can be found in Table 14.
The price-conscious consumers confirm their strong attitude toward price in both market strategies based on the percentage shares for Product 3. They prefer the lowest price and have already lost over 10 percentage points at the second lowest price of EUR 2.50. Groups 1 and 4 are very similar in their price sensitivity. They prefer a price of EUR 3.50 for their preferred products (in Variant 1, Products 1 and 4, and in Variant 2, Product 1 for both groups) and are only more critical of the highest price of EUR 5.50. They are, therefore, willing to pay a little more money for IVCM with their preferred product characteristics. Surprisingly, high values in all price categories are shown by the group of animal protectors for Product 2, which prefers the lowest price for an IVCM product with preferred attribute levels, but shows little rejection as the price increases. Therefore, the choice of a high-priced product for this segment is conceivable.

4. Discussion

As previous studies have shown, current consumer acceptance of IVM is not sufficient to the extent that it can be claimed with certainty that an IVM product can survive on the market after approval and introduction [40,41]. This is confirmed by the acceptance test conducted in this study, as just under one-third of the participants surveyed for this purpose are still skeptical about IVM. The results of previous studies showing a greater open-mindedness of men towards IVM are supported in this study. This is likely due to the gendered relationship with meat and a greater willingness of male consumers to try new technologies [78,98,99]. In addition, it is noted that women often reject IVM for the reason that they do not consume meat. This distribution can be explained, among other things, by the generally higher proportion of female vegetarians in the German population [100,101].
The results of the choice experiment show that the use of labels exerts a major influence on the choice decision of German consumers for IVCM and thus constitutes an essential factor in branding, just as it does for conventional meat, which was referred to in the study by Rimal (2005), among others [102]. The findings in this paper reflect the importance of the use of labels on product packaging as an influencing factor on consumer choice behavior, already confirmed by the studies of Linder et al. (2010) and Kempen et al. (2011) [49,50].
The Bio, Cruelty-Free, and Stop Climate Change labels performed particularly well, likely due to consumers’ sensitivity to clear and credible information about product origin and production. This preference aligns with previous findings showing that consumers demand transparent labeling and accurate manufacturing information for in vitro meat [51]. Although the Nutri Score was less influential, it still had a positive impact on product perception.
In addition to the label, the price also plays an essential role in the participants’ product choice. The lower the price, the higher the participants’ acceptance on average. The fact that the label has higher relative importance and, in some cases, higher part-worth utilities than the price illustrates the relevance of labels on IVCM product packaging, as prices are a very important factor in food selection [103]. Consumers positively receive information on the origin, especially in the case of regional IVCM and IVCM from Germany. In contrast, consumers are reluctant to buy if the information states ‘not from EU countries’. Therefore, using origin information from positively associated regions can also serve as appropriate product labeling for IVCM. The calorie claim exerts a minor influence on consumer behavior due to the smallest relative importance of all attributes. This is similar to price: the higher the calorie value, the lower the average consumer’s preference for that product.
Furthermore, some considerable differences between consumer groups in terms of IVCM choice behavior were identified in this study. The four consumer segments formed based on the choice experiment data and identified with the help of the LCA were named according to conspicuous values as follows: environmentally conscious consumers (36.5%), animal protectors (15.5%), price-conscious consumers (31.0%), and value-oriented consumers (17.0%). The most remarkable differences between these groups can be seen in the importance of the product attributes, label, price, and origin. Further influencing factors in the form of sociodemographic characteristics, food neophobia, or environmental awareness, which already showed an influence on the acceptance of IVM in the study by Dupont, Harm, and Fiebelkorn (2022), proved to be suitable parameters in this study to analyze the choice behavior and to describe the formed groups in more detail [15].
The environmentally conscious consumers prefer regional or German-made products with organic, Stop Climate Change, or Cruelty-Free labels. This group was named after the conspicuous fact that, compared to the other groups, they place the greatest value on the climate label on IVCM packaging. Still, contrary to expectations, they have a relatively low level of environmental awareness. Because these participants tend to have high educational qualifications and high net incomes, they can pay slightly higher prices for IVM and decide based on product attributes that are considered socially desirable behaviors, such as selecting products with labels against climate change or for animal welfare. A higher willingness to pay for environmentally friendly labeled products, which has already been determined in several studies, can also be expected [104,105]. They also tend to be health-conscious consumers, most of whom do not want to give up meat, or not entirely. For the market, this consumer group offers excellent potential, as they like to consume meat several times a week and could be influenced by the possible health benefits of IVM and meaningful labels on IVCM product packaging. This discrepancy may be explained by the so-called attitude–behavior gap, a well-documented phenomenon in sustainable consumption research. Although individuals in this group identify with environmentally friendly choices on a symbolic or normative level—e.g., through label preferences—their actual environmental knowledge or behavioral consistency may be limited. In this case, sustainability signaling via labeling may serve more as a proxy for social identity or moral alignment than as a reflection of deeply internalized environmental awareness [106,107].
The consumer segment of animal protectors is firmly focused on buying animal Cruelty-Free products and attaches the greatest importance to the label when choosing. Because of this, they prefer to choose IVCM with a Cruelty-Free label. They also have a large percentage of vegetarians and vegans and are averse to carnism. However, since they have a positive attitude towards IVM, this consumer group probably sees an opportunity to replace conventional meat with animal Cruelty-Free IVM in the future. Because of the high health consciousness and environmental awareness that this group also possesses, using the Cruelty-Free label in conjunction with the Bio label, which also achieved high part-worth scores, could represent target-oriented labeling of product packaging for IVCM. However, animal suffering-free production would have to be ensured in advance to convince animal protectors to buy IVCM. If this is performed, higher prices could be charged, as this consumer segment is hardly deterred by high prices for products with their preferred characteristics.
Price-conscious consumers are strongly price-oriented in the choice behavior of IVCM and prefer to choose the cheapest product. Their willingness to buy, therefore, decreases sharply in the market simulation as the price increases. The attributes label, origin, and calories play a rather subordinate role. Of all groups, these participants have the least environmental awareness, health consciousness, and empathy, but the most positive attitude towards meat consumption, reflected in a high proportion of omnivores. The proportion of men is comparatively high, and the proportion of people with university degrees is low, resulting in the lowest average net salary for this group. As the study by Steenhuis, Waterlander, and Du Mul (2011) demonstrates, price plays an important role, especially among low-income consumers, thus confirming the findings [103]. The use of conventional labels will not sufficiently encourage these participants to purchase. The Stop Climate Change and Bio labels perform best but do not seem particularly promising. Therefore, a suitable labeling of IVCM front packaging could be the labeling with prices, for example, in the form of offers or discounts. To encourage price-sensitive individuals, in particular, to buy IVM, the industry is likely to face pricing challenges due to the currently still high costs of IVM production.
The value-oriented consumers are most inclined not to select a product if the IVCM does not meet their requirements. In their purchase decision, the indication of the origin ‘regional’ and the Bio label, followed by the Cruelty-Free label, are most important to them, which is influenced by their high level of environmental awareness and empathy. The factors that negatively influence the purchase decision of IVCM and that need to be overcome represent the rather negative attitude towards IVM, as well as a slightly pronounced food neophobia. Highlighting positive product attributes through labeling is a promising approach to encourage these consumers to purchase IVCM and increase their acceptance.
Building on these findings, targeted marketing strategies can be developed for each consumer segment to enhance market uptake. For instance, the ‘animal protectors’ segment showed strong preferences for labels signaling animal welfare improvements. Products targeting this group could benefit from the inclusion of certified animal welfare logos or transparent information on the ethical implications of IVM.
The ‘price-sensitive’ segment responded more strongly to price cues and cost-efficiency indicators. For this group, competitive pricing, value packs, or price-based promotional strategies are likely to be more effective than ethical labeling.
The ‘value-oriented’ segment exhibited a preference for a combination of ethical and practical benefits. Communication strategies for this group should emphasize both the environmental impact of IVM and functional advantages, such as the absence of antibiotics or a reduced contamination risk.
These segment-specific insights can support the development of tailored product positioning and front-of-package labeling strategies, particularly in early market introduction phases where messaging needs to resonate with distinct consumer values.
Similar to Segment 1, the price preference is in the middle range, which means that a product with a slightly higher price can also be developed for this consumer group.
Based on these results, market strategies could aim to increase IVCM acceptance by using labels and emphasizing positively perceived product attributes. These strategies may be tailored to segment-specific utility values or general consumer preferences. The market simulation indicates two feasible product variants: one with four IVCM products and another simplified version with three, combining the preferences of Groups 1 and 4. In both cases, only a small share of participants chose none of the options, with a slightly higher share in the three-product scenario, still acceptable given the streamlined approach. Excluding the calorie attribute is also conceivable due to its low importance and minimal effect on product rejection. Since the experiment tested only one level per attribute, future studies could examine combinations of favorable labels—such as Bio and Cruelty-Free—to further enhance product perception.
One limitation of this study is the representativeness of the sociodemographic characteristics of the sample concerning the distribution in the German population. Particularly in the characteristic gender, the proportions deviate from each other. In this study, the share of women is higher and the share of men is lower than in the German population. Recruiting mainly male, as well as older participants, while maintaining quotas turned out to be difficult. Some studies indicate that the willingness to participate in (online) surveys is higher among women than among men and among younger persons than among older persons [108,109,110]. Another limitation is the restricted number of product attributes that can be investigated. Other types of meat or other labels or attributes could yield different results and possibly have a greater positive influence on choice behavior. Due to this, complementary studies could investigate the influence of labels on product packaging of a different type of meat, the effect of other labels, or the impact of various combinations of labels on the purchase decision. Furthermore, this study can only assume that the labels used can be utilized this way when IVM is introduced to the market. Whether the labels prove to be suitable in the future depends, according to the label, on compliance with specific criteria to be observed and, thus, on the further development of IVM. In addition, it must be considered that this study only addresses German consumers who can already imagine consuming IVM. To find out to what extent labels on IVM packaging also influence the choice behavior of consumers who are still critical of this product, further studies would be required.

5. Conclusions

The reduction in the consumption of conventional meat plays a steadily increasing role in the choice of food due to various factors, such as the negative impact on the environment. IVM could be a solution for a more resource-efficient and slaughter-free production of meat, but consumers are still partly skeptical about this option, as the investigation of this study confirms. With regard to the expected market launch, the extent to which labels on the front of IVM product packaging can influence the choice behavior of German consumers was therefore investigated using the example of chicken meat.
The results obtained from the conjoint analysis confirm the importance of the label based on the overall highest relative importance of this attribute when selecting an IVCM product. In addition to the label, the attributes of price and origin have a significant influence on the participants’ choice behavior. The average participant prefers the cheapest product (EUR 1.50) with a Bio label, the indication of origin of ‘regional’, and the lowest calorie value (48 kcal per 100 g). In addition, the Cruelty-Free label and Stop Climate Change are also of great value to German consumers surveyed overall. However, when participants are assigned to different consumer segments formed in this study, it appears that these groups differ in some product preferences and requirements as well as personal characteristics, and individual modeling of an IVCM product with different labeling can be performed for each segment or across segments. The environmentally conscious consumers (36.5%) prefer the Bio label but assign the highest part-worth to the Stop Climate Change label compared to the other segments. The value-oriented consumers (17%) also attach great importance to the Bio label and are furthermore strongly influenced by the Cruelty-Free label, which, however, is by far the most important label for animal protectors (15.5%). The price-conscious consumers (31.0%) prefer the Stop Climate Change label the most, but give the price a higher priority than the label. For practical application, it therefore makes sense to design different IVCM packages for the German market that meet different segment requirements for the product to use labels to influence German consumers in their choice of IVCM. However, further research is needed to support and complement the findings of this study.

Author Contributions

Conceptualization, J.V. and S.G.H.M.; Methodology, S.G.H.M.; Formal analysis, J.V. and H.M.O.; Investigation, H.M.O. and J.V.; Data curation, J.V. and H.M.O.; Writing—original draft, J.V., S.G.H.M. and H.M.O.; Writing—review & editing, J.V. and S.G.H.M.; Supervision, S.G.H.M.; Project administration, J.V. All authors have read and agreed to the published version of the manuscript.

Funding

This research received no external funding.

Institutional Review Board Statement

The study was conducted in accordance with the guidelines of the Declaration of Helsinki and was approved by the Ethics Committee of the Competence Center for Health (CCG), HAW Hamburg, with Approval Code 2020-08 and Approval Date 28 September 2020.

Informed Consent Statement

Informed consent was obtained from all subjects involved in the study.

Data Availability Statement

The original contributions presented in this study are included in the article. Further inquiries can be directed to the corresponding author.

Conflicts of Interest

The authors declare no conflict of interest.

References

  1. United Nations Department of Economic and Social Affairs (UN DESA). World Population Prospects 2022: Summary of Results; UN DESA: New York, NY, USA, 2022. [Google Scholar]
  2. Poore, J.; Nemecek, T. Reducing food’s environmental impacts through producers and consumers. Science 2018, 360, 987–992. [Google Scholar] [CrossRef] [PubMed]
  3. Steinfeld, H.; Wassenaar, T.; Jutzi, S. Livestock production systems in developing countries: Status, drivers, trends. Rev. Sci. Tech. (Int. Off. Epizoot.) 2006, 25, 505–516. [Google Scholar] [CrossRef] [PubMed]
  4. Thornton, P.K. Livestock production: Recent trends, future prospects. Philos. Trans. R. Soc. B 2010, 365, 2253–2867. [Google Scholar] [CrossRef] [PubMed]
  5. Goldstein, B.; Hansen, S.F.; Gjerris, M.; Laurent, A.; Birkved, M. Ethical aspects of life cycle assessments of diets. Food Policy 2016, 59, 139–151. [Google Scholar] [CrossRef]
  6. Raschka, A.; Carus, M. Stoffliche Nutzung von Biomasse: Basisdaten für Deutschland, Europa und die Welt. Erster Teilbericht zum F+E-Projekt “Ökologische Innovationspolitik—Mehr Ressourceneffizienz und Klimaschutz Durch Nachhaltige Stoffliche Nutzung von Biomasse”; Nova-Institut GmbH: Hürth, Germany, 2012. [Google Scholar]
  7. Gerber, P.J.; Steinfeld, H.; Herderson, B.; Mottet, A.; Opio, C.; Dijkman, J.; Falcucci, A.; Tempio, G. Teckling Climate Change Trough Livestock: A Global Assessment of Emissions and Mitigation; Food and Agriculture Organization of the United Nations (FAO): Rome, Italy, 2013.
  8. Goodland, R.; Anhang, J. Livestock and Climate Change: What If the Key Actors in Climate Change Are Cows, Pigs, and Chickens? World Watch: Washington, DC, USA, 2009. [Google Scholar]
  9. Hartmann, C.; Siegrist, M. Our daily meat: Justification, moral evaluation and willingness to substitute. Food Qual. Prefer. 2020, 80, 103799. [Google Scholar] [CrossRef]
  10. Larsson, S.C.; Wolk, A. Meat consumption and risk of colorectal cancer: A meta-analysis of prospective studies. Int. J. Cancer 2006, 119, 2657–2664. [Google Scholar] [CrossRef] [PubMed]
  11. Micha, R.; Michas, G.; Lajous, M.; Mozaffarian, D. Processing of meats and cardiovascular risk: Time to focus on preservatives. BMC Med. 2013, 11, 136. [Google Scholar] [CrossRef] [PubMed]
  12. Song, Y.; Manson, J.E.; Buring, J.E.; Simin, L. A Prospective Study of Red Meat Consumption and Type 2 Diabetes in Middle-Aged and Elderly Women: The Women’s Health Study. Diabetes Care 2004, 27, 2108–2115. [Google Scholar] [CrossRef] [PubMed]
  13. Taylor, E.F.; Burley, V.J.; Greenwood, D.C.; Cade, J.E. Meat consumption and risk of breast cancer in the UK Women’s Cohort Study. Br. J. Cancer 2007, 96, 1139–1146. [Google Scholar] [CrossRef] [PubMed]
  14. Tilman, D.; Clark, M. Global diets link environmental sustainability and human health. Nature 2014, 515, 518–522. [Google Scholar] [CrossRef] [PubMed]
  15. Dupont, J.; Harms, T.; Fiebelkorn, F. Acceptance of Cultured Meat in Germany—Application of an Extended Theory of Planned Behaviour. Foods 2022, 11, 424. [Google Scholar] [CrossRef] [PubMed]
  16. Jetzke, T.; Bovenschulte, M.; Ehrenberg-Silies, S. Fleisch 2.0—Unkonventionelle Proteinquellen; Themenkurzprofil Nr. 5; Institut für Technikfolgenabschätzung und Systemanalyse (ITAS): Berlin, Germany, 2016. [Google Scholar]
  17. Van Huis, A.; Van Itterbeeck, J.; Klunder, H.; Mertens, E.; Halloran, A.; Muir, G.; Vantomme, P. Edible Insects: Future Prospects for Food and Feed Security; Food and Agriculture Organization of the United Nations (FAO): Rome, Italy, 2013.
  18. Hartmann, C.; Siegrist, M. Consumer perception and behaviour regarding sustainable protein consumption: A systematic review. Trends Food Sci. Technol. 2017, 61, 11–25. [Google Scholar] [CrossRef]
  19. Siegrist, M.; Hartmann, C. Perceived naturalness, disgust, trust and food neophobia as predictors of cultured meat acceptance in ten countries. Appetite 2020, 155, 104814. [Google Scholar] [CrossRef] [PubMed]
  20. Post, M.J. Cultured meat from stem cells: Challenges and prospects. Meat Sci. 2012, 93, 297–301. [Google Scholar] [CrossRef] [PubMed]
  21. Bhat, Z.F.; Kumar, S.; Fayaz, H. In vitro meat production: Challenges and benefits over conventional meat production. J. Integr. Agric. 2015, 14, 241–248. [Google Scholar] [CrossRef]
  22. Post, M.J. An alternative animal protein source: Cultured beef. Ann. N. Y. Acad. Sci. 2014, 1328, 29–33. [Google Scholar] [CrossRef] [PubMed]
  23. Swartz, E.; Bomkamp, C. The Science of Cultivated Meat. Good Food Institute. 2023. Available online: https://gfi.org/science/the-science-of-cultivated-meat/#Endproducts (accessed on 30 April 2023).
  24. Treich, N. Cultured Meat: Promises and Challenges. Environ. Resour. Econ. 2021, 79, 33–61. [Google Scholar] [CrossRef] [PubMed]
  25. Böhm, I.; Ferrari, A.; Woll, S. In-Vitro-Fleisch: Eine Technische Vision zur Lösung der Probleme der Heutigen Fleischproduktion und des Fleischkonsums? Forschungsbericht; Institut für Technikfolgenabschätzung und Systemanalyse (ITAS), Karlsruher Institut für Technologie (KIT): Karlsruhe, Germany, 2017. [Google Scholar]
  26. Byrne, B.; Murray, S. 2020 State of the Industry Report: Cultivated Meat; The Good Future Institute: Arlington, VA, USA, 2021. [Google Scholar]
  27. Deutscher Bundestag. Sachstand: In-Vitro-Fleisch; Deutscher Bundestag: Berlin, Germany, 2018. [Google Scholar]
  28. Jetzke, T.; Richter, S.; Keppner, B.; Domröse, L.; Wunder, S.; Ferrari, A. Die Zukunft im Blick: Fleisch der Zukunft. Trendbericht zur Abschätzung der Umweltwirkungen von Pflanzlichen Fleischersatzprodukten, Essbaren Insekten und In-Vitro-Fleisch; Umweltbundesamt: Dessau-Roßlau, Germany, 2019. [Google Scholar]
  29. Datar, I.; Betti, M. Possibilities for an in vitro meat production system. Innov. Food Sci. Emerg. Technol. 2010, 11, 13–22. [Google Scholar] [CrossRef]
  30. Sinke, P.; Odegard, I. LCA of Cultivated Meat: Future Projections for Different Scenarios; CE Delft: Delft, The Netherlands, 2021. [Google Scholar]
  31. Tuomisto, H.L.; Ellis, M.J.; Haastrup, P. Environmental impacts of cultured meat: Alternative production scenarios. In Proceedings of the International Conference on Life Cycle Assessment in the Agri-Food Sector, San Francisco, CA, USA, 8–10 October 2014; American Center for Life Cycle Assessment: Vashon, WA, USA, 2014. [Google Scholar]
  32. Bhat, Z.F.; Kumar, S.; Bhat, H.F. In vitro meat: A future animal-free harvest. Crit. Rev. Food Sci. Nutr. 2017, 57, 782–789. [Google Scholar] [CrossRef] [PubMed]
  33. Stephens, N.; Di Silvio, L.; Dunsford, I.; Ellis, M.; Glencross, A.; Sexton, A. Bringing cultured meat to market: Technical, socio-political, and regulatory challenges in cellular agriculture. Trends Food Sci. Technol. 2018, 78, 155–166. [Google Scholar] [CrossRef] [PubMed]
  34. Warschun, M.; Donnan, D.; Ziemßen, F. When Consumers Go Vegan, How Much Meat Will Be Left on the Table for Agribusiness?: Meat Alternatives Could Disrupt a Multibillion-Dollar Global Industry; A.T. Kearney: Chicago, IL, USA, 2020. [Google Scholar]
  35. Hocquette, J.-F. Is in vitro meat the solution for the future? Meat Sci. 2016, 120, 167–176. [Google Scholar] [CrossRef] [PubMed]
  36. Mancini, M.C.; Antonioli, F. Exploring consumers’ attitude towards cultured meat in Italy. Meat Sci. 2019, 150, 101–110. [Google Scholar] [CrossRef] [PubMed]
  37. Bekker, G.A.; Fischer, A.R.; Tobi, H.; Van Trijp, H.C. Explicit and implicit attitude toward an emerging food technology: The case of cultured meat. Appetite 2017, 108, 245–254. [Google Scholar] [CrossRef] [PubMed]
  38. Frewer, L.J.; Gupta, N.; George, S.; Fischer, A.R.; Giles, E.L.; Coles, D. Consumer attitudes towards nanotechnologies applied to food production. Trends Food Sci. Technol. 2014, 40, 211–225. [Google Scholar] [CrossRef]
  39. Bryant, C.; Szejda, K.; Parekh, N.; Deshpande, V.; Tse, B. A Survey of Consumer Perceptions of Plant-Based and Clean Meat in the USA, India, and China. Front. Sustain. Food Syst. 2019, 3, 11. [Google Scholar] [CrossRef]
  40. Bryant, C.; Barnett, J. Consumer acceptance of cultured meat: A systematic review. Meat Sci. 2018, 143, 8–17. [Google Scholar] [CrossRef] [PubMed]
  41. Slade, P. If you build it, will they eat it? Consumer preferences for plant-based and cultured meat burgers. Appetite 2018, 125, 428–437. [Google Scholar] [CrossRef] [PubMed]
  42. Forsa Gesellschaft für Sozialforschung und Statistische Analysen mbH (Forsa). Ernährungsreport 2022: Ergebnisse Einer Repräsentativen Bevölkerungsbefragung; Forsa: Berlin, Germany, 2022. [Google Scholar]
  43. Bundesministerium für Ernährung und Landwirtschaft (BMEL). Deutschland, Wie es Isst: Der BMEL-Ernährungsreport 2022; BMEL: Berlin, Germany, 2022. [Google Scholar]
  44. Bundesministerium für Ernährung und Landwirtschaft (BMEL). Deutschland, Wie es Isst: Der BMEL-Ernährungreport 2021; BMEL: Berlin, Germany, 2021. [Google Scholar]
  45. Kantono, K.; Hamid, N.; Malavalli, M.M.; Liu, Y.; Liu, T.; Seyfoddin, A. Consumer Acceptance and Production of In Vitro Meat: A Review. Sustainability 2022, 14, 4910. [Google Scholar] [CrossRef]
  46. Grunert, K.G.; Bredahl, L.; Brunsø, K. Consumer perception of meat quality and implications for product development in the meat sector—A review. Meat Sci. 2004, 66, 259–272. [Google Scholar] [CrossRef] [PubMed]
  47. Bundesanstalt für Ernährung und Landwirtschaft (BMEL). Bericht zur Markt- und Versorgungslage mit Fleisch 2022; BMEL: Bonn, Germany, 2022. [Google Scholar]
  48. Kumar, N.; Kapoor, S. Do labels influence purchase decisions of food products? Study of young consumers of an emerging market. Br. Food J. 2017, 119, 218–229. [Google Scholar] [CrossRef]
  49. Linder, N.S.; Uhl, G.; Fliessbach, K.; Trautner, P.; Elger, C.E.; Weber, B. Organic labeling influences food valuation and choice. Neurolmage 2010, 53, 215–220. [Google Scholar] [CrossRef] [PubMed]
  50. Kempen, E.; Bosman, M.; Bouwer, C.; Klein, R.; Van der Merwe, D. An exploration of the influence of food labels on South African consumers’ purchasing behaviour. Int. J. Consum. Stud. 2011, 35, 69–78. [Google Scholar] [CrossRef]
  51. Asioli, D.; Bazzani, C.; Nayga, R.M., Jr. Are consumers willing to pay for in-vitro meat? An investigation of naming effects. J. Agric. Econ. 2021, 37, 356–375. [Google Scholar] [CrossRef]
  52. Johnson, R.; Orme, B. Getting the Most from CBC. Sawtooth Software Research Paper Series. 2003. Available online: https://sawtoothsoftware.com/resources/technical-papers/getting-the-most-from-cbc (accessed on 11 April 2023).
  53. Rogers, E.M. Diffusion of Innovations, 5th ed.; Free Press: New York, NY, USA, 2003. [Google Scholar]
  54. Lizin, S.; Rousseau, S.; Kessels, R.; Meulders, M.; Pepermans, G.; Speelman, S.; Vandebroek, M.; Broeck, G.V.D.; Van Loo, E.J.; Verbeke, W. The state of the art of discrete choice experiments in food research. Food Qual. Prefer. 2022, 102, 104678. [Google Scholar] [CrossRef]
  55. Forsa Politik- und Sozialforschung GmbH (Forsa). Ernährungsreport 2021: Ergebnisse Einer Repräsentativen Bevölkerungsbefragung; Forsa: Berlin, Germany, 2021. [Google Scholar]
  56. Feldmann, C.; Hamm, U. Consumers’ perceptions and preferences for local food: A review. Food Qual. Prefer. 2015, 40, 152–164. [Google Scholar] [CrossRef]
  57. People for the Ethical Treatment of Animals. PETA’s ‘Global Beauty Without Bunnies’ Program. Available online: https://www.peta.org/living/personal-care-fashion/beauty-without-bunnies/ (accessed on 11 April 2023).
  58. Bhat, Z.F.; Bhat, H. Animal-free Meat Biofabrication. Am. J. Food Technol. 2011, 6, 441–459. [Google Scholar] [CrossRef]
  59. Bhat, Z.F.; Bhat, H. Prospectus of cultured meat—Advancing meat alternatives. J. Food Sci. Technol. 2011, 48, 125–140. [Google Scholar] [CrossRef]
  60. Hopkins, P.D.; Dacey, A. Vegetarian Meat: Could Technology Save Animals and Satisfy Meat Eaters? J. Agric. Environ. Ethics 2008, 21, 579–596. [Google Scholar] [CrossRef]
  61. Alexander, R.P. In Vitro Meat: A Vehicle for the Ethical Rescaling of the Factory Farming Industry and In Vivo Testing or an Intractable Enterprise? Intersect Stanf. J. Sci. Technol. Soc. 2011, 4, 42–47. [Google Scholar]
  62. Janssen, M.; Hamm, U. Governmental and private certification labels for organic food: Consumer attitudes and preferences in Germany. Food Policy 2014, 49, 437–448. [Google Scholar] [CrossRef]
  63. Bundesministerium für Ernährung und Landwirtschaft (BMEL). Auf Einen Blick: Informationen Zum Bio-Siegel; BMEL: Berlin, Germany, 2022. [Google Scholar]
  64. Lichtenstein, D.R.; Ridgway, N.M.; Netemeyer, R.G. Price Perceptions and Consumer Shopping Behavior: A Field Study. J. Mark. Res. 1993, 30, 234–245. [Google Scholar] [CrossRef]
  65. Haws, K.L.; Winterich, K.P.; Naylor, R.W. Seeing the World through GREEN-tinted Glasses: Green Consumption Values and Responses to Environmentally Friendly Products. J. Consum. Psychol. 2014, 24, 336–354. [Google Scholar] [CrossRef]
  66. Schifferstein, H.N.J.; Oude Ophius, P.A.M. Health-related determinants of organic food consumption in the Netherlands. Food Qual. Prefer. 1998, 9, 119–133. [Google Scholar] [CrossRef]
  67. Davis, M.H. A Multidimensional Approach to Individual Differences in Empathy. J. Personal. Soc. Psychol. 1980, 10, 85. [Google Scholar]
  68. Bryant, C.J.; Barnett, J.C. What’s in a name? Consumer perceptions of in vitro meat under different names. Appetite 2019, 137, 104–113. [Google Scholar] [CrossRef] [PubMed]
  69. Cordts, A.; Nitzko, S.; Spiller, A. Consumer Response to Negative Information on Meat Consumption in Germany. Int. Food Agribus. Manag. 2014, 17, 83–106. [Google Scholar] [CrossRef]
  70. Pliner, P.; Hobden, K. Development of a Scale to Measure the Trait of Food Neophobia in Humans. Appetite 1992, 19, 105–120. [Google Scholar] [CrossRef] [PubMed]
  71. Zhao, J.-B.; Gao, Z.-B.; Li, Y.-X.; Wang, Y.-L.; Zhang, X.-Y.; Zou, L.-Q. The food neophobia scale (FNS): Exploration and confirmation of factor structure in a healthy Chinese sample. Food Qual. Prefer. 2020, 79, 103791. [Google Scholar] [CrossRef]
  72. Shiffrin, R.M.; Lee, M.D.; Kim, W.; Wagenmakers, E.-J. A Survey of Model Evaluation Approaches With a Tutorial on Hierarchical Bayesian Methods. Cogn. Sci. 2008, 32, 1248–1284. [Google Scholar] [CrossRef] [PubMed]
  73. Andrews, R.L.; Ansari, A.; Currim, I.S. Hierarchical Bayes Versus Finite Mixture Conjoint Analysis Models: A Comparison of Fit, Prediction, and Partworth Recovery. J. Mark. Res. 2002, 39, 87–98. [Google Scholar] [CrossRef]
  74. Allenby, G.M.; Rossi, P.E. Hiearchical Bayes Models. In The Handbook of Marketing Research; Grover, R., Vriens, M., Eds.; SAGE Publications: Thousand Oaks, CA, USA, 2006; pp. 418–440. [Google Scholar]
  75. Peschel, A.O.; Grebitus, C.; Steiner, B.; Veeman, M. How does consumer knowledge affect environmentally sustainable choices? Evidence from a cross-country latent class analysis of food labels. Appetite 2016, 106, 78–91. [Google Scholar] [CrossRef] [PubMed]
  76. Grymshi, D.; Crespo-Cebada, E.; Elghannam, A.; Mesias, F.J.; Diaz-Caro, C. Understanding consumer attitudes towards ecolabeled food products: A latent class analysis regarding their purchasing motivations. Agribusiness 2021, 38, 93–107. [Google Scholar] [CrossRef]
  77. Orme, B. Getting Started with Conjoint Analysis: Strategies for Product Design and Pricing Research, 2nd ed.; Research Publishers LCC: Madison, WI, USA, 2010. [Google Scholar]
  78. Tuorila, H.; Lähteenmäki, L.; Pohjalainen, L.; Lotti, L. Food neophobia among the Finns and related responses to familiar and unfamiliar foods. Food Qual. Prefer. 2001, 12, 29–37. [Google Scholar] [CrossRef]
  79. Verbeke, W.; Veckier, I. Profile and effects of consumer involvement in fresh meat. Meat Sci. 2004, 67, 159–168. [Google Scholar] [CrossRef] [PubMed]
  80. Januszewska, R.; Pieniak, Z.; Verbeke, W. Food choice questionnaire revisited in four countries. Does it still measure the same? Appetite 2011, 57, 94–98. [Google Scholar] [CrossRef] [PubMed]
  81. Grunert, K.G.; Hieke, S.; Wills, J. Sustainability labels on food products: Consumer motivation, understanding and use. Food Policy 2014, 44, 177–189. [Google Scholar] [CrossRef]
  82. Federal Statistical Office. Census Data, Version of 30.09.2021; Federal Statistical Office: Wiesbaden, Germany, 2021. [Google Scholar]
  83. Federal Statistical Office. Census Data, Version of 31.12.2020; Federal Statistical Office: Wiesbaden, Germany, 2020. [Google Scholar]
  84. Federal Statistical Office. Census Data, Version of 2019; Federal Statistical Office: Wiesbaden, Germany, 2019. [Google Scholar]
  85. Federal Statistical Office. Microcensus Data, Version of 2019; Federal Statistical Office: Wiesbaden, Germany, 2019. [Google Scholar]
  86. Statista. Consumer Insights—Nutrition, Food and Hot Beverages 2019; Statista: Hamburg, Germany, 2019. [Google Scholar]
  87. Statista. Consumer Insights—Global Consumer Survey 2022; Statista: Hamburg, Germany, 2022. [Google Scholar]
  88. Federal Statistical Office. National Accounts—Domestic Product Calculation of the 4th Quarter 2022; Federal Statistical Office: Wiesbaden, Germany, 2022. [Google Scholar]
  89. Muthén, B. Latent Variable Analysis: Growth Mixture Modeling and Related Techniques for Longitudinal Data. In Handbook of Quantitative Methodology for the Social Sciences; Kaplan, D., Ed.; SAGE Publications: Newbury Park, CA, USA, 2004; pp. 345–368. [Google Scholar]
  90. Nylund, K.L.; Asparouhov, T.; Muthén, B.O. Deciding on the Number of Classes in Latent Class Analysis and Growth Mixture Modeling: A Monte Carlo Simulation Study. Struct. Equ. Model. A Multidiscip. J. 2007, 14, 535–569. [Google Scholar] [CrossRef]
  91. Neath, A.A.; Cavanaugh, J.E. The Bayesian information criterion: Background, derivation, and applications. WIREs Comput. Stat. 2011, 4, 199–203. [Google Scholar] [CrossRef]
  92. Kaiser, H.F. An index of factorial simplicity. Psychometrika 1974, 39, 31–36. [Google Scholar] [CrossRef]
  93. Arsham, H.; Miodrag, L. Barlett’s Test. In International Encyclopedia of Statistical Science; Lovric, M., Ed.; Springer: Berlin/Heidelberg, Germany, 2011; pp. 87–88. [Google Scholar]
  94. Tavakol, M.; Dennick, R. Making sense of Cronbach’s Alpha. Int. J. Med. Educ. 2011, 2, 53–55. [Google Scholar] [CrossRef] [PubMed]
  95. Van Griethuijsen, R.A.; Van Eijck, M.W.; Haste, H.; Den Brok, P.J.; Skinner, N.C.; Mansour, N.; Gencer, A.S.; BouJaoude, S. Global Patterns in Students’ Views of Science and Interest in Science. Res. Sci. Educ. 2015, 45, 581–603. [Google Scholar] [CrossRef]
  96. Sarstedt, M.; Mooi, E. A Concise Guide to Market Research: The Process, Data, and Methods Using IBM SPSS Statistics; Springer: Berlin/Heidelberg, Germany, 2011. [Google Scholar]
  97. Plonsky, L.; Ghanbar, H. Multiple Regression in L2 Research: A Methodological Synthesis and Guide to Interpreting R2 Values. Mod. Lang. J. 2018, 102, 713–731. [Google Scholar] [CrossRef]
  98. Bäckström, A.; Pirttila-Backman, A.-M.; Tuorila, H. Dimensions of novelty: A social representation approach to new foods. Appetite 2003, 40, 299–307. [Google Scholar] [CrossRef] [PubMed]
  99. Tucker, C.A. The significance of sensory appeal for reduced meat consumption. Appetite 2014, 81, 168–179. [Google Scholar] [CrossRef] [PubMed]
  100. Max Rubner-Institut. Nationale Verzehrs Studie 2: Ergebnisbericht, Teil 1; Max Rubner-Institut: Karlsruhe, Germany, 2008. [Google Scholar]
  101. Mensink, G.B.; Barbosa, C.L.; Brettschneider, A.-K. Verbreitung der vegetarischen Ernährungsweise in Deutschland. J. Health Monit. 2016, 1, 1–49. [Google Scholar] [CrossRef]
  102. Rimal, A. Meat labels: Consumer attitude and meat consumption pattern. Int. J. Consum. Stud. 2005, 29, 47–54. [Google Scholar] [CrossRef]
  103. Steenhuis, I.H.; Waterlander, W.E.; De Mul, A. Consumer food choices: The role of price and pricing strategies. Public Health Nutr. 2011, 14, 2220–2226. [Google Scholar] [CrossRef] [PubMed]
  104. Krystallis, A.; Chryssochoidis, G.M. Consumers’ willingness to pay for organic food: Factors that affect it and variation per organic product type. Br. Food J. 2005, 107, 320–343. [Google Scholar] [CrossRef]
  105. Loureiro, M.L.; Hine, S. Discovering Niche Markets: A Comparison of Consumer Willingness to Pay for Local (Colorado Grown), Organic, and GMO-Free Products. J. Agric. Appl. Econ. 2002, 34, 477–487. [Google Scholar] [CrossRef]
  106. Vermeir, I.; Verbeke, W. Sustainable food consumption: Exploring the consumer “attitude–behavioral intention” gap. J. Agric. Environ. Ethics 2006, 19, 169–194. [Google Scholar] [CrossRef]
  107. Kollmuss, A.; Agyeman, J. Mind the Gap: Why do people act environmentally and what are the barriers to pro-environmental behavior? Environ. Educ. Res. 2002, 8, 239–260. [Google Scholar] [CrossRef]
  108. Curtin, R.; Presser, S.; Singer, E. The Effects of Response Rate Changes on the Index of Consumer Sentiment. Public Opin. Q. 2000, 64, 413–428. [Google Scholar] [CrossRef] [PubMed]
  109. Moore, D.L.; Tarnai, J. Evaluating Nonresponse Error in Mail Surveys. In Proceedings of the International Conference in Survey Nonresponse, Portland, OR, USA, 28–31 October 1999; Wiley: New York, NY, USA, 2002. [Google Scholar]
  110. Singer, E.; Van Hoewyk, J.; Maher, M.P. Experiments with Incentives in Telephone Surveys. Public Opin. Q. 2000, 64, 171–188. [Google Scholar] [CrossRef] [PubMed]
Figure 1. Example choice set in the choice experiment.
Sustainability 17 06685 g001
Figure 2. Resulting part-worth utilities for the purchase of in vitro chicken meat (N = 200).
Sustainability 17 06685 g002
Table 1. Attributes and levels used in the choice experiment.
AttributesLevels
ProductIn vitro chicken meat
Sustainability 17 06685 i001
Price per package (250 g)EUR 1.50EUR 2.50EUR 3.50EUR 4.50EUR 5.50
LabelStop Climate ChangeCruelty-FreeBioNutri ScoreNo label
Sustainability 17 06685 i002Sustainability 17 06685 i003Sustainability 17 06685 i004Sustainability 17 06685 i005
OriginRegionalGermanyFrom EU countriesFrom non-EU countriesNot specified
Calories per 100 g48 kcal98 kcal148 kcal198 kcal248 kcal
Non-optionNo purchase
Table 2. Results of the factor analysis (N = 200).
Factors and the Corresponding Variables Mean SD Factor Loading
Price consciousness (Cronbach’s Alpha: .888)
The time it takes to find low prices is usually not worth the effort. (R)2.921.1080.907
The money saved by finding low prices is usually not worth the time and effort. (R)2.961.0780.879
I am not willing to go to extra effort to find a lower price. (R)3.141.0840.850
I will grocery shop at more than one store to take advantage of low prices.2.851.1700.822
Environmental awareness (Cronbach’s Alpha: .815)
My purchase habits are affected by my concern for our environment.3.530.8920.867
It is important to me that the products I use do not harm the environment.3.720.7710.752
I am concerned about wasting the resources of our planet.4.020.9430.735
I would describe myself as environmentally responsible.3.500.8220.688
Health consciousness (Cronbach’s Alpha: .706)
My health is dependent on how and what I eat.4.090.8980.820
I think it is important to eat healthily.4.430.8000.710
If one eats healthily, one gets ill less frequently.3.990.8440.691
I am prepared to leave a lot, to eat as healthily as possible.3.240.9660.657
Empathy (Cronbach’s Alpha: .695)
I often have tender, concerned feelings for people less fortunate than me.3.700.8880.760
When I see someone being taken advantage of, I feel kind of protective toward them.3.900.8310.744
Sometimes I do not feel sorry for other people when they are having problems. (R)3.231.1350.674
When I see someone being treated unfairly, I sometimes do not feel very much pity for them. (R)3.981.0000.663
Positive attitude towards in vitro meat (Cronbach’s Alpha: .780)
I feel positive about the development of in vitro meat.3.920.8550.849
The production of in vitro meat is a necessary scientific development.3.670.9660.831
In vitro meat is likely to look, taste, smell, and feel the same as conventional meat.3.520.9160.730
Producing in vitro meat poses a risk to society. (R)3.740.9080.617
In vitro meat is unnatural. (R)3.021.0970.589
Positive attitude towards carnism (Cronbach’s Alpha: .808)
Meat is indispensable for a balanced diet.2.481.2190.865
To me, a proper meal requires meat.2.281.2630.845
I see no need to eat (even) less meat.2.351.1240.805
Eating meat is unfashionable. (R)3.091.0280.619
Food neophobia (Cronbach’s Alpha: .691)
I am afraid to eat things I have never had before.2.030.9630.773
I do not trust new foods.2.190.8590.689
I will eat almost anything. (R)2.951.1270.675
I am constantly sampling new and different foods. (R)2.531.0400.585
If I do not know what is in a food, I will not try it.2.531.0590.527
Note. Extraction method: principal component analysis. Rotation method: varimax with Kaiser normalization. Evaluation scheme: Likert scale from 1 ‘strongly disagree’ to 5 ‘strongly agree’ or reverse Likert scale from 1 ‘strongly agree’ to 5 ‘strongly disagree’. (R) = reverse coded. N = 200.
Table 4. Willingness to try in vitro meat of participants answering the quota questions (N = 660).
VariableDescriptionFrequencyShare (%)
Willingness to try in vitro meatYes 451 68.4
No, because I generally do not eat meat 111 16.8
No, because I do not want to buy/eat something like that 98 14.8
Table 5. Summary of the sociodemographic attributes for participants answering the quota questions (N = 660).
Share (%)
Answer:Answer:
All ResponsesAnswer: YesNo, Because I Generally Do Not Eat MeatNo, Because I Do Not Want to Buy/Eat Something Like That
VariablesDescription(100.0%)(68.4%)(16.8%)(14.8%)
GenderMale30.936.416.222.4
Female67.462.182.075.5
Age18–2941.442.154.123.5
30–3919.718.819.823.5
40–4914.113.315.316.3
50–5915.615.56.326.5
60–699.210.24.510.2
Vocational qualificationNo vocational qualification16.218.418.93.1
Vocational training30.231.721.632.7
Professional school diploma13.212.213.517.3
University degree37.135.342.339.8
Not specified3.32.43.67.1
Table 6. Model selection for the latent class segmentation.
No. of Latent
Classes
Log-LikelihoodAICCAICBICAverage Max.
Membership Probability
22354.074778.145015.554980.550.97
32226.574559.144918.664865.660.96
42146.464434.914916.524845.520.95
52085.354348.704952.414863.410.94
Table 7. Part-worth utilities for the four consumer groups (N = 200).
Total SampleGroup 1: Environmentally Conscious Consumers Group 2: Animal Protectors Group 3: Price-Conscious Consumers Group 4: Value-Oriented Consumers
AttributeLevels(100.00%)(36.50%) (15.50%) (31.00%) (17.00%)
Price per package (250 g)EUR 1.5088.58 38.74 a 39.15 a 203.02 b 31.96 a
EUR 2.5088.48 48.57 a 36.69 a 183.40 b 48.30 a
EUR 3.5073.76 52.90 b 43.36 a,b 127.49 a 48.28 a,b
EUR 4.5038.29 28.46 b 25.67 b 65.04 a 22.13 b
EUR 5.500.00 0.00 b 0.00 b 0.00 a 0.00 b
LabelStop Climate Change71.91 97.35 b 63.35 a 56.63 b 52.93 a
Cruelty-Free93.25 91.08 b 193.42 c 41.64 a 100.66 b
Bio94.61 106.32 b 119.59 b 50.66 a 126.87 c
Nutri Score34.49 42.96 b 19.53 a 35.10 c 28.81 b
No label0.00 0.00 b 0.00 a 0.00 c 0.00 b
OriginRegional50.42 72.73 c 46.62 b 1.10 a 95.89 d
Germany40.58 62.69 b 26.71 a 10.43 a 60.74 b
EU countries15.70 21.95 a,b 19.55 b,c 4.75 c 18.74 a
Not EU countries−30.85 −41.45 a −11.14 b −21.05 b −43.95 a
No indication0.00 0.00 a,b 0.00 b 0.00 c 0.00 a
Calories per 100 g48 kcal38.18 22.52 a 59.07 b 61.30 b 10.61 a
98 kcal32.27 25.64 b 54.23 c 45.45 b,c 2.43 a
148 kcal29.56 29.98 b 39.26 a 33.30 a 13.02 a
198 kcal23.99 20.58 b 31.06 a,b 24.58 a 23.75 c
248 kcal0.00 0.00 b 0.00 a 0.00 a 0.00 b
N.O. (Non-Option)No purchase−65.14 −99.31 a −42.86 b −110.57 a 70.79 c
Relative importance (%)Price30.13 22.53 a 17.11 a 51.36 b 19.60 a
Label31.33 32.43 b 49.70 c 19.39 a 33.97 b
Origin23.89 30.95 b 17.15 a 12.63 a 35.38 b
Calories14.66 14.10 a,b 16.04 b 16.62 b 11.04 a
Note. Superscripts stand for significant mean differences at the 0.05 level based on Tukey testing.
Table 8. Summary of the sociodemographic attributes for the latent class segments (N = 200).
Share (%)
VariableDescriptionTotal SampleGroup 1: Environmentally Conscious Consumers Group 2: Animal Protectors Group 3: Price-Conscious Consumers Group 4: Value-Oriented Consumers
GenderMale38.034.2 22.6 53.2 32.4
Female62.065.8 77.4 46.8 67.6
Age18–2926.026.0 16.1 27.4 32.4
30–3924.030.1 32.3 19.4 11.8
40–4916.016.4 19.4 14.5 14.7
50–5920.520.5 25.8 17.7 20.6
60–6913.56.8 6.5 21.0 20.6
Vocational qualificationNo vocational qualification19.511.0 9.7 38.7 11.8
Vocational training46.046.6 45.2 37.1 61.8
Professional school diploma10.513.7 16.1 6.5 5.9
University degree23.528.8 29.0 16.1 20.6
Not specified0.50.0 0.0 1.6 0.0
Number of children053.054.8 48.4 48.4 61.8
1–235.534.2 41.9 35.5 32.4
3–48.58.2 3.2 14.5 2.9
>40.00.0 0.0 0.0 0.0
Frequency of eating freshly cooked mealsSeveral times per month8.08.2 3.2 8.1 11.8
Once per week7.08.2 6.5 8.1 2.9
Several times per week53.547.9 45.2 64.5 52.9
Every day28.532.9 38.7 17.7 29.4
Number of meals eaten in company per day012.019.2 9.7 6.5 8.8
146.037.0 54.8 58.1 35.3
229.531.5 19.4 27.4 38.2
39.59.6 9.7 6.5 14.7
Frequency of meat product consumptionNever18.512.3 41.9 19.4 8.8
Several times per month15.516.4 9.7 12.9 23.5
Once per week19.524.7 19.4 8.1 29.4
Several times per week34.534.2 19.4 41.9 35.3
Every day9.09.6 3.2 16.1 0.0
DietOmnivore43.552.1 19.4 53.2 29.4
Vegetarian5.01.4 16.1 4.8 2.9
Vegan5.52.7 19.4 3.2 2.9
Flexitarian32.532.9 25.8 27.4 47.1
Pescatarian3.52.7 3.2 4.8 2.9
Other diet7.05.5 9.7 4.8 11.8
Mean
VariableUnit of MeasurementTotal SampleGroup 1: Environmentally Conscious Consumers Group 2: Animal Protectors Group 3: Price-Conscious Consumers Group 4: Quality-Conscious Consumers
Net available income per monthEUR1229.771628.49b1294.88a,b913.74a947.03
Note. Superscripts stand for significant mean differences at the 0.05 level based on Tukey testing.
Table 9. Profiling the latent consumer segments (N = 200).
FactorsMean Factor Scores (SD)
Group 1: Environmentally Conscious Consumers (N = 73) Group 2: Animal Protectors (N = 31) Group 3: Price-Conscious Consumers (N = 62) Group 4: Value-Oriented Consumers (N = 34)
Price consciousness −0.169 (1.036) a −0.158 (1.158) a0.324 (0.845)a −0.098 (0.934) a
Environmental awareness −0.002 (1.016) a,b 0.244 (0.874) a,b −0.292 (1.066) a 0.313 (0.819) b
Health consciousness 0.166 (0.982) a,b 0.334 (0.862) b −0.298 (1.100) a −0.097 (0.822) a,b
Empathy 0.008 (0.955) a 0.217 (0.902) a −0.245 (1.157) a 0.232 (0.783) a
Positive attitude towards in vitro meat 0.026 (0.961) a 0.279 (0.938) a −0.045 (1.083) a −0.227 (0.953) a
Positive attitude towards carnism 0.142 (0.943) b −0.479 (0.889) a 0.232 (1.120) b −0.294 (0.770) a,b
Food neophobia −0.105 (1.091) a −0.140 (0.910) a 0.104 (0.983) a 0.157 (0.900) a
Note. Items were assessed by means of 5-point Likert scales. Superscripts stand for significant mean differences at the 0.05 level based on Tukey testing.
Table 10. Results of the regression analysis.
FactorsStandardized BetaSig.
Price consciousness −0.077 0.260
Environmental awareness 0.134 0.066
Health consciousness 0.233 0.002
Empathy 0.155 0.027
Positive attitude towards in vitro meat 0.034 0.631
Positive attitude towards carnism −0.142 0.072
Food neophobia 0.007 0.923
Dependent variable: label (RI), N = 200, R2 = 13.6%.
Table 11. Product settings used in the market simulation based on the preferences of the four consumer segments.
Attribute Levels
Market StrategyProductPreference AffiliationPriceLabelOriginCalories
Variant 1 (4 products)1Group 1EUR 3.50BioRegional148 kcal
2Group 2EUR 3.50Cruelty-FreeRegional48 kcal
3Group 3EUR 1.50Stop Climate ChangeGermany48 kcal
4Group 4EUR 2.50BioRegional198 kcal
Variant 2 (3 products)1Group 1 + 4EUR 3.50BioRegional148 kcal
2Group 2EUR 3.50Cruelty-FreeRegional48 kcal
3Group 3EUR 1.50Stop Climate ChangeGermany48 kcal
Table 12. Market simulation for two market strategies (N = 200).
Shares of Preference (%)
Market StrategyProductAll AttributesCalories Excluded
Variant 1 (4 products)118.819.0
226.325.7
331.930.0
421.723.7
None1.31.5
Variant 2 (3 products)130.429.9
230.430.6
337.437.5
None1.81.9
Note: simulation calculation based on the results of the Hierarchical Bayes model.
Table 13. Market simulation of two market strategies for the latent class segments (N = 200).
Shares of Preference (%)
Total SampleGroup 1: Environmentally Conscious ConsumersGroup 2: Animal ProtectorsGroup 3: Price-Conscious ConsumersGroup 4: Value-Oriented Consumers
Market StrategyProduct(100.0%)(36.5%)(15.5%)(31.0%)(17.0%)
Variant 1 (4 products)121.334.36.15.535.9
226.220.685.48.716.4
329.219.81.868.62.6
422.324.96.117.041.1
None1.00.40.60.23.9
Variant 2 (3 products)130.145.86.56.760.9
232.027.390.910.527.9
336.326.42.082.64.5
None1.50.60.60.26.7
Note: simulation calculations based on the results of the latent class analysis.
Table 14. Investigation of the price sensitivity of the latent class segments in the market simulation (N = 200).
Shares of Preference (%)
Market StrategyConsumer GroupProductEUR 1.50EUR 2.50EUR 3.50EUR 4.50EUR 5.50
Variant 1 (4 products)Total123.724.022.516.311.7
231.629.926.521.416.5
321.519.614.39.66.0
422.122.421.115.010.8
1: Environmentally Conscious Consumers132.136.237.831.121.9
219.522.323.418.512.3
323.226.627.722.014.8
424.828.429.824.016.3
2: Animal Protectors16.14.64.53.92.1
286.181.981.679.567.5
31.31.01.00.80.5
46.04.54.43.92.1
3: Price-Conscious Consumers117.311.73.81.20.3
227.519.36.52.00.5
339.629.310.63.40.9
415.510.43.31.00.3
4: Value-Oriented Consumers133.637.840.323.519.3
215.418.019.610.07.9
33.34.04.42.01.6
442.847.450.031.226.1
Variant 2 (3 products)Total132.933.131.124.118.5
238.336.933.026.421.0
327.025.218.912.98.4
1: Environmentally Conscious Consumers142.747.248.841.530.6
225.829.330.624.616.8
330.834.936.229.420.4
2: Animal Protectors16.54.94.84.22.3
291.688.988.787.278.5
31.41.11.00.90.5
3: Price-Conscious Consumers120.514.14.61.50.4
232.523.48.12.60.7
346.835.813.84.51.2
4: Value-Oriented Consumers158.763.165.546.340.2
226.930.732.918.214.8
35.86.97.63.62.8
Disclaimer/Publisher’s Note: The statements, opinions and data contained in all publications are solely those of the individual author(s) and contributor(s) and not of MDPI and/or the editor(s). MDPI and/or the editor(s) disclaim responsibility for any injury to people or property resulting from any ideas, methods, instructions or products referred to in the content.

