
A Comparative Life Cycle Assessment of End-of-Life Scenarios for Light Electric Vehicles: A Case Study of an Electric Moped


Abstract
1. Introduction
End-of-Life and R-Strategies
- Refuse (R0): Make product redundant by abandoning its function or by offering the same function with a radically different product.
- Rethink (R1): Make product use more intensive (e.g., through sharing products or by putting multi-functional products on the market).
- Reduce (R2): Increase efficiency in product manufacture or use by consuming fewer natural resources and materials.
- Reuse (R3): Reuse of a discarded product that remains in good condition and fulfils its original function.
- Repair (R4): Repair and maintain a defective product to be used for its original function.
- Refurbish (R5): Restore an old product and update it.
- Remanufacture (R6): Use parts of a discarded product in a new product with the same function.
- Repurpose (R7): Use a discarded product or part of it in a new product with a different function.
- Recycle (R8): Process materials to obtain the same (high-grade) or lower (low-grade) quality.
- Recover (R9): Incinerate materials with energy recovery.
2. Materials and Methods
2.1. Use Case: Shared E-Moped
- 1 Base Scenario: This scenario represents the status quo EoL treatment in Germany and functions as a baseline. Here, regulations for the EoL vehicles [31] and EoL batteries [33], as well as current treatment rates [34], are considered. We capture the current treatment as focused on recycling, considering minor shares for reuse and some components for incineration and landfill.
- 2 Component Reuse: Compared to the defined status quo, this alternative EoL scenario investigates the GHG reduction potential by selecting a higher share of components for reuse, compared to current treatment rates [34].
- 3 Battery Repurpose: To consider alternative scenarios aligned with proposed EoL strategies such as the Battery Pass directive [26], repurposing battery cells into a stationary energy storage system is investigated.
- 4 Landfill: To represent a negative disposal scenario due to insufficient regulations, the disposal via a commercial waste landfill facility is modelled.
2.2. Life Cycle Assessment
2.2.1. Goal and Scope
2.2.2. Life Cycle Inventory
- Scenario 1: Base Scenario

| Material/Component | Weight [kg] | Weight Share [%] | Treatment | End-of-Life Process |
|---|---|---|---|---|
| Remaining Vehicle Body (RVB): 106.89 kg | ||||
| Steel | 40.71 | 38.1 | Recycle | DE: Car shredder * [40] |
| Plastics | 31.35 | 29.3 | Recycle | RER: Plastic granulate secondary * [40] |
| 7.82 | 7.3 | Incineration | DE: Commercial waste in municipal waste incineration plant [40] | |
| 3.85 | 3.6 | Landfill | DE: Car shredder *, RER: Commercial waste in landfill [40] | |
| 1.76 | 1.7 | Incineration | DE: Car shredder *, DE: Commercial waste in municipal waste incineration plant [40] | |
| Aluminium | 12.18 | 11.4 | Recycle | DE: Car shredder *, RNA: Secondary aluminium ingot [40] |
| 4.48 | 4.2 | Recycle after Reuse: 50%wt | DE: Car shredder *, RNA: Secondary aluminium ingot [40] | |
| Stainless Steel | 1.76 | 1.6 | Recycle | DE: Car shredder * [40] |
| PCB | 1.10 | 1 | Incineration | DE: Commercial waste in municipal waste incineration plant [40] |
| Cables | 0.61 | <1 | Landfill | DE: Car shredder *, RER: Commercial waste in landfill [40] |
| 0.28 | <1 | Incineration | DE: Car shredder *, DE: Commercial waste in municipal waste incineration plant [40] | |
| 0.1 | <1 | Incineration after Reuse: 50%wt | DE: Car shredder *, DE: Commercial waste in municipal waste incineration plant [40] | |
| Copper | 0.67 | <1 | Recycle | DE: Car shredder * [40] |
| Rest | 0.07 | <1 | Incineration | DE: Car shredder *, DE: Commercial waste in municipal waste incineration plant [40] |
| 0.15 | <1 | Landfill | DE: Car shredder *, RER: Commercial waste in landfill [40] | |
| Battery: 12.25 kg | ||||
| Battery cells | 8.05 | 65.5 | Recycle | Cell Recycling * [48] |
| Aluminium | 2.36 | 19.2 | Recycle | DE: Car shredder *, RNA: Secondary aluminium ingot [40] |
| Cable | 1.09 | 8.9 | Recycle | Shredder fraction after manual dismantling of used electronic product [41], RNA: Secondary aluminium ingot, DE: Commercial waste in municipal waste incineration plant [40] |
| Plastics | 0.55 | 4.5 | Recycle | RER: Plastic granulate secondary * [40] |
| Steel | 0.12 | 1 | Recycle | DE: Car shredder * [40] |
| PCB | 0.08 | <1 | Recycle | Shredder fraction after manual dismantling of used electronic product [41], RNA: Secondary aluminium ingot, DE: Commercial waste in municipal waste incineration plant [40] |
- Scenario 2: Component Reuse
| Material/Component | Weight [kg] | Weight Share [%] | Treatment | End-of-Life Process |
|---|---|---|---|---|
| Remaining Vehicle Body (RVB): 106.89 kg | ||||
| Steel | 25.2 | 23.6 | Recycle | DE: Car shredder * [40] |
| 15.5 | 14.5 | Recycle after Reuse: 50%wt | DE: Car shredder * [40] | |
| Plastics | 31.35 | 29.3 | Recycle | RER: Plastic granulate secondary * [40] |
| 7.82 | 7.3 | Incineration | DE: Commercial waste in municipal waste incineration plant [40] | |
| 3.85 | 3.6 | Landfill | DE: Car shredder *, RER: Commercial waste in landfill [40] | |
| 1.76 | 1.7 | Incineration | DE: Car shredder *, DE: Commercial waste in municipal waste incineration plant [40] | |
| Aluminium | 12.18 | 11.4 | Recycle | DE: Car shredder *, RNA: Secondary aluminium ingot [40] |
| 4.48 | 4.2 | Recycle after Reuse: 50%wt | DE: Car shredder *, RNA: Secondary aluminium ingot [40] | |
| Stainless Steel | 1.76 | 1.6 | Recycle | DE: Car shredder * [40] |
| PCB | 1.10 | 1 | Incineration | DE: Commercial waste in municipal waste incineration plant [40] |
| Cables | 0.61 | <1 | Landfill | DE: Car shredder *, RER: Commercial waste in landfill [40] |
| 0.28 | <1 | Incineration | DE: Car shredder *, DE: Commercial waste in municipal waste incineration plant [40] | |
| 0.1 | <1 | Incineration after Reuse: 50% wt | DE: Car shredder *, DE: Commercial waste in municipal waste incineration plant [40] | |
| Copper | 0.67 | <1 | Recycle | DE: Car shredder * [40] |
| Rest | 0.07 | <1 | Incineration | DE: Car shredder * [40], DE: Commercial waste in municipal waste incineration plant [40] |
| 0.15 | <1 | Landfill | DE: Car shredder *, RER: Commercial waste in landfill [40] | |
| Battery: 12.25 kg | ||||
| Battery cells | 8.05 | 65.5 | Recycle | Cell Recycling * [48] |
| Aluminium | 2.36 | 19.2 | Recycle after Reuse: 50%wt | DE: Car shredder *, RNA: Secondary aluminium ingot [40] |
| Cable | 1.09 | 8.9 | Recycle | Shredder fraction after manual dismantling of used electronic product [41], RNA: Secondary aluminium ingot, DE: Commercial waste in municipal waste incineration plant [40] |
| Plastics | 0.55 | 4.5 | Recycle after Reuse: 50%wt | RER: Plastic granulate secondary * [40] |
| Steel | 0.12 | 1 | Recycle after Reuse: 50%wt | DE: Car shredder * [40] |
| PCB | 0.08 | <1 | Recycle | Shredder fraction after manual dismantling of used electronic product [41], RNA: Secondary aluminium ingot, DE: Commercial waste in municipal waste incineration plant [40] |
- Scenario 3: Battery Repurpose
| Material/Component | Weight [kg] | Weight Share [%] | Treatment | End-of-Life Process |
|---|---|---|---|---|
| Remaining Vehicle Body (RVB): 106.89 kg | ||||
| Steel | 40.71 | 38.1 | Recycle | DE: Car shredder * [40] |
| Plastics | 31.35 | 29.3 | Recycle | RER: Plastic granulate secondary * [40] |
| 7.82 | 7.3 | Incineration | DE: Commercial waste in municipal waste incineration plant [40] | |
| 3.85 | 3.6 | Landfill | DE: Car shredder *, RER: Commercial waste in landfill [40] | |
| 1.76 | 1.7 | Incineration | DE: Car shredder *, DE: Commercial waste in municipal waste incineration plant [40] | |
| Aluminium | 12.18 | 11.4 | Recycle | DE: Car shredder *, RNA: Secondary aluminium ingot [40] |
| 4.48 | 4.2 | Recycle after Reuse: 50% wt | DE: Car shredder *, RNA: Secondary aluminium ingot [40] | |
| Stainless Steel | 1.76 | 1.6 | Recycle | DE: Car shredder * [40] |
| PCB | 1.10 | 1 | Incineration | DE: Commercial waste in municipal waste incineration plant [40] |
| Cables | 0.61 | <1 | Landfill | DE: Car shredder *, RER: Commercial waste on landfill [40] |
| 0.28 | <1 | Incineration | DE: Car shredder *, DE: Commercial waste in municipal waste incineration plant [40] | |
| 0.1 | <1 | Incineration after Reuse: 50% wt | DE: Car shredder *, DE: Commercial waste in municipal waste incineration plant [40] | |
| Copper | 0.67 | <1 | Recycle | DE: Car shredder * [40] |
| Rest | 0.07 | <1 | Incineration | DE: Car shredder *, DE: Commercial waste in municipal waste incineration plant [40] |
| 0.15 | <1 | Landfill | DE: Car shredder *, RER: Commercial waste in landfill [40] | |
| Battery: 12.25 kg | ||||
| Battery cells | 4.03 | 32.75 | Recycling | Cell Recycling * [48] |
| 4.03 | 32.75 | Repurpose | Battery home storage system Cradle–Grave [52] | |
| Aluminium | 2.36 | 19.2 | Recycling | DE: Car shredder *, RNA: Secondary aluminium ingot [40] |
| Cable | 1.09 | 8.9 | Recycling | Shredder fraction after manual dismantling of used electronic product [41], RNA: Secondary aluminium ingot, DE: Commercial waste in municipal waste incineration plant [40] |
| Plastics | 0.55 | 4.5 | Recycling | RER: Plastic granulate secondary * [40] |
| Steel | 0.12 | 1 | Recycling | DE: Car shredder * [40] |
| PCB | 0.08 | <1 | Recycling | Shredder fraction after manual dismantling of used electronic product [41], RNA: Secondary aluminium ingot, DE: Commercial waste in municipal waste incineration plant [40] |
- Scenario 4: Complete Landfill
| Material/Component | Weight [kg] | Weight Share [%] | Treatment | End-of-Life Process |
|---|---|---|---|---|
| e-mopped and replacements | 119.14 | 100 | Landfill | RER: Commercial waste in landfill [40] |
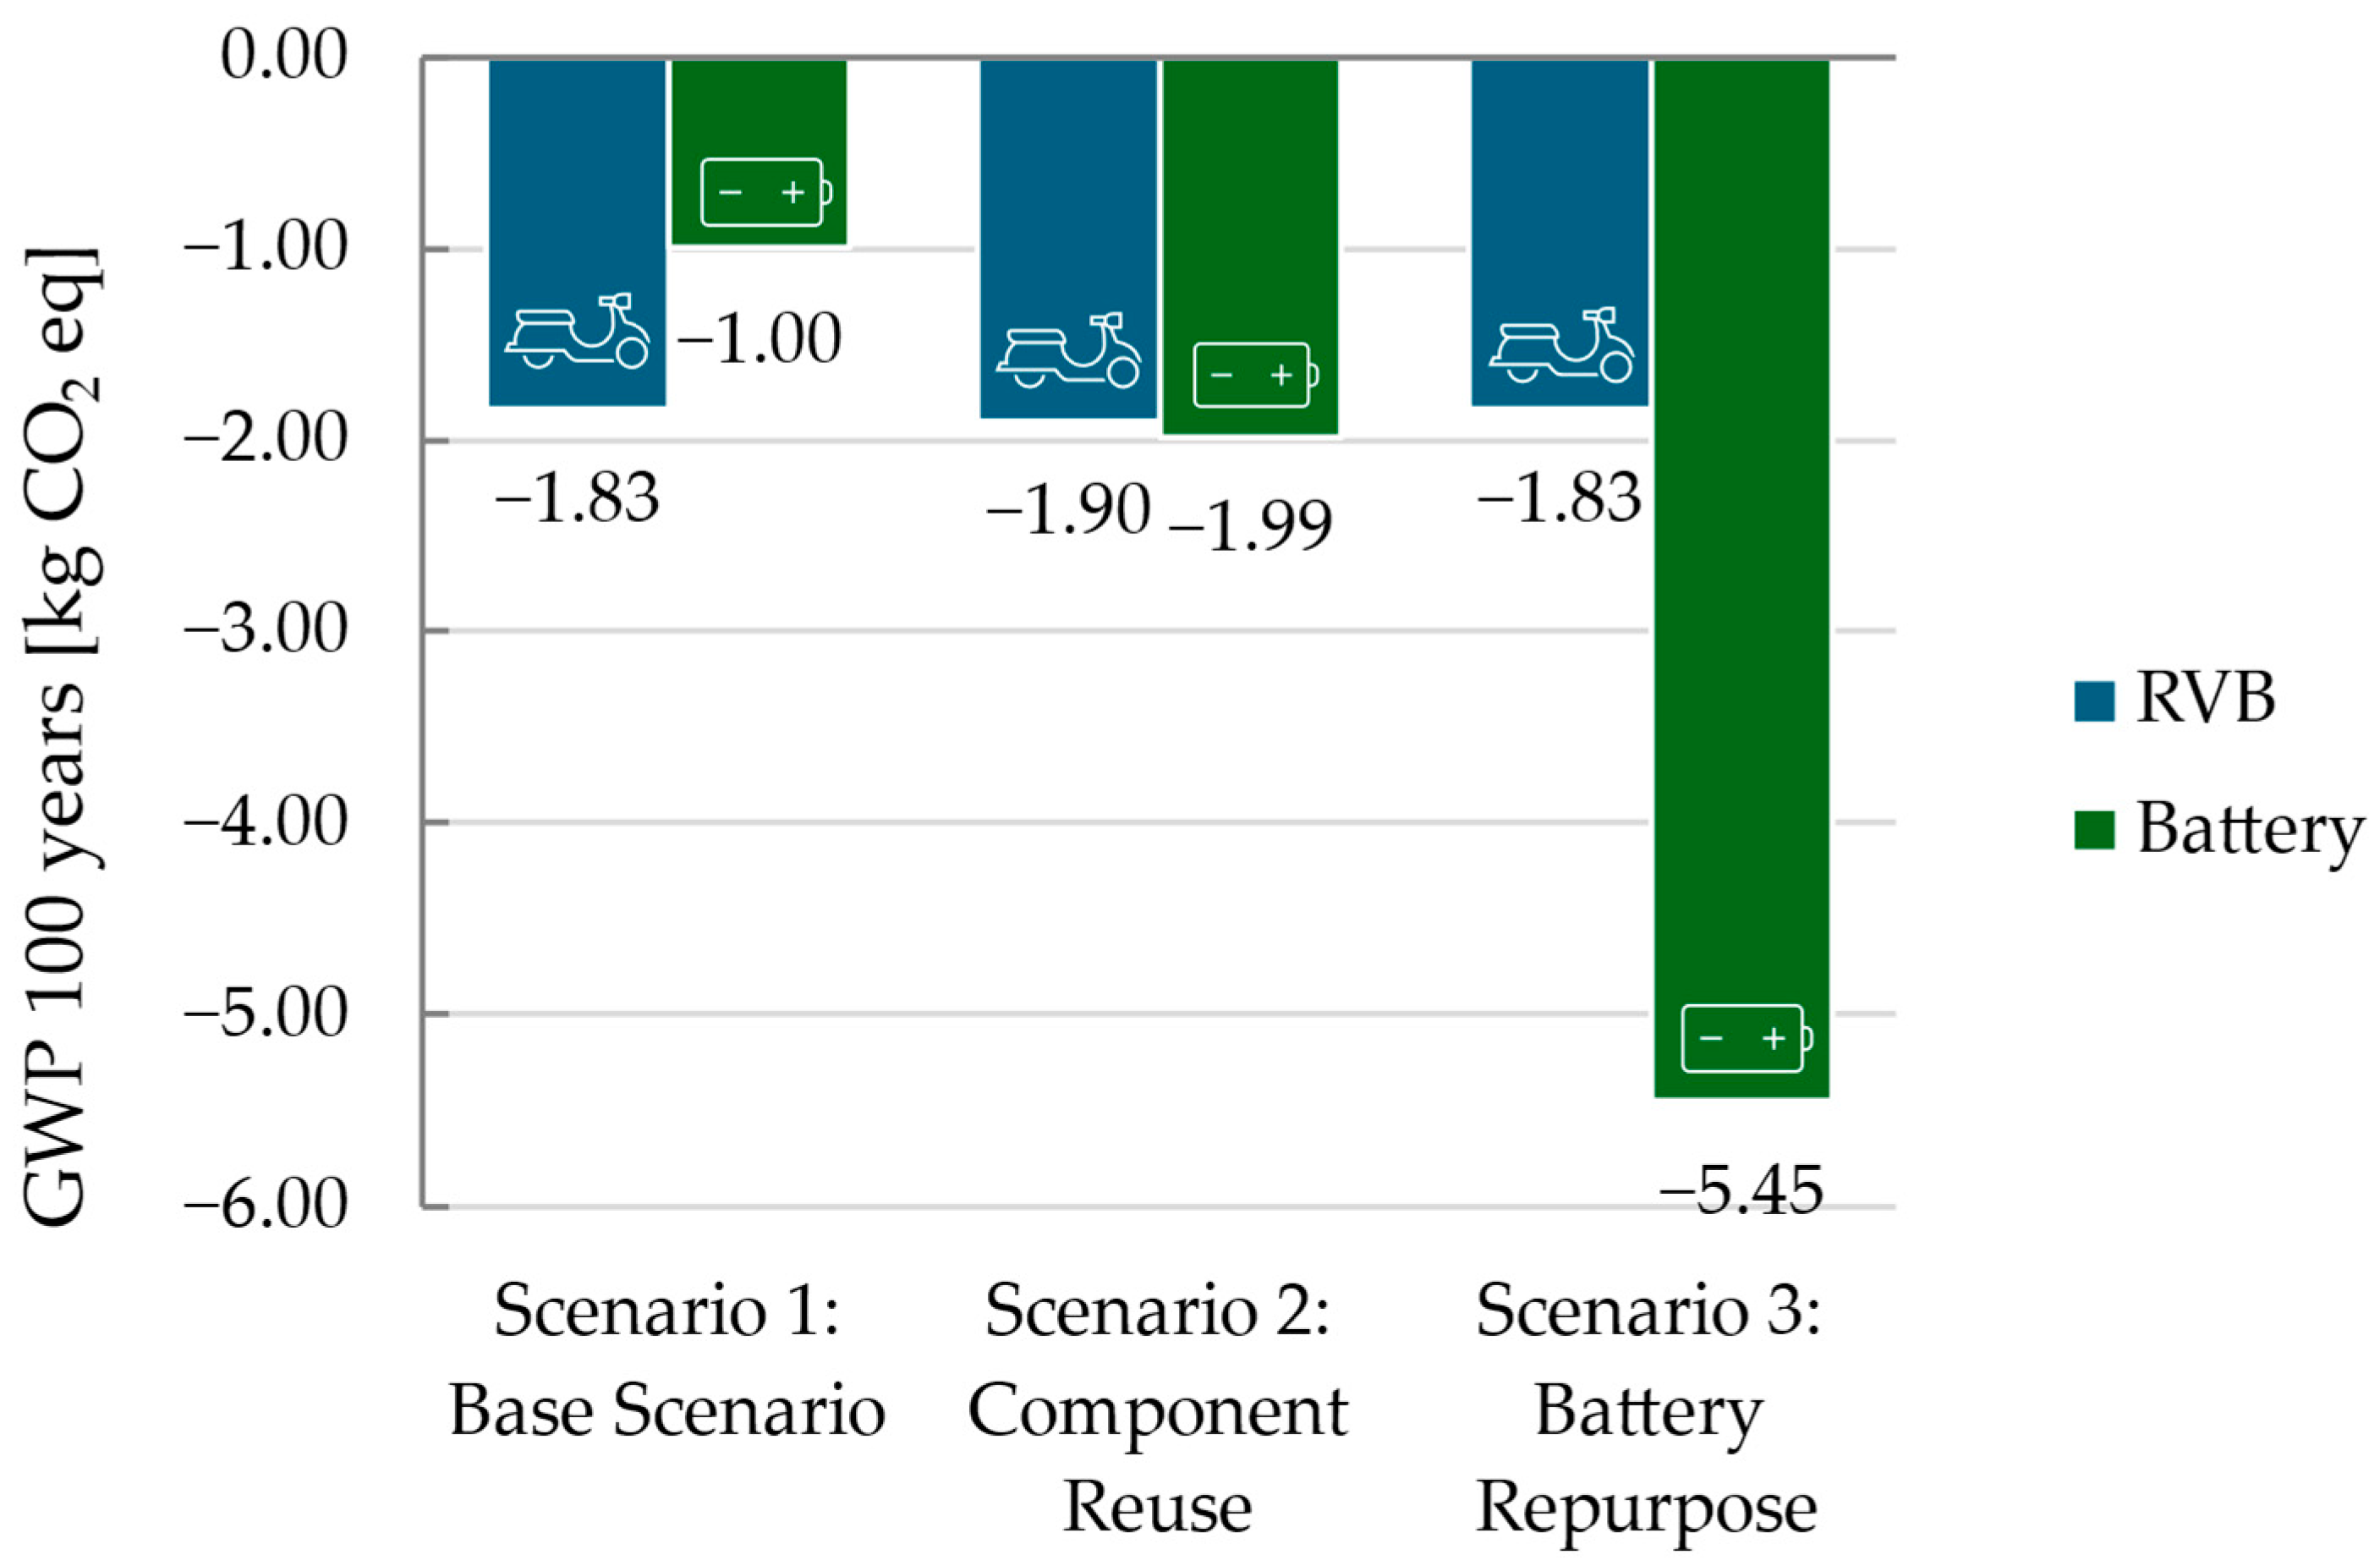
3. Results
4. Discussion
5. Conclusions
Author Contributions
Funding
Institutional Review Board Statement
Informed Consent Statement
Data Availability Statement
Acknowledgments
Conflicts of Interest
Abbreviations
| EoL | End-of-life |
| LEVs | Light electric vehicles |
| LCA | Life cycle assessment |
| EU | European Union |
| GWP100 | Global warming potential over 100 years |
| GHG | Greenhouse gas emissions |
| EVs | Electric vehicles |
| CFF | Circular footprint formula |
| CE | Circular economy |
| WEEE | Waste electrical and electronic equipment |
| RVB | Remaining vehicle body |
| FU | Functional unit |
| LCI | Life cycle inventory |
| LCIA | Life cycle inventory analysis |
| SLF | Shredder light fraction |
| NMC | Nickel, Manganese, Cobalt |
| DE | Germany |
| RER | European Region |
| RNA | North America |
| PCB | Printed circuit board |
| SoH | State of health |
| HSS | House storage system |
| PP | Polypropylene |
| ABS | Acrylonitrile butadiene styrene |
| SBR | Styrene butadiene rubber |
| PTFE | Polytetrafluoroethylene |
Appendix A
| LCI Segment | Equation |
| Primary material input | |
| Secondary material input | |
| Recycling | |
| Energy recovery | |
| Disposal |
| Parameter | Definition |
| Allocation factor of burdens and credits between the supplier and user of recycled materials. | |
| Allocation factor of energy recovery processes, which applies to both burdens and credits. | |
| Specific emissions and resources consumed (per functional unit) arising from disposal of waste material at the analysed product’s EoL, without energy recovery. | |
| Specific emissions and resources consumed (per functional unit) arising from the energy recovery process (e.g., incineration with energy recovery, landfill with energy recovery, etc.). | |
| Specific emissions and resources consumed (per functional unit) arising from the recycling process of the recycled (reused) material, including collection, sorting, and transportation processes. | |
| Specific emissions and resources consumed (per functional unit) arising from the recycling process at EoL, including the collection, sorting, and transportation processes. | |
| Analogues to for electricity. | |
| Specific emissions and resources consumed (per functional unit) that would have arisen from the specific substituted energy source respective to heat. | |
| Specific emissions and resources consumed (per functional unit) arising from the acquisition and pre-processing of virgin material. | |
| Specific emissions and resources consumed (per functional unit) arising from the acquisition and pre-processing of virgin material assumed to be substituted by recyclable materials. | |
| Lower heating value of material in the product used for energy recovery. | |
| Relation of the quality of the ingoing secondary material to the quality of the primary material . | |
| Relation of the quality of the outgoing secondary material to the quality of the primary material . | |
| The proportion of material in the input to production that was recycled from a previous system. | |
| The proportion of material in the product that will be recycled (or reused) in a subsequent system. Therefore, R2 will consider the inefficiencies in the collection and recycling (or reuse) processes. R2 will be measured at the output of the recycling plant. | |
| The proportion of product material that is used for energy recovery at EoL. | |
| Analogues to for electricity. | |
| Efficiency of energy recovery process for heat. |
References
- Transport Energy and CO2: Moving towards Sustainability, 1st ed.; Organization for Economic Cooperation & Development: Paris, France, 2009; ISBN 978-92-64-07316-6.
- European Comission (EC). Regions and Cities Illustrated. Available online: https://ec.europa.eu/eurostat/cache/RCI/#?vis=degurb.gen&lang=en (accessed on 16 May 2025).
- European Parliament. New EU Urban Mobility Framework C/2023/1058; European Parliament: Brussels, Belgium, 2023.
- International Energy Agency Tracking Transport. Available online: https://www.iea.org/energy-system/transport (accessed on 11 February 2025).
- Avis, W. Emission Reductions and Health Impacts of LEVs; Institute of Development Studies (IDS): Brighton, UK, 2021. [Google Scholar]
- Honey, E.; Lee, H.; Suh, I.-S. Future Urban Transportation Technologies for Sustainability with an Emphasis on Growing Mega Cities: A Strategic Proposal on Introducing a New Micro Electric Vehicle Segment. World Technopolis Rev. 2014, 3, 139–152. [Google Scholar] [CrossRef]
- Ramoni, M.O.; Zhang, H.-C. End-of-Life (EOL) Issues and Options for Electric Vehicle Batteries. Clean. Technol. Environ. Policy 2013, 15, 881–891. [Google Scholar] [CrossRef]
- Koroma, M.S.; Costa, D.; Philippot, M.; Cardellini, G.; Hosen, M.S.; Coosemans, T.; Messagie, M. Life Cycle Assessment of Battery Electric Vehicles: Implications of Future Electricity Mix and Different Battery End-of-Life Management. Sci. Total Environ. 2022, 831, 154859. [Google Scholar] [CrossRef] [PubMed]
- UN-Habitat. The Role of Electric Mobility for Low-Carbon and Sustainable Cities; United Nations Human Settlements Programme (UN-Habitat): Nairobi, Kenya, 2022. [Google Scholar]
- Ewert, A.; Brost, M.; Eisenmann, C.; Stieler, S. Small and Light Electric Vehicles: An Analysis of Feasible Transport Impacts and Opportunities for Improved Urban Land Use. Sustainability 2020, 12, 8098. [Google Scholar] [CrossRef]
- Oeschger, G.; Carroll, P.; Caulfield, B. Micromobility and Public Transport Integration: The Current State of Knowledge. Transp. Res. Part D Transp. Environ. 2020, 89, 102628. [Google Scholar] [CrossRef]
- Statista Research Department Micromobility—Worldwide Outlook. Available online: https://www.statista.com/outlook/mmo/micromobility/worldwide (accessed on 16 May 2025).
- Statista Research Department E-Scooter Sharing—Worldwide Outlook. Available online: https://www.statista.com/outlook/mmo/shared-mobility/e-scooter-sharing/worldwide (accessed on 16 May 2025).
- Das, P.K.; Bhat, M.Y.; Sajith, S. Life Cycle Assessment of Electric Vehicles: A Systematic Review of Literature. Environ. Sci. Pollut. Res. 2023, 31, 73–89. [Google Scholar] [CrossRef] [PubMed]
- Hill, N.; Raugei, M.; Pons, A.; Vasileiadis, N.; Ong, H.; Casullo, L. Research for TRAN Committee—Environmental Challenges through the Life Cycle of Battery Electric Vehicles; European Parliament, Policy Department for Structural and Cohesion Policies: Brussels, Belgium, 2023. [Google Scholar]
- Schelte, N.; Severengiz, S.; Schünemann, J.; Finke, S.; Bauer, O.; Metzen, M. Life Cycle Assessment on Electric Moped Scooter Sharing. Sustainability 2021, 13, 8297. [Google Scholar] [CrossRef]
- Moreau, H.; De Jamblinne De Meux, L.; Zeller, V.; D’Ans, P.; Ruwet, C.; Achten, W.M.J. Dockless E-Scooter: A Green Solution for Mobility? Comparative Case Study between Dockless E-Scooters, Displaced Transport, and Personal E-Scooters. Sustainability 2020, 12, 1803. [Google Scholar] [CrossRef]
- Ishaq, M.; Ishaq, H.; Nawaz, A. Life Cycle Assessment of Electric Scooters for Mobility Services: A Green Mobility Solutions. Int. J. Energy Res. 2022, 46, 20339–20356. [Google Scholar] [CrossRef]
- Egede, P. Environmental Assessment of Lightweight Electric Vehicles; Sustainable Production, Life Cycle Engineering and Management; Springer: Cham, Switzerland, 2017; ISBN 978-3-319-40276-5. [Google Scholar]
- Felipe-Falgas, P.; Madrid-Lopez, C.; Marquet, O. Assessing Environmental Performance of Micromobility Using LCA and Self-Reported Modal Change: The Case of Shared E-Bikes, E-Scooters, and E-Mopeds in Barcelona. Sustainability 2022, 14, 4139. [Google Scholar] [CrossRef]
- Nikolic, M.; Bergmann, G.; Schelte, N.; Severengiz, S. Closing the Loop of Small WEEE—Life Cycle Based Approach for the Evaluation of End-of-Life Strategies on the Example of Coffee Machines. Resour. Conserv. Recycl. Adv. 2024, 23, 200220. [Google Scholar] [CrossRef]
- Ellen MacArthur Foundation. Towards a Circular Economy: Business Rationale for an Accelerated Transition; Ellen Macarthur Foundation: Isle of Wight, UK, 2015. [Google Scholar]
- Rose, C.M. Design for Environment: A Method for Formulating Product End-of-Life Strategies; Stanford University: Stanford, CA, USA, 2001. [Google Scholar]
- Becker, J.; Beverungen, D.; Winter, M.; Menne, S. Umwidmung Und Weiterverwendung von Traktionsbatterien; Springer Vieweg: Wiesbaden, Germany, 2019; ISBN 978-3-658-21020-5. [Google Scholar]
- Potting, J.; Hekkert, M.; Worrell, E.; Hanemaaijer, A. Circular Economy: Measuring Innovation in the Product Chain; PBL Netherlands Assessment Agency: The Hague, The Netherlands, 2017. [Google Scholar]
- Herrmann, S.; Niemann, N.; Vahle, T.; Schenk, S.; Schneider, A.; Braunfels, A.; Teuber, A.; von Boetticher, L.; Marulanda, J. Value Assessment of the Battery Passport, Version 1.0—An Exploratory Assessment of Economic, Environmental and Social Benefits; Battery Pass Consortium: Brussels, Belgium, 2025. [Google Scholar]
- European Parliament & Council of the European Union. Directive 2002/24/EC of the European Parliament and of the Council of 18 March 2002 Relating to the Type-Approval of Two or Three-Wheel Motor Vehicles and Repealing Council Directive 92/61/EEC; European Parliament & Council of the European Union: Brussels, Belgium, 2002. [Google Scholar]
- European Comission (EC). Proposal for a Regulation of the European Parliament and of the Council on Circularity Requirements for Vehicle Design and on Management of End-of-Life Vehicles, Amending Regulations (EU) 2018/858 and 2019/1020 and Repealing Directives 2000/53/EC and 2005/64/EC; European Comission (EC): Brussel, Belgium, 2023.
- European Parliament and Council Regulation (EU). No 168/2013 of the European Parliament and of the Council of 15 January 2013 on the Approval and Market Surveillance of Two- or Three-Wheel Vehicles and Quadricycles Text with EEA Relevance; European Parliament and Council Regulation (EU): Brussels, Belgium, 2013. [Google Scholar]
- European Parliament & Council of the European Union. Directive 2012/19/EU of the European Parliament and of the Council of 4 July 2012 on Waste Electrical and Electronic Equipment (WEEE); European Parliament & Council of the European Union: Brussels, Belgium, 2012. [Google Scholar]
- Federal Ministry of Justice of Germany. Regulation on the Transfer, Take-Back, and Environmentally Sound Disposal of End-of-Life Vehicles; Federal Ministry of Justice of Germany: Berlin, Germany, 1997. [Google Scholar]
- Knappe, F.; Reinhardt, J.; Kauertz, B.; Ritthoff, M.; Lehmann, M. Technical Potential Analysis for Increasing Plastic Recycling and the Use of Recyclates; Umweltbundesamt: Dessau-Roßlau, Germany, 2021. [Google Scholar]
- Federal Ministry of Justice of Germany. Act on the Placing on the Market, Take-Back, and Environmentally Sound Disposal of Batteries and Accumulators (Batteries Act—BattG); Federal Ministry of Justice of Germany: Berlin, Germany, 2009. [Google Scholar]
- Umweltbundesamt; Bundesministerium für Umwelt, Naturschutz, nukleare Sicherheit und Verbraucherschutz. Annual Report on End-of-Life Vehicle Recycling Rates in Germany in 2022; Umweltbundesamt: Dessau-Roßlau, Germany, 2024. [Google Scholar]
- ISO 14044; Environmental Management—Life Cycle Assessment—Requirements and Guidelines. ISO: Geneva, Switzerland, 2009.
- ISO 14040; Environmental Management—Life Cycle Assessment—Principals and Framework. ISO: Geneva, Switzerland, 2006.
- European Comission (EC). Commission Recommendation (EU) 2021/2279 of 15 December 2021 on the Use of the Environmental Footprint Methods to Measure and Communicate the Life Cycle Environmental Performance of Products and Organisations; European Comission (EC): Brussels, Belgium, 2021.
- Vadenbo, C.; Ekvall, T.; Rydberg, T. Modeling Recycling in Life Cycle Assessment; Swedish Life Cycle Center: Göteborg, Sweden, 2020. [Google Scholar]
- Richa, K.; Babbitt, C.W.; Nenadic, N.G.; Gaustad, G. Environmental Trade-Offs across Cascading Lithium-Ion Battery Life Cycles. Int. J. Life Cycle Assess 2017, 22, 66–81. [Google Scholar] [CrossRef]
- Sphera Solutions GmbH LCA for Experts—Product Sustainability Software, Version 10.9.1.10. Software Zur Ganzheitlichen Bilanzierung; Sphera: Chicago, IL, USA, 2024.
- Ecoinvent Ecoinvent—Database. Available online: https://ecoinvent.org/the-ecoinvent-database/ (accessed on 20 February 2025).
- Forster, P.; Ramaswamy, V.; Artaxo, P.; Berntsen, T.; Betts, R.; Fahey, D.W.; Haywood, J.; Lean, J.; Lowe, D.C.; Myhre, G.; et al. Changes in Atmospheric Constituents and in Radiative Forcing. In Climate Change 2007: The Physical Science Basis; Cambridge University Press: Cambridge, MA, USA, 2007. [Google Scholar]
- Institute of Environmental Sciences Leiden CML-IA Characterisation Factors. Available online: https://www.universiteitleiden.nl/en/research/research-output/science/cml-ia-characterisation-factors (accessed on 20 February 2025).
- European Parliament & Council of the European Union. Regulation (EU) 2023/1542 of the European Parliament and of the Council of 12 July 2023 Concerning Batteries and Waste Batteries, Amending Directive 2008/98/EC and Regulation (EU) 2019/1020 and Repealing Directive 2006/66/EC; European Parliament & Council of the European Union: Brussels, Belgium, 2023. [Google Scholar]
- Zhou, Y.; Cui, X.-D.; Lin, A.-J.; Dong, Y.; Duan, G. Environmental life cycle assessment on the recycling processes of power batteries for new energy vehicles. J. Clean. Prod. 2024, 488, 144641. [Google Scholar] [CrossRef]
- European Parliament & Council of the European Union. Directive 2000/53/EC of the European Parliament and of the Council of 18 September 2000 on End-of Life Vehicles—Commission Statements; European Parliament & Council of the European Union: Brussels, Belgium, 2000. [Google Scholar]
- Swain, B. Recovery and Recycling of Lithium: A Review. Sep. Purif. Technol. 2017, 172, 388–403. [Google Scholar] [CrossRef]
- Cusenza, M.A.; Bobba, S.; Ardente, F.; Cellura, M.; Di Persio, F. Energy and Environmental Assessment of a Traction Lithium-Ion Battery Pack for Plug-in Hybrid Electric Vehicles. J. Clean. Prod. 2019, 215, 634–649. [Google Scholar] [CrossRef] [PubMed]
- Ahmadi, L.; Yip, A.; Fowler, M.; Young, S.B.; Fraser, R.A. Environmental Feasibility of Re-Use of Electric Vehicle Batteries. Sustain. Energy Technol. Assess. 2014, 6, 64–74. [Google Scholar] [CrossRef]
- Heymans, C.; Walker, S.B.; Young, S.B.; Fowler, M. Economic Analysis of Second Use Electric Vehicle Batteries for Residential Energy Storage and Load-Levelling. Energy Policy 2014, 71, 22–30. [Google Scholar] [CrossRef]
- López, A.I.; Ramírez-Díaz, A.; Castilla-Rodríguez, I.; Gurriarán, J.; Mendez-Perez, J.A. Wind Farm Energy Surplus Storage Solution with Second-Life Vehicle Batteries in Isolated Grids. Energy Policy 2023, 173, 113373. [Google Scholar] [CrossRef]
- Jasper, F.B.; Späthe, J.; Baumann, M.; Peters, J.F.; Ruhland, J.; Weil, M. Life Cycle Assessment (LCA) of a Battery Home Storage System Based on Primary Data. J. Clean. Prod. 2022, 366, 132899. [Google Scholar] [CrossRef]
- European Parliament & Council of the European Union. Directive 2008/98/EC of the European Parliament and of the Council of 19 November 2008 on Waste and Repealing Certain Directives; European Parliament & Council of the European Union: Brussels, Belgium, 2008. [Google Scholar]
- Windisch-Kern, S.; Gerold, E.; Nigl, T.; Jandric, A.; Altendorfer, M.; Rutrecht, B.; Scherhaufer, S.; Raupenstrauch, H.; Pomberger, R.; Antrekowitsch, H.; et al. Recycling Chains for Lithium-Ion Batteries: A Critical Examination of Current Challenges, Opportunities and Process Dependencies. Waste Manag. 2022, 138, 125–139. [Google Scholar] [CrossRef] [PubMed]
- Mohr, M.; Peters, J.F.; Baumann, M.; Weil, M. Toward a Cell-chemistry Specific Life Cycle Assessment of Lithium-ion Battery Recycling Processes. J. Ind. Ecol. 2020, 24, 1310–1322. [Google Scholar] [CrossRef]
- European Parliament & Council of the European Union. Regulation (EU) 2024/1781 of the European Parliament and of the Council of 13 June 2024 Establishing a Framework for the Setting of Ecodesign Requirements for Sustainable Products, Amending Directive (EU) 2020/1828 and Regulation (EU) 2023/1542 and Repealing Directive 2009/125/EC; European Parliament & Council of the European Union: Brussels, Belgium, 2024. [Google Scholar]
- Severengiz, S.; Finke, S.; Schelte, N.; Wendt, N. Life Cycle Assessment on the Mobility Service E-Scooter Sharing. In Proceedings of the 2020 IEEE European Technology and Engineering Management Summit (E-TEMS), Dortmund, Germany, 5–7 March 2020; pp. 1–6. [Google Scholar]
- Severengiz, S.; Schelte, N.; Bracke, S. Analysis of the Environmental Impact of E-Scooter Sharing Services Considering Product Reliability Characteristics and Durability. Procedia CIRP 2021, 96, 181–188. [Google Scholar] [CrossRef]
- European Comission (EC). Proposal for a Regulation on Circularity Requirements for Vehicle Design and on the Management of End-of-Life Vehicles; European Comission (EC): Brussels, Belgium, 2023.

| Scenario 1: Base Scenario | Scenario 2: Component Reuse | Scenario 3: Battery Repurpose | Scenario 4: Landfill | |
|---|---|---|---|---|
| Production Total | 907.02 kg CO2 eq | |||
| E-moped Production | 800.51 kg CO2 eq | |||
| Replacement Production | 106.51 kg CO2 eq | |||
| EoL Total | −208.33 kg CO2 eq | −227.68 kg CO2 eq | −263.00 kg CO2 eq | 118.14 kg CO2 eq |
| EoL Recycling | −181.56 kg CO2 eq | −165.76 kg CO2 eq | −181.02 kg CO2 eq | – |
| EoL Reuse | −43.81 kg CO2 eq | −78.87 kg CO2 eq | −43.80 kg CO2 eq | – |
| EoL Repurpose | – | – | −55.22 kg CO2 eq | – |
| EoL Incineration | 10.96 kg CO2 eq | 10.96 kg CO2 eq | 10.96 kg CO2 eq | – |
| EoL Landfill | 4.51 kg CO2 eq | 4.51 kg CO2 eq | 4.51 kg CO2 eq | 116.71 kg CO2 eq |
| EoL Transport | 1.57 kg CO2 eq | 1.48 kg CO2 eq | 1.57 kg CO2 eq | 1.43 kg CO2 eq |
| Total | 698.69 kg CO2 eq | 679.32 kg CO2 eq | 644.02 kg CO2 eq | 1025.15 kg CO2 eq |
| Material | Recovered Weight [kg] | Total GWP100 [kg CO2 eq] | Relative GWP100 [kg CO2 eq/1 kg Recovered Material] |
|---|---|---|---|
| RVB | |||
| aluminium | 14.97 | −69.49 | −4.64 |
| stainless steel | 1.74 | −7.63 | −4.37 |
| copper | 0.66 | −1.60 | −2.41 |
| ABS | 5.36 | −7.73 | −1.44 |
| SBR | 18.00 | −24.87 | −1.38 |
| steel | 40.30 | −54.65 | −1.36 |
| PP | 3.51 | −2.59 | −0.74 |
| Battery | |||
| PTFE | 0.08 | −0.65 | −7.68 |
| cobalt sulphate | 0.37 | −1.61 | −4.38 |
| aluminium | 2.68 | −11.18 | −4.17 |
| nickel sulphate | 0.97 | −1.67 | −1.72 |
| PP | 0.39 | −0.28 | −0.74 |
| steel | 1.05 | 0.27 | 0.25 |
| iron | 0.42 | 0.35 | 0.83 |
| copper | 0.44 | 0.64 | 1.44 |
| manganese sulphate | 0.12 | 1.13 | 9.35 |
Disclaimer/Publisher’s Note: The statements, opinions and data contained in all publications are solely those of the individual author(s) and contributor(s) and not of MDPI and/or the editor(s). MDPI and/or the editor(s) disclaim responsibility for any injury to people or property resulting from any ideas, methods, instructions or products referred to in the content. |
© 2025 by the authors. Licensee MDPI, Basel, Switzerland. This article is an open access article distributed under the terms and conditions of the Creative Commons Attribution (CC BY) license (https://creativecommons.org/licenses/by/4.0/).
Share and Cite
Eduardo, S.; Recklies, E.A.; Nikolic, M.; Severengiz, S. A Comparative Life Cycle Assessment of End-of-Life Scenarios for Light Electric Vehicles: A Case Study of an Electric Moped. Sustainability 2025, 17, 6681. https://doi.org/10.3390/su17156681
Eduardo S, Recklies EA, Nikolic M, Severengiz S. A Comparative Life Cycle Assessment of End-of-Life Scenarios for Light Electric Vehicles: A Case Study of an Electric Moped. Sustainability. 2025; 17(15):6681. https://doi.org/10.3390/su17156681
Chicago/Turabian StyleEduardo, Santiago, Erik Alexander Recklies, Malina Nikolic, and Semih Severengiz. 2025. "A Comparative Life Cycle Assessment of End-of-Life Scenarios for Light Electric Vehicles: A Case Study of an Electric Moped" Sustainability 17, no. 15: 6681. https://doi.org/10.3390/su17156681
APA StyleEduardo, S., Recklies, E. A., Nikolic, M., & Severengiz, S. (2025). A Comparative Life Cycle Assessment of End-of-Life Scenarios for Light Electric Vehicles: A Case Study of an Electric Moped. Sustainability, 17(15), 6681. https://doi.org/10.3390/su17156681