1. Introduction
As global climate change escalates and energy shortages intensify, governments worldwide are accelerating the transition to clean energy [
1,
2]. Simultaneously, automobile manufacturers are increasingly competing in the burgeoning new energy vehicle (NEV) market [
3]. Electric vehicles (EVs), as a sustainable alternative to conventional fuel vehicles, have gained significant traction as a solution to mitigate climate change [
4,
5,
6]. According to the International Energy Agency [
7], the global EV market has experienced exponential growth over the past decade. In 2011, 40,000 EVs were sold worldwide; by 2017, this figure had exceeded 1.78 million units, with total EV ownership reaching 3.1 million. By 2023, global EV sales had surged to over 13.8 million units—more than six times the sales volume in 2017—with an impressive average annual growth rate of 62.74% from 2011 to 2023. As the market matures, global EV sales are projected to reach 40.7 million units by 2030, solidifying EVs as a mainstream mode of transportation.
The widespread adoption of EVs relies not only on advancements in vehicle manufacturing technology but also on the stability of supply chains for critical components. Among these, lithium-ion batteries—key determinants of EVs’ range, charging time, and overall performance—are experiencing surging demands due to the rapid expansion of the EV sector.
The existing literature on the EV and EV lithium-ion battery industries has grown substantially, reflecting their increasing significance in the context of sustainable development and the energy transition. A substantial body of research highlights the pivotal role of government policies in shaping EV supply chains and trade relations. For example, the EU’s Green Deal and European Battery Alliance initiatives have been instrumental in fostering regulatory frameworks for EV lithium-ion battery production and utilization. These efforts aim to enhance the EU’s competitiveness in the global battery market while promoting sustainability and reducing the dependency on fossil fuels. Mishrif underscores how sustainable lithium extraction practices, as seen in Finland, contribute to minimizing environmental harm and advancing the EU’s green energy objectives [
8]. Similarly, Graham et al. emphasize the dual focus on sustainability and energy security in lithium supply chains, underscoring the critical role of lithium-ion batteries in renewable energy storage and electrified transport systems [
9].
In addition to policy-driven dynamics, the contributions of key industry players in EV lithium-ion battery production and trade have garnered scholarly attention. Song et al. analyze the evolving flow of lithium resources, particularly in China, a dominant actor in the global lithium market [
10]. Scholars like Bhuyan et al. [
11] and Vivoda et al. [
12] highlight the intricate relationships between production, manufacturing, and consumption, stressing the need for collaboration among stakeholders along the supply chain. For instance, strategic alliances forged by companies like Volkswagen, which sources lithium sustainably through agreements with suppliers in Chile and Australia, exemplify the importance of cooperation in ensuring a reliable and environmentally responsible lithium supply [
13]. Such collaborations not only enhance supply chain sustainability but also bolster the overall stability of the EV market [
14,
15,
16].
Emerging research also employs network-based approaches to examine trade dynamics within the EV lithium-ion battery sector. Shao et al. provide insights into the structural characteristics of trade networks, identifying factors such as economic scale, geographic proximity, and industrial policies as key determinants of trade flows [
17]. Analogously, Pu et al. examine the cross-border electricity trade, offering perspectives applicable to this industry’s network structures [
18]. Their findings underscore the importance of strategic planning and policy harmonization among EU member states to develop a cohesive and competitive EV lithium-ion battery supply chain.
The EU plays a critical role in the global EV market, as well as in the production and trade of EV lithium-ion batteries. As the epicenter of the battery trade gradually shifts from Asia to Europe [
19], a notable gap remains in research addressing the structure and dynamics of the EU’s EV lithium-ion battery trade network. While existing studies examine material flows and sustainability dimensions, comprehensive analyses that trace the evolution of this network over time within the EU are still lacking. This gap is especially important in light of rapid technological advancements and the evolving geopolitical landscape, which continue to reshape trade relations.
Using social network analysis and the multiple regression quadratic assignment procedure method, this study aims to reveal the structural evolution and factors of the EU member states’ EV lithium-ion battery trade network. The primary research questions include the following: What is the overall structure of the EV lithium-ion battery trade network in the region? How has this network evolved from 2012 to 2023? What factors have driven its evolution?
Drawing on the previous literature and methodological considerations, this study proposes the following hypotheses.
H1: The EV lithium-ion battery trade network among EU member states has evolved from a centralized, low-density structure to a more decentralized and denser configuration between 2012 and 2023.
H2: Central and Eastern European countries are becoming increasingly central actors in the evolving EV lithium-ion battery trade network.
H3: The intensity of bilateral trade in EV lithium-ion batteries between EU member states is positively influenced by economic similarity, geographic proximity, logistics performance, energy availability, and investment-related indicators.
The remainder of this paper is organized as follows.
Section 2 outlines the methodology, detailing the analytical framework and data sources.
Section 3 examines the structural evolution of the EU’s EV lithium-ion battery trade network from 2012 to 2023.
Section 4 analyzes the factors influencing the network’s development.
Section 5 discusses the findings in light of the existing literature, highlighting both theoretical and practical implications. Finally,
Section 6 presents the main conclusions and offers recommendations for future research.
3. Structural Evolution of EV Lithium-Ion Battery Trade Network
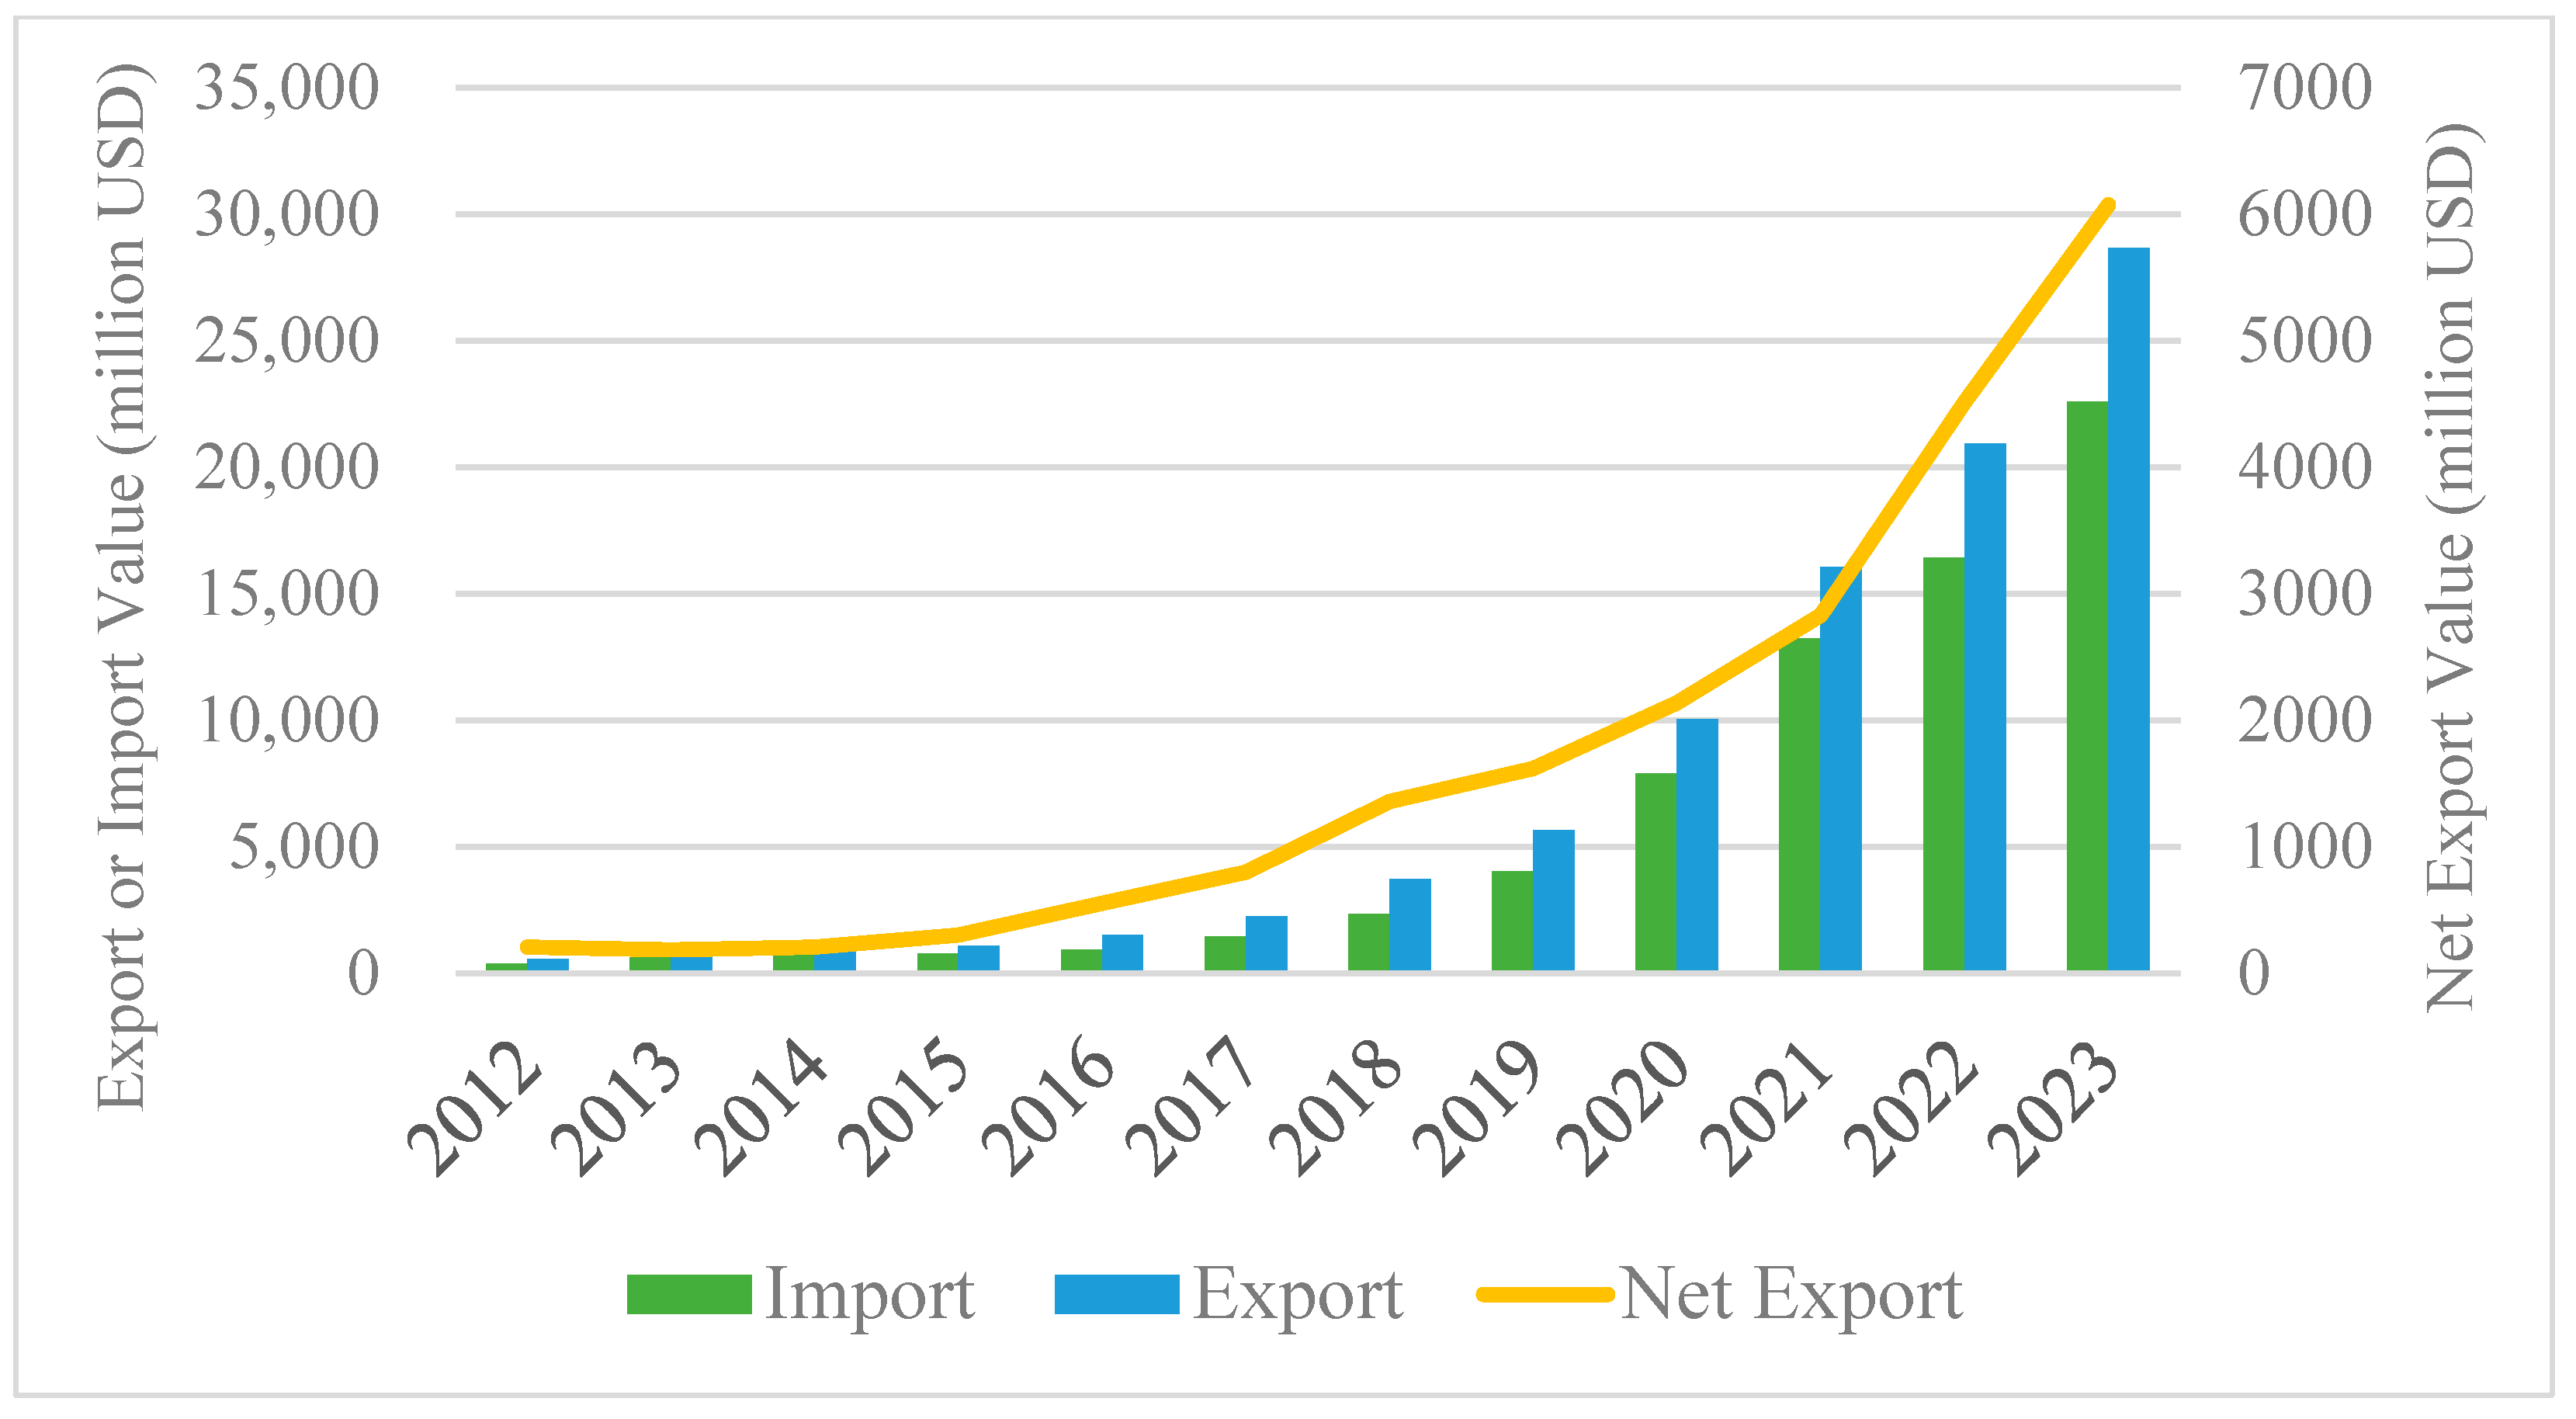
Over the past 12 years, EU member states have experienced rapid growth in the trade of EV lithium-ion batteries (
Figure 1). Between 2012 and 2023, regional imports surged from USD 379.69 million to USD 22,580.92 million, while exports increased from USD 589.06 million to USD 28,654.37 million. The compound annual growth rate (CAGR) during this period was 44.98% for imports and 42.35% for exports. Despite the rapid growth in imports, the relatively higher growth in exports indicates strengthening capabilities in EV lithium-ion battery production and technology among EU member states, consolidating their positions in the global supply chain. This trend is further evidenced by changes in net export values, which grew from USD 209.37 million in 2012 to USD 6073.45 million in 2023 at a CAGR of 35.82%. The transition from an import-dominated to an export-driven trade model underscores the EU’s increasing competitiveness. Notably, between 2020 and 2023, the net export CAGR rose to 41.64%, reflecting the dual impact of policies like the EU Green Deal and the rising global demand for EVs.
The overall trade trend demonstrates the rapid development of the EV lithium-ion battery trade within the EU. However, a deeper understanding of member states’ specific roles and the trade network’s evolution requires further quantitative analysis using social network analysis (SNA).
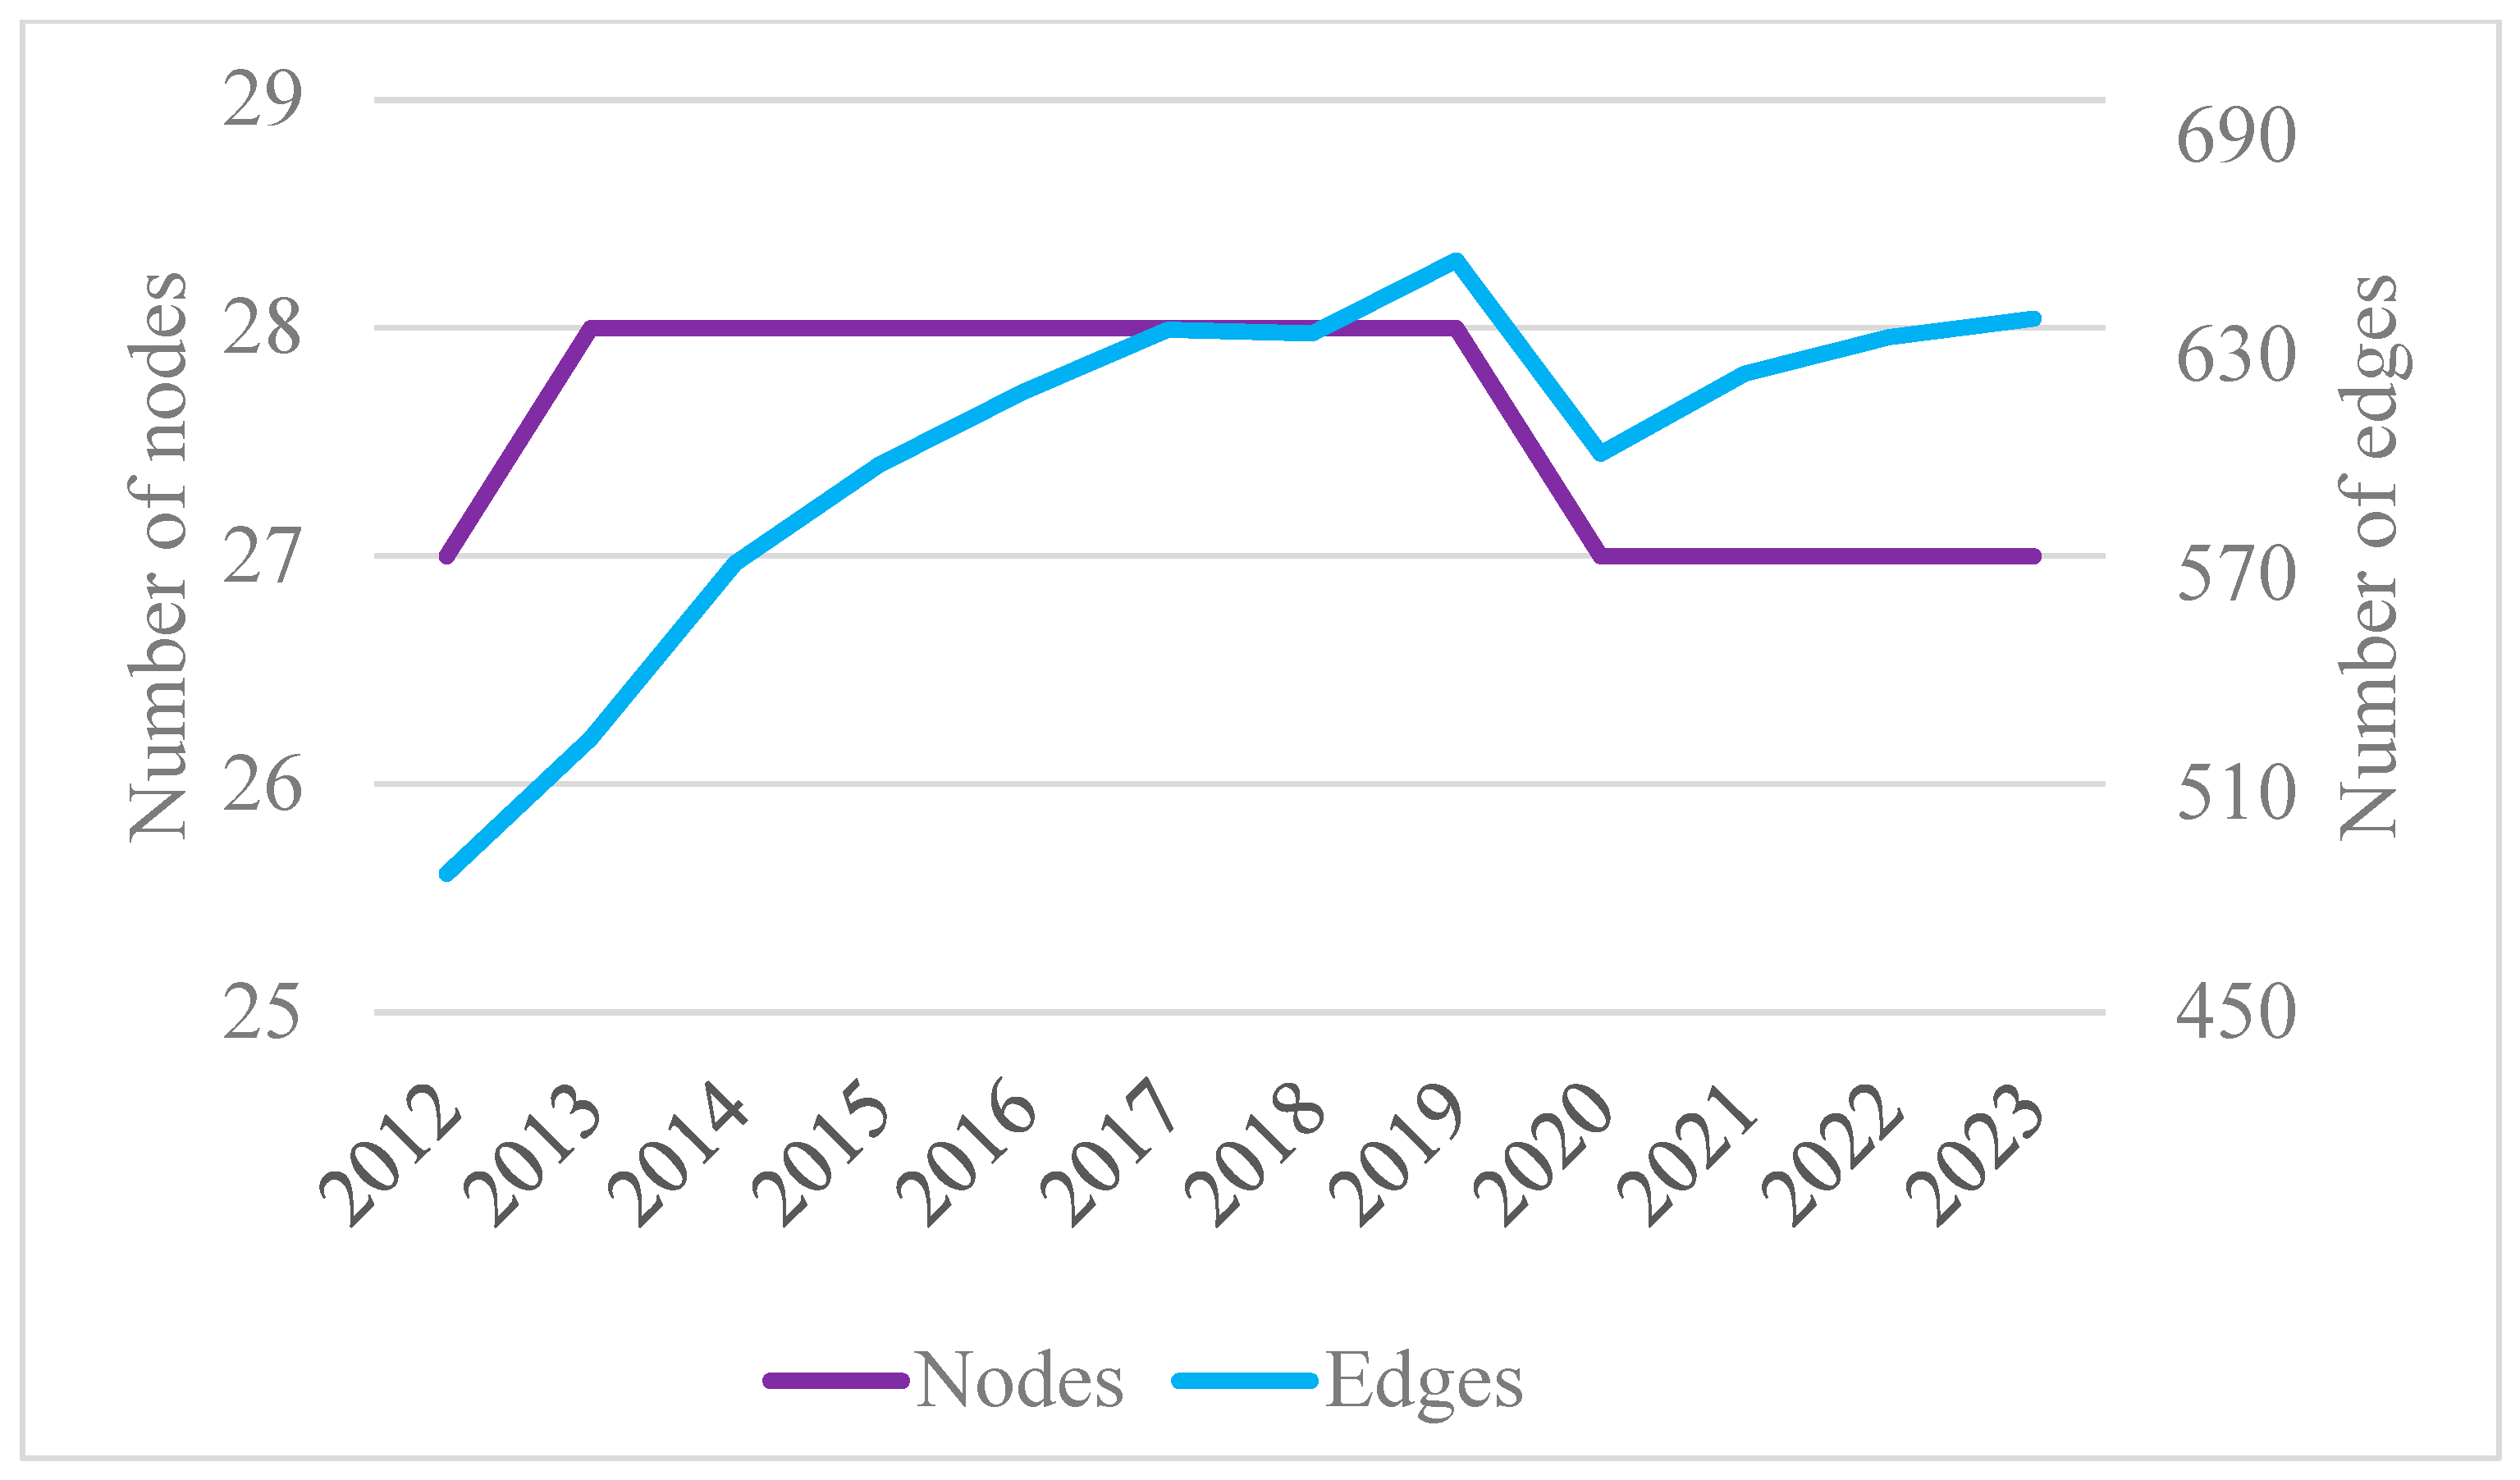
Figure 2 illustrates the dynamics of the number of nodes (representing EU member states) and edges (representing trade links) in the EU’s EV lithium-ion battery export network from 2012 to 2023. This provides an essential context for the analysis of the network’s structural evolution and complexity. As shown in
Figure 2, the number of nodes remained relatively stable, fluctuating between 27 and 28 during the study period, indicating consistent participation by most EU member states in the EV lithium-ion battery trade. In contrast, the number of edges exhibited significant variation, reflecting the dynamic evolution of trade relationships. Starting at 488 in 2012, the number of edges peaked at 656 in 2019, highlighting the strengthening of trade ties and the increased complexity of the trade network. However, the number of edges fell sharply to 603 in 2020, likely due to disruptions caused by the COVID-19 pandemic. By 2023, the number of edges had recovered to 640, nearing the pre-pandemic peak and signaling the network’s resilience and continued expansion in response to the growing EV demand.
The number of edges started from 488 in 2012 and showed an increasing trend year by year, reaching a peak of 656 in 2019. This increase reflects the continuous strengthening of trade relations between EU member states, with the EV lithium-ion battery trade network reaching a high level of complexity and density at this stage. Between 2017 and 2019, although the number of nodes remained unchanged at 28, the number of edges continued to grow notably. This pattern indicates the deepening of trade ties among existing member states, rather than the addition of new participants. It reflects a phase of internal network densification, where established countries increased their bilateral trade connections. Such intensification may suggest the maturation of the intra-EU lithium-ion EV battery supply chain, driven by enhanced policy coordination, rising demands, and supply chain localization efforts. However, the number of edges fell sharply to 603 in 2020, which was likely affected by the disruption to international supply chains and trade activities caused by the COVID-19 pandemic. The number of edges gradually recovered from 2021 onwards, and, by 2023, it had grown to 640, close to an all-time high, suggesting that the EV lithium-ion battery trade network recovered rapidly after the pandemic and continued to expand in line with the growing demand for EVs in the market.
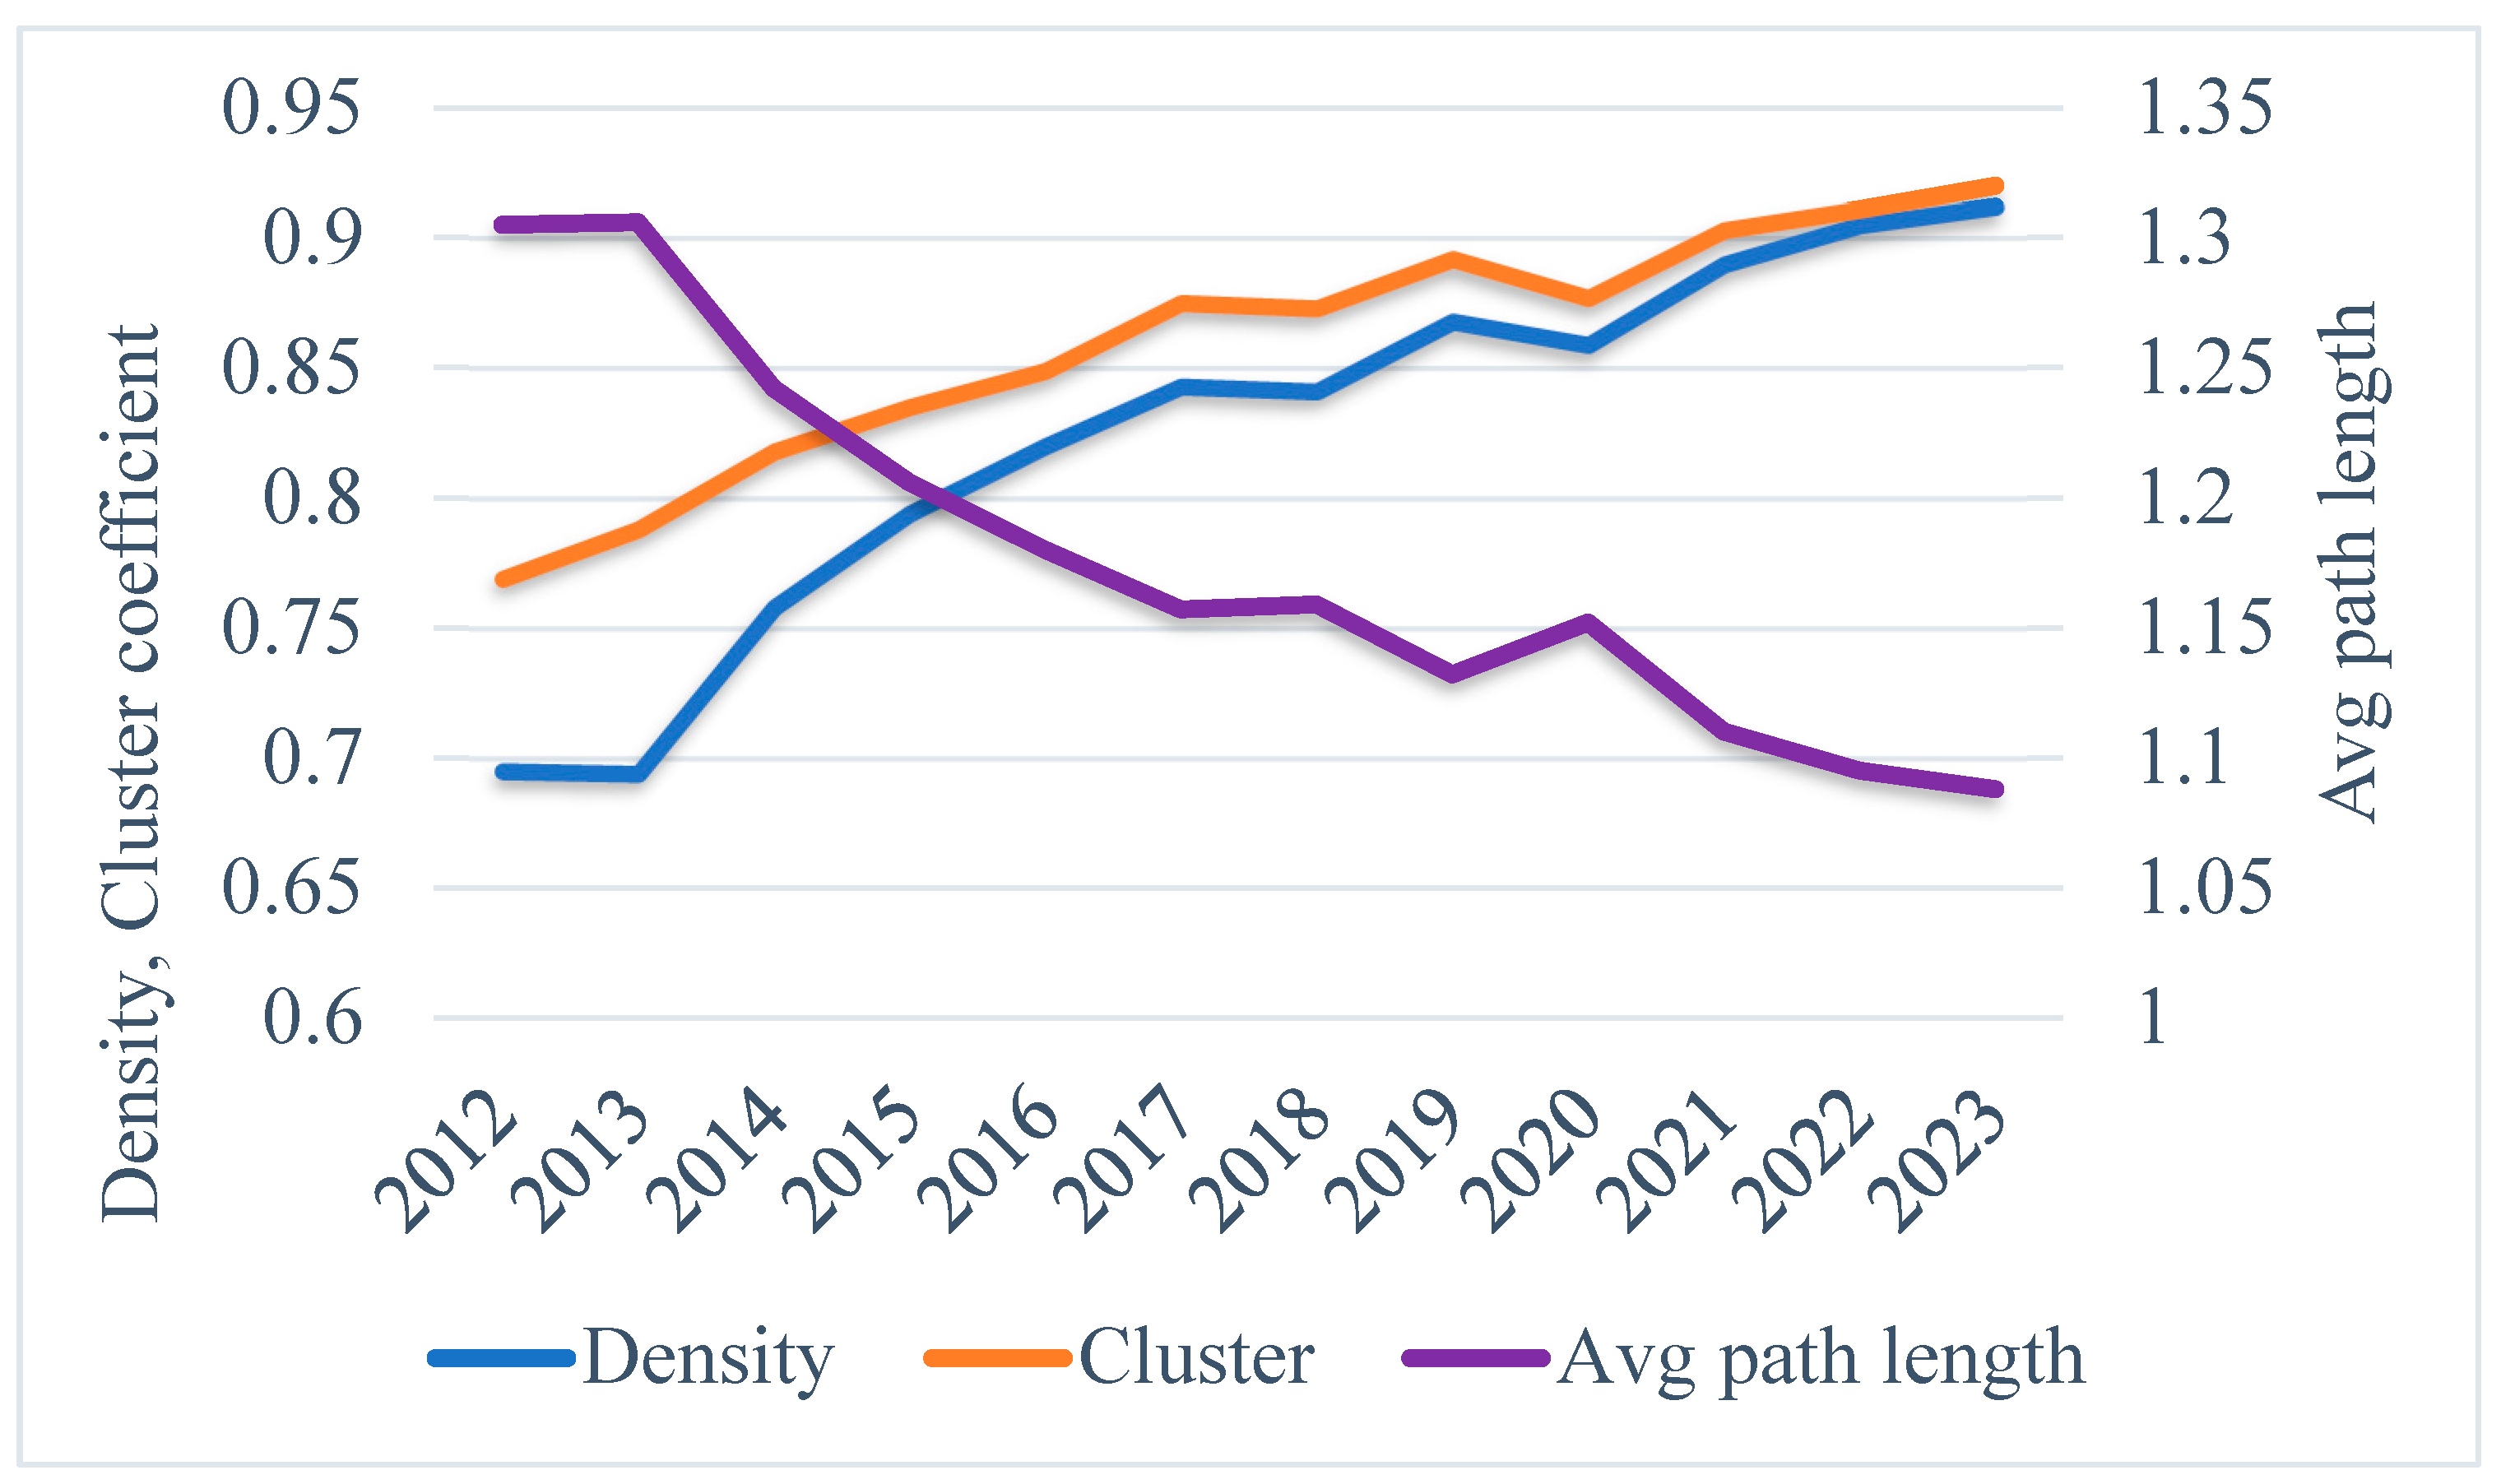
In addition to nodes and edges, other structural indicators—namely the density, clustering coefficient, and average path length—provide quantitative insights into the evolution of the EU’s EV lithium-ion battery trade network.
Figure 3 illustrates these dynamic changes, reflecting the network’s connectivity, integration, and efficiency.
From
Figure 3, it can be concluded that the network’s density, representing the proportion of actual trade relationships to all possible ones, has increased steadily, from 0.695 in 2012 to 0.912 in 2023. This growth underscores the strengthening of trade links and the tightening of the overall network. Notably, the density rose sharply, from 0.758 in 2014 to 0.868 in 2019, marking the transition from an early stage to a mature trade network. Although the density declined slightly to 0.859 in 2020 due to the pandemic, it recovered rapidly, reaching a new high in 2023, reflecting the network’s resilience and critical role in the regional supply chain.
The clustering coefficient, which measures the extent of triangular trade relationships, grew from 0.769 in 2012 to 0.92 in 2023, signifying increasing regional cooperation. Between 2016 and 2023, the clustering coefficient rose from 0.849 to 0.92, driven by enhanced collaboration among core countries such as Germany, Poland, and Hungary. This trend highlights the emergence of tightly clustered trade relationships.
The average path length, which quantifies the shortest trade paths between member countries, decreased from 1.305 in 2012 to 1.088 in 2023. This reduction indicates improved network efficiency, with faster and more direct trade flows facilitating stronger supply chain integration. Particularly between 2021 and 2023, the average path length declined from 1.11 to 1.088, reflecting heightened connectivity and collaboration as the density and clustering coefficients reached record levels.
The significant rise in the density and clustering coefficients during 2014 and 2015 reflects a critical phase of network consolidation. This period marked the onset of closer trade integration, likely driven by early-stage policy alignment under EU low-carbon strategies and the rising regional demand for EVs. At the same time, the average path length dropped notably, indicating improved trade efficiency and faster inter-country connectivity, as bilateral trade routes became more direct and redundant links were reduced.
Taken together, these structural indicators reveal the EV lithium-ion battery trade network’s transformation from a low-density, low-coordination state to a high-density, high-clustering, and high-efficiency structure within the EU. Significant phases of growth occurred during 2014–2019 and 2021–2023, driven by deepening supply chain collaboration and the rapid expansion of the EV industry. This evolution indicates the shift from a centralized, Germany-dominated structure to a more decentralized and polycentric network, highlighting the rising roles of Poland and Hungary and the eastward shift of the regional supply chain’s center of gravity from Western Europe to Central and Eastern Europe (CEE).
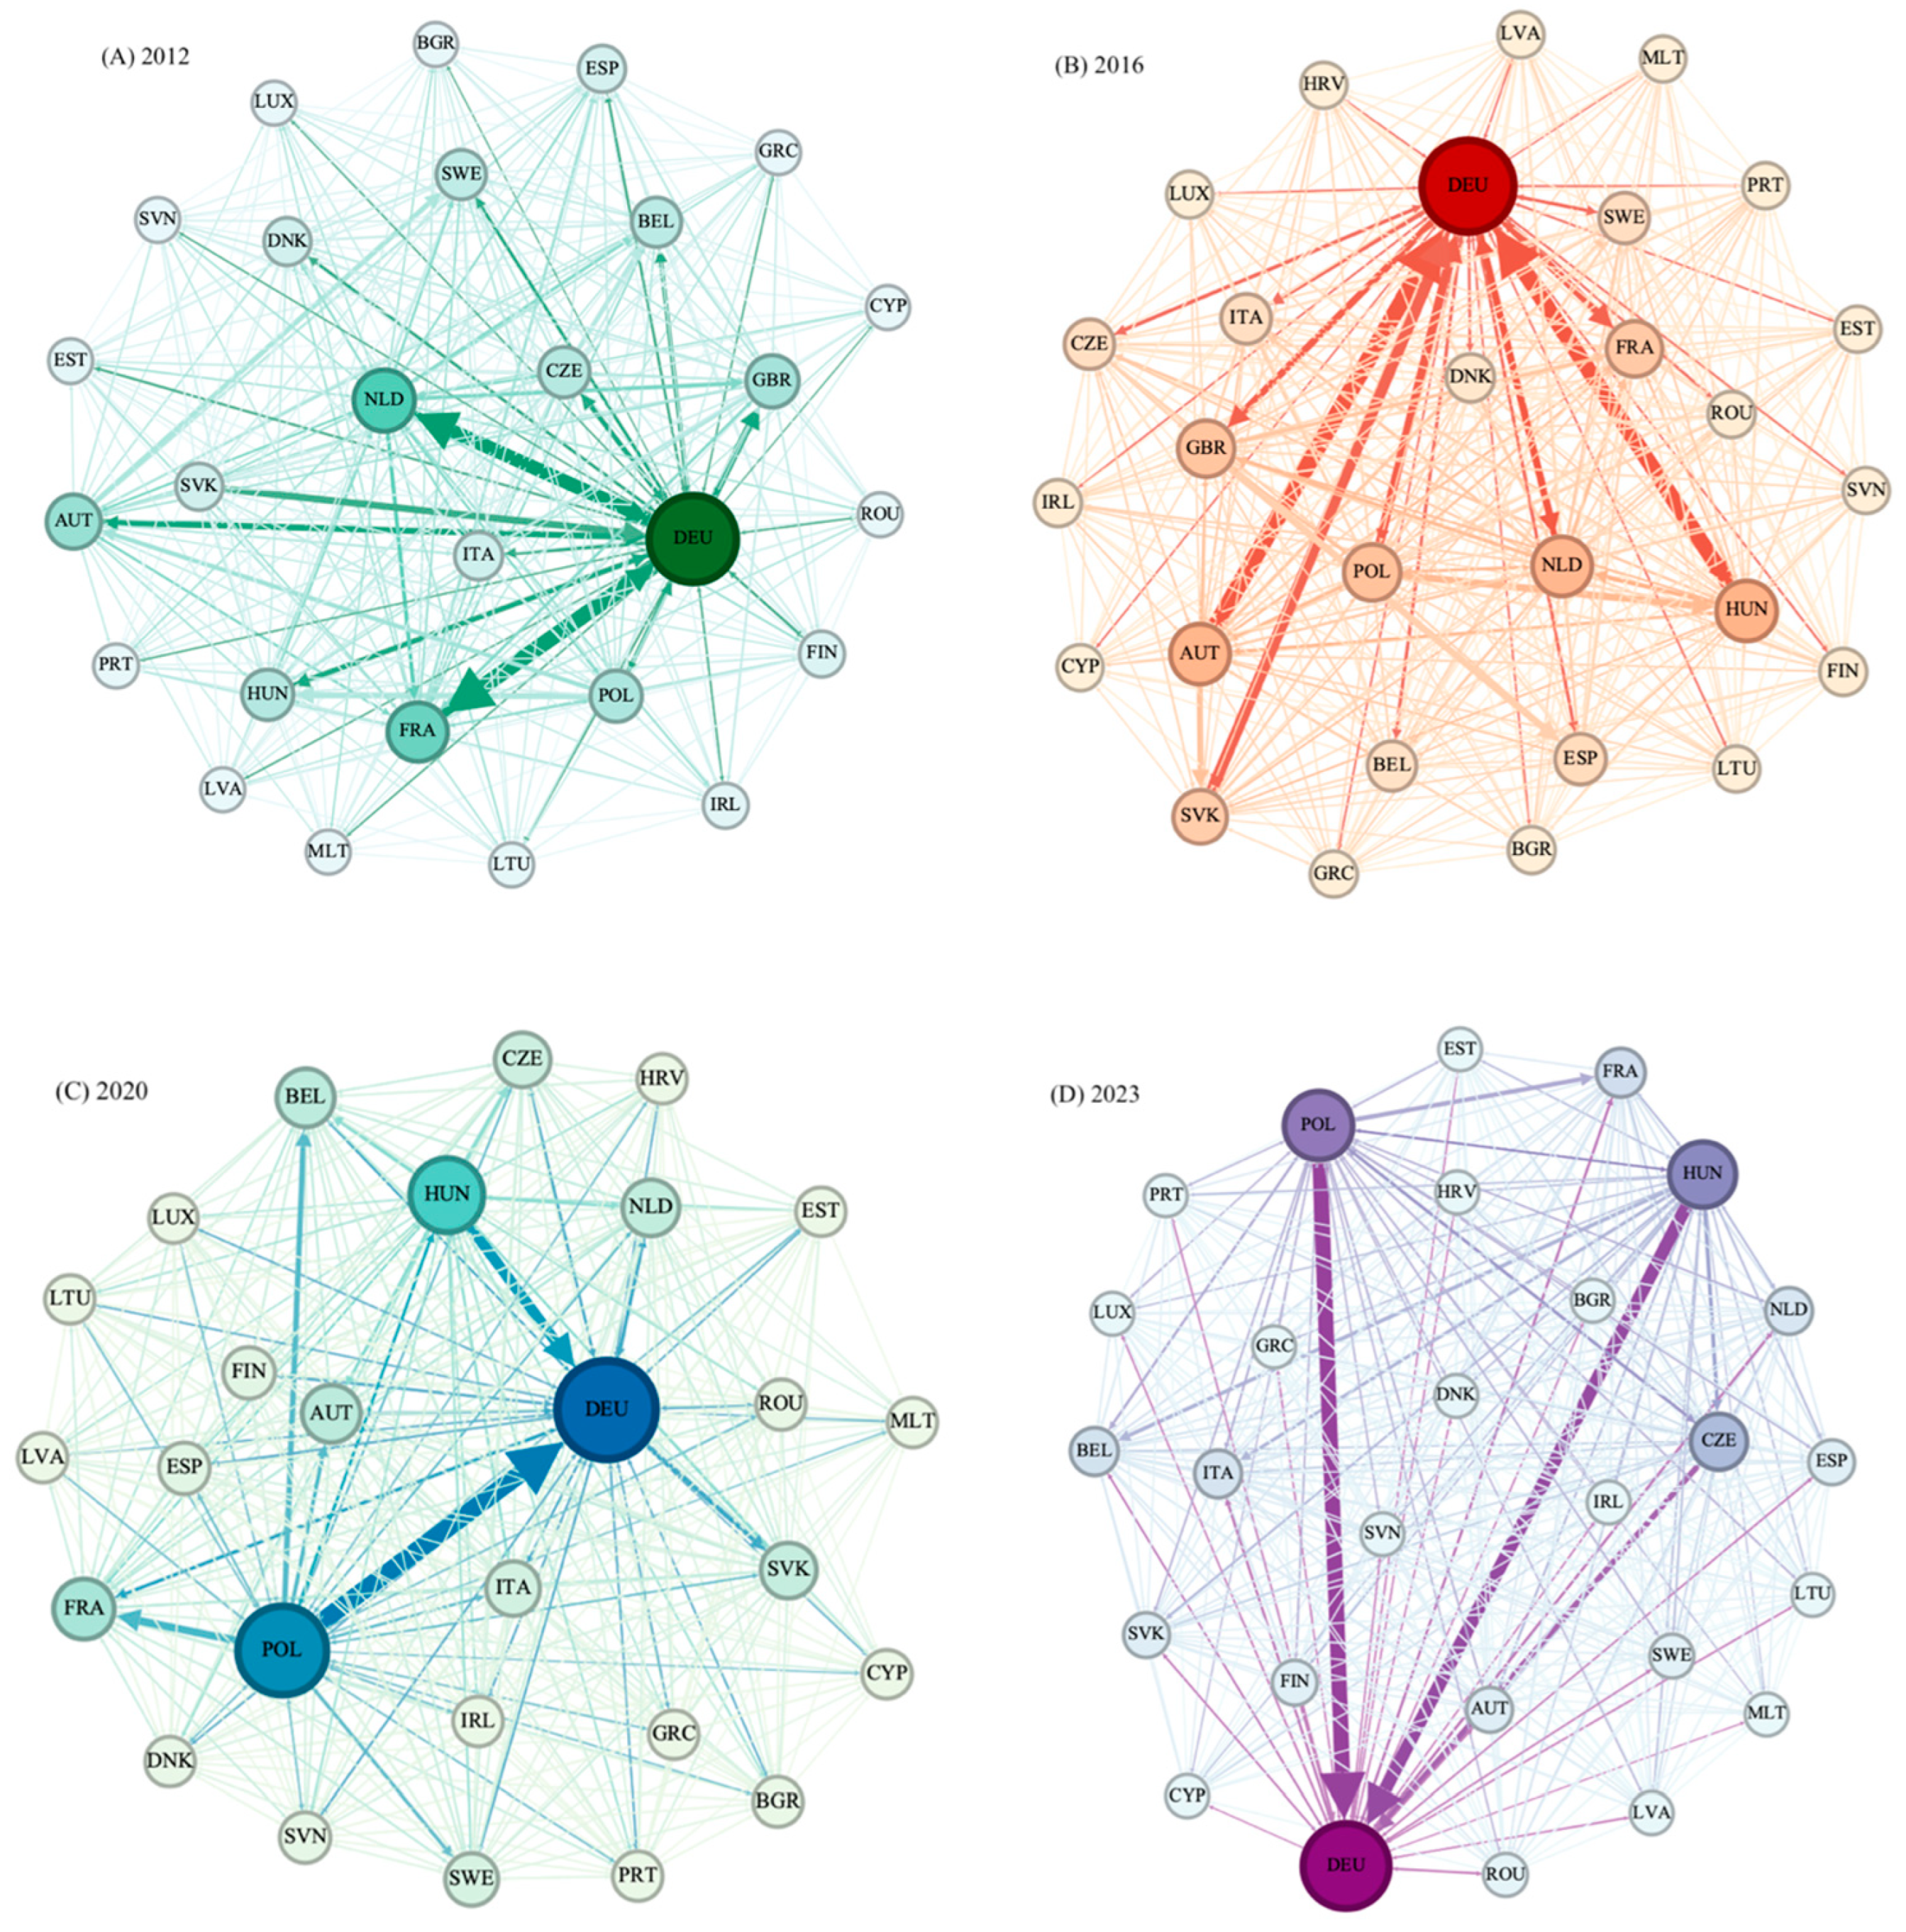
However, changes in the number of nodes and edges alone are not sufficient to reveal the specific roles and positions of the member states in the network, so further detailed analysis of the centrality and trade links of the member states in the network, in conjunction with specific network topology maps (
Figure 4), is needed to reveal the evolutionary characteristics of the core countries, key edges, and trade flows.
Figure 4 was generated using Gephi 0.10.0, which is an open-source software platform specialized in network analysis and visualization. Gephi allows for the intuitive presentation of network topologies, including node centrality and edge weights, thereby supporting the structural interpretation of trade relationships.
In 2012, the trade network of EV lithium-ion batteries between EU member states showed initial development, with Germany (DEU) as the single core node. Germany was the prominent center of the network, with its larger exports to member states such as France (FRA) and the Netherlands (NLD) showing its dominant position in this emerging sector. Other member countries, such as Italy (ITA), Austria (AUT), and Belgium (BEL), had some export links with Germany, but the weight of this side was relatively low. This suggests that the overall network density was low at this time, trade connections were relatively sparse, and the trade dependence between member countries had not yet formed a tight structure. Germany’s central position in the supply chain reflects its significant advantages in the production and export of lithium-ion battery for EVs, while other countries played a more minor role, and the regional division of labor in the supply chain was not yet complete. This network structure reflects the fact that the EV industry and its associated lithium-ion battery supply chain were still in the early stages of development, with weak trade dependence between countries.
By 2016, the EV lithium-ion battery export trade network showed a more complex structure, with a significantly higher network density and connectivity (also shown in
Figure 3). While Germany remained the core, with its centrality and trade dominance in the network remaining unchanged, Poland (POL) and Hungary (HUN) began to show importance. The value of the trade margin between Poland and Germany increased significantly, reflecting the rise of Poland as an Eastern European country in the EV lithium-ion battery supply chain. Hungary also became more active in the network, with its export connections to Germany and Poland gradually increasing. In contrast, the centrality of Western European countries such as France (FRA) and the Netherlands (NLD) declined slightly, suggesting that the regional center of gravity of the related battery supply chain was expanding towards Eastern Europe. During this period, the overall structure of the network began to show a shift from monocentric to polycentric, with the further deepening of trade collaboration between member states.
Furthermore, four years later, in 2020, the EV lithium-ion battery trade network exhibited a more mature polycentric structure. Germany remained at the core of the network, but Poland and Hungary became significantly more central, being important emerging nodes in the network. Trade connections between Poland and Germany reached the highest intensity in the network, demonstrating Poland’s rapid rise in the export of lithium-ion batteries for EVs and its key role in the supply chain. Hungary further strengthened its position in the network through its strong connections with Germany and Poland. In contrast, Western European countries such as France (FRA) and the Netherlands (NLD) became relatively less central, indicating a spatial shift in the related battery trade network towards Eastern Europe. The density and connectivity of the network were further enhanced during this period, with increasingly strong trade links between member states, signaling the continued advancement of supply chain integration within the EU.
By 2023, the EU trade network of EV lithium-ion batteries had developed into a highly complex and sophisticated polycentric structure. Poland and Germany became the dual core nodes of the network, and the trade margin between the two countries reached the highest level in the network, indicating that Poland has emerged as a co-leader in the EV lithium-ion battery export trade within the EU, alongside Germany. In addition, Hungary, as an important node in Eastern Europe, has significantly increased the strength of its trade links with Germany and Poland, reflecting its increasingly important role in the regional supply chain. The overall density of the network peaked during this period, with the trade links between member countries covering almost the entire network, indicating that regional collaboration in the EV lithium-ion battery supply chain has tended to be highly integrated. At the same time, the relative position of traditional Western European exporters such as France and the Netherlands continues to weaken, indicating a further shift in the center of gravity of the related battery export network from Western Europe to CEE.
In terms of the evolution of the overall trade structure, between 2012 and 2023, the EV lithium-ion battery trade network among EU member states underwent remarkable evolution, from a low-density, single-core structure to a high-density, multi-center structure. While Germany dominated the entire network as a single core in 2012, Poland and Hungary gradually rose to prominence in 2016 and 2020, and, by 2023, the three countries together formed a polycentric trade network structure. The rise of Poland and Hungary not only reflects the rapid growth of CEE countries in the EV lithium-ion battery supply chain but also highlights the shift in the center of gravity of the regional supply chain from Western Europe to CEE. In addition, the significant increase in the network density and connectivity suggests a deepening degree of trade collaboration and supply chain integration among EU member states.
4. Factors in EV Lithium-Ion Battery Trade Network Evolution
In analyzing the factors influencing the EV lithium-ion battery trade network among EU member states, it is essential to account for the inherently relational nature of trade network data, which describe interconnections between economies. Such data often exhibit non-independence, violating the assumptions of covariance avoidance required by traditional statistical techniques. The direct application of conventional regression methods, such as ordinary least squares (OLS), can result in inflated variances and standard deviations in parameter estimates, undermining the significance of hypothesis testing and diminishing the model’s predictive and explanatory power. To address these challenges, the quadratic assignment procedure (QAP) method is employed. This method, based on permutation tests, effectively handles the issue of multicollinearity in relational data, ensuring robust parameter estimation and providing a reliable analytical framework for the study of the EV lithium-ion battery trade network.
Table 1 presents the QAP correlation analysis results for the European EV lithium-ion battery trade network between 2012 and 2023. The analysis reveals significant dynamic changes in the network structure over the study period, reflecting both stability and evolution.
Over the long term, the European EV lithium-ion battery trade network underwent profound structural changes between 2012 and 2023. For instance, the QAP correlation between the 2023 and 2012 networks was only 0.095, highlighting the major restructuring of the trade network over the decade. This transformation reflects substantial shifts in the network’s structure and layout, driven by the implementation of new energy policies and deepening inter-regional economic collaboration. Changes in central nodes and the strength of their connections further illustrate this evolution.
Despite these long-term shifts, the network demonstrates a notable degree of year-to-year stability. The QAP correlation between any given year and the following year consistently hovers around 0.95. For example, the correlation value between 2020 and 2021 is 0.970, while the correlation values for 2022 and 2023 are 0.934 and 0.924, respectively. This indicates that the core structure of the trade network maintains a degree of continuity despite ongoing adjustments, likely reflecting the persistence of regional policies and the inertia of established trade relationships.
The analysis also highlights 2020 as a critical watershed year, marking clear divergence in the network structure before and after this period. For instance, the QAP correlation value between the 2020 and 2012 networks is only 0.256, while its correlation with the 2015 network yields a value of 0.562. These findings suggest a major reconfiguration of the trade network during this time, likely attributable to the far-reaching impacts of the COVID-19 pandemic on global supply chains and trade activities [
27,
28]. Additionally, these changes may reflect European efforts to accelerate regional collaboration in EV lithium-ion battery trade and production [
29].
To further explore the factors influencing the EV lithium-ion battery trade, the classical gravity model serves as a theoretical foundation. This model posits that the trade volume between two countries is positively correlated with the size of their economies, typically measured by the GDP, and negatively correlated with geographic distance [
30]. Shared official languages, which reduce communication costs and information barriers, also significantly facilitate bilateral trade [
31]. These principles provide a conceptual framework for an understanding of the drivers of the evolving trade network in lithium batteries.
Moreover, the logistics performance index (LPI) reflects a country’s level of industrialization and its ability to reduce transportation costs. Recent studies have found that improvements in logistics performance are often associated with enhanced export capacities, thereby promoting trade [
32]. Labor costs directly influence the price competitiveness of products. Empirical evidence indicates that unit labor costs significantly impact export prices and values, with rising labor costs potentially undermining export competitiveness [
33].
The share of employment in the automotive industry within the total manufacturing employment reflects the size and importance of a country’s automotive sector. This measure is positively correlated with the production and export capacity of related products, as higher employment in the automotive industry often supports increased export performance [
34]. Moreover, having a complete battery value chain improves the production efficiency and product competitiveness, thereby boosting EV lithium-ion battery exports. Studies emphasize that an integrated industrial chain enhances product quality while reducing costs, strengthening competitiveness in the international market [
35].
The electricity supply serves as the foundation of industrial production, with an adequate supply positively influencing the production and export of industrial goods, including EV lithium-ion batteries [
36]. Inward foreign direct investment (FDI) brings capital, technology, export, and managerial expertise to host countries, promoting industrial upgrading and enhancing support for emerging industries. Recent findings highlight its positive effects on innovation, entrepreneurship, and economic development, indirectly promoting trade in related products [
37].
The variable definitions and data sources used in this paper are detailed in
Table 2, and the descriptive statistics are shown in
Table 3.
The total sample size of the EV lithium-ion battery trade network among EU member states in 2023 is 702 (27 × 27 − 27), reflecting a robust dataset. Using 2999 random permutations, the results presented in
Table 4 and
Table 5 demonstrate an adjusted R-squared coefficient of 0.30727. This indicates that the independent variable matrix explains 30.73% of the variation in the network structure. The probability value in
Table 4 represents the likelihood that the coefficient of determination derived from random permutations equals or exceeds the observed value, functioning as a one-tailed test. The probability value of 0.00033 suggests that the adjusted R-squared coefficient is statistically significant at the 1% level.
Table 5 presents the regression coefficients and test indicators for the independent variable matrix derived from the QAP regression analysis. The results reveal several key factors influencing the EV lithium-ion battery trade volumes among EU member states.
The logarithm of geographic distance has a significant negative impact on the trade volume, indicating that greater distances are associated with reduced trade flows. This finding aligns with the classical gravity model’s expectations. Similarly, the logarithm of GDP per capita differences is significantly negatively correlated with the trade volume, suggesting that closer levels of economic development strengthen trade relationships. Together, these results underscore the critical role of spatial and economic proximity in fostering bilateral trade.
The logistics performance index (LPI) significantly promotes EV lithium-ion battery trade, highlighting the importance of efficient logistics and transportation infrastructure in facilitating the formation and consolidation of regional trade networks. Differences in labor costs also exhibit a significant positive effect on the trade volume, reflecting a tendency for high-cost countries to import from low-cost countries. Furthermore, the presence of a complete battery value chain has a significant positive impact, emphasizing the importance of supply chain integration in inter-industry trade. The logarithms of the total electricity supply and venture capital investment differences are also positively correlated with the trade volume, demonstrating the pivotal role of energy resources and venture capital flows in supporting the EV lithium-ion battery trade among EU member states.
However, several control variables in the model, including the differences in automotive manufacturing employment shares (AutoEmpShare), foreign direct investment (FDI), and a shared official language, do not exhibit statistically significant effects on EV lithium-ion battery trade flows. We report these findings for completeness and transparency. However, given their statistical insignificance, we refrain from drawing strong interpretive conclusions. Their limited role may reflect indirect effects, sectoral specificity, or time lags that are not fully captured within the present cross-sectional analysis. These aspects could be further examined in future research.
5. Discussion
By analyzing the structure and evolution of the EV lithium-ion battery trade network among EU member states, this study reveals a significant transition from a centralized and loosely connected system to a more decentralized and highly interconnected network. The findings highlight the rise of CEE countries, such as Poland and Hungary, as pivotal players in the supply chain. These results extend the existing academic literature and provide an empirical basis for an understanding of EV lithium-ion battery supply chains and regional economic integration.
Firstly, the findings align with the framework proposed by Schot and Steinmueller on green technology transitions [
38]. They emphasize the critical role of regional policies in facilitating the diffusion of green technologies and industrial integration. This study quantifies these effects through the notable increases in the network density and clustering coefficients—from 0.695 and 0.769 in 2012 to 0.912 and 0.92 in 2023—demonstrating the impact of policy measures such as the EU Green Deal. The enhanced regional synergy underscores the success of these policies, suggesting that the EU should further support CEE countries through initiatives such as regional technical cooperation, the optimization of logistics infrastructure, and innovation funding for small and medium-sized enterprises (SMEs) to strengthen their integration into regional supply chains.
Secondly, this study contributes to understanding the resilience mechanisms of EV supply chains, complementing the work of Belhadi et al., who highlight the advantages of polycentric supply chain structures in enhancing regional economic resilience and risk tolerance [
39]. The rapid recovery of the EV lithium-ion battery trade network, despite a brief decline in density and connections during the COVID-19 pandemic, exemplifies the resilience of this structure. This underscores the importance of fostering network diversity and avoiding over-reliance on single nodes. Policymakers are advised to continue promoting trade network diversification and coordinating policies to mitigate potential risks of supply chain disruptions.
The trend toward supply chain polycentricity revealed in this study aligns with Ferloni et al. [
40], who discuss the spatial co-evolution of EV supply chains. Regionalized and polycentric structures improve efficiency and resilience through knowledge sharing and policy support. The rising centrality of Germany, Poland, and Hungary demonstrates how CEE countries are strengthening their roles in the supply chain by enhancing their connectivity and export capacities. To further consolidate this trend, the EU should prioritize supporting CEE countries in developing manufacturing and export infrastructure, fostering localized production, facilitating international technology transfers, and improving inter-regional logistics coordination.
On the other hand, the study’s findings on regional differentiation resonate with Hu et al. [
41], who emphasize the interplay between green technology innovation and global value chain positioning. This study validates the increasing importance of Poland and Hungary in the EV lithium-ion battery trade network, showing how these countries have leveraged foreign investment, improved their local production capacities, and enhanced their export competitiveness. To maintain this momentum, the EU should optimize the industrial layout in CEE countries through regional tax incentives, export subsidies, and technological upgrading initiatives, thereby consolidating their core roles in the supply chain.
The findings from the MRQAP regression analysis provide further insights into the dynamics of the EV lithium-ion battery trade network. Economic similarities, such as differences in GDP per capita, and geographical proximity remain fundamental determinants of the trade frequency. Consistent with established theories, these factors highlight the importance of transportation costs and logistical barriers in shaping trade flows [
42,
43]. These insights suggest that countries aiming to strengthen their trade relationships in the EV lithium-ion battery sector should leverage their geographical advantages and invest in efficient logistics frameworks to reduce the trade costs and enhance their competitiveness [
44].
Additionally, differences in labor costs and supply chain integration are significant drivers of trade. Higher labor costs prompt imports from low-cost countries, aligning with Shao et al. [
45], who emphasize the role of cost competitiveness in global resource trade. Furthermore, the integrity of the EV lithium-ion battery value chain enhances the trade efficiency and competitiveness, reinforcing the importance of vertical integration, as discussed by Chen et al. [
46].
The role of energy resources and venture capital in facilitating the EV lithium-ion battery trade is also critical. The energy supply supports production processes, while venture capital drives innovation and technological advancement in the industry [
37]. These findings suggest that a comprehensive approach combining industrial infrastructure development and financing mechanisms is essential in fostering the growth of the EV lithium-ion battery trade network.
Some variables, however, do not exhibit significant effects, offering nuanced insights into the trade network’s characteristics. The insignificance of a common official language suggests that linguistic barriers within the EU have been effectively mitigated, likely due to the widespread use of English as a business lingua franca [
47]. Similarly, the share of automotive manufacturing employment within the total manufacturing employment does not significantly influence trade flows, possibly because the EV lithium-ion battery industry is capital-intensive, with technological capabilities playing a more substantial role than employment indicators [
48]. Lastly, the lack of significance for FDI differences may reflect its primary impact on upstream activities, such as research and development, rather than direct trade flows, and its effects may involve time lags not captured in this analysis.
6. Conclusions
This study investigates the structural evolution and factors of the EV lithium-ion battery trade network among EU member states from 2012 to 2023. By employing SNA and the MRQAP method, it reveals a significant transition from a mono-core, low-density structure to a multi-core, high-density configuration. The findings highlight the emergence of CEE countries, such as Poland and Hungary, as key players in the EV lithium-ion battery trade network, driven by factors including geographic and economic proximity, logistics performance, labor cost differences, energy resources, and venture capital investment. These results extend the existing literature on green supply chains and provide empirical evidence of the role of regional policies in shaping industrial networks.
Based on these findings, several key policy implications emerge for the EU. First, targeted support for CEE countries through technical cooperation, innovation funding, and logistics infrastructure investment can further integrate these countries into the supply chain and enhance their export capacities. Second, to build a resilient network, policymakers should promote trade diversification, reducing the over-reliance on single nodes like Germany, and encourage balanced inter-regional collaborations. Third, sustained investment in transportation and logistics infrastructure, along with fostering innovation ecosystems through venture capital and policy incentives, is critical in maintaining the EU’s competitive edge in the global EV supply chain. These measures will contribute to a more cohesive, sustainable, and robust regional trade network.
However, this study has limitations that suggest avenues for future research. First, it relies on macro-level trade data and does not capture firm-level dynamics, such as strategic cooperation or production capacity differences, which could significantly influence the structure of the trade network. Second, the analysis focuses exclusively on intra-EU trade and does not consider global trade relationships with non-EU countries, thereby limiting the scope for understanding the EU’s broader position in the global battery value chain. Future research could integrate enterprise-level data to explore firm-specific behaviors and roles within the network. Expanding the analysis to include other major EV-supplying countries would also provide deeper insights into the development and evolution of the global EV lithium-ion battery industry.
Third, this study does not account for the potential impacts of external global events, such as geopolitical tensions, international trade disputes, or supply shocks originating from non-EU countries. Given the strategic importance of lithium-ion batteries and their raw material inputs, disruptions in global supply chains—particularly from dominant suppliers outside the EU—could indirectly reshape intra-EU trade dynamics. Future studies could incorporate indicators of global trade shocks or external dependency metrics to better understand how exogenous factors influence the resilience of regional trade networks.
Finally, while this study is centered on intra-EU trade, the findings also have broader relevance in the context of global battery value chains. It is widely recognized that China is currently the world’s leading manufacturer and exporter of EV lithium-ion batteries, and its dominant position in upstream raw material processing and cell production has profound implications for the EU’s supply chain autonomy. Although the EU has made notable progress in fostering regional capacity and reducing external dependences, the structural asymmetry in global supply networks remains a critical challenge. As such, the insights from this study can inform policy discussions on how to strategically position EU member states—particularly those in Central and Eastern Europe—within a globally competitive landscape. Future research could expand upon this work by incorporating trade flows between the EU and major global battery producers such as China, South Korea, and the United States, thereby providing a more comprehensive view of the evolving global EV battery ecosystem and its sustainability implications.


 ,
, 
