Article

A Techno-Economic Analysis of Integrating an Urban Biorefinery Process Within a Wastewater Treatment Plant to Produce Sustainable Wood Adhesives

1
Energy Institute of Louisiana, University of Louisiana, Lafayette, LA 70504-3602, USA
2
Department of Chemical Engineering, University of Louisiana, Lafayette, LA 70504-3602, USA
3
Department of Civil Engineering, University of Louisiana, Lafayette, LA 70504-3602, USA
4
Department of Mechanical Engineering, University of Louisiana, Lafayette, LA 70504-3602, USA
*
Author to whom correspondence should be addressed.
Sustainability 2025, 17(15), 6679; https://doi.org/10.3390/su17156679
Submission received: 2 June 2025 / Revised: 14 July 2025 / Accepted: 18 July 2025 / Published: 22 July 2025

Abstract

Societies are aiming to have a higher ecological consciousness in wastewater treatment operations and achieve a more sustainable future. With this said, global demands for larger quantities of resources and the consequent waste generated will inevitably lead to the exhaustion of current municipal wastewater treatment works. The utilization of biosolids (particularly microbial proteins) from wastewater treatment operations could generate a sustainable bio-adhesive for the wood industry, reduce carbon footprint, mitigate health concerns related to the use of carcinogenic components, and support a more circular economic option for wastewater treatment. A techno-economic analysis for three 10 MGD wastewater treatment operations producing roughly 11,300 dry pounds of biosolids per day, in conjunction with co-feedstock defatted soy flour protein at varying ratios (i.e., 0%, 15%, and 50% wet weight), was conducted. Aspen Capital Cost Estimator V12 was used to design and estimate installed equipment additions for wastewater treatment plant integration into an urban biorefinery process. Due to the mechanical attributes and market competition, the chosen selling prices of each adhesive per pound were set for analysis as USD 0.75 for Plant Option P1, USD 0.85 for Plant Option P2, and USD 1.00 for Plant Option P3. Over a 20-year life, each plant option demonstrated economic viability with high NPVs of USD 107.9M, USD 178.7M, and USD 502.2M and internal rates of return (IRRs) of 24.0%, 29.0%, and 44.2% respectively. The options examined have low production costs of USD 0.14 and USD 0.19 per pound, minimum selling prices of USD 0.42–USD 0.51 per pound, resulting in between 2- and 4-year payback periods. Sensitivity analysis shows the effects biosolid production fluctuations, raw material market price, and adhesive selling price have on economics. The results proved profitable even with large variations in the feedstock and raw material prices, requiring low market selling prices to reach the hurdle rate of examination. This technology is economically enticing, and the positive environmental impact of waste utilization encourages further development and analysis of the bio-adhesive process.

1. Introduction

Human population growth, in addition to rapidly increasing resource consumption and waste production, is leading to a developing resource management crisis. The need for basic goods will continue to increase, as will the population; thus, the influx of waste generated can overwhelm the current wastewater treatment operations. There are growing concerns in the United States regarding water security, chemical production sustainability, climate change, and pollution. These issues are arising with increasing instances of droughts, wildfires, low reservoirs, depletion of aquifers, aging infrastructure, and the introduction of new pollutants/contaminants [1,2]. The Water Resources Institute (WRI) estimated that by 2040, the United States is at risk of increasing water stress by 40–70% [3,4]. As reported by the United States Environmental Protection Agency (USEPA), the United States alone averages 34 billion gallons of wastewater entering treatment facilities daily [5]. Treating this influent wastewater is the main goal of current wastewater treatment plants (WWTPs) for water reclamation/reuse (i.e., replenishing water sources, irrigation, non-drinking water use, etc.), human health (i.e., removal of bacteria/parasites/pathogens, prevention of disease, etc.), and environmental health (i.e., reduction of pollution, habitat protection, etc.) [6,7]. While wastewater treatment processes are essential, it is apparent that current operations are still far from sustainable due to minimal resource recovery, high energy expenditure, low disinfection efficiency, lack of carbon neutrality, and an abundance of generated waste. Research efforts are actively seeking to produce technologies that can address these growing global demands and related concerns [8,9]. Clearly, the design and operations of WWTPs must become more sustainable.
Regarding waste, WWTPs and landfills are becoming overburdened by the large amounts of wastewater and resulting residuals entering/exiting facilities. Part of WWTP operations is the wasting of microbial sludges that are generated during the treatment of wastewater. Commonly known as biosolids, the digested sludge exiting a WWTP is biologically partially stabilized, mass-reduced, and normally dewatered to about 20% (w/w) solids for transport. Figure 1 is a diagram of the current operations in WWTP for the production of biosolids. At the end of the treatment process, dewatered biosolids (DBs) are the generated waste product. It is estimated that roughly 47% of DB produced from WWTPs are landfilled or incinerated [10]. The impact of disposal directly affects the industry’s carbon footprint and can contribute 13–41% of WWTPs’ total greenhouse gas (GHG) emissions [11]. The disposal and transportation of DB from WWTPs incur the largest expenses of the plant, along with energy and labor. In addition, this value is set to increase due to higher quantities of waste generated [10,12]. WWTPs are spending roughly USD 50 to USD 100 per ton of DB in disposal costs, whether the residuals are landfilled or utilized off-site as a land nutrition supplement (e.g., land farming), with over 80% of DB disposed of via these two techniques [10,13,14,15]. Also, landfill and land farming space are rapidly becoming scarce. Harmful constituents (e.g., polyfluoroalkyl substances [PFAS], microplastics, heavy metals, pathogens, pharmaceuticals, etc.) are increasing concerns related to biosolid use/disposal methods [16,17,18,19]. With these growing implications of contaminant levels after treatment, environmental regulations are constantly being reevaluated, and stricter standards are being made regarding what is deemed acceptable for disinfection. The disposal costs of these wastes can be expected to increase continuously [20]. It is becoming necessary to re-envision how society can utilize this waste for the production of valorized products. Doing so could negate the increasing costs of operation and mitigate biosolid disposal issues, such as land storage capacity. Finding uses for the generated waste, such as sewage sludges, can also provide revenue to the wastewater treatment industry by integrating biorefinery processes that can incentivize infrastructure upgrades, additions, and/or construction of new plants.
A biorefinery process in wastewater treatment is an attractive option, where the waste effluent and residuals are utilized as feedstock to generate useful products. There are many options for value-added bioproducts that can be produced from an integrated biorefinery process within wastewater treatment, such as biofuel, bio-proteins, bio-enzymes, bio-fertilizers, bio-pesticides, bio-flocculants, bio-surfactants, and other biochemicals [21,22]. These products can be generated by utilizing residuals from wastewater treatment, which include anaerobically digested sludge, waste-activated sludge (WAS), and DB. Biosolids are essentially solid organic waste obtained from WWTPs that typically contain 10 to 50% solids by weight and have been treated through anaerobic or aerobic digestion, alkaline stabilization, and oxidation processes [13,23]. Biosolids are estimated to contain a significant crude protein content by dry weight as well as a high moisture content [24]. In 2022, the United Nations (UN) projected the population to reach 8.5 billion by 2030 and continue to increase to 9.7 billion by 2050, so finding a use for these residuals as their generation increases would be extremely beneficial for future sustainability efforts [25].
Biosolids are proteinaceous, meaning that the residuals contain a protein-rich composition, and have been proven viable as biomass feedstock to produce a protein-based bio-adhesive. This is a novel idea proposed by the author team for WWTP waste utilization. Protein-based adhesives are generated mainly from naturally occurring sources such as plants (e.g., soybean, wheat, gluten, algae, etc.), animals (e.g., collagen, gelatin, etc.), and microorganisms (e.g., bacteria, fungi, etc.) [26]. Formation of these adhesives requires structural transformations, including protein denaturation and functional group exposure [27]. Molecular forces such as van der Waals interactions, chemical bonding, and electrostatic attraction are also involved [28,29]. Proteins can be denatured by exposure to high temperatures, acids/bases, certain chemicals, and/or mechanical stress. These conditions disrupt the weak molecular forces that maintain the protein’s native structure, causing it to unfold and lose its biological activity. The type and structure of proteins are believed to have a significant impact on the functionality of the adhesive, making different protein feedstocks compatible with differing applications due to performance and properties [30]. Once unfolded, the adhesive proteins then undergo processing for refinement [31]. This can involve cross-linking, where chemical or physical agents create bonds between protein molecules, enhancing adhesive strength and stability. Also, formulation practices, such as blending with other polymers or additives, allow for customizing adhesive properties to suit specific applications. Adhesive technology functions through adhesion, the attractive forces between molecules of different substances that enable the adhesive to adhere to a surface, and cohesion, the intermolecular forces within the adhesive, maintaining its structural integrity [32]. The resulting protein-based bio-adhesives exhibit advantageous traits, including biocompatibility, biodegradability, and sustainability. A proposed pathway from feedstock to protein adhesive formation is shown in Figure 2.
Attraction to natural or non-synthetic alternatives, in many industries, is continuing to grow due to their advantageous properties and their complementary incorporation into industrial sustainable goals. The wood industry, in particular, is looking for active applications in the reduced use of petroleum products and harmful chemicals. Currently, many types of wood adhesives on the market are made from different acids or alkalis. Natural and synthetic wood adhesives are used throughout the industry, and the major feedstock used to manufacture these bonding agents is petroleum-based synthetic polymers [33,34]. However, as highly motivated industries are increasingly prioritizing green initiatives, there is a growing interest in producing a variety of products without the consumption of petroleum sources. In addition to wanting a reduction in carbon footprint, there has been a growing concern about formaldehyde and volatile organic compounds (VOCs) usage in the sector. Formaldehyde is a known carcinogen, and there has been increased pressure to remove it as a component of many industrial products [35,36]. For many of the same reasons and air quality concerns, VOCs employed in the formulation of adhesives are facing the same trend. Many of the leading wood adhesives on the market contain all of these substances. These petroleum-based synthetic adhesives pose environmental troubles due to their non-renewable origin and persistence in the environment.
The wood adhesive market is currently more than a USD 5.3B industry with formaldehyde formulations leading the market. Between 2023 and 2030, there is expected to be a 4.3% compound annual growth rate or CAGR [37]. It is estimated that 70% of all wood products on the market utilize wood adhesive technology. This includes the production of plywood, fiberboard, and many other wood composites. The advantageous market outlook, in addition, shows that bio-adhesives, such as soy-based adhesives, are steadily growing in popularity, with the greatest reported CAGR of 7.9% [37]. The sustainability, biodegradability, nontoxicity, and versatility of bio-adhesives are valuable assets in the wood industry [38]. Soy adhesives are leading the feedstock sector due to the aforementioned assets, as well as having high shear strengths compared to other bio-feedstocks. Bio-based wood adhesives are a continually growing area for research. Figure 3 shows the publications per year pulled from the Web of Science (WoS) database by topic (“bio-based wood adhesive”) with suggested keywords of “bio-adhesives” and “wood composites”. Between 1993 and 2023, there have been over 4700 publications fitting the specified criteria. The period between 2019 and 2023 saw a substantial increase in research production. This can be attributed to increasing environmental and safety regulations of the wood sector, as well as advancing biotechnologies and corporate sustainability goals. With government/state bodies increasing funding and incentives for bio-based alternatives, the outlook for innovative products that can reach commercialization is exciting and positive.
The current development of DB adhesives indicates that the feedstock alone is lacking in strength compared to soy adhesives. Zeringue et al. have developed a biosolid adhesive that has a maximum shear stress averaging 180 psi [24]. DB adhesives, in comparison to soy adhesives, would only be considered for medium-density fiberboard (MDF) for interior use. However, an interesting concept proposed in the study is the prospect of utilizing defatted soy flour (DSF) as a co-feedstock with DB to increase the strength of the biosolid-based adhesive while simultaneously providing a lower-cost option compared to soy adhesives. Figure 4 shows biosolid adhesives produced by the author team with different DSF additions for preliminary analysis and selection of formulations for modelling. With the implementation of DSF, at an 85:15 DB to DSF wet weight ratio, the strength was found to increase to an average of 325 psi, and at 50:50, the strength reached an average of 450 psi. This could assist in growing the potential of the novel concept of sewage sludge-based adhesives to a wider variety of applications due to the potential improved properties of the resulting adhesive. With the addition of co-feedstocks, biosolid-based adhesives can gain the benefits of other, more traditional protein-based adhesive technologies in terms of mechanical properties [27]. Options for protein feedstocks are vast, and some of the potential co-feedstocks and their bulk market pricing can be found in Table 1. However, novel protein sources, like sewage sludges, offer reduced costs and potentially the same technical performance.
The application of biosolid utilization for the generation of bio-adhesives can provide a profitable economic option for the wastewater treatment industry while simultaneously providing a greener solution for the wood industry. This option also solves growing issues with the disposal of DB due to harder-to-find disposal sites and increasing costs. Addressing these challenges requires comprehensive waste reduction strategies, improved recycling and resource recovery initiatives, and investment in sustainable waste management infrastructure to minimize environmental impacts and promote a circular economy. Additionally, the research sector currently lacks thorough process analyses on integrated systems within wastewater treatment operations to produce value-added products. Thus, this paper aims to present a techno-economic analysis of implementing a biorefinery within WWTP operations for biosolid utilization in the production of a sustainable bio-adhesive based on adhesive produced from the proteins found in WWTP biological sludges. Note that all of the WWTP sludges evaluated were “as-is”, with no form of protein extraction/purification applied. In other words, the WWTPs were taken as being produced from standard WWTP operations with no additional methods of protein isolation involved. Both stand-alone biosolid proteins and blends with soy protein meal are evaluated as products. To accomplish this task, this paper defines the following objectives:
  • Develop models for 10 MGD WWTP operations producing DB adhesives with and without DSF protein blending and estimate associated costs.
  • Size, design, and estimate the required process equipment for WWTP integrated adhesive biorefinery models utilizing Aspen Cost Estimator V12.
  • Apply economic formulas to evaluate 20-year plant life for net present value (NPV) and discounted cash flow rate of return/internal rate of return (IRR) to obtain the modeled process’s economic capability.
  • Conduct sensitivity analyses on critical process parameters to test the robustness of the models.

2. Methods and Development

Three separate biosolid-based wood adhesive formulations were analyzed throughout this paper for their commercial viability. The first plant option (P1) studied an operation where DB is the sole feedstock for adhesive production, the second plant option (P2) included a mixed feedstock of DB with DSF at an 85:15 wet weight ratio, and the third plant option (P3) increased the amount of DSF to have a 50:50 wet weight ratio with DB. These mix ratios were selected due to their strengths, discussed previously, and spatial variability within the dataset. The approach for the process modeling, economics, and discounted cash flow of the process options P1, P2, and P3 as biorefinery process additions to WWTPs was examined.

2.1. Biosolid Production Calculations

Process equipment design and economic analysis require appropriate estimating of WWTPs’ production of residual DB produced per day. For the proposed designs, it is assumed that all DB produced per day at the WWTP will be used to produce wood adhesives. The plant size selected to begin calculating the raw feedstock for the biorefinery is a facility accepting 10 million gallons per day (MGD) of wastewater influent. Using the amount of influent flow to the facility will enable the theoretical calculation of wet pounds of DB removed from the assumed plant operations per day. The process used can be found in Equations (1)–(3).
B O D r e m o v e d ( l b / d a y ) = B O D r e m o v e d ( m g / L ) × F l o w M G D × 8.34 ( l b / g a l )
Equation (1)—BOD removed per day [42].
D r y S o l i d s r e m o v e d ( l b / d a y ) = B O D r e m o v e d ( l b / d a y ) × F / M r a t i o
Equation (2)—Dry solids removed per day [42].
W e t S o l i d s r e m o v e d l b / d a y = D r y S o l i d s r e m o v e d l b / d a y   1 W a t e r C o n t e n t
Equation (3)—Wet solids removed per day [42,43,44].
The assumed variables for the equations above were set as follows: biochemical oxygen demand (BODremoved) concentration was assumed to be 300 mg/L in Equation (1), 0.45 for the food to microorganism (F/Mratio) conversion in Equation (2), and the moisture content of the wet DB was 80% in Equation (3) [42,43,44]. These factors are susceptible to fluctuations depending on the facility selected for operations. After initial analysis, it was found that the amount of raw feedstock wet DB removed from wastewater per day for this application is estimated at roughly 56,300 pounds. For real-world comparison in this assessment, the actual quantity of DB separated from wastewater can largely vary depending on the process, with the likelihood to fluctuate daily. Data collected from a local 4 MGD wastewater influent produced 5240 dry pounds per day of DB. When this amount was scaled up to a 10 MDG influent wastewater plant, the biosolid removal would parametrically equate to 13,100 dry pounds per day. Taking this factor and utilizing Equation (3), it is calculated that a 10 MGD plant would obtain 65,500 wet pounds per day of DB from the separation. It is also noteworthy that the proposed process will utilize the proteins in the raw DB without protein extraction and purification, which is the condition used for the generation of strength data presented above. For this analysis, the value obtained from the theoretical data was chosen due to the production rate being lower than the real-world value. From this starting feedstock amount, formulation scale-up from laboratory experimentation was applied to produce the scenarios for total adhesive production from Plant Options P1, P2, and P3.

2.2. Process Design

Production of the adhesives for Options P1, P2, and P3 will involve the same proposed processes. Feedstocks will involve different formulations, and all are to be batch-added to agitated tank reactors and stirred until homogenized. The DB added will utilize the moisture content (~80%) as received because the formulation necessitates water. This is a highly fortuitous process situation since it eliminates further dewatering of the sludge. Note that the other protein feedstocks are also assumed to be utilized as-is; however, they contain relatively little free water. Next, the necessary water content, which is dependent on the formulation, is supplied via the plant effluent to reach the required moisture content for each candidate mixture. A solution of denaturant sodium hydroxide (caustic) is added in conjunction with a denaturation time of 15 min in conditions of continual agitation. The product of this reaction delivers the desired bio-adhesives. No heat is applied during the reaction; however, dependent on weather and location, some applications may require process heating or cooling to maintain a controlled process temperature range of 15–30 °C [45].
The approach to potential design additions to an existing WWTP requires certain equipment for the collection, transport, and generation of the adhesives generated from Plant Options P1, P2, and P3. A solids feeder and hopper system to collect the DB exiting the existing filter press will replace the usual truck disposal collection. The hopper will then feed supplied DB to a belt conveyor system. The conveyed DB will be split and routed into two of four agitated reactor vessels. For P1, the DB are mixed with a quantity of hydroxide base, in addition to water, for the specified reaction time of 15 min and allowed to exit the vessel for packaging. The adhesive packaging selected in this analysis is 275-gallon caged IBC totes. P2 and P3 will follow the same process within the reactor vessels, with the addition of feedstock DSF required in each formulation. Four jacketed agitated reactor tanks were costed, accounting for two backup reactor vessels. The spare reactors will provide safeguards in operation for process scale-up, normal machine maintenance/cleaning, and/or plant downtime. For storage, two jacketed tanks are proposed to store liquid raw materials such as caustic or potentially water effluent from the WWTP process. In addition, live bottom storage bins for the DSF are also estimated in the cost analysis. Selections for materials of construction, sizing, and quantity of the process equipment will be discussed further in Installed Equipment Cost Estimation. The proposed system diagram, excluding quantity and pumps, is visualized below in Figure 5.

3. Preparation of Economic Estimates

Estimation of project costs is required to explore the economic viability of the three proposed plant processes utilizing market bulk costs, utility costs, and Aspen Capital Cost Estimator V12 software. This study utilized the following assumptions for estimating the process economics: (1) 8000 working operation hours per year, (2) the life of the plant is 20 years, (3) a three-year construction phase before start of plant life, (4) fixed capital investment (FCI) is processed in both the construction and life phases of plant operations, (5) allocation of direct cost occur over the construction phase by fractions of the installed equipment cost, (6) revenues are taken as fractions of approximately 60, 90, and 95% of the project cash flow for the first three years of plant lifetime to simulate running at less than full capacity due to lack of initial market interest, (7) product costs are constant, (8) straight-line depreciation, (9) wastewater incentive low-interest rate of 1.7% is utilized for net present value (NPV) analysis, (10) the hurdle rate for process acceptance is an IRR of 15% or greater, and (11) the income tax rate is 40% [46,47].

3.1. Economic and Discounted Cash Flow Calculations

The examination of the proposed plant options utilized an investment model for the plant additions to obtain a discounted cash flow rate of return [47]. The working model proposes the implementation of all previously described costs, operator costs, and revenue generated. Employing general assumptions and bringing all costs into a function of the installed equipment costs (IEC) gives the methodology summarized in Table 2.

3.2. Material and Energy Cost Estimation

Each plant operation presented was evaluated for the raw material and energy cost per formulation and process equipment requirements. Table 2 provides the cost of raw materials for Options P1, P2, and P3. DSF and sodium hydroxide (NaOH) bulk costs in USD/t were obtained from a 2020 USDA food price list report for DSF and EChemi NaOH market analysis, respectively. Adhesive packaging requirements, caged IBC totes, were calculated to handle the daily production of adhesive per plant scenario.

3.3. Installed Equipment Cost Estimation

Raw material calculations allowed for the proper equipment sizing and design. All reactor and storage vessel costs in each plant analyzed were selected to be stainless steel to inhibit water corrosion and handle the alkalinity of the hydroxide. In total, a hopper/feeder system, four jacketed agitated reactor vessels, two jacketed storage tanks, a series of belt conveyors collectively totaling 80 feet in length with a 48-inch belt width, and a necessary quantity of live bottom storage bins for DB and/or DSF storage were costed in this analysis. The liquid storage vessels were estimated for 10 days of required material, and vessels for solids storage were set for 5 days of DB storage and 10 days of DSF storage. Equipment was sized for the increasing volumes of adhesive production per day and plant condition, with 30% headspace available for process scale-up. Table 3 visualizes the total installed equipment cost, material cost, and utility cost generated for each plant design. The cost of industrial electricity was selected from an August 2023 report from the US Energy Information Administration for Louisiana in the West South-Central Census Division.
Installed equipment cost reports generated in Aspen Cost Estimator employed variables for all plant acquisition and installation for Plant Options P1, P2, and P3, respectively.

4. Results

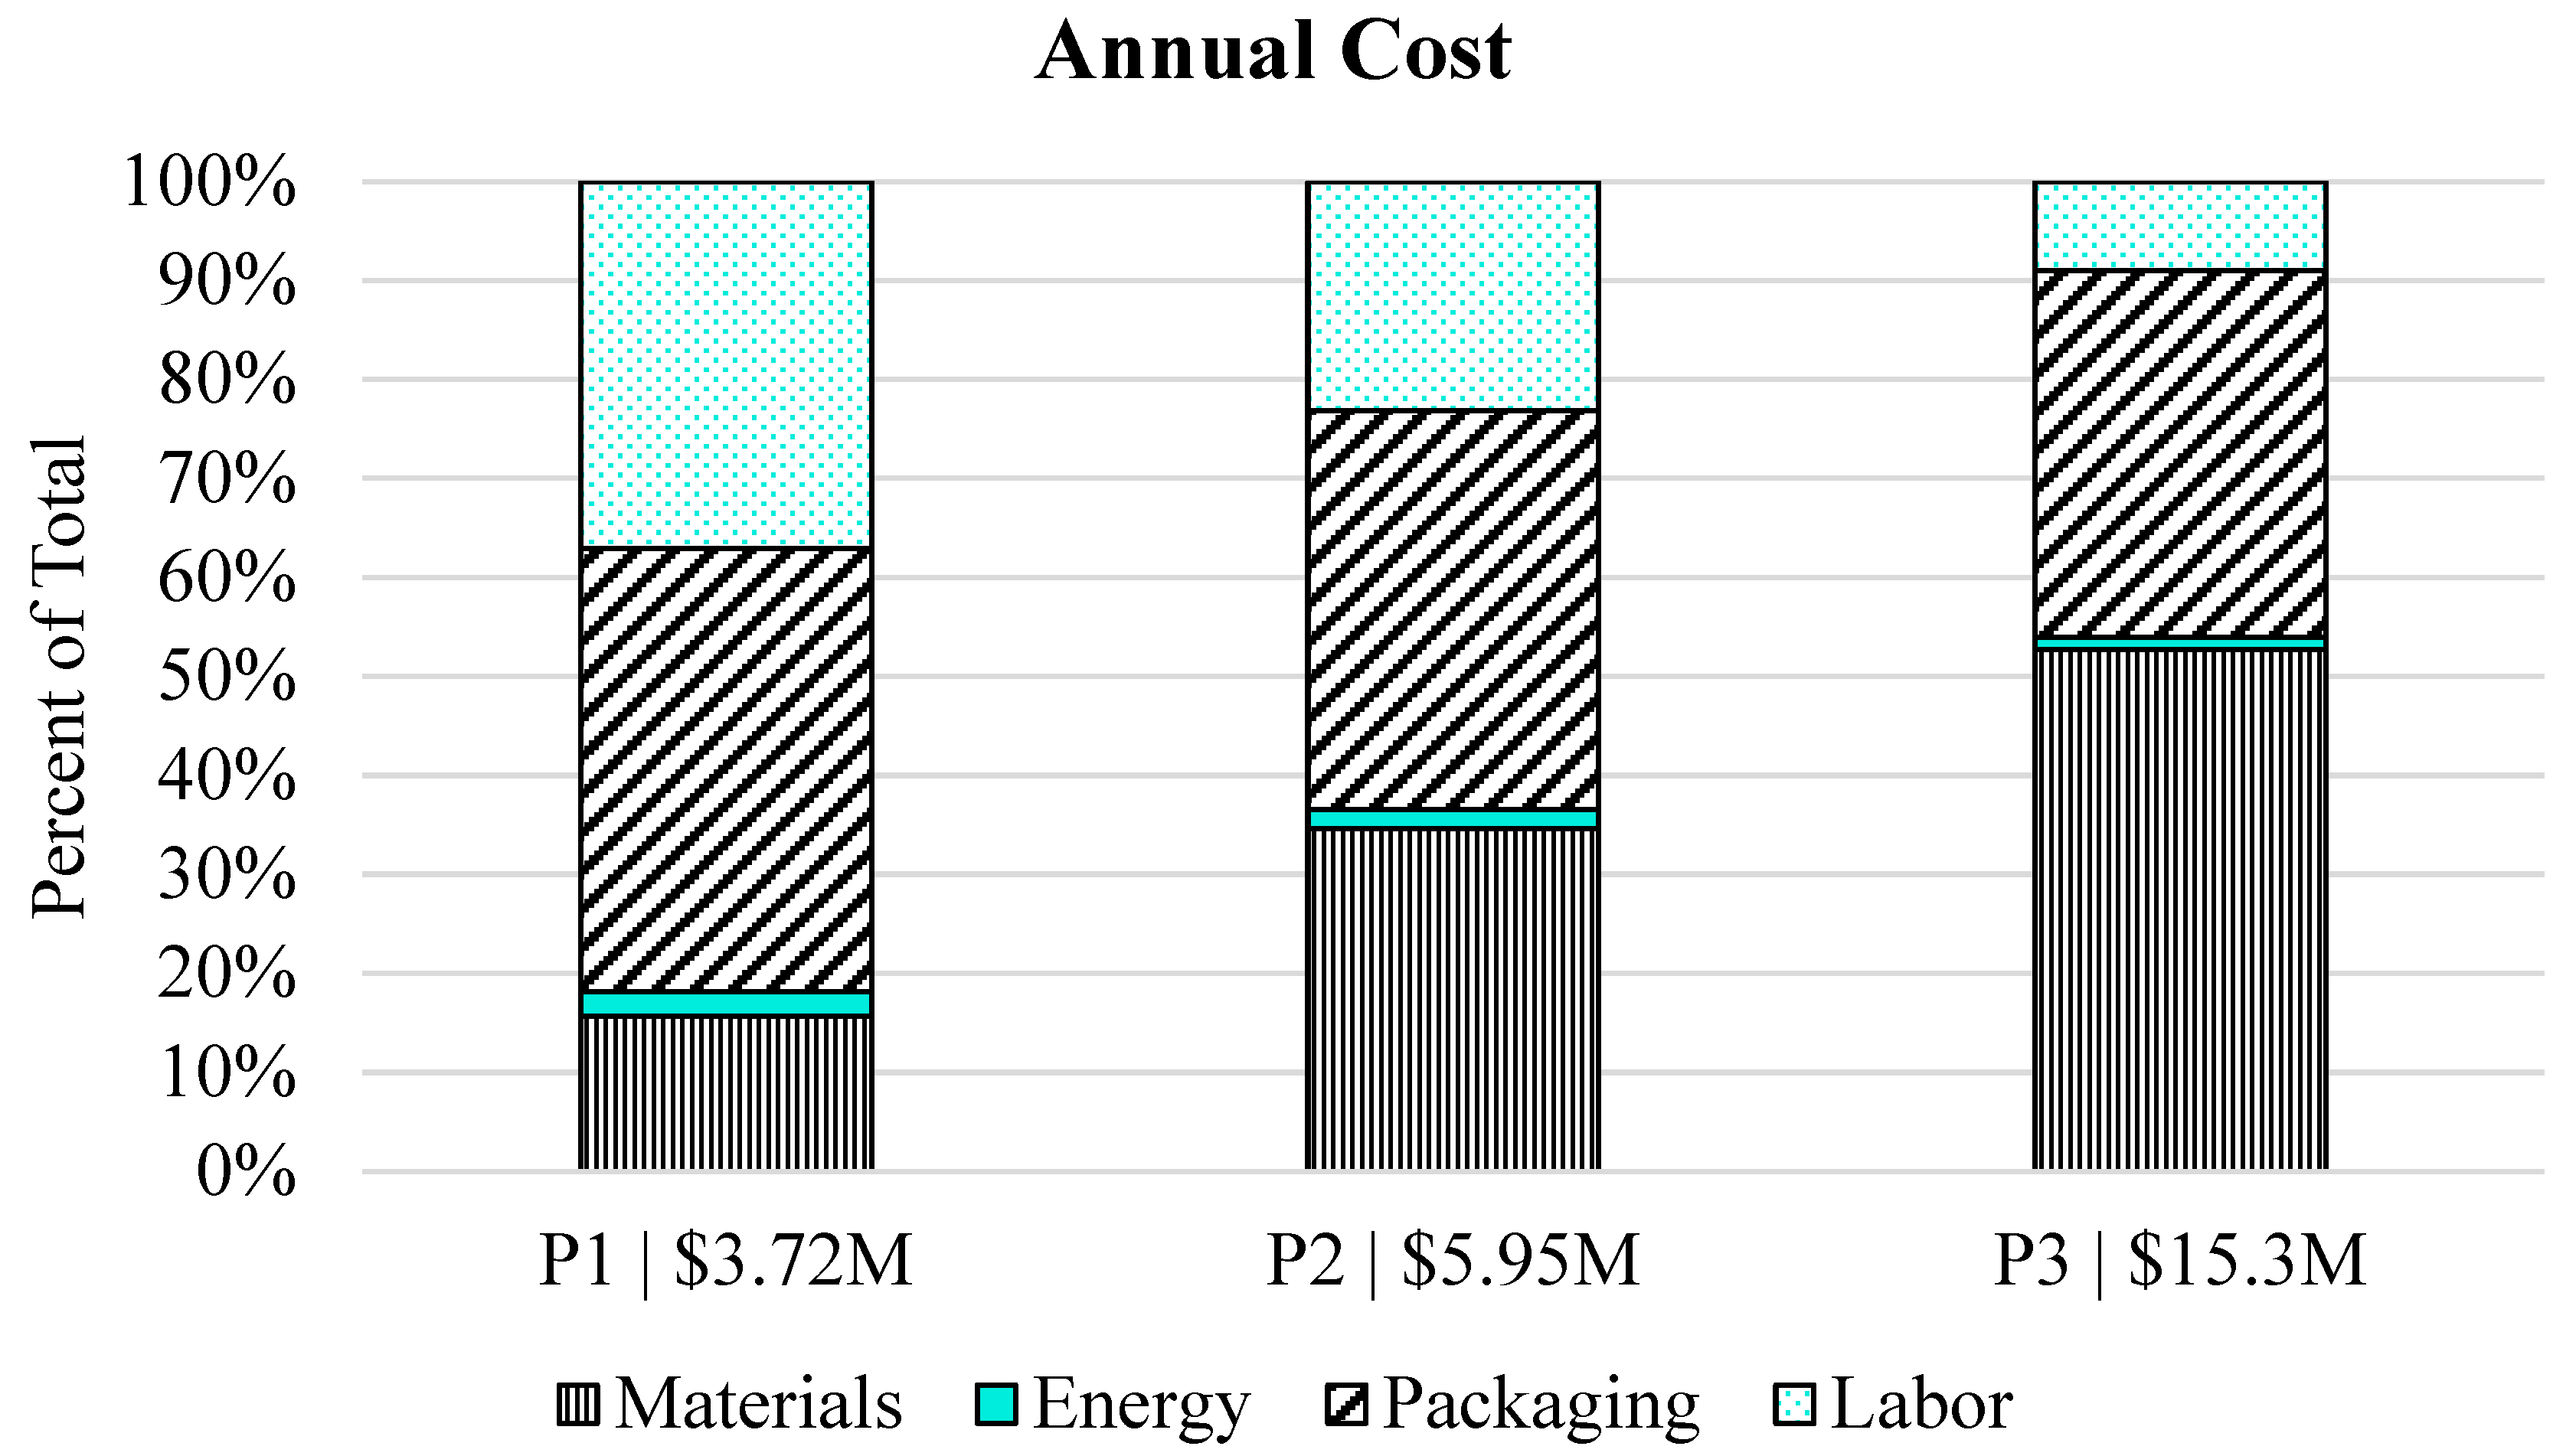
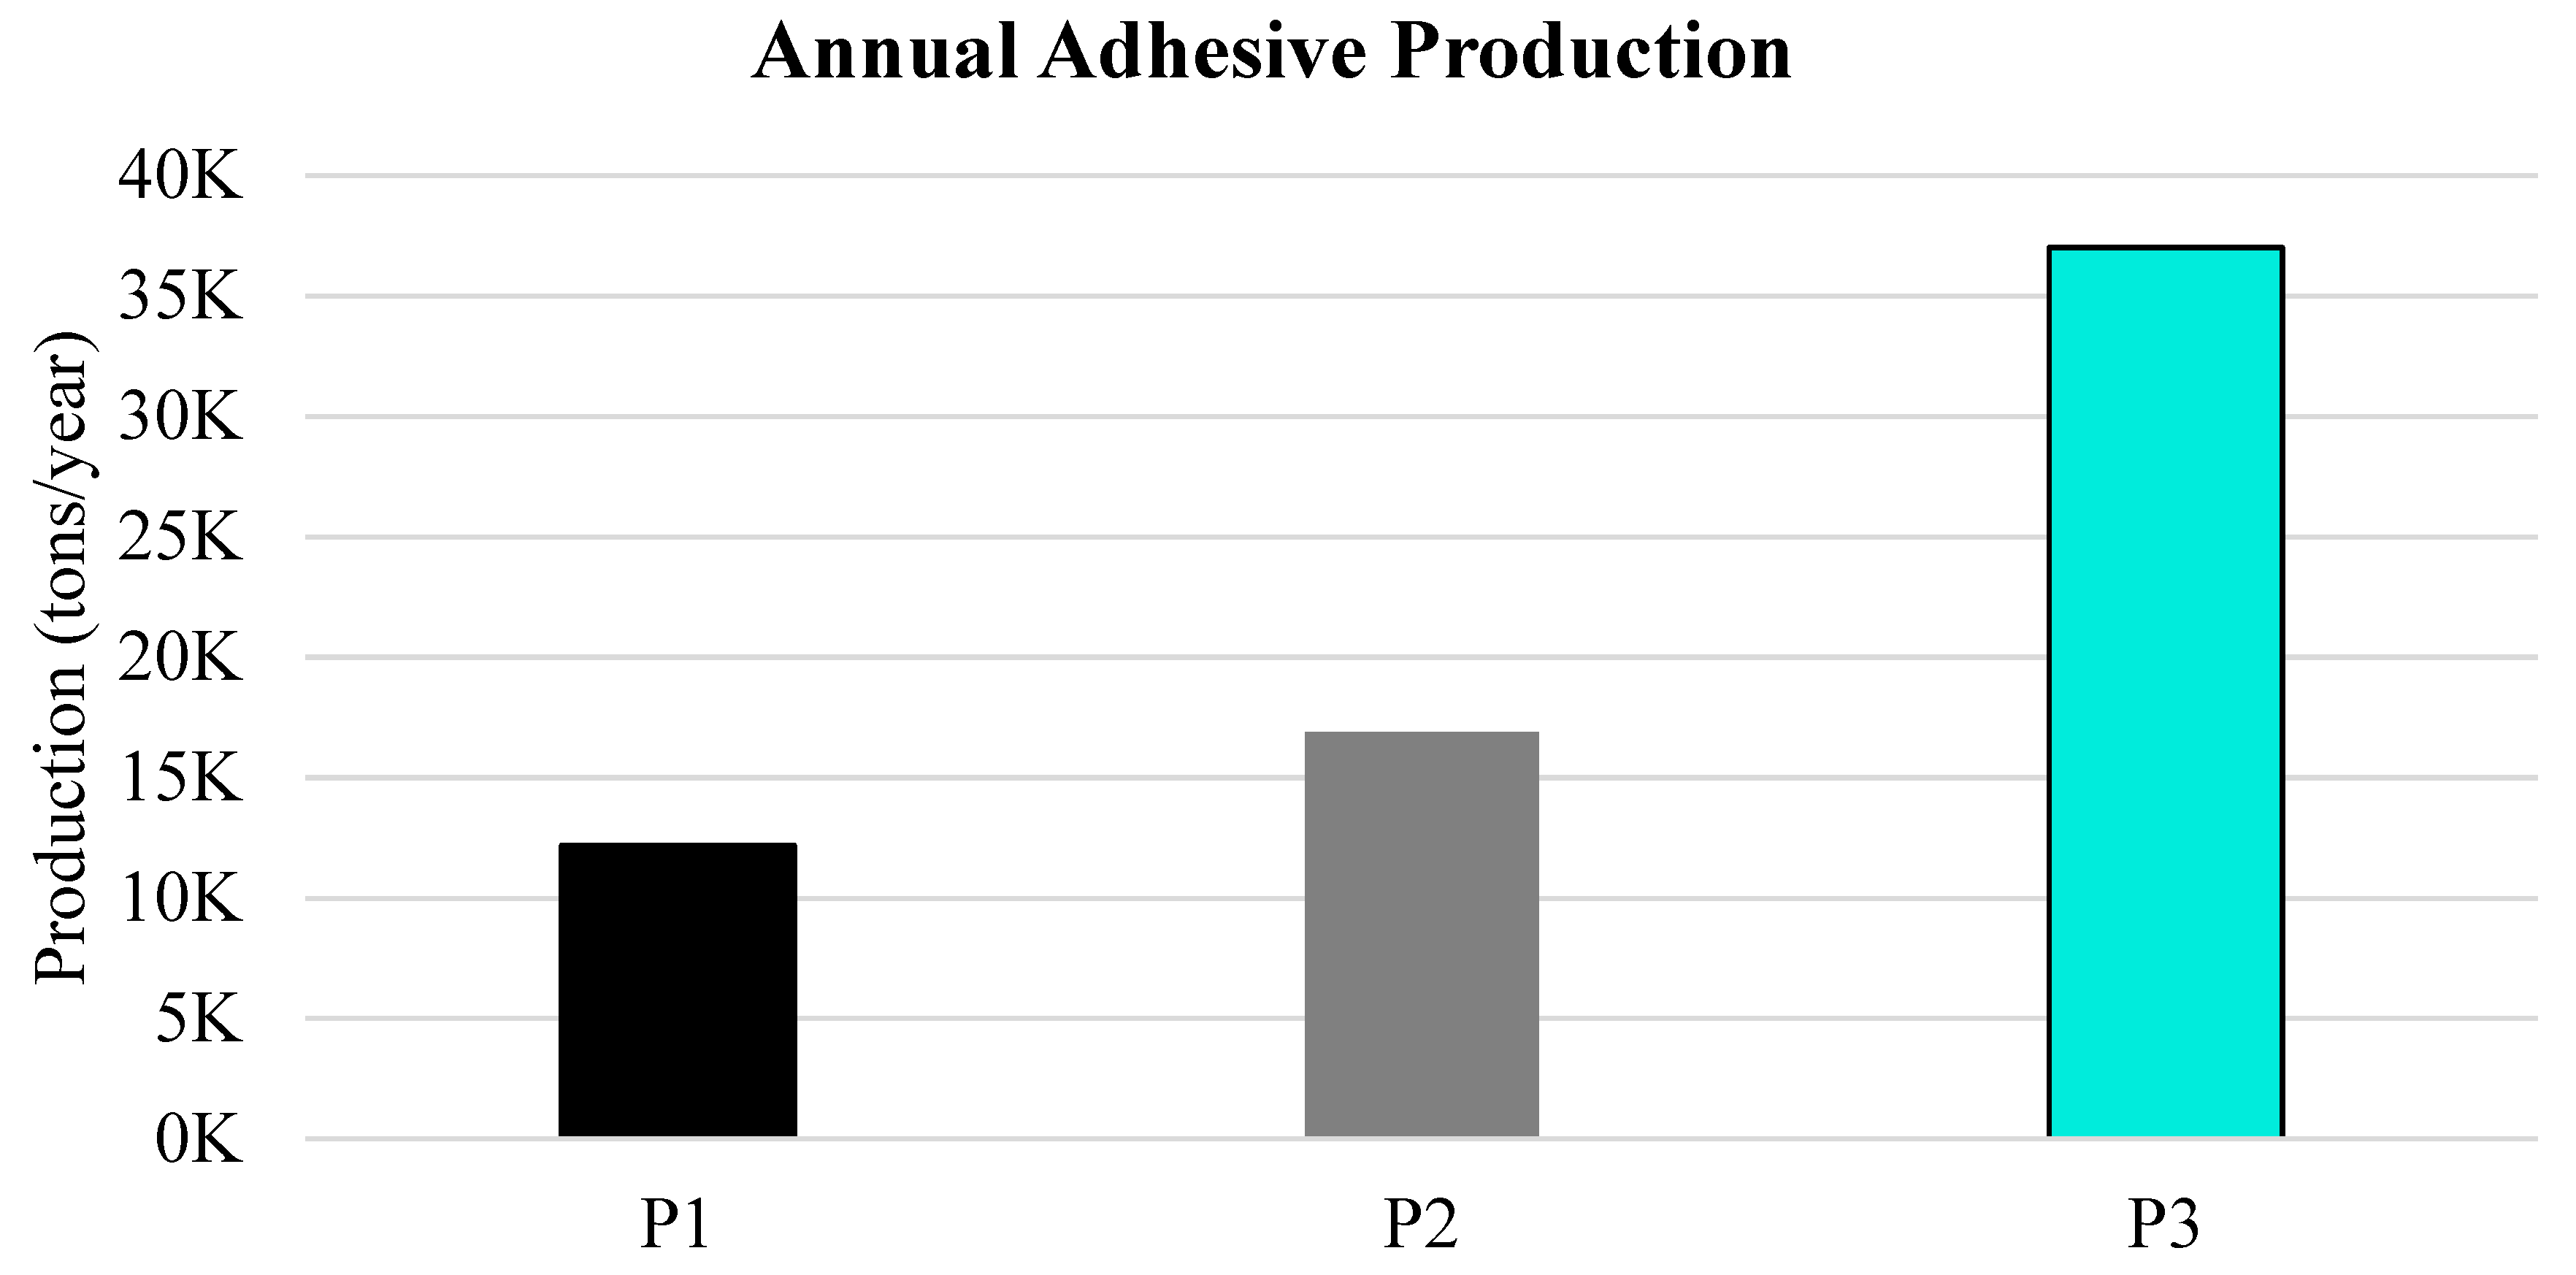
4.1. Annual Production Costs

The total annual cost of production for each plant option was found to increase as the plant’s production of adhesive scaled, and can be visualized in Figure 6. Information for the total cost was taken from Table 3, in addition to the employee cost estimated as 4.5 shifts per operator for four operators needed at any time to generate the paid annual salary [47]. Since the number of operators per shift remains the same for all plant processes, the employee costs remain constant. The utility requirements also increase per plant due to agitation and transportation power requirements. However, the biggest factors dictating the cost of production are the DSF required for formulations and the packaging costs. Option P3 has the largest operating cost of USD 15.3M due to the highest usage of DSF, utility expenditure, and required IBC packaging totes.

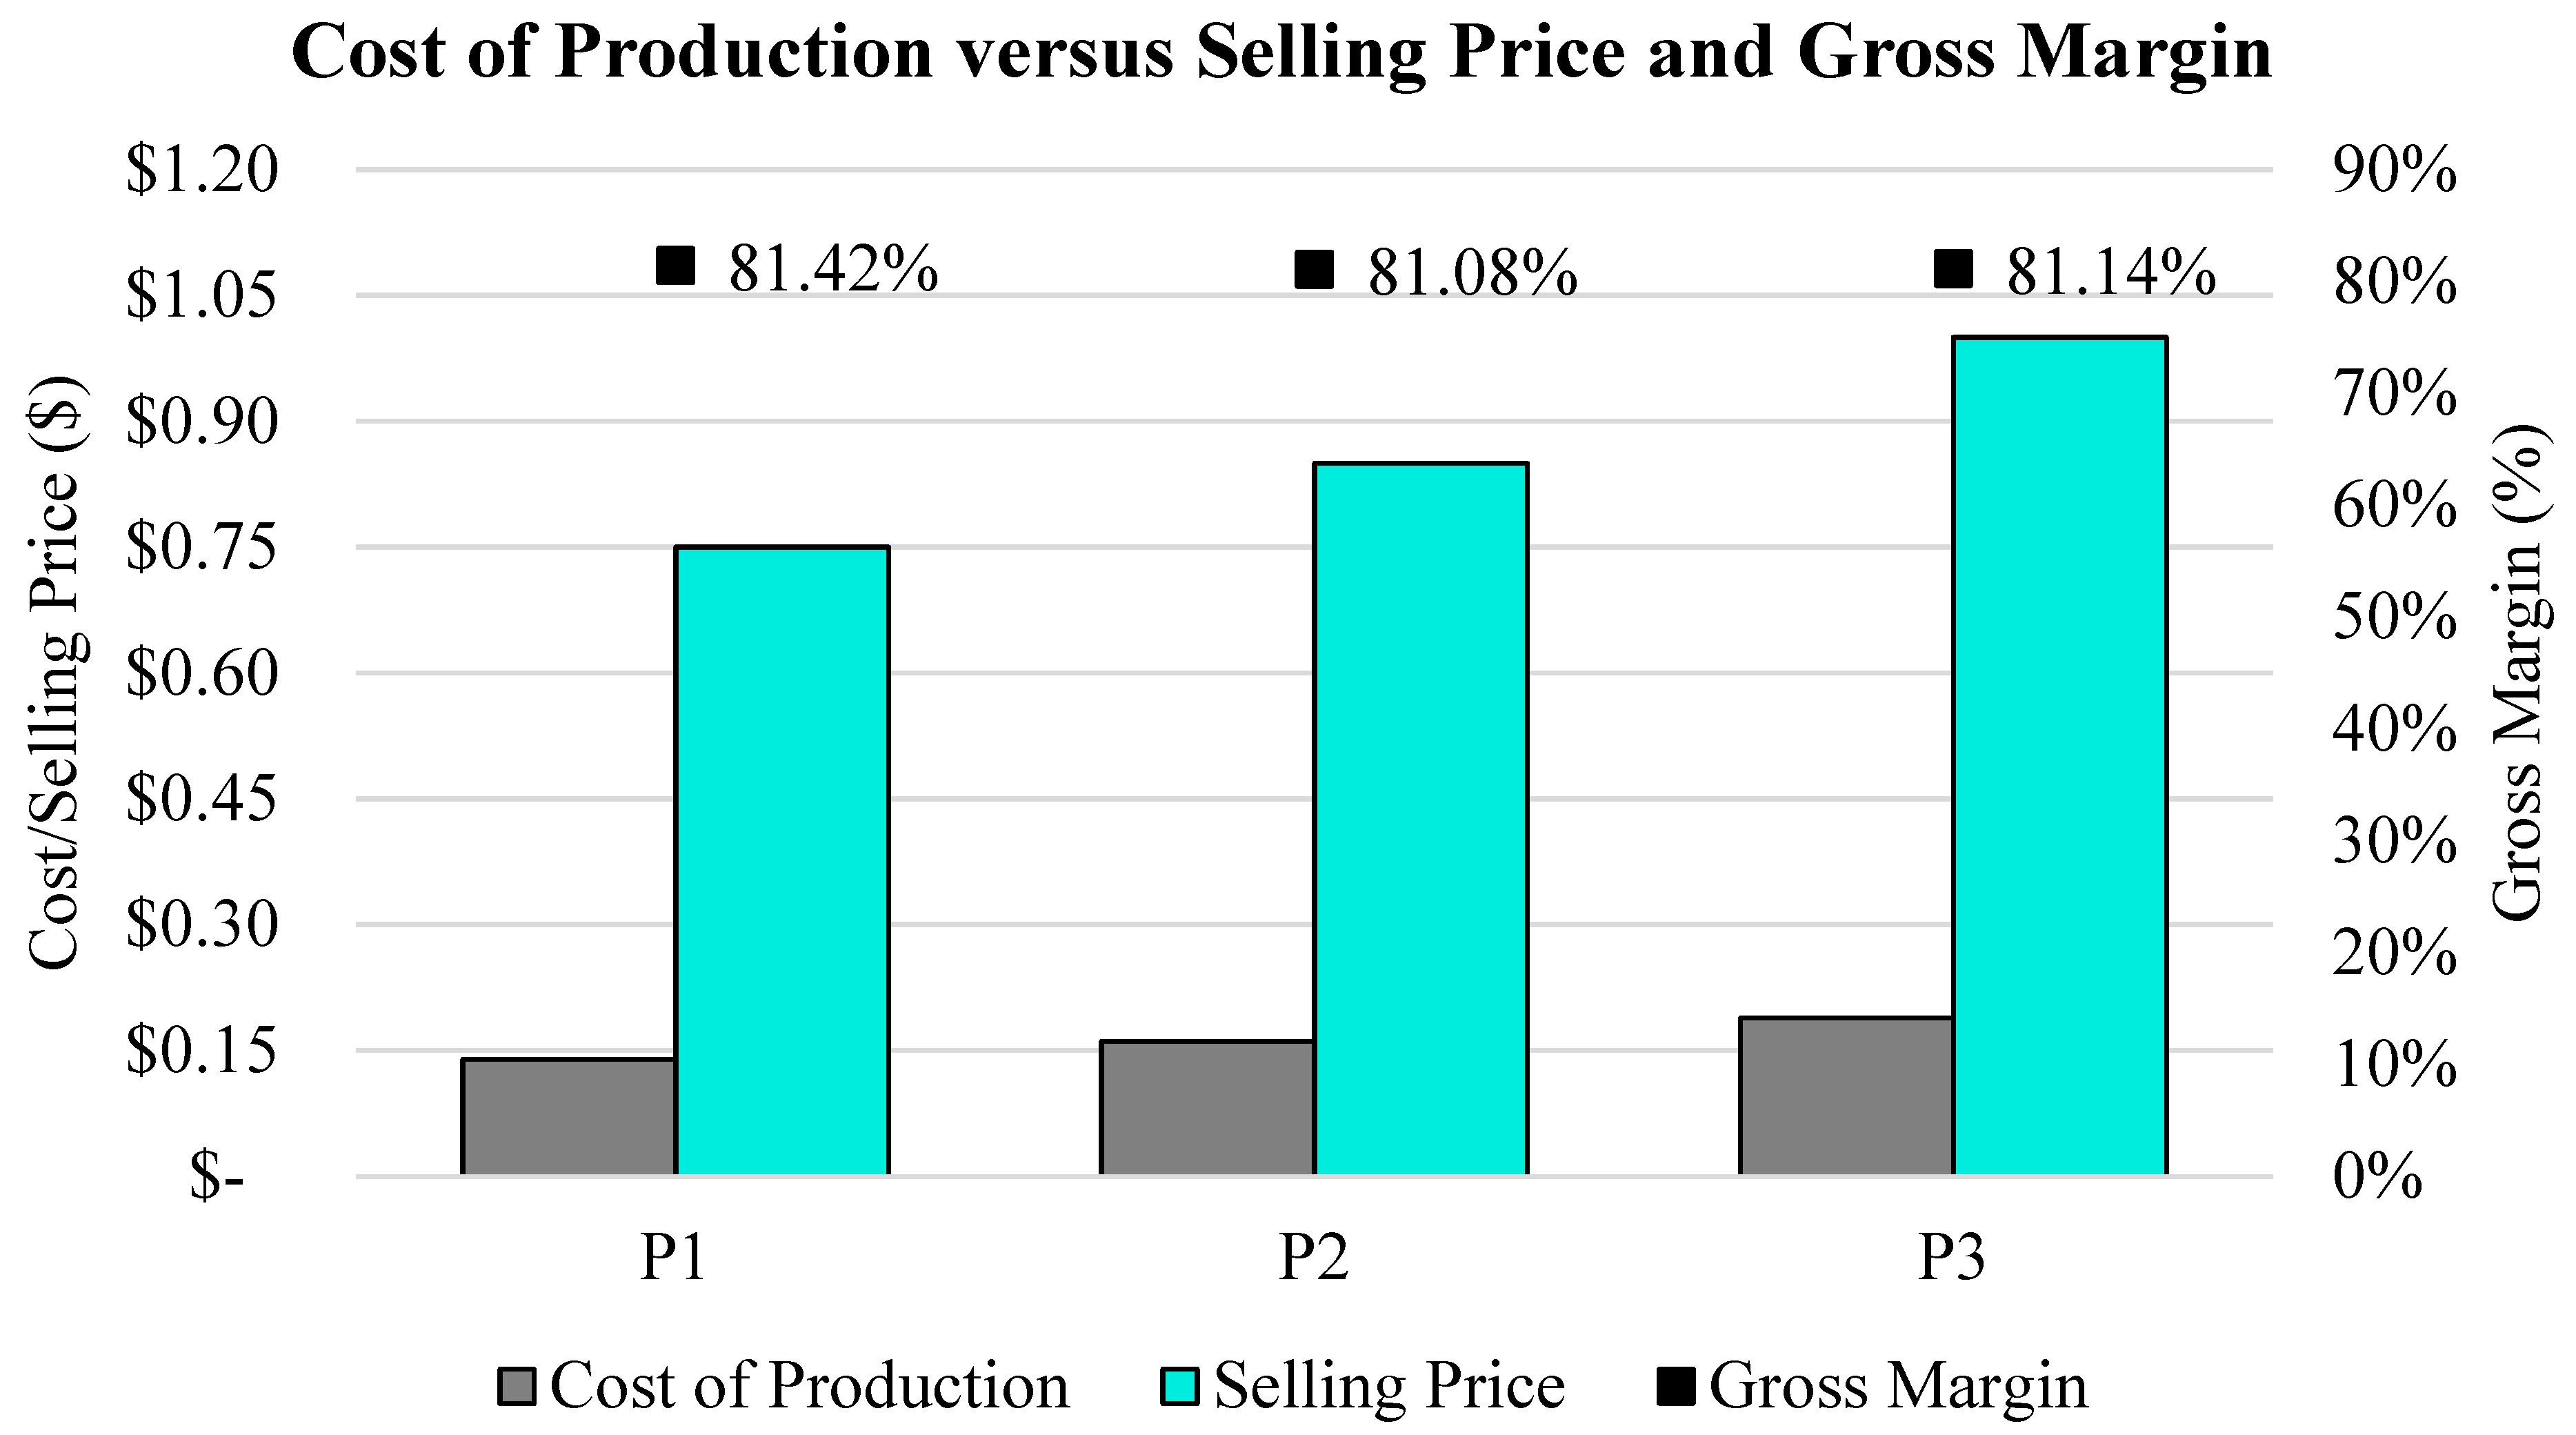
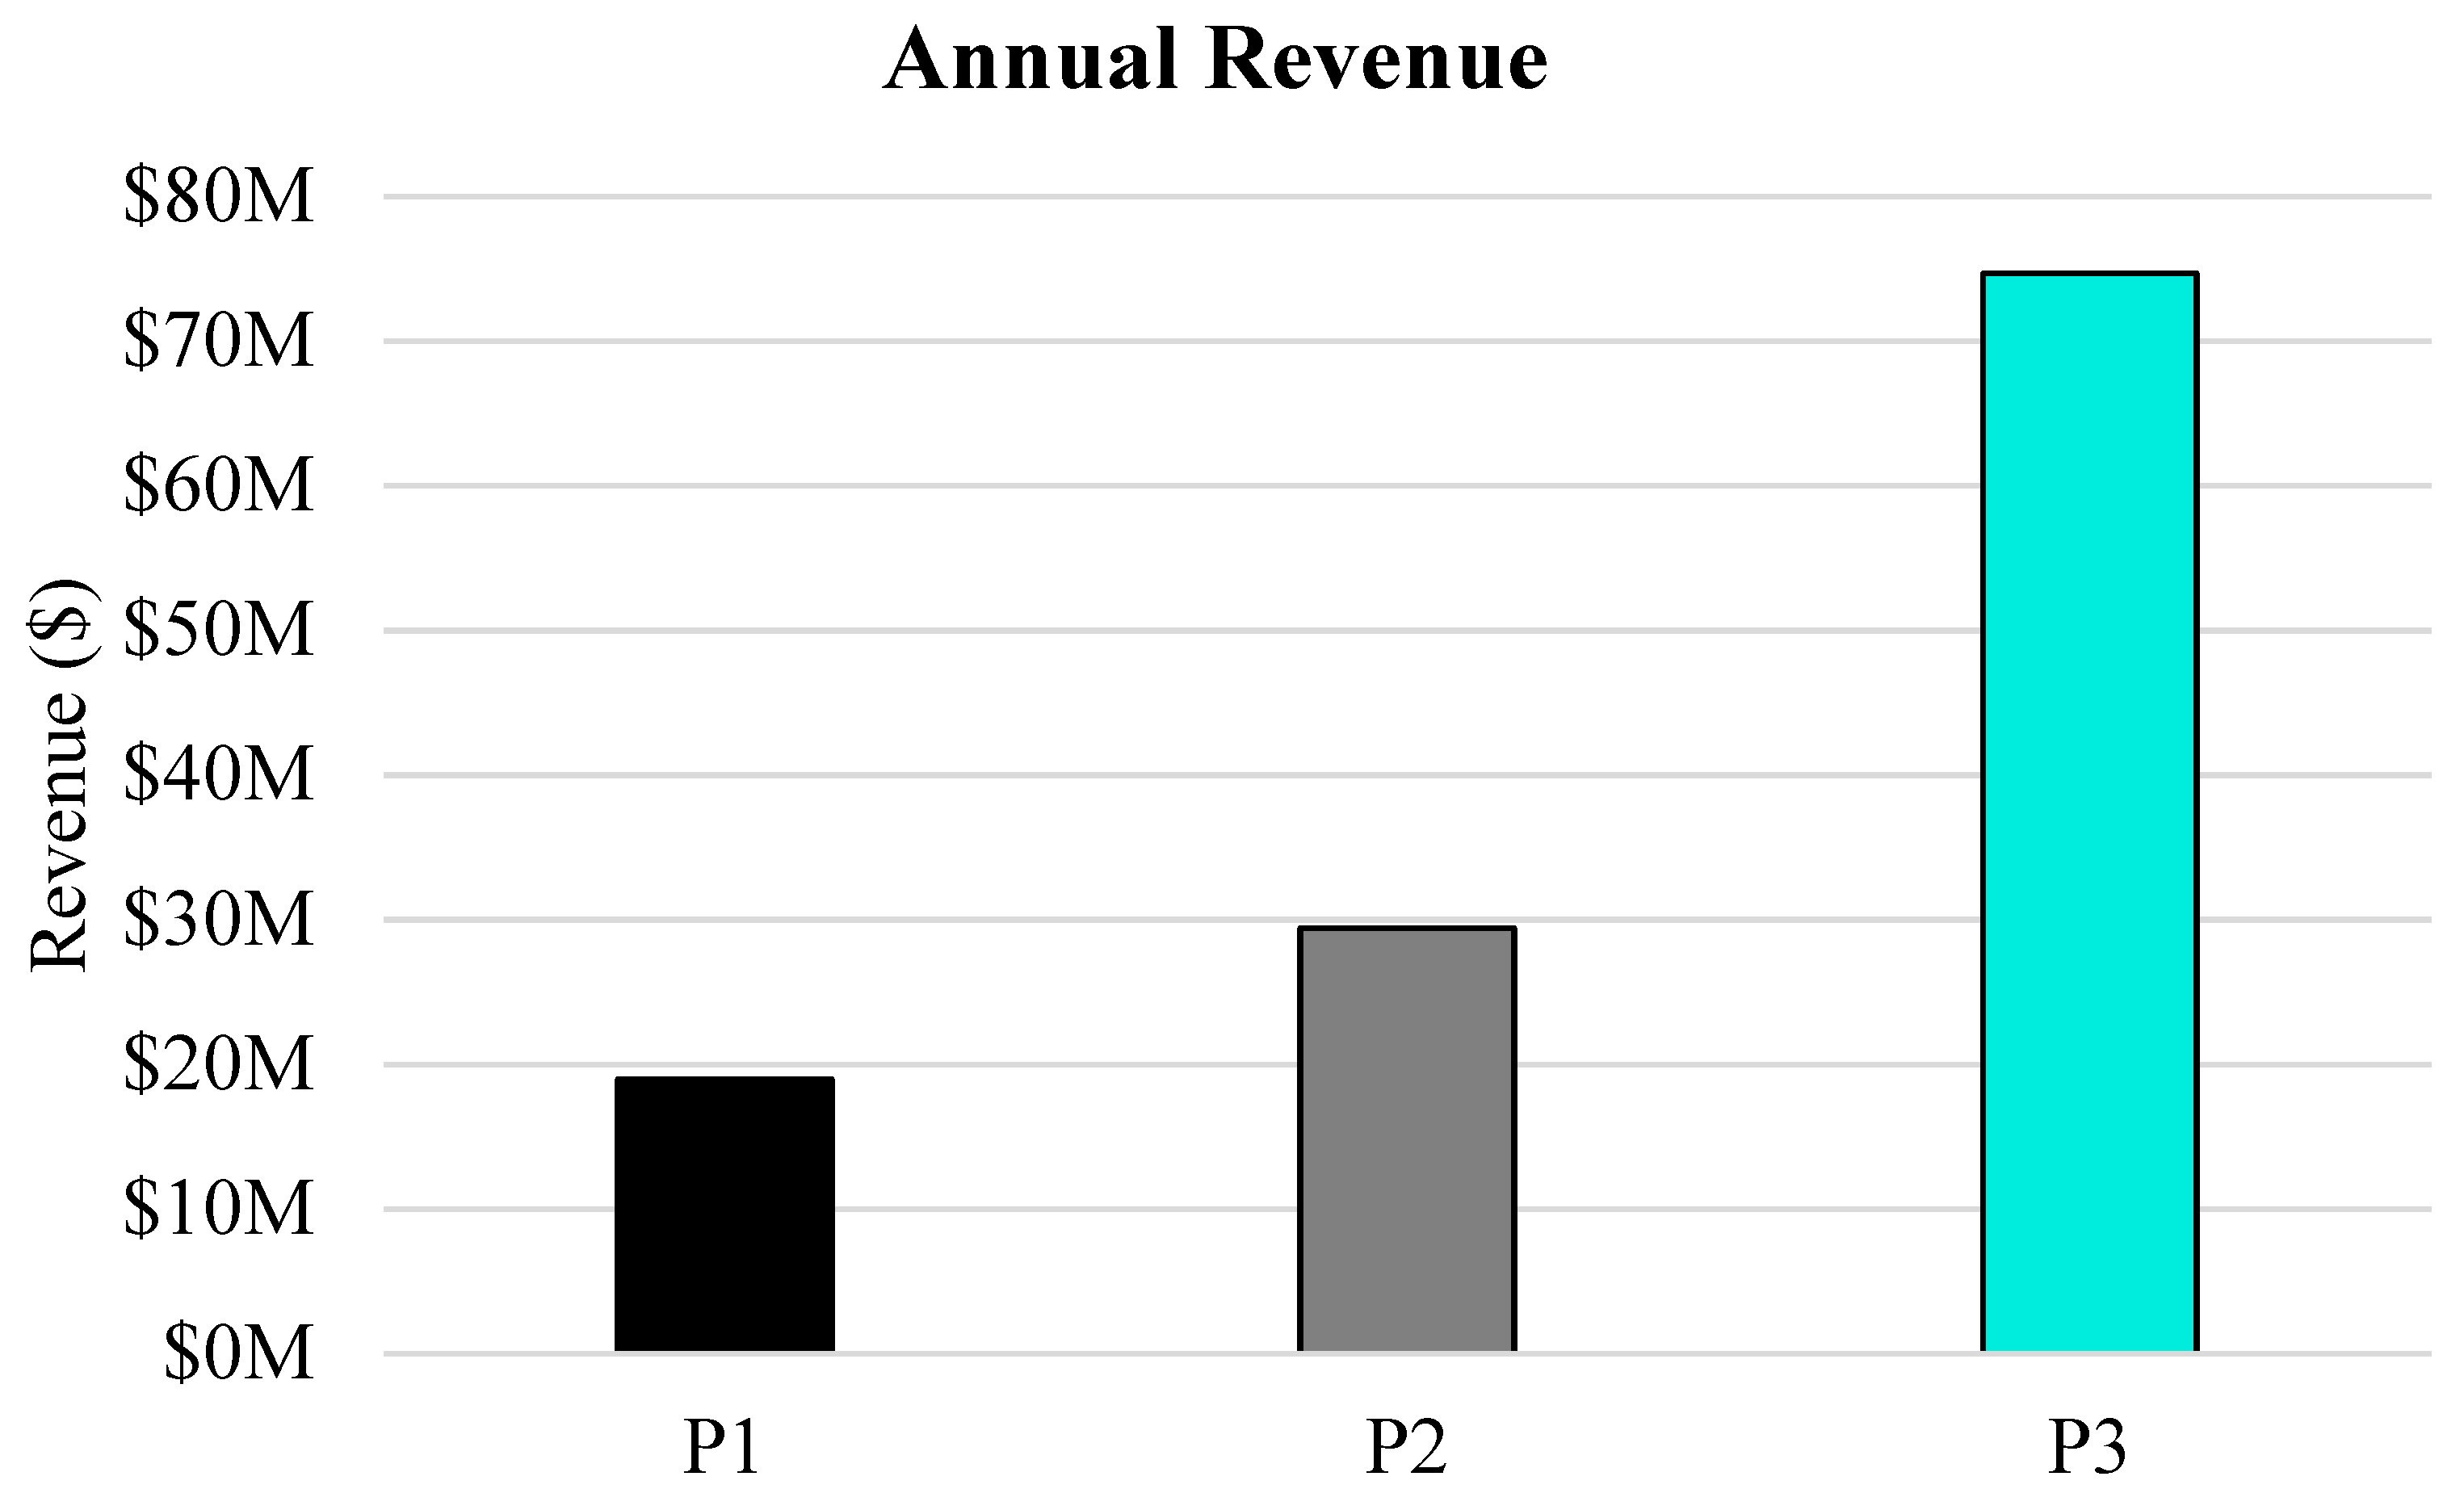
4.2. Revenue and Savings

Biosolid disposal savings and adhesive production are the variables required to calculate overall annual revenue and savings. For all plant operations examined in this study, the rate of biosolid production is equivalent to 56,300 pounds of wet DB produced per day. For calculating disposal savings costs, USD 70/t was selected as an appropriate average. Due to all three plant scenarios producing the same amount of wet DB, the savings from reuse instead of disposal are roughly USD 660K annually for all scales. Since the DB reused are implemented in the formulation for adhesive production, the amount produced is used for formulation scale-up, as seen in Table 1. The amount of adhesive produced per day results in the highest production of adhesive found in Plant Option P3, which is estimated to generate roughly 23,300 gallons daily, with Plant Option P2 producing 9900 gallons daily, and Plant Option P1 producing 6800 gallons daily. Figure 7 visualizes the annual production in tons of adhesive, where totals range from 12,000 t/year to 37,000 t/year at the allotted 8000 operation hours.
As for revenue, the production of adhesive per plant operation and its designated selling price directly dictate the plant revenue. The total cost of production for Plant Option P1 per pound of adhesive was found to be USD 0.14. In addition, Plant Options P2 and P3 cost of production per pound of adhesive are USD 0.16 and USD 0.19 respectively. The selling price of each adhesive was decided by a few factors which include the price of market competitors, the properties of each adhesive, and a target gross profit margin. Within the sector, other bio-based adhesives, such as soy, have prices of USD 1.20 to USD 4.00 per pound and higher. To stay market competitive, the goal would be to produce a bio-adhesive option for the wood industry at USD 1.00 per pound or less. This would provide the sector with a viable bio-adhesive for half the price of many competitors. The strength of each adhesive formulation is also a factor that was determined to affect the selling price since the strength of each formulation increases with the quantity of DSF. Because of this, the possible applications for Option P1 may not be as diverse as Options P2 or P3. For the sake of consistency between analyses, it was decided to select a gross margin for each plant in the range of 81–82%. The final selection for the selling price versus the cost of production can be seen in Figure 8. Options P1, P2, and P3 adhesives were set to sell for USD 0.75, USD 0.85, and USD 1.00, respectively.
With the savings from the disposal costs, in addition to the selling price for each adhesive selected, the annual revenue per plant process was calculated. As shown in Figure 9, Option P1 annual revenue and savings are USD 19.0M, Option P2 is USD 29.4M, and Option P3 is significantly higher at USD 74.7M. This drastic increase is caused by the production of adhesive in P3 being two to three times that of the adhesive production when compared to Options P1 and P2.

5. Techno-Economic Analysis

The analysis of each plant process utilized the methodology discussed in Methods and Development. Discussed are economic assessment properties such as net present value (NPV), discounted cash flow rate of return (DCFROR), internal rate of return (IRR), payback period (PBP), and sensitivity of economics [49]. The incoming and outgoing cash flows of Options P1, P2, and P3 are shown in Figure 10 as actual cash flows and net present values (NPV). The evaluation of the total net present values of the analyses is shown in Figure 11, where the NPV of Options P1, P2, and P3 is USD 107.9M, USD 178.7M, and USD 502.2M, respectively. The process plans for a loss in the construction phase for all three operations, where the investments and costs are factored as functions of the installed equipment cost. These costs slightly increase for each plant as the production of adhesive increases. However, the revenue expected for each system proposed validates that the processes in this study are expected to have positive cash flow for the life of the plant, contributing to a viable and marketable project for investment.
Evaluating each plant for the payback period generates the graph of data found in Figure 12. The plant payback period is seen to decrease as the plant scale increases. Option P1 was found to have a payback period of 3.81 years from the beginning of the revenue stream. The production of adhesive provides a revenue great enough to get a return on initial investment in less than four years, which is a great payback period. The processes, as they scale, receive a return on investment more rapidly, with Option P2 yielding a return in 2.17 years and Option P3 yielding a return in 1.43 years. There are many contributing factors to this, including the adhesive production rates, the selling price of each, and the difference in capital expenditures versus the estimated incoming revenue of each plant process. Although all costs are greater for Option P3, the process is expected to generate the highest production of adhesive, the highest proposed selling price, and the greatest estimated revenue, which all contribute to the less than two-year payback period from year zero or the start of plant life.
For further assessment of the validity of each project, a discounted cash flow rate of return analysis on each plant process was performed. This is a widely accepted method for validating the financial feasibility of the plan presented. Figure 13 shows the DCFROR where NPV is plotted against the internal rate of return (IRR) for the life of the project. Evaluations presented IRRs for Options P1, P2, and P3, where the net present value of the project reaches zero. As per the economic method, for this process, a hurdle rate for acceptance of each project was set at 15%. Options P1, P2, and P3, in turn, present an IRR of 24.0%, 29.0%, and 44.2%, respectively. These values exceed the “Go Threshold” rate of 15% set for the evaluation and are all attractive opportunities. For investment or decision-making, these projects provide reliability of return on investment and can generate significant compensation during each plant’s life.

5.1. Sensitivity Analysis

Introducing a sensitivity analysis enhances the thoroughness and credibility of the findings in this study. A sensitivity analysis was conducted for each plant scenario for the parameters most susceptible to uncertainty in the cost analysis. This allows for the examination of how fluctuations in key variables affect study outcomes [50]. This approach assists in understanding the potential range of outcomes and associated confidence in the project. The selection of process variables to adjust in this sensitivity analysis was biosolid production, raw material market cost, and adhesive sale price.
This study was conducted assuming that biosolid productivity would remain, on average, the same for the plant’s life. However, this is not only impractical, but there could be positive or negative production dependent on many factors (e.g., population variations, industrial activity, wastewater compositions, etc.). For this sensitivity analysis, the techno-economic assessment was conducted at the base case, 56,300 wet pounds per day, at −60%, 22,500 wet pounds per day, and at +60%, 90,000 wet pounds per day, biosolid production averages. The raw material acquisition was varied per adhesive formulation, as were the utility costs and required equipment. Due to this, installed equipment costs increased or decreased with plant production. Each plant followed similar trends and can be found in Figure 14. Options P1, P2, and P3 saw changes in NPV at deviations from the base case of +/−USD 88.0 M, USD 132.1M, and USD 325.6M, with these changes providing a +/−11.2%, 10.5%, and 9.1% variation in IRRs, respectively. The lowest profitability was found with −60% for Option P1, where the IRR fell below the 15% hurdle rate at 9.2%. The parameters set for sensitivity correlate to extremely low biosolid and adhesive production rates. Thus, the cost of equipment and installation, though reduced, pushes the Option P1 outside of the ability to incite potential investment. Options P2 and P3 for this analysis are able to withstand this severe reduction in production, with results staying above the 15% hurdle rate set by the evaluation. With increased production, all three plant options increase cash flow and IRR, even with increased cost of operation and installed equipment costs. Conclusively, it is believed that even with rather large variations in biosolid productivity, Options P2 and P3 are robust and viable commercially.
The economic assessment also assumed that raw material cost per pound would remain constant throughout the life of the plant. This is also unrealistic due to the normal inflation of market prices annually. Since these variations can be expected, all three plants were examined at varying increases to all raw material acquisition costs with +50%, +100%, +150%, and +200% to the assumed market cost. Inflation was still not taken into account with these changes occurring over time, but as a total increase in raw material cost over the whole plant life. All three plants’ resulting IRRs remained above the required 15% for evaluation, and these large increases in costs varied the NPVs or IRRs with decreasing linear trends, as found in Figure 15. The plant most affected by changes in raw material cost is Option P3, with a decrease in NPV and IRR from 502.2M and 44.2% to 225.9M and 27.0%. This is due to the adhesive formulation heavily relying on higher amounts of DSF and hydroxide in addition to the quantity of IBC totes necessary for packaging. Options P1 and P2 were more minimally affected, even as the raw material costs for the plants more than doubled. This study shows that there is high confidence in profitability for all plant options with large changes in adhesive production and cost of production per pound.
Due to the chosen selling price of adhesives directly affecting the revenue gained from each plant operation, a sensitivity analysis was conducted to provide insight into the minimum required selling price. Analysis of selling price required to obtain IRRs of 0%, 15%, 30%, 60%, and 90% for Options P1, P2, and P3, respectively, can be found in Figure 16. To meet the hurdle rate of 15%, proving economic viability, Option P1 necessitates a minimum selling price (MSP) of USD 0.51 per pound, which would be a 266% mark-up from its cost of production. Option P2 was observed to need a 211% markup from its cost of production, resulting in an MSP of USD 0.50 per pound of adhesive. Option P3, which has the most robust outlook, requires an MSP of USD 0.42 per pound of adhesive, a 123% increase from its production cost. Option P3 is the most advantageous due to the highest shear strength, NPV, IRR, and production quantity. The competitor market price range applied to Option P3 provided an IRR of 51.0% at the lowest pricing, USD 1.20 per pound, and an IRR of 106.3% at the high pricing, USD 4.00 per pound. The sensitivity analysis results offer high confidence for this exciting investment opportunity.

5.2. Discussion

The examination of process installation, equipment requirements, labor force, and energy use, shown in Table 3 and Figure 6, shows minimal effect on the overall cost of production in this analysis. The largest contribution to the fluctuations in overhead is mainly raw material costs. Access to distributor pricing is expected to lower the estimated cost of this technology in real-world integration. With this in mind, Figure 15 visualizes the sensitivity of raw material cost estimations selected for each plant option, and all processes were found to withstand large variations (i.e., +200% to all raw material costs). The process proposed is stable with minimal fluctuations in IRR for all plant options.
Of the plant options selected for analysis, Plant Option P3 exhibits the best adhesive production rate and highest capital gain with an IRR of 44.2% and an NPV of roughly USD 502.2M as found in Figure 11 and Figure 13. This adhesive option has the highest strength capability of the adhesives tested at an average of 450 psi, shown in Figure 4, and contends well with other bio-based wood adhesives on the market for light-load, low-humidity applications.
Wood bio-adhesives, the majority soy-based, range in MSP and cost of production due to the same variables (i.e., raw material acquisition costs, energy costs, and labor). Soy-based adhesives, on average, exhibit cost of production at USD 0.60 to USD 1.40 per pound, though the MSP is normally in the range of USD 1.20 to USD 4.00 per pound [51,52,53,54]. For this analysis, the selling price for each adhesive, shown in Figure 8, was set between USD 0.75 and USD 1.00 per pound, falling well below competitor market prices. Figure 16 continues this assessment, providing MSPs for all biosolid-based adhesives examined in this analysis to be between USD 0.42 and USD 0.51 per pound. This comparison to competitors within the market of reducing the MSP leads to evidence that the adhesive operations proposed in this paper can not only compete in the wood adhesive sector with other bio-based adhesives but can also reach high profitability with low market prices.
This techno-economic analysis can be developed further by applying different formulations and potential additives to produce adhesives with various properties for specific applications, thereby supplying a range of valorized products from sewage sludges and other novel protein sources [27]. Also, generating all adhesives mentioned in this study in one operation to expand the market accessibility, and potentially adding supplementary processes and equipment to produce composite materials such as fiberboard or particleboard as the main product of the plant operation, could be interesting to study. Due to the many products that can be generated by WWTPs, there are also federal and state incentives and tax breaks available to the wastewater treatment industry for the improvement of process technologies and equipment [55]. Note that it has been shown in case studies that wastewater treatment plants can self-sustain the energy required for their operation in excess through the production of biofuels and bioenergy [56,57,58]. This, in turn, would provide a negation in the required energy costs for this process, as well as another bio-product that could be recovered and marketed. However, the energy production capabilities, other bio-products, and all other government incentives not listed in the assumptions were not considered for this analysis. If included in future assessments, these options may provide an even greater improvement in economic feasibility. All future studies and analyses can lead to an increase in interest, marketability, and process readiness for the technology itself and prospective consumers.
Some of the largest hurdles in the future integration of biorefinery processes are the continuation of research and development efforts to obtain higher degrees of technical readiness, marketing, and public approval [59]. The current majority of biorefinery studies and development look at the recovery of biofuels from wastewater treatment. This has brought the sector to a certain technical readiness level (TRL). The levels are positioned to describe technologies that are at certain stages of development, where TRL1–TRL3 are mainly still in research and development, TRL4–TRL6 have some small-scale operations and validity of operation, and TRL7–TRL9 are ready for larger-scale commercial applications. The implementation of biorefineries in wastewater is presently categorized as TRL3-TRL5 [60]. In addition, bio-based wood adhesives are still classified as a technology in its formative stage [53]. There are commercial soy-based adhesives on the market, but there are still concerns related to underperforming properties as compared to petroleum-based adhesives, and further development is required on the technology for increased market saturation and applications. Factors that affect the viability of the green wood adhesive proposed in this study include having a consumer readily available and interested in purchasing the adhesive, as well as societal backing. Due to the properties of bio-based wood adhesives, which exclude petroleum products, the shelf-life of the adhesives are much more limited than conventional wood adhesives [61]. Thus, a thorough investigation into supply chain logistics will be a requirement before market implementation. The opinion of reusing bio-waste for valorized products is normally negative and slows the implementation of these beneficial processes tremendously. As many would disregard waste, especially municipal waste, as a potential for valorization, commercial barriers will be difficult to overcome. Calling for open communication and inclusivity of multiple sectors can increase public opinion and readiness. Marketing and educational efforts for the wood industry and the general public will be necessary to reach saturation in the sector. In addition, passing quality metrics by meeting industry standards for composite materials and receiving certifications, like ANSI A208.2 published by the Composite Panel Association, would benefit commercialization [62,63]. DBs that have been treated and then generated into adhesives pose little to no harm to human or environmental health due to the inactivation of pathogenic activity [64,65]. However, more studies must be conducted on biosolid composition (i.e., minerals, biological hazards), use over time, optimization of formulation, biodegradability, life cycle analyses (LCAs), and risk assessments [16,17,18,19,66,67]. Finally, as this team of researchers is actively researching further optimization and long-term performance of the sewage sludge-based adhesive, more information generated could impact the TEA. Hence, the TEA presented in this paper should be viewed as a first-cut or preliminary assessment. However, the results do provide strong encouragement to proceed with further development and initiate some market assessments.

6. Conclusions

The design and integration of biorefinery processes in industrial and municipal works is a truly revolutionary step towards a sustainable future. Water treatment and waste management are two of the largest issues facing societies today. Thus, a solution that involves utilizing components normally deemed as waste in a product that can bring high economic and ecological vitality to water treatment operations is a reformative innovation. A techno-economic analysis was conducted in this paper for the evaluation of process economic viability of an urban biorefinery process in a wastewater treatment plant for the production of waste-derived bio-adhesives. Three plant operations were explored to manufacture DB adhesives for formulations with and without soy protein blending. The adhesives proposed for formulation yielded a production cost of USD 0.14 to USD 0.19 per pound, and, with an applied 81–82% gross margin target, provided an estimated sell price of USD 0.75 to USD 1.00 per pound to industrial wood product manufacturers. This is extremely competitive when compared to other wood bio-adhesives on the market. It was found that all plant variations were economically feasible, with the net present value of the projects ranging from USD 107.9 M to USD 502.2 M, with annual revenues of USD 19.0 M to USD 74.7 M. The highest compensating option was found to be Option P3, with the peak adhesive production rate of 23,300 gallons produced daily. Option P3 exhibited the highest costs associated with the project; though the revenues severely negated this expenditure, it had the lowest payback period of 1.43 years, and a DCFROR analysis provided an IRR of 44.2%. The adhesive produced from Option P3 has the highest mechanical strength, averaging 450 psi, making it a practical formulation for applications in the wood adhesive market. Due to the adhesive’s properties, Options P1 and P2 would be selected in fewer practical applications than Option P3, though they still generate a feasible alternative for lower-strength applications on the market. Sensitivity analysis on daily biosolid production averages, raw material costs, and selling price per pound confirms a high confidence and robustness in profitable economics that can withstand large variations for all plants modelled with the exception of P1 at large reductions (i.e., −60%) in biosolid production. Continued research on increasing mechanical properties, case studies, life cycle/health/risk assessments, community/industry involvement, and education efforts can assist in bringing WWTP biorefineries for adhesive production into technical readiness for launch on a commercial scale.

Author Contributions

Conceptualization, B.F., W.M.C., W.E.H. and M.E.Z.; Methodology, B.F., W.M.C., R.H., D.L.B.F., E.R., D.G., J.B.H., W.E.H. and M.E.Z.; Validation, W.M.C., R.H., D.L.B.F., E.R., J.B.H., W.E.H. and M.E.Z.; Formal analysis, B.F. and M.E.Z.; Investigation, B.F., W.M.C. and M.E.Z.; Resources, M.E.Z.; Data curation, B.F.; Writing—original draft, B.F.; Writing—review & editing, W.M.C., R.H., D.L.B.F., E.R., D.G., J.B.H., W.E.H. and M.E.Z.; Visualization, B.F.; Supervision, M.E.Z.; Project administration, M.E.Z.; Funding acquisition, M.E.Z. All authors have read and agreed to the published version of the manuscript.

Funding

This analysis was made possible via funding through the Louisiana Board of Regents ITRS program, the University of Louisiana’s Energy Institute of Louisiana, ETEX Fiber Supply, and the Tunica-Biloxi Tribe of Louisiana. Special thanks are extended to Lafayette Utilities Systems, Rugallo, LLC, and Fenstermaker and Associates for their technical insights.

Institutional Review Board Statement

Not applicable.

Informed Consent Statement

Not applicable.

Data Availability Statement

Data are contained within the article.

Conflicts of Interest

The authors declare no conflict of interest.

References

  1. Brown, T.C.; Mahat, V.; Ramirez, J.A. Adaptation to Future Water Shortages in the United States Caused by Population Growth and Climate Change. Earth’s Future 2019, 7, 219–234. [Google Scholar] [CrossRef]
  2. Health Affairs. Water Insecurity and Population Health: Implications for Health Equity and Policy. Available online: https://www.healthaffairs.org/do/10.1377/hpb20230921.68748/ (accessed on 3 May 2024).
  3. Maddocks, A.; Young, R.S.; Reig, P. Ranking the World’s Most Water-Stressed Countries in 2040. 2015. Available online: https://www.wri.org/insights/ranking-worlds-most-water-stressed-countries-2040 (accessed on 2 March 2024).
  4. Kuzma, S.; Saccoccia, L.; Chertock, M.; World Resources Institute. 25 Countries, Housing One-quarter of the Population, Face Extremely High Water Stress, 16 August 2023. Available online: https://www.wri.org/insights/highest-water-stressed-countries (accessed on 2 March 2024).
  5. USEPA. Sources and Solutions: Wastewater. Available online: https://www.epa.gov/nutrientpollution/sources-and-solutions-wastewater (accessed on 5 May 2024).
  6. Bimaks. The Importance of Wastewater Treatment–Water Treatment Manufacturer. Available online: https://www.bimakskimya.com.tr/en/the-role-of-wastewater-treatment-in-environmental-sustainability/ (accessed on 4 May 2024).
  7. PT Water and Environment. Why Do We Need to Treat Wastewater? Available online: https://www.premiertechaqua.com/en-us/wastewater/why-do-we-need-treat-wastewater (accessed on 4 May 2024).
  8. Das, S.; Lee, S.H.; Kumar, P.; Kim, K.H.; Lee, S.S.; Bhattacharya, S.S. Solid Waste Management: Scope and the Challenge of Sustainability. J. Clean. Prod. 2019, 228, 658–678. [Google Scholar] [CrossRef]
  9. Wilson, D.C. Learning from the Past to Plan for the Future: An Historical Review of the Evolution of Waste and Resource Management 1970–2020 and Reflections on Priorities 2020–2030–The Perspective of an Involved Witness. Waste Manag. Res. 2023, 41, 1754–1813. [Google Scholar] [CrossRef] [PubMed]
  10. NEBRA. National Biosolid Survey. 2018. Available online: https://www.biosolidsdata.org/ (accessed on 21 October 2023).
  11. Jason Ren, Z.; Schnoor, J.L.; Pagilla, K.R. Toward a Net Zero Circular Water Economy. In Pathways to Water Sector Decarbonization, Carbon Capture and Utilization; IWA Publishing: London, UK, 2022; pp. 1–13. [Google Scholar] [CrossRef]
  12. USEPA. Basic Information About Biosolids. Available online: https://www.epa.gov/biosolids/basic-information-about-biosolids (accessed on 21 October 2023).
  13. Collivignarelli, M.C.; Canato, M.; Abbà, A.; Carnevale Miino, M. Biosolids: What Are the Different Types of Reuse? J. Clean. Prod. 2019, 238, 117844. [Google Scholar] [CrossRef]
  14. US Department of Health and Human Services. Workers Exposed to Class B Biosolids During and After Field Application. Appl. Occup. Environ. Hyg. 2001, 16, 105–107. [Google Scholar] [CrossRef] [PubMed]
  15. Transforming Sewage Sludge into Renewable Resources: How United Earth Energy’s Uni-Box Mobile Pyrolysis System Benefits Water-Processing Plants. Available online: https://unitedearth.energy/transforming-sewage-sludge-into-renewable-resources-how-united-earth-energys-uni-box-mobile-pyrolysis-system-benefits-water-processing-plants/ (accessed on 11 May 2025).
  16. PFAS in Biosolids: A Review of State Efforts & Opportunities for Action–The Environmental Council of the States (ECOS). Available online: https://www.ecos.org/documents/pfas-in-biosolids-a-review-of-state-efforts-opportunities-for-action/ (accessed on 7 July 2025).
  17. USEPA. Sewage Sludge Laws and Regulations. Available online: https://www.epa.gov/biosolids/sewage-sludge-laws-and-regulations (accessed on 25 October 2023).
  18. Radford, F.; Horton, A.; Hudson, M.; Shaw, P.; Williams, I. Agricultural Soils and Microplastics: Are Biosolids the Problem? Front. Soil. Sci. 2022, 2, 941837. [Google Scholar] [CrossRef]
  19. Kinney, C.A.; Vanden Heuvel, B. Translocation of Pharmaceuticals and Personal Care Products after Land Application of Biosolids. Curr. Opin. Env. Sci. Health 2020, 14, 23–30. [Google Scholar] [CrossRef]
  20. CDM Smith; NACWA; NEBRA; Water Environment Federation. Cost Analysis of the Impacts on Municipal Utilities and Biosolids Management to Address PFAS Contamination; CDM Smith: Boston, MA, USA, 2020. [Google Scholar]
  21. Kathi, S.; Singh, S.; Yadav, R.; Singh, A.N.; Mahmoud, A.E.D. Wastewater and Sludge Valorisation: A Novel Approach for Treatment and Resource Recovery to Achieve Circular Economy Concept. Front. Chem. Eng. 2023, 5, 1129783. [Google Scholar] [CrossRef]
  22. Yadav, A.; Rene, E.R.; Sharma, M.; Jatain, I.; Mandal, M.K.; Dubey, K.K. Valorization of Wastewater to Recover Value-Added Products: A Comprehensive Insight and Perspective on Different Technologies. Env. Res. 2022, 214, 113957. [Google Scholar] [CrossRef] [PubMed]
  23. Peeters, B.; Dewil, R.; Smets, I. Water Treatment Challenges of Drying Sticky Wastewater. Chem. Eng. Essent. CPI Prof. 2014, 120, 9–14. [Google Scholar]
  24. Zeringue, C.T.; Chirdon, W.M.; Sharp, W.; Gang, D.; Khattab, A.; Hernandez, R.; Revellame, E.; Holmes, W.E.; Zappi, M.E. Production of Green Adhesives from Sustainable Proteins Derived from Urban Based Sewage Sludges. Ph.D. Thesis, University of Louisiana at Lafayette, Lafayette, LA, USA, 2023. [Google Scholar]
  25. United Nations Department of Economic and Social Affairs. World Population Prospects: 2022 Summary of Results; United Nations: New York, NY, USA, 2022. [Google Scholar]
  26. Raydan, N.D.V.; Leroyer, L.; Charrier, B.; Robles, E. Recent Advances on the Development of Protein-Based Adhesives for Wood Composite Materials—A Review. Molecules 2021, 26, 7617. [Google Scholar] [CrossRef] [PubMed]
  27. Zeringue, C.T.; Chirdon, W.M.; Sharp, W.; Gang, D.; Khattab, A.; Hernandez, R.; Revellame, E.; Holmes, W.; Zappi, M.E. Production of Sustainable Green Adhesives from Proteinaceous Biomass with an Emphasis on Waste-Derived Protein Residuals: A Review. Ind. Eng. Chem. Res. 2023, 62, 12716–12731. [Google Scholar] [CrossRef]
  28. Conner, A.H. Wood: Adhesives. In Encyclopedia of Materials: Science and Technology; Elsevier: Amsterdam, The Netherlands, 2001; pp. 9583–9599. [Google Scholar] [CrossRef]
  29. Ülker, O. Wood Adhesives and Bonding Theory. In Adhesives–Applications and Properties; InTech: London, UK, 2016. [Google Scholar] [CrossRef]
  30. Frihart, C.R.; Lorenz, L. Protein Structures Dictate Their Adhesive Performance. Wood Mater. Sci. Eng. 2025, 1–10. [Google Scholar] [CrossRef]
  31. Jayachandran, B.; Parvin, T.N.; Alam, M.M.; Chanda, K.; MM, B. Insights on Chemical Crosslinking Strategies for Proteins. Molecules 2022, 27, 8124. [Google Scholar] [CrossRef] [PubMed]
  32. Dinte, E.; Sylvester, B. Adhesives: Applications and Recent Advances. In Applied Adhesive Bonding in Science and Technology; InTech: London, UK, 2018. [Google Scholar] [CrossRef]
  33. Frihart, C.R. Wood Adhesion and Adhesives. In Handbook of Wood Chemistry and Wood Composites; CRC Press: Boca Raton, FL, USA, 2012; pp. 255–320. [Google Scholar] [CrossRef]
  34. Pizzi, A.; Mittal, K.L. (Eds.) Handbook of Adhesive Technology, Revised and Expanded, 2nd ed.; CRC Press: Boca Raton, FL, USA, 2003. [Google Scholar] [CrossRef]
  35. Chrobak, J.; Iłowska, J.; Chrobok, A. Formaldehyde-Free Resins for the Wood-Based Panel Industry: Alternatives to Formaldehyde and Novel Hardeners. Molecules 2022, 27, 4862. [Google Scholar] [CrossRef] [PubMed]
  36. Ghahri, S.; Yang, L.; Du, G.; Park, B.D. Transition from Formaldehyde-Based Wood Adhesives to Bio-Based Alternatives. BioResources 2025, 20, 2476–2479. [Google Scholar] [CrossRef]
  37. GVR. Wood Adhesives Market Size, Share & Trends Analysis Report by Product (Urea-Formaldehyde, Soy-Based), By Application (Flooring, Furniture), By Substrate, By Region, And Segment Forecasts, 2023–2030. Available online: https://www.grandviewresearch.com/industry-analysis/wood-adhesives-market (accessed on 4 May 2024).
  38. Hunt, C.G.; Dunky, M. Analysis of Future Prospects and Opportunities for Wood Adhesives: A Review. For. Prod. J. 2023, 72, 14–22. [Google Scholar] [CrossRef]
  39. Klein, B.; Davis, R. Algal Biomass Production via Open Pond Algae Farm Cultivation: 2022 State of Technology and Future Research; National Renewable Energy Laboratory: Golden, CO, USA, 2023. [Google Scholar]
  40. USDA. 2019-2020 USDA Food Price List; Washington State Department of Agriculture: Olympia, WA, USA, 2019. Available online: https://agr.wa.gov/getmedia/88869f61-e205-46bc-91ca-b626eaaffe67/2019-2020usdafoodpricelist (accessed on 28 November 2023).
  41. Commodity Prices—Price Charts, Data, and News—IndexMundi. Available online: https://www.indexmundi.com/commodities/#google_vignette (accessed on 9 May 2024).
  42. Tchobanoglous, G.; Burton, F.L. Wastewater Engineering: Treatment Disposal Reuse, 3rd ed.; Metcalf and Eddy, Inc.: New York, NY, USA, 1991; Volume 1. [Google Scholar]
  43. Benefield, L.A. Wastewater Quality/Strength/and Content. Available online: https://citeseerx.ist.psu.edu/document?repid=rep1&type=pdf&doi=efa81072c6502d8fef916622cca63f04cc699a56 (accessed on 9 May 2024).
  44. Pellegrini, M.; Saccani, C.; Bianchini, A.; Bonfiglioli, L. Sewage Sludge Management in Europe: A Critical Analysis of Data Quality. Int. J. Env. Waste Manag. 2016, 18, 226. [Google Scholar] [CrossRef]
  45. United States Pharmacopeia. Good Storage and Shipping Practices; United States Pharmacopeia: Rockville, MD, USA, 2005. [Google Scholar]
  46. Ullah, H.I.; Dickson, R.; Mancini, E.; Malanca, A.A.; Pinelo, M.; Mansouri, S.S. An Integrated Sustainable Biorefinery Concept towards Achieving Zero-Waste Production. J. Clean. Prod. 2022, 336, 130317. [Google Scholar] [CrossRef]
  47. Prindle, J.C. Detailed Process Design Using ASPEN Plus; Department of Chemical Engineering, University of Louisiana at Lafayette: Lafayette, LA, USA, in press.
  48. Douglas, J. Conceptual Design of Processes; McGraw Hill: New York, NY, USA, 1988; pp. 1–589. [Google Scholar]
  49. Reniers, G.; Talarico, L.; Paltrinieri, N. Cost-Benefit Analysis of Safety Measures. In Dynamic Risk Analysis in the Chemical and Petroleum Industry: Evolution and Interaction with Parallel Disciplines in the Perspective of Industrial Application; Elsevier: Amsterdam, The Netherlands, 2016; pp. 195–205. [Google Scholar] [CrossRef]
  50. Saltelli, A.; Ratto, M.; Tarantola, S.; Campolongo, F. Sensitivity Analysis Practices: Strategies for Model-Based Inference. Reliab. Eng. Syst. Saf. 2006, 91, 1109–1125. [Google Scholar] [CrossRef]
  51. Yang, M.; Rosentrater, K.A. Life Cycle Assessment and Techno-Economic Analysis of Pressure Sensitive Bio-Adhesive Production. Energies 2019, 12, 4502. [Google Scholar] [CrossRef]
  52. Yang, M.; Rosentrater, K.A. Techno-Economic Analysis of the Production Process of Structural Bio-Adhesive Derived from Glycerol. J. Clean. Prod. 2019, 228, 388–398. [Google Scholar] [CrossRef]
  53. Mousavi-Avval, S.H.; Sahoo, K.; Nepal, P.; Runge, T.; Bergman, R. Environmental Impacts and Techno-Economic Assessments of Biobased Products: A Review. Renew. Sustain. Energy Rev. 2023, 180, 113302. [Google Scholar] [CrossRef]
  54. Chen, H.; Wu, Q.; Ren, X.; Zhu, X.; Fan, D. A Fully Bio-Based Adhesive with High Bonding Strength, Low Environmental Impact, and Competitive Economic Performance. Chem. Eng. J. 2024, 494, 153198. [Google Scholar] [CrossRef]
  55. USEPA. EPA State Revolving Funds and Grants Available to Water and Wastewater Utilities. Available online: https://www.epa.gov/fedfunds/epa-state-revolving-funds-and-grants-available-water-and-wastewater-utilities (accessed on 4 December 2023).
  56. Gu, Y.; Li, Y.; Li, X.; Luo, P.; Wang, H.; Wang, X.; Wu, J.; Li, F. Energy Self-Sufficient Wastewater Treatment Plants: Feasibilities and Challenges. Energy Procedia 2017, 105, 3741–3751. [Google Scholar] [CrossRef]
  57. Xin, C.; Addy, M.M.; Zhao, J.; Cheng, Y.; Ma, Y.; Liu, S.; Mu, D.; Liu, Y.; Chen, P.; Ruan, R. Waste-to-Biofuel Integrated System and Its Comprehensive Techno-Economic Assessment in Wastewater Treatment Plants. Bioresour. Technol. 2018, 250, 523–531. [Google Scholar] [CrossRef] [PubMed]
  58. Buller, L.S.; Sganzerla, W.G.; Berni, M.D.; Brignoli, S.C.; Forster-Carneiro, T. Design and Techno-Economic Analysis of a Hybrid System for Energy Supply in a Wastewater Treatment Plant: A Decentralized Energy Strategy. J. Environ. Manag. 2022, 305, 114389. [Google Scholar] [CrossRef] [PubMed]
  59. Makepa, D.C.; Chihobo, C.H. Barriers to Commercial Deployment of Biorefineries: A Multi-Faceted Review of Obstacles across the Innovation Chain. Heliyon 2024, 10, e32649. [Google Scholar] [CrossRef] [PubMed]
  60. Okolie, J.A.; Epelle, E.I.; Tabat, M.E.; Orivri, U.; Amenaghawon, A.N.; Okoye, P.U.; Gunes, B. Waste Biomass Valorization for the Production of Biofuels and Value-Added Products: A Comprehensive Review of Thermochemical, Biological and Integrated Processes. Process Saf. Environ. Prot. 2022, 159, 323–344. [Google Scholar] [CrossRef]
  61. Lei, H.; Zhou, X.; Pizzi, A.; Du, G.; Xi, X. Recent Developments in Bioadhesives and Binders. J. Renew. Mater. 2025, 13, 199–249. [Google Scholar] [CrossRef]
  62. Composite Panel Association. CPA Standards. Available online: https://www.compositepanel.org/resources/standards/ (accessed on 10 July 2025).
  63. Composite Panel Association. Eco-Certified Composites. Available online: https://www.compositepanel.org/sustainability/ecc/ (accessed on 10 July 2025).
  64. Al-Gheethi, A.A.; Efaq, A.N.; Bala, J.D.; Norli, I.; Abdel-Monem, M.O.; Ab Kadir, M.O. Removal of Pathogenic Bacteria from Sewage-Treated Effluent and Biosolids for Agricultural Purposes. Appl. Water Sci. 2018, 8, 74. [Google Scholar] [CrossRef]
  65. USEPA. Fact Sheet: Alkaline Stabilization of Biosolids. Available online: https://www.epa.gov/biosolids/fact-sheet-alkaline-stabilization-biosolids (accessed on 8 July 2025).
  66. Braine, M.F.; Kearnes, M.; Khan, S.J. Quality and Risk Management Frameworks for Biosolids: An Assessment of Current International Practice. Sci. Total Environ. 2024, 915, 169953. [Google Scholar] [CrossRef] [PubMed]
  67. Xue, J.; Verstraete, W.; Ni, B.J.; Giesy, J.P.; Kaur, G.; Jiang, D.; McBean, E.; Li, Z.; Shin, H.M.; Xiao, F.; et al. Rethink Biosolids: Risks and Opportunities in the Circular Economy. Chem. Eng. J. 2025, 510, 161749. [Google Scholar] [CrossRef]
Figure 1. Wastewater treatment plant process diagram [13].
Sustainability 17 06679 g001
Figure 2. Pathway of waste feedstock to bio-based adhesive [27].
Sustainability 17 06679 g002
Figure 3. Bio-based wood adhesive annual publications; data collated from WoS (1993–2023).
Sustainability 17 06679 g003
Figure 4. Shear strength of DB wood adhesives with co-feedstock DSF.
Sustainability 17 06679 g004
Figure 5. Process design diagram for biosolid adhesive production.
Sustainability 17 06679 g005
Figure 6. Annual cost contributors per plant option.
Sustainability 17 06679 g006
Figure 7. Daily adhesive production per plant option.
Sustainability 17 06679 g007
Figure 8. Gross margin and selling price versus cost of production per plant option.
Sustainability 17 06679 g008
Figure 9. Annual revenue per plant option.
Sustainability 17 06679 g009
Figure 10. Actual cash flow versus net present value per plant option.
Sustainability 17 06679 g010
Figure 11. Net present value per plant option.
Sustainability 17 06679 g011
Figure 12. Payback period on investment.
Sustainability 17 06679 g012
Figure 13. Discounted cash flow rate of return.
Sustainability 17 06679 g013
Figure 14. Sensitivity of economics on varied biosolid production.
Sustainability 17 06679 g014
Figure 15. Sensitivity of economics on increasing raw material cost.
Sustainability 17 06679 g015
Figure 16. Sensitivity of economics on variations in adhesive sell price.
Sustainability 17 06679 g016
Table 1. Potential protein co-feedstocks and market pricing.
Protein FeedstocksUSD/t
Algae [39]USD 681.00
Corn Meal [40]USD 404.57
Defatted Soy Flour [40]USD 692.38
Fish Meal [41]USD 1652.45
Soy Flour [40]USD 463.09
Whey [40,41]USD 788.00
Table 2. Summarization of equations utilized in economic analysis [47,48].
ValueEquation
Total Investment= Fixed Capital + Working Capital + Start-up Costs
= 2.36 (Installed Equipment Costs)
Total Production Cost= Manufacturing Costs + General Expenses
= 1.03 (Raw Materials + Utilities Costs) + 5.75E5 (NOL) + 0.187 (Installed Equipment Costs) + 0.026 (Revenue)
Number of Operators (NOL)= (6.29 + 0.23Nnp)0.5
Profit Before Tax= Revenue − Total Production Costs
= 0.974(Revenue) − 1.03 (Raw Materials + Utilities Costs) + 5.75E5 (NOL) + 0.187 (Installed Equipment Costs)
Depreciation= 0.181 (Installed Equipment Costs)
Profit After Taxes= (1 − 0.4) (Profit Before Taxes − Depreciation)
= 0.584 (Revenue) − [(0.618) (Raw Materials + Utilities Costs) + 0.221 (Installed Equipment Costs) + USD 3.451E5 (NOL)]
Cash Flow= Profit After Taxes + Depreciation
= 0.584 (Revenue) − 0.618 (Raw Materials + Utilities Costs) − 0.04 (Installed Equipment Costs) − USD 3.451E5 (NOL)
Nnp: Number of non-particulate equipment.
Table 3. Capital investment and production cost estimates in USD.
P1 (USD)P2 (USD)P3 (USD)
1. Total capital investment cost 9,455,60011,658,90016,504,900
          A. Equipment cost 3,516,1004,689,5007,848,900
                    i. Jacketed agitated reactors 2,014,4002,565,2005,160,000
                    ii. Jacketed storage tanks 484,200665,400952,000
                    iii. Feeder/hopper 262,400262,400262,400
                    iv. Belt conveyors 17,50017,50017,500
                    v. Live bottom storage bins 507,500872,200943,500
                    vi. Miscellaneous allowance 230,100306,800513,500
          B. Equipment setting 26,00040,30066,300
          C. Piping 685,300844,6001,049,200
          D. Civil 153,500260,100331,100
          E. Steel 199,200233,400312,900
          F. Instrumentation 837,100881,900916,800
          G. Electrical 618,200668,500813,700
          H. Insulation 208,400252,200336,500
          I. Paint 13,50030,80039,200
          J. Other 1,793,8002,037,8002,389,700
          K. General/admin overheads 211,000265,500387,300
          L. Contract fee 334,000394,400512,600
          M. Contingencies (10%) 859,6001,059,9001,500,400
2. Total annual production cost 3,722,9735,957,06015,292,386
          A. Direct operating costs 2,056,1733,557,0609,625,586
                    i. Feedstock cost 583,4722,061,7498,052,752
                                            a. Dewatered biosolids----
                                            b. Defatted soy flour692.38/t-1,146,4996,496,826
                                            c. Sodium hydroxide570/t583,472915,2501,555,926
                                            d. Water----
                    ii. Utilities 92,301114,911192,434
                                            Electricity0.0535/kWh92,301114,911192,434
                    iii. Labor cost 1,380,4001,380,4001,380,400
          B. Indirect operating costs 1,666,8002,400,0005,666,800
                    i. Packaging/Storage200/tote1,666,8002,400,0005,666,800
Disclaimer/Publisher’s Note: The statements, opinions and data contained in all publications are solely those of the individual author(s) and contributor(s) and not of MDPI and/or the editor(s). MDPI and/or the editor(s) disclaim responsibility for any injury to people or property resulting from any ideas, methods, instructions or products referred to in the content.

