1. Introduction
Sustainable development is a critical global issue. As the world’s second-largest economy, China has consistently upheld the concept of a community with a shared future for mankind, reflecting responsible leadership in promoting sustainable development [
1]. The China Sustainable Development Evaluation Report (2024) notes that China’s comprehensive sustainable development index exhibited a notable upward trend, rising from 57.1 in 2017 to 84.4 by 2024. It reflects steady growth for seven consecutive years. Enterprises are both essential drivers and leading actors in achieving strategic sustainable development objectives. Corporate sustainable development enables companies to manage risks and strengthen competitiveness, and also contributes to improved financial performance, fulfillment of social responsibilities, and enhanced access to market and policy resources. In September 2020, China officially articulated the “dual carbon” goals at the 75th session of the United Nations General Assembly. To fulfill these goals, market participants are required to adopt sustainable development strategies that balance economic and environmental interests. By the end of September 2024, over 2215 out of more than 5300 A-share listed companies had published their 2023 sustainability reports, marking a record disclosure rate of 41.5%. However, substantial challenges remain in the sustainable development practices of Chinese companies. Strengthening both policy and market incentives is essential to enhance intrinsic motivation within companies to reinforce their accountability in financial, environmental, and social responsibilities. In addition, the literature on corporate sustainable development performance (SDP) from a public policy perspective remains limited.
Green finance is a central strategy advanced by the Chinese government to mitigate environmental concerns and promote sustainable development. Green Finance Reform Pilot Zones’ establishment intends to generate replicable and scalable models, promote gradual national expansion through localized trials, and develop a green finance system with Chinese characteristics. In June 2017, China introduced the “Overall Plan for the Establishment of Green Finance Reform and Innovation Pilot Zones”, designating eight regions across five provinces—Zhejiang, Guangdong, Guizhou, Jiangxi, and the Xinjiang Uyghur Autonomous Region—as pilot zones. The Lanzhou New Area was included in the second batch in November 2019, and Chongqing was added in August 2022, as part of the third batch. The Green Finance Reform Pilot Zone policy (GFRPZP) represents a significant governmental initiative aimed at advancing the green transition and promoting sustainable development. This policy seeks to accelerate the expansion of the green economy through financial innovation and system development, thus offering robust financial support for achieving the “dual carbon” goals. Under the GFRPZP, whether corporate SDP can be further improved, the principal influencing factors, and the underlying mechanisms remain open questions. This study addresses these topics, providing theoretical and practical insights for refining the GFRPZP and advancing corporate sustainable development in China.
Despite several years of GFRPZP implementation, its specific effects, mechanisms, and heterogeneous outcomes have not been thoroughly explored in the literature. Few studies have integrated the GFRPZP and corporate SDP into a unified analytical framework. Therefore, this study empirically investigates the influence of the GFRPZP on corporate SDP using a multi-period difference-in-differences (DIDs) regression model and analyzes both the mediating and moderating effects. This study’s marginal contribution lies in addressing the research gap regarding the relationship between the GFRPZP and corporate SDP. By systematically investigating the multiple pathways and heterogeneous effects of the GFRPZP, this study enriches the theoretical framework of green finance in advancing companies’ sustainable development. Meanwhile, this study identifies the moderating roles of digital transformation and internal control in shaping policy effects, offering new perspectives and practical insights for policy design and implementation.
2. Literature Review
In 1987, the Brundtland Commission published
Our Common Future, which formally proposed sustainable development theory. Chowdhury et al. (2022) [
2] state that SDP is a comprehensive measure for assessing a company’s sustainability, including both economic and environmental dimensions. Currently, three main approaches are used to measure corporate SDP. First, some researchers use single financial indices, such as return on equity (ROE), to evaluate SDP [
3]. Second, other scholars assess SDP through both financial and environmental performance, capturing economic, environmental, and social aspects [
4,
5,
6]. Third, many studies measure SDP using financial indicators across three dimensions: economic, environmental, and social [
7].
Scholars examining the determinants of SDP have mainly focused on four perspectives: environmental management, internal governance, social responsibility, and policy. From the environmental management perspective, green growth strategies, environmental risk management, and green supply chain management all influence SDP [
8,
9,
10]. From the internal governance perspective, ownership structure, CEO characteristics, board composition, and corporate governance are important determinants [
11,
12,
13,
14]. Regarding social responsibility, Wang et al. (2017) employ an event study approach and confirm that fulfilling social responsibilities enhances corporate performance [
15]. Shoukat et al. (2024) and Fitriana et al. (2024) reach similar conclusions [
16,
17]. Alshehhi et al. (2018) show that among companies in different countries and regions, the association between social responsibility practices and SDP is positive in 78% of cases, negative in 6%, and nonlinear in 16% [
18]. From the policy perspective, studies have concentrated on various policies’ effects on corporate SDP [
19,
20]. For example, after the
Environmental Tax Law was enacted, heavily polluting companies exhibited significant improvements in ESG performance, indicating that tax system reforms can enhance corporate SDP [
21]. Although prior studies have examined the determinants of corporate SDP from a variety of perspectives, few studies have integrated the GFRPZP into the analytical framework for examining corporate SDP.
The GFRPZP marks a new phase in the evolution of green finance in China, characterized by the combination of top-down strategic planning and bottom-up regional practice. The economic consequences of the GFRPZP have received relatively limited scholarly attention. Existing studies primarily assess its economic effects from four perspectives: ESG performance, corporate innovation, debt financing, and corporate performance. Regarding ESG performance, Gao et al. (2024) employ the DIDs method and find that the GFRPZP substantially improves corporate ESG performance, but outcomes differ due to variations in supply chain financing and operational transparency [
22]. Sun et al. (2025) report that the effect of the GFRPZP varies according to industry characteristics, CEO traits, regional environmental regulation, corporate life cycle, and dynamic effects [
23]. For corporate innovation, Liu et al. (2025) confirm that the policies of green finance facilitate green innovation by alleviating financing constraints and mitigating agency costs [
24]. Similar findings are reported by Zhang (2023) and Liu et al. (2023) [
25,
26]. Regarding debt financing, some studies show that the establishment of pilot zones increases debt financing costs for corporations when analyzed at the industry level [
27,
28]. For corporate performance, Wang et al. (2020) find that under green finance, government subsidies and tax incentives can enhance environmental performance, a result also supported by Chen et al. (2024) [
29,
30]. Flammer (2021) demonstrates that issuing green bonds significantly improves both corporate environmental and financial performance [
31]. These findings indicate that while the economic effects of the GFRPZP have been widely studied, research focusing on corporate SDP remains extremely limited.
In summary, the economic consequences of implementing the GFRPZP are mainly examined from four perspectives: ESG performance, innovation, debt financing, and corporate performance. Studies focusing on corporate performance usually address environmental and financial dimensions, with few considering overall SDP. This study integrates the GFRPZP and corporate SDP within a unified research framework. It measures corporate SDP across three dimensions: financial, environmental, and social performance. This paper systematically examines the GFRPZP’s effect on corporate SDP, including heterogeneity across different company types and regions. In addition, it analyzes the mechanisms through which the GFRPZP promotes corporate sustainable development, such as green innovation and alleviation of financing constraints, offering a new perspective on policy interventions. Finally, this study introduces digital transformation and internal control as moderating variables, exploring their roles in shaping policy outcomes, and expanding the research agenda by integrating digital governance with traditional financial policy.
3. Research Hypotheses
First, from the perspective of the quality and quantity of green innovation, grounded in the theoretical framework of technological innovation, Green Finance Reform Pilot Zones provide green financial products and incentives, encouraging companies to undertake environment-related technological innovation [
32]. Moderate environmental regulation does not reduce corporate competitiveness and can trigger the “innovation compensation effect,” thereby enhancing corporate performance [
33,
34]. Carbon trading mechanisms and pollution pricing within these pilot zones require firms to internalize negative externalities. Supporting measures—including tax credit policies, fast-track approval for green patents, and green bonds—encourage companies to enhance investment in green research and development (R&D). These measures facilitate the advancement of environmental technologies and green products, further enhancing companies’ green innovation capacity [
26]. The quality (e.g., green patent citations) and quantity of green innovation, as firm-specific capital, facilitate corporate green transformation and enhance long-term sustainability. According to sustainable development theory, green innovation serves as a fundamental engine driving companies toward the realization of sustainable development [
35]. Advancing the quality and quantity of green innovation improves production efficiency. These not only enable companies to gain competitive advantages but also increase their SDP. Green finance helps companies reduce the cost of green technology R&D, strengthens corporate green innovation, and ultimately reduces emissions and supports sustainable development.
Second, regarding corporate financing constraints, pilot zones provide multiple financing channels, including green credit and green funds. Firms with green competitiveness are more likely to receive financial support [
36]. Based on signaling theory, access to green finance sends positive signals to the market, attracting investors, easing financing constraints [
37], and offering substantial support for SDP. The Green Finance Reform Pilot Zones have information-sharing platforms on corporate pollution and compliance, which increase transparency and enforce strict credit standards. Compliance with environmental laws becomes essential for securing loans. These standards can enhance a company’s sense of social responsibility and improve access to funding opportunities [
38]. The alleviation of financing constraints enables companies to gain greater access to external capital support, which helps strengthen their long-term growth and stability and promotes sustainable development. Sustainable development theory holds that, once financing constraints are reduced, companies will allocate greater resources to sustainable activities (such as green production and pollution control), continuously improving companies’ overall performance across economic, environmental, and social dimensions.
Third, considering analyst attention, information asymmetry between investors and companies can lead to inefficient market allocation. Analysts, acting as information intermediaries, guide market value assessments and help reduce resource misallocation [
39]. According to signaling theory, these pilot zones not only offer policy support for green companies but also provide transparent and open financing platforms, attracting analysts’ attention. Analysts’ research on companies’ green finance activities effectively mitigates information asymmetry between companies and capital markets, further enhancing corporate visibility and reputation, thereby strengthening their capacity for sustainable development. Increased analyst attention raises the market recognition of corporate sustainability, leading to greater capital support. Under increased pressure for disclosure, companies place more emphasis on environmental standards, achieve stable growth, and further enhance SDP.
Drawing on the preceding analysis, this paper formulates hypotheses 1 (H1) and hypotheses 2 (H2):
H1: The GFRPZP improves corporate sustainable development performance.
H2: The GFRPZP enhances corporate sustainable development performance by improving the quality and quantity of green innovation, alleviating financing constraints, and increasing analyst attention.
Digital transformation entails the incorporation of advanced digital technology into companies’ production and operations, which continuously strengthens production capacity and creates greater value for companies [
40]. Technological innovation theory suggests that digital technologies improve the precision of green financial services, enabling financial institutions to better serve companies that meet sustainable development standards. Digital transformation increases production efficiency, streamlines processes, reduces costs, and improves economic performance [
41]. For example, smart factories can optimize energy consumption through data analysis, reduce carbon emissions, and improve companies’ overall performance across financial, environmental, and social dimensions. From a signaling perspective, digital transformation enhances credit assessment accuracy, enabling financial institutions to assess green project risks more effectively, reducing funding costs, and increasing returns on green investment. Firms with higher levels of digital transformation adapt more rapidly to policy requirements, adjust strategies promptly, and capitalize on green finance opportunities, further promoting SDP.
Internal control functions as a fundamental governance mechanism for maintaining checks and balances within enterprises. According to sustainable development theory, a high-quality internal control system creates a sound environment, ensures regulation and supervision of business processes, identifies and corrects management deficiencies, and promotes sustainable development [
42]. Robust internal controls support SDP [
43]. Effective systems ensure that resources are allocated to sustainable areas, such as cleaner production and green technology R&D, thereby facilitating more effective achievement of sustainable development. From a signaling perspective, strong internal controls improve transparency and completeness of environmental information, facilitating access to financial support and promoting sustainable development. Companies with strong internal controls can establish robust risk management systems, ensure compliance with environmental regulations, and enhance their sustainable operations [
44]. Furthermore, high-quality internal control improves the selection, execution, and evaluation of green investments through mechanisms such as performance assessments and project evaluation, increasing capital efficiency and enhancing SDP.
Building upon this analysis, this study proposes hypothesis 3 (H3):
H3: The level of digital transformation and internal control strengthens the promoting effect of the GFRPZP on corporate sustainable development performance.
4. Research Design
4.1. Model Construction
To examine the theoretical hypotheses, this paper uses the GFRPZP as a quasi-natural experiment and employs the DIDs model to evaluate the influence of the GFRPZP on corporate SDP. This approach assesses whether the implementation of the GFRPZP leads to a statistically significant divergence in SDP between the treatment and control groups over time. The empirical model is specified as follows:
where
i denotes the firm and
t denotes the year. SDP denotes the dependent variable. The GFRPZP (inter) is the key independent variable, constructed as treat × post. Drawing upon Guo et al. (2024) and Liu et al. (2025), the controls include control variables, such as firm size (SIZE), ownership concentration (TOP1), financial leverage (LEV), firm age (AGE), cash flow level (CASHFLOW), regional economic development level (GDP), industrial structure (IS), and CEO duality (DUAL) [
45,
46]. treat
i indicates a firm’s group assignment, taking the value of 1 if the firm belongs to the treatment group, and 0 if it belongs to the control group. post
t represents the time dummy variable.
means the individual fixed effects.
represents the time effects.
means the stochastic disturbance term.
Green innovation captures the internal transformation mechanism, financing constraints represent the external resource acquisition mechanism, and analyst attention reflects the supervisory mechanism of the capital market. Green innovation is measured by two dimensions: quality and quantity, offering a holistic view of both the depth and breadth of the mechanism’s effect. Based on these considerations, a mediation analysis model is used to explore the transmission mechanism and potential mediating variables through which the GFRPZP affects corporate SDP. The mediating variables (M) include green innovation (quality and quantity), financing constraints, and analyst attention. These variables reflect how the GFRPZP affects corporate SDP through internal behaviors and market responses. The mediation model is constructed as follows:
In mediation analysis, multicollinearity or reverse causality between the mediator and the dependent variable can lead to the overestimation of the mediation effects if the three-step method is used. Moreover, the three-step method does not precisely quantify the explanatory power of the mediation effect. However, the two-step method enables direct testing and accurate quantification of the mediation effect and is more widely adopted in empirical research. This study, therefore, applies the two-step method outlined by Jiang (2022) [
47], focusing on the credibility of causal identification from the independent variable to the dependent variable. The same approach is used to evaluate the causal link between the independent variable and each mediating variable, accurately identifying the transmission mechanism. First, the initial equation estimates the effect of the GFRPZP on corporate SDP. Second, the subsequent equation incorporates mediators—green innovation (quality and quantity), financing constraints, and analyst attention—to test whether the core explanatory variable exerts significant effects on the mediating variables, confirming the mediation effect.
When moderating variables are present, it is necessary to consider both the direct effect of the independent variable on the dependent variable and the moderating effects of the moderators within the regression framework. Digital transformation and internal control are key drivers in facilitating the implementation and compliance of the GFRPZP and optimizing resource allocation. This study introduces these two variables as moderators to identify the boundary conditions and underlying mechanisms of policy effectiveness. Accordingly, the following model is developed:
where
W denotes the moderating variables, specifically digital transformation and internal control.
4.2. Variable Description and Data Sources
This paper uses Chinese A-listed companies spanning from 2010 to 2023, yielding 30,847 firm-year observations. The data are cleaned in three steps: (1) firms in the financial sector are excluded; (2) firms designated as ST or *ST are removed due to special treatment status; and (3) firms with significant missing data are excluded. To reduce the effect of outliers, all continuous variables are winsorized at the 1st and 99th percentiles. The data on the green patent quality and quantity are obtained from the CNRDS database, environmental and social performance data are drawn from the E and S scores in the Huazheng ESG rating system, and the other data are sourced from the CSMAR database. Data processing and regression analyses are performed using Stata 18.0.
Table 1 provides detailed definitions of all variables employed in this study.
Corporate SDP denotes a company’s overall achievements in economic, environmental, and social dimensions, resulting from environmentally and socially responsible activities [
7]. It integrates three components: financial, environmental, and social performance. The entropy weight method is employed to assign weights objectively to the SDP evaluation indicators. The financial performance is proxied by return on assets [
48]; the environmental performance is proxied by the E score from Huazheng ESG; and the social performance is proxied by the S score from the same rating system [
49]. The calculation steps for indicator weights using the entropy weight method are as follows:
- (1)
Data Standardization: For k indicators X1, X2,…, Xk, standardize each indicator to obtain Y1, Y2,…, Yk, and then the following can be obtained:
- (2)
Proportion Calculation: For each indicator j, calculate the proportion for each sample i:
- (3)
Information Entropy Calculation: Calculate the information entropy for each indicator:
- (4)
Indicator Weights Determination: Use the calculated entropy values (E1, E2, …, Ek) to determine the weight of each indicator based on their quantitative relationships:
The final entropy values, utility values, and weights for each SDP component are summarized in
Table 2.
- (5)
Comprehensive Score Calculation: Compute the weighted sum of the standardized values and their weights for each sample:
Table 3 shows the descriptive statistics. The SDP ranges from 0.0665 to 0.9625. It has a mean of 0.6158 and a median of 0.6179. These findings imply that the distribution of the SDP is nearly symmetric. The standard deviation is 16.1% of the mean, suggesting systematic differences in sustainable development across firms. The descriptive statistics for other variables are also presented in this table.
After compiling the data, this study conducts a statistical analysis to examine interrelationships among variables. A simple correlation analysis between the SDP, GFRPZP (inter), and green innovation quality is shown in
Table 4. The coefficient between the SDP and GFRPZP (inter) is 0.054 and reaches statistical significance. These results indicate reliable data quality and reduced multicollinearity, supporting the subsequent regression analysis.
5. Empirical Results Analysis
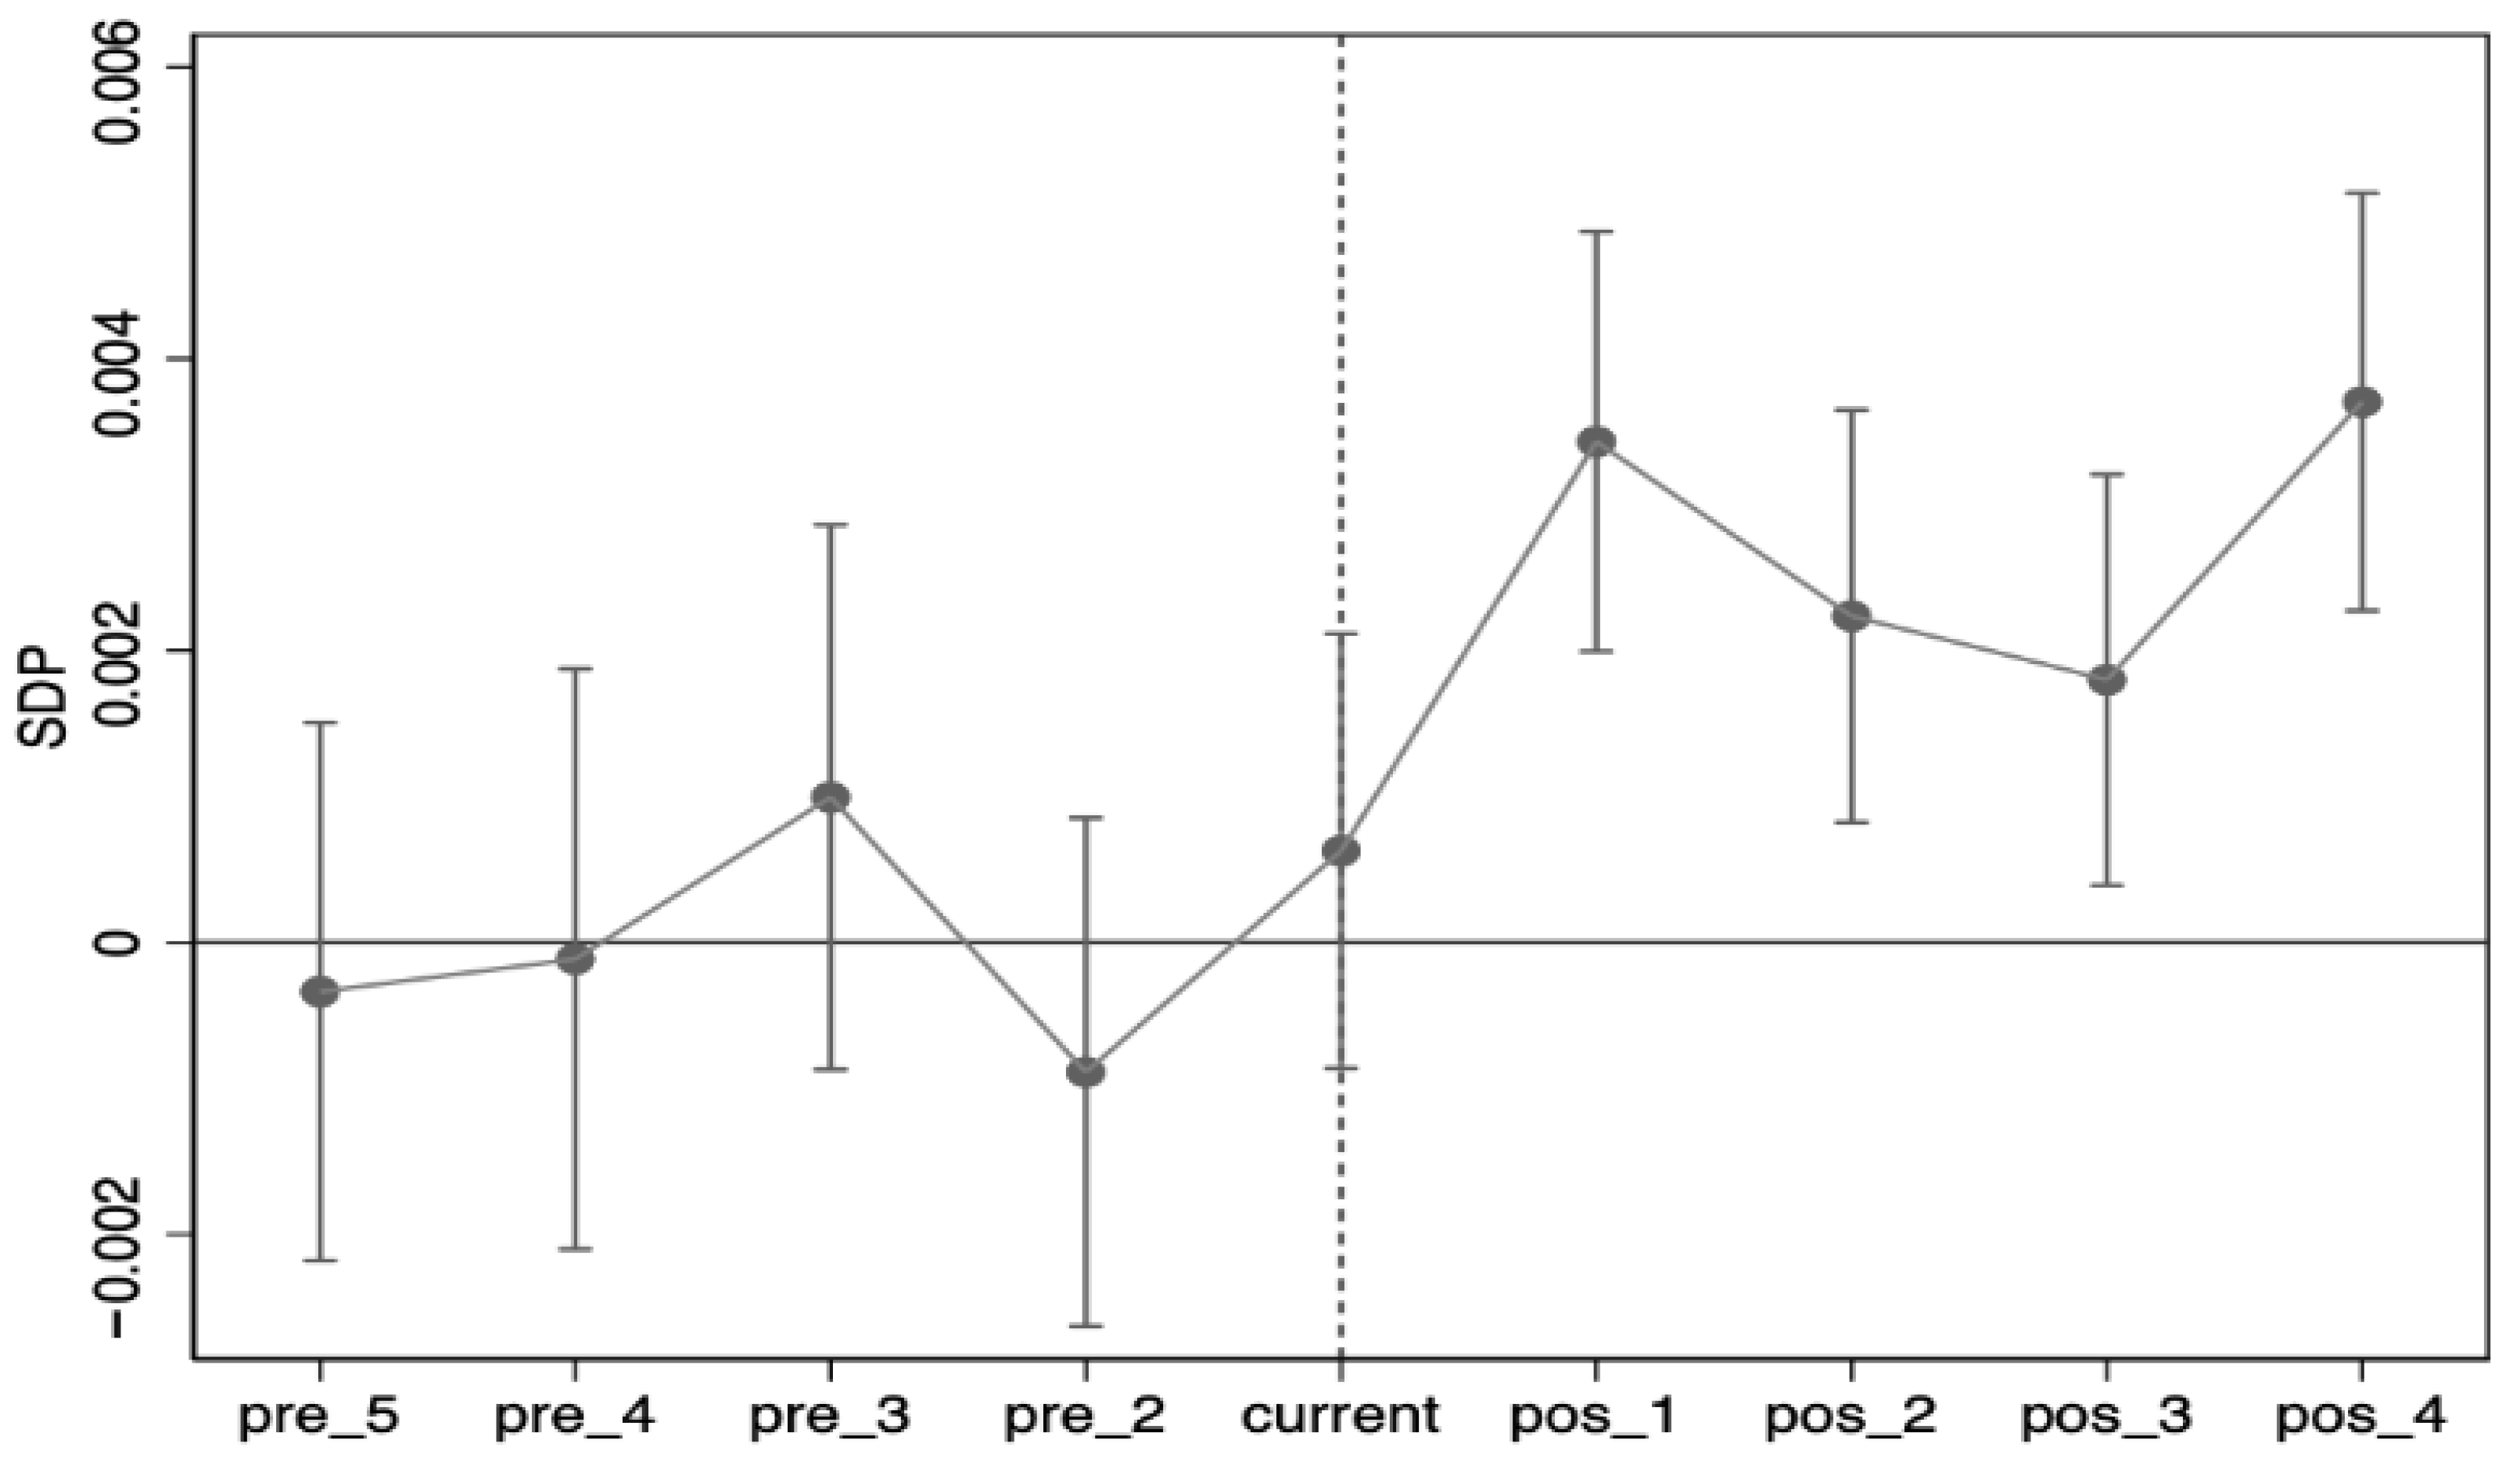
5.1. Parallel Trend Test
Given the use of a multi-period DIDs model, it is essential to verify that the baseline estimation satisfies the parallel trends assumption. The parallel trend test utilizes data spanning five years prior to and four years following policy implementation. Before the introduction of the GFRPZP, the interaction terms’ coefficients are not significantly different from zero (
Figure 1), indicating no significant differences or trends in the SDP between the treatment and control groups. After the implementation of the policy, the coefficients associated with the SDP for the treatment group remain significantly positive in each post-policy year, indicating that the GFRPZP significantly enhanced SDP relative to the control group. Therefore, the parallel trends assumption is met.
5.2. Benchmark Regression
Panel data analysis is conducted using the DIDs model. The GFRPZP variable is first included alone, followed by the inclusion of control variables to enhance result robustness (
Table 5). In column (1), GFRPZP (inter) is the sole independent variable and demonstrates statistical significance at the 1% level. These results reveal that, relative to the enterprises in the non-pilot regions, those in the pilot regions experienced an average increase of 0.0217 units in their SDP. This demonstrates that the GFRPZP positively affects corporate SDP. In column (2), after adding control variables, the coefficient for the GFRPZP (inter) is 0.0228 and remains statistically significant at the 1% level. This supports the conclusion that the GFRPZP’s implementation improved corporate SDP. Therefore, hypothesis H1 is validated. These findings suggest that the GFRPZP expands green financing channels, eases financing constraints, optimizes resource allocation, and promotes green governance, ultimately enhancing corporate reputation and SDP.
5.3. Robustness Test
5.3.1. Placebo Test
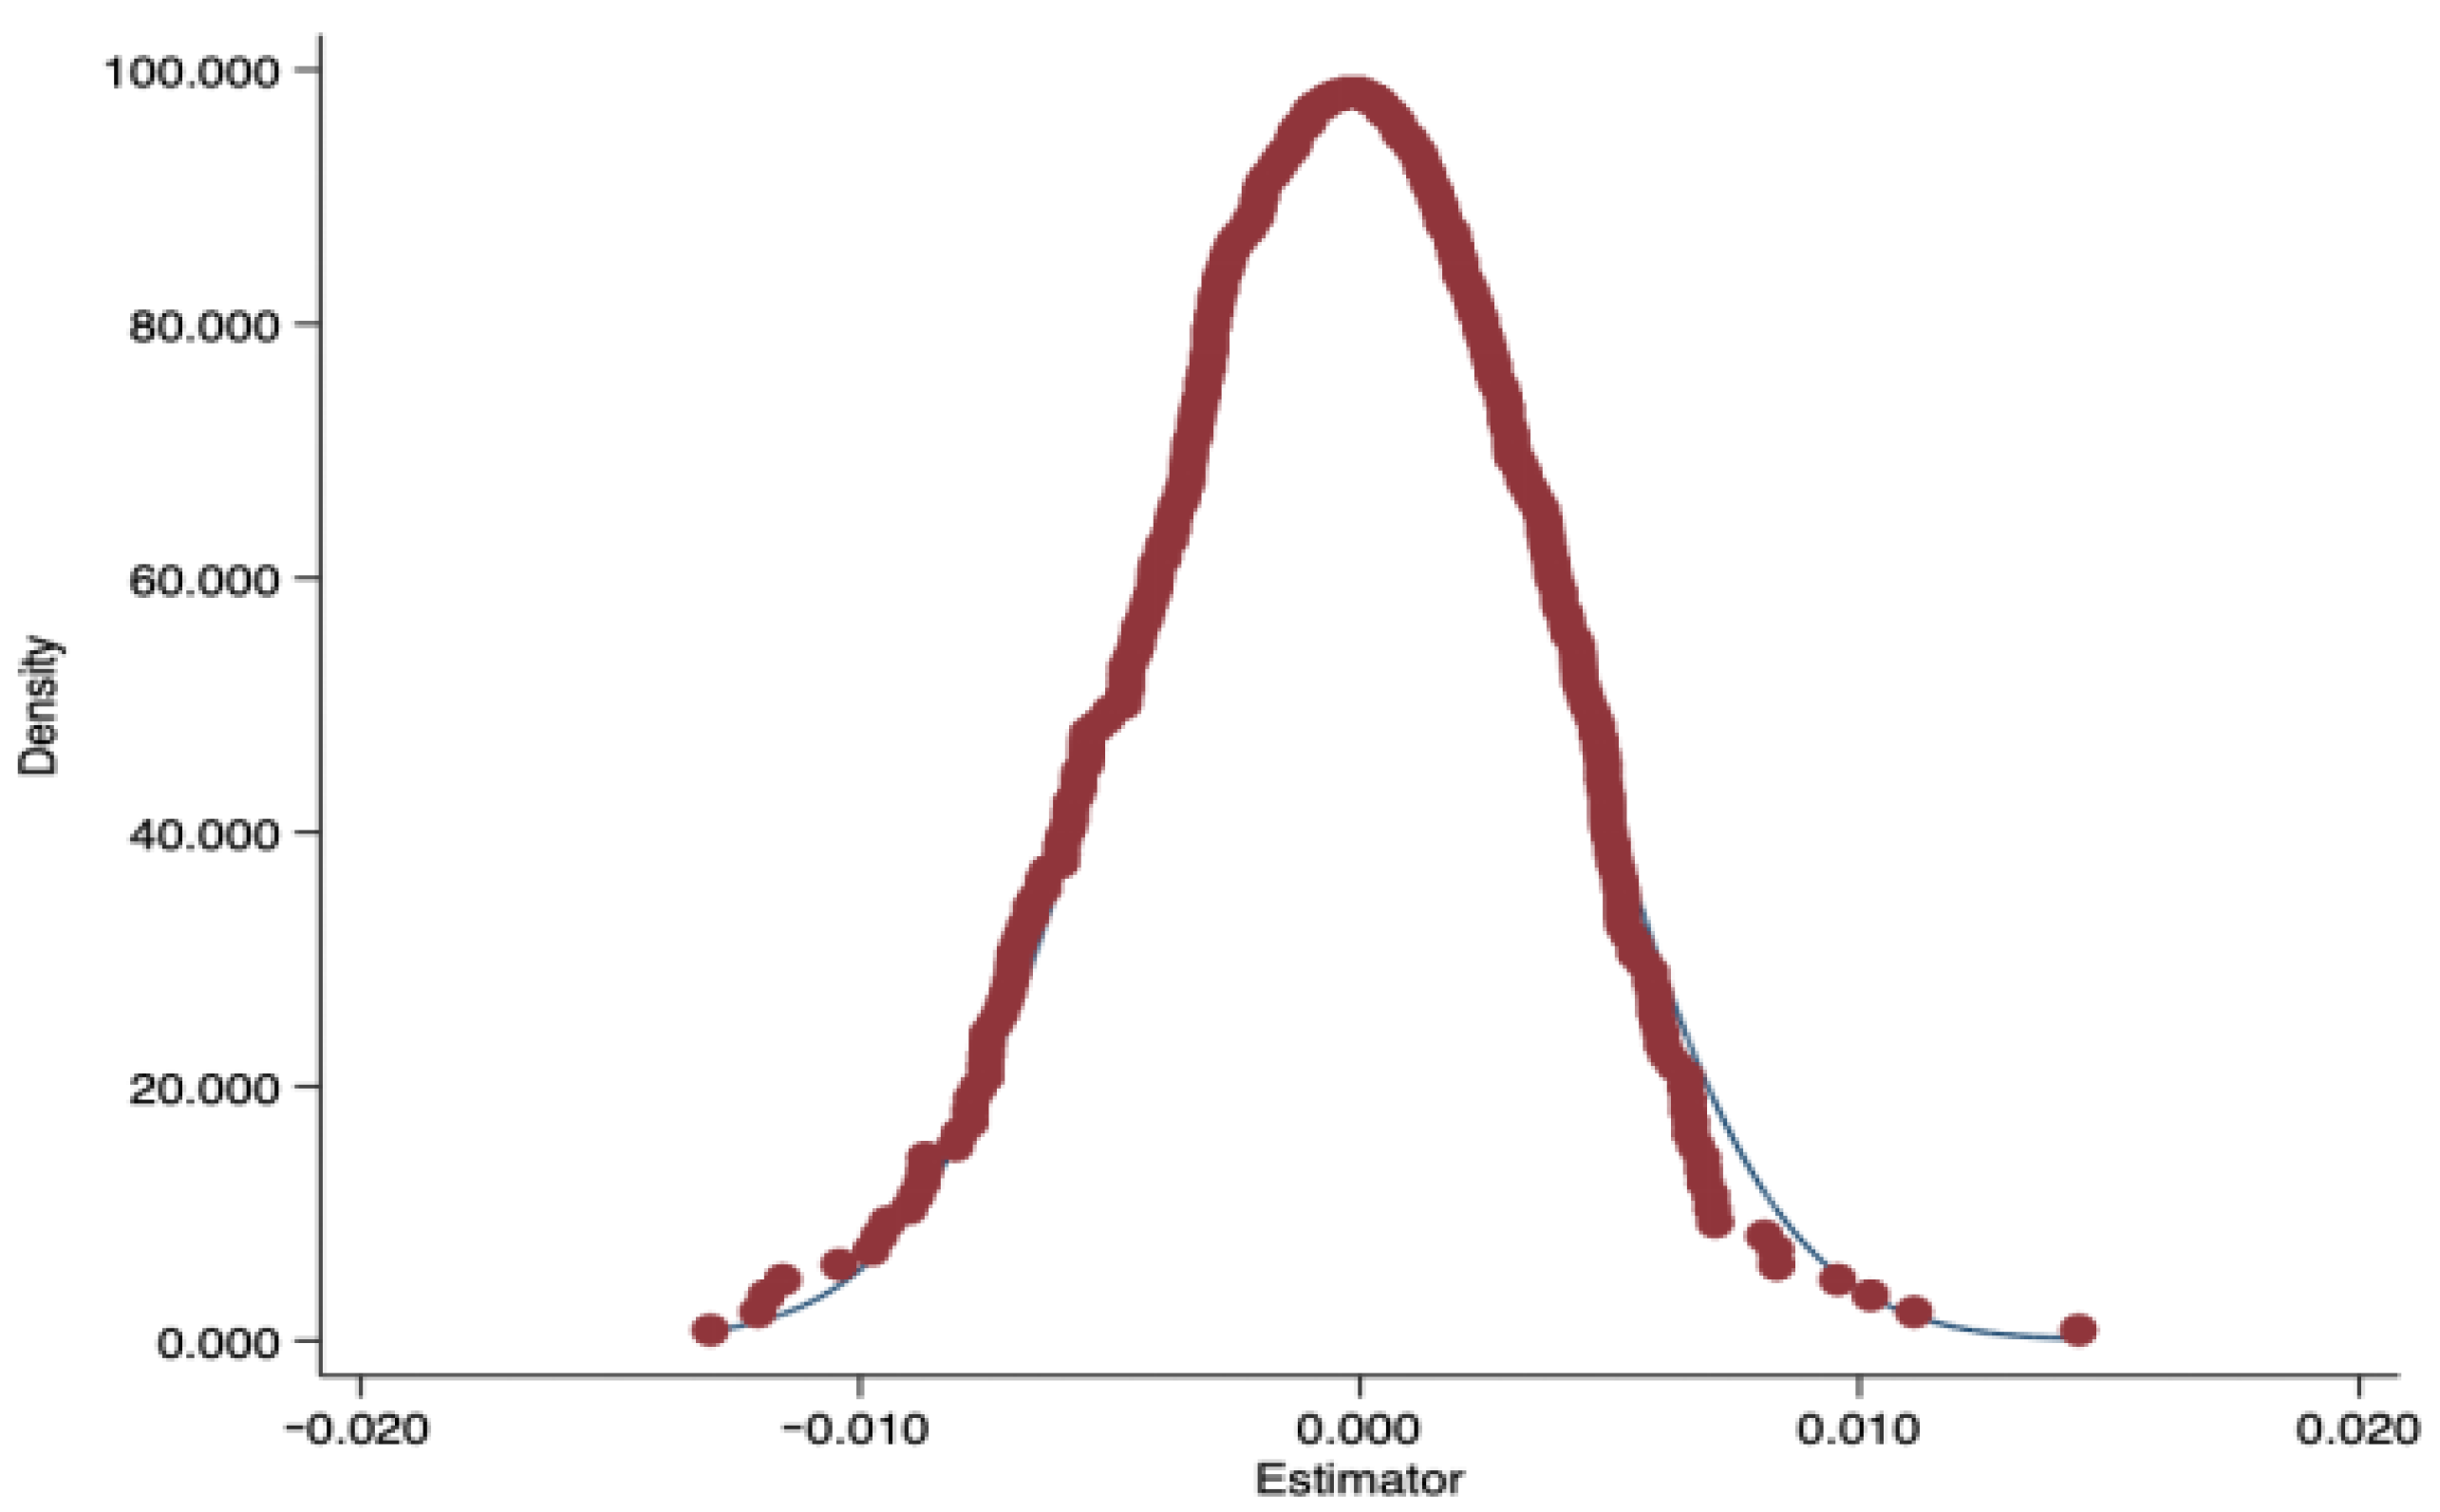
The placebo test creates fictitious treatment groups and policy shock timings, inserting these into the original model for regression [
50]. If results for the placebo variables are similar to the main findings, the original results lack credibility. If they differ, the original findings are robust. To verify the model’s reliability, a pseudo-policy dummy is generated, and the regression is repeated 500 times. The distribution of the estimated coefficients, standard errors, and
p-values is shown in
Figure 2, confirming the GFRPZP’s significant effect on corporate SDP. Most coefficients in
Figure 2 are centered near zero, showing a symmetric distribution. This suggests that, under random assignment, the policy does not systematically affect the SDP. The actual empirical coefficients deviate notably from this random distribution, confirming the statistical significance and robustness of the main results.
5.3.2. PSM-DIDs
This section utilizes a propensity score matching difference-in-differences (PSM-DIDs) method to alleviate endogeneity concerns arising from initial disparities between the treatment and control groups. The cities with characteristics most similar to the treatment group are chosen as controls, ensuring comparability. The caliper matching method is used at ratios of 1:4 and 1:5 (
Table 6). Columns (1)–(2) display the 1:4 results, and columns (3)–(4) show the 1:5 results. In all specifications, the GFRPZP significantly improves SDP, further supporting H1 and reinforcing the robustness of the previous findings.
5.3.3. Other Robustness Tests
- (1)
Replacing the regression method: The Ordinary Least Squares (OLS) approach is employed to verify result stability (
Table 7). The variable inter remains statistically significant, confirming the positive effect of the GFRPZP on corporate SDP and validating H1.
- (2)
Excluding time effects: The COVID-19 pandemic disrupted regular business activities. To further verify robustness, the analysis excludes pandemic data (
Table 7). The GFRPZP (inter) retains its significance at the 1% level, again supporting H1.
- (3)
Adding new control variables: Additional controls, such as board size (BOARD) and revenue growth rate (GRO), are included to remove potential confounders (
Table 7). Column (3) confirms the robust effect of the GFRPZP on corporate SDP.
- (4)
Replacing the dependent variable: This section uses the corporate green development index as a new proxy variable for SDP. Following Ding et al. (2024) [
51], the corporate green development index is measured using 14 indicators across three dimensions: economic profit, social value, and environmental benefits. Column (4) shows that, even with the replacement, the model remains robust and hypothesis H1 is upheld.
5.4. Heterogeneity Analysis
5.4.1. Ownership Heterogeneity
The sample is stratified by ownership type into state-owned enterprises (SOEs) and non-state-owned enterprises (Non-SOEs) for the group regression analysis. Columns (1) and (2) report the GFRPZP’s influences on SDP for each ownership group (
Table 8). The results reveal heterogeneous effects: the GFRPZP has a limited influence on SOEs, but significantly enhances SDP in Non-SOEs. A possible explanation for this result is that SOEs already benefit from favorable financing, so the policy provides little marginal incentive. In contrast, Non-SOEs, facing more severe financing constraints, are more responsive to market-based incentives. The GFRPZP exerts a stronger pull on Non-SOEs, making green finance a key tool for improving their competitiveness.
5.4.2. Regional Heterogeneity
Columns (3) and (4) of
Table 8 show the GFRPZP’s effects on companies in eastern and central–western regions, respectively. In the eastern region (column 3), the coefficient of the GFRPZP (inter) is 0.0428 and remains statistically significant at the 1% level. In the central–western regions (column 4), the coefficient is −0.0049 and does not reach statistical significance. This result indicates that the GFRPZP significantly enhances SDP in the eastern region, but not in the central-western region. The eastern region possesses a more developed financial market, a mature system for green credit products, and generally larger and more capable companies. Moreover, the eastern region governments have greater experience with green finance pilot programs, leading to more comprehensive policies and evaluation systems. The companies in the central–western region, by contrast, may be constrained in leveraging the GFRPZP, resulting in a limited effect on their SDP.
5.4.3. Industry Pollution Level Heterogeneity
In
Table 8, columns (5) and (6) present the GFRPZP’s effects on companies in heavily polluting and non-heavily polluting industries, respectively. The GFRPZP significantly enhances SDP in non-heavily polluting companies, while its impact lacks significance in heavily polluting companies. This may be due to stricter constraints and fewer supportive incentives for heavily polluting sectors. Additionally, green transformation in these industries demands larger investments and faces more complex transition pathways, making near-term improvements in SDP difficult. In contrast, companies in non-heavily polluting sectors may more effectively utilize the resources and support offered by the GFRPZP, leading to greater progress in sustainable development.
5.4.4. City-Level Heterogeneity
In
Table 9, columns (1) through (3) present the GFRPZP’s effects on enterprises in first-, second-, and third-tier cities. In the first-tier cities (column 1), the GFRPZP (inter) coefficient is 0.0304 and reaches significance at the 1% level. In the second-tier cities (column 2), the coefficient is 0.0165 and reaches significance at the 10% level. In the third-tier cities (column 3), the coefficient lacks significance. These findings imply that the GFRPZP’s effect on SDP is strongest in the first-tier cities, moderate in the second-tier cities, and not significant in the third-tier cities. This declining trend may be explained by stronger green finance markets, higher demand for green transformation, and better-developed regulatory systems in the first-tier cities. The second-tier cities lag somewhat in marketization and policy implementation, while the third-tier cities face insufficient green finance supply, weak enforcement by local governments, and limited corporate green governance capabilities, restricting their SDP improvement.
5.4.5. High-Tech Industry Heterogeneity
In
Table 9, columns (4) and (5) illustrate the GFRPZP’s effects on enterprises in high-tech and non-high-tech industries. For high-tech companies (column 4), the GFRPZP (inter)’s coefficient is 0.0394 and is significant at the 1% level. For non-high-tech companies (column 5), the coefficient lacks significance. Thus, the GFRPZP significantly promotes SDP in high-tech industries, but does not exhibit a statistically significant effect within non-high-tech industries. High-tech firms may benefit more due to their stronger R&D and innovation capabilities, allowing them to efficiently use green finance and translate it into SDP. Non-high-tech companies, with more limited transformation capacity and policy adaptability, see less benefit.
5.4.6. Environmental Regulation Level Heterogeneity
Columns (6) and (7) in
Table 9 show the effects of the GFRPZP on companies under high and low levels of environmental regulation. In regions with higher regulation (column 6), the GFRPZP (inter) coefficient is 0.0275 and is significant at the 1% level. In regions with lower regulation (column 7), the coefficient is 0.0137 and lacks statistical significance. It indicates that the GFRPZP significantly promotes SDP under stringent environmental regulation, but not where regulation is weak. Strong regulation drives companies to pursue green transformation, aligning green finance demand and supply. Conversely, companies facing weaker regulation experience less external pressure and possess limited internal capacity, which constrains the effectiveness of the policy in enhancing their SDP.
5.5. Mechanism Test
5.5.1. Mediating Effect
- (1)
Green Innovation Quality
Columns (1) and (2) illustrate the results for green innovation quality (GIQ) as a transmission mechanism (
Table 10). Following the mediating effect testing steps, column (1) aligns with the baseline regression. Column (2) presents that the coefficient of the GFRPZP (inter) on GIQ is 0.1178, reaching the 1% level of statistical significance. It implies that the GFRPZP enhances corporate SDP by improving green innovation quality, supporting hypothesis H2. The pilot zones provide financial instruments, such as green loans and green bonds, enabling firms to allocate greater resources toward high-quality green R&D, which strengthens their GIQ. High-quality green innovation also elevates a company’s brand image and reputation, further increasing its competitiveness and profitability and, thus, improving SDP.
- (2)
Green Innovation Quantity
Columns (1) and (3) display the results for green innovation quantity (GIN) as the transmission mechanism (
Table 10). Column (3) indicates that the GFRPZP (inter) coefficient on GIN is 0.1054, reaching the 5% level of statistical significance. It shows that the GFRPZP enhances corporate SDP by increasing green innovation quantity, also supporting hypothesis H2. The pilot zones deliver a range of financial support, encouraging companies to boost investment in green R&D and expand the number and coverage of green patents. The green innovation quantity increase not only supports green transformation but also attracts greater investor attention, improving market competitiveness and further strengthening SDP.
- (3)
Financing Constraints
Columns (1) and (4) use financing constraints as the transmission mechanism (
Table 10). Column (4) reports that the GFRPZP coefficient on financing constraints is −0.0741, reaching the 10% level of statistical significance. This indicates that the GFRPZP enhances SDP by easing financing constraints, thereby supporting hypothesis H2. The pilot zones use tools such as preferential green credit quotas and discounted loan rates to provide companies with lower-cost capital for green investment, alleviating financing challenges. Once constraints are eased, companies can allocate more resources toward clean production and energy conservation, facilitating the improvements of corporate SDP. The GFRPZP also increases the likelihood of securing long-term financing by optimizing the green credit ratings system, enabling ongoing investment in green projects.
- (4)
Analyst Attention
In
Table 10, columns (1) and (5) use analyst attention as the transmission mechanism. Among them, column (5) illustrates that the GFRPZP coefficient on analyst attention is 0.1033, reaching significance at the 10% level. It indicates that the GFRPZP can enhance corporate SDP by increasing analyst attention, supporting hypothesis H2. The policy raises analyst attention by improving information disclosure quality and green governance standards. Analyst research improves external supervision and investor recognition, helping companies secure consistent financial support and strengthen their market position, thereby promoting SDP.
5.5.2. Moderating Effect
- (1)
Digital Transformation
Column (2) indicates that the GFRPZP (inter) coefficient is 0.0181, which meets the 1% significance criterion (
Table 11). This confirms that the policy exerts a substantial beneficial influence on corporate SDP. DT_inter’s coefficient is 0.0087 and is significant at the 5% level, indicating that digital transformation strengthens the link between the GFRPZP and corporate SDP. Digital transformation increases transparency and enables companies to respond more quickly to GFRPZP requirements. It also sends a positive signal to stakeholders about green practices, strengthening the policy’s effect on SDP.
- (2)
Internal Control
Column (3) indicates that the GFRPZP (inter) coefficient is 0.0236, which meets the 1% significance criterion (
Table 11). IC_inter’s coefficient is 0.0961 and is significant at the 5% level. This demonstrates that sound internal control substantially enhances the effect of the GFRPZP on corporate SDP. Strong internal control improves resource allocation efficiency and risk management, accelerates green transformation, and further amplifies the policy’s beneficial effect on SDP.
6. Conclusions and Policy Recommendations
Drawing on the preceding analysis, this paper adopts the GFRPZP as the core explanatory variable, corporate SDP as the dependent variable, and incorporates control variables related to firm characteristics and regional economic development. A multi-period DIDs model is constructed. The empirical results demonstrate, first, that the baseline regression indicates a substantial positive effect of the GFRPZP on corporate SDP. The influence is especially notable for Non-SOEs firms in the eastern region, non-heavily polluting industries, first-tier cities, high-tech sectors, and firms subject to stricter environmental regulation. Second, the mediation analysis reveals that the GFRPZP enhances sustainable development through four primary pathways: improving the quality and quantity of green innovation, alleviating financing constraints, and strengthening analyst attention. Third, the moderation analysis shows that both digital transformation and internal control serve as positive moderators, highlighting a dual mechanism of digital empowerment and governance enhancement.
In light of the empirical results, this section provides the following policy recommendations:
First, differentiated green finance policies should be formulated according to firm type. Policymakers should consider the unique characteristics and needs of the different firms and offer tailored support. For example, additional green credit and investment incentives should be directed toward Non-SOEs, financial subsidies for green innovation should target firms in the eastern region, and a favorable policy environment should be created for non-heavily polluting and high-tech firms.
Second, policy design should prioritize the quality of green innovation, not merely its quantity. As green innovation is critical to corporate sustainability, governments should promote high-quality green innovation by establishing dedicated R&D funds, providing tax incentives, and supporting the commercialization of green technologies.
Third, measures to reduce corporate financing constraints, especially for initial green project investments, should be strengthened. Initiatives such as establishing green credit guarantee funds, promoting the use of green bonds, and optimizing green credit policies can lower financing burdens and enhance access to green financing. Closer cooperation with financial institutions and the guidance of capital flows to green industries will also help provide stable, long-term financial support for sustainable development.
Fourth, it is essential to support both digital transformation and internal control improvements to maximize the GFRPZP’s effectiveness. Governments should encourage digital transformation by offering technical support and training, enabling companies to build intelligent management and operational systems. At the same time, companies should be encouraged to optimize internal control mechanisms, raise management standards, and ensure the effective transmission of green finance policies throughout business operations.
This paper advances the literature by examining the economic effects of the GFRPZP in terms of corporate SDP, expanding performance evaluation frameworks, and enriching theoretical discussion regarding the mechanisms of policy action. Although this research helps address the gap in understanding the relationship between the GFRPZP and corporate SDP, further studies are needed. Future research could conduct cross-country comparisons of policy design and performance, exploring the universality and institutional variability in the GFRPZP within an international context.


