3.1. Descriptive Statistics of GHG Emissions from Jurisdictions and Economic Sectors
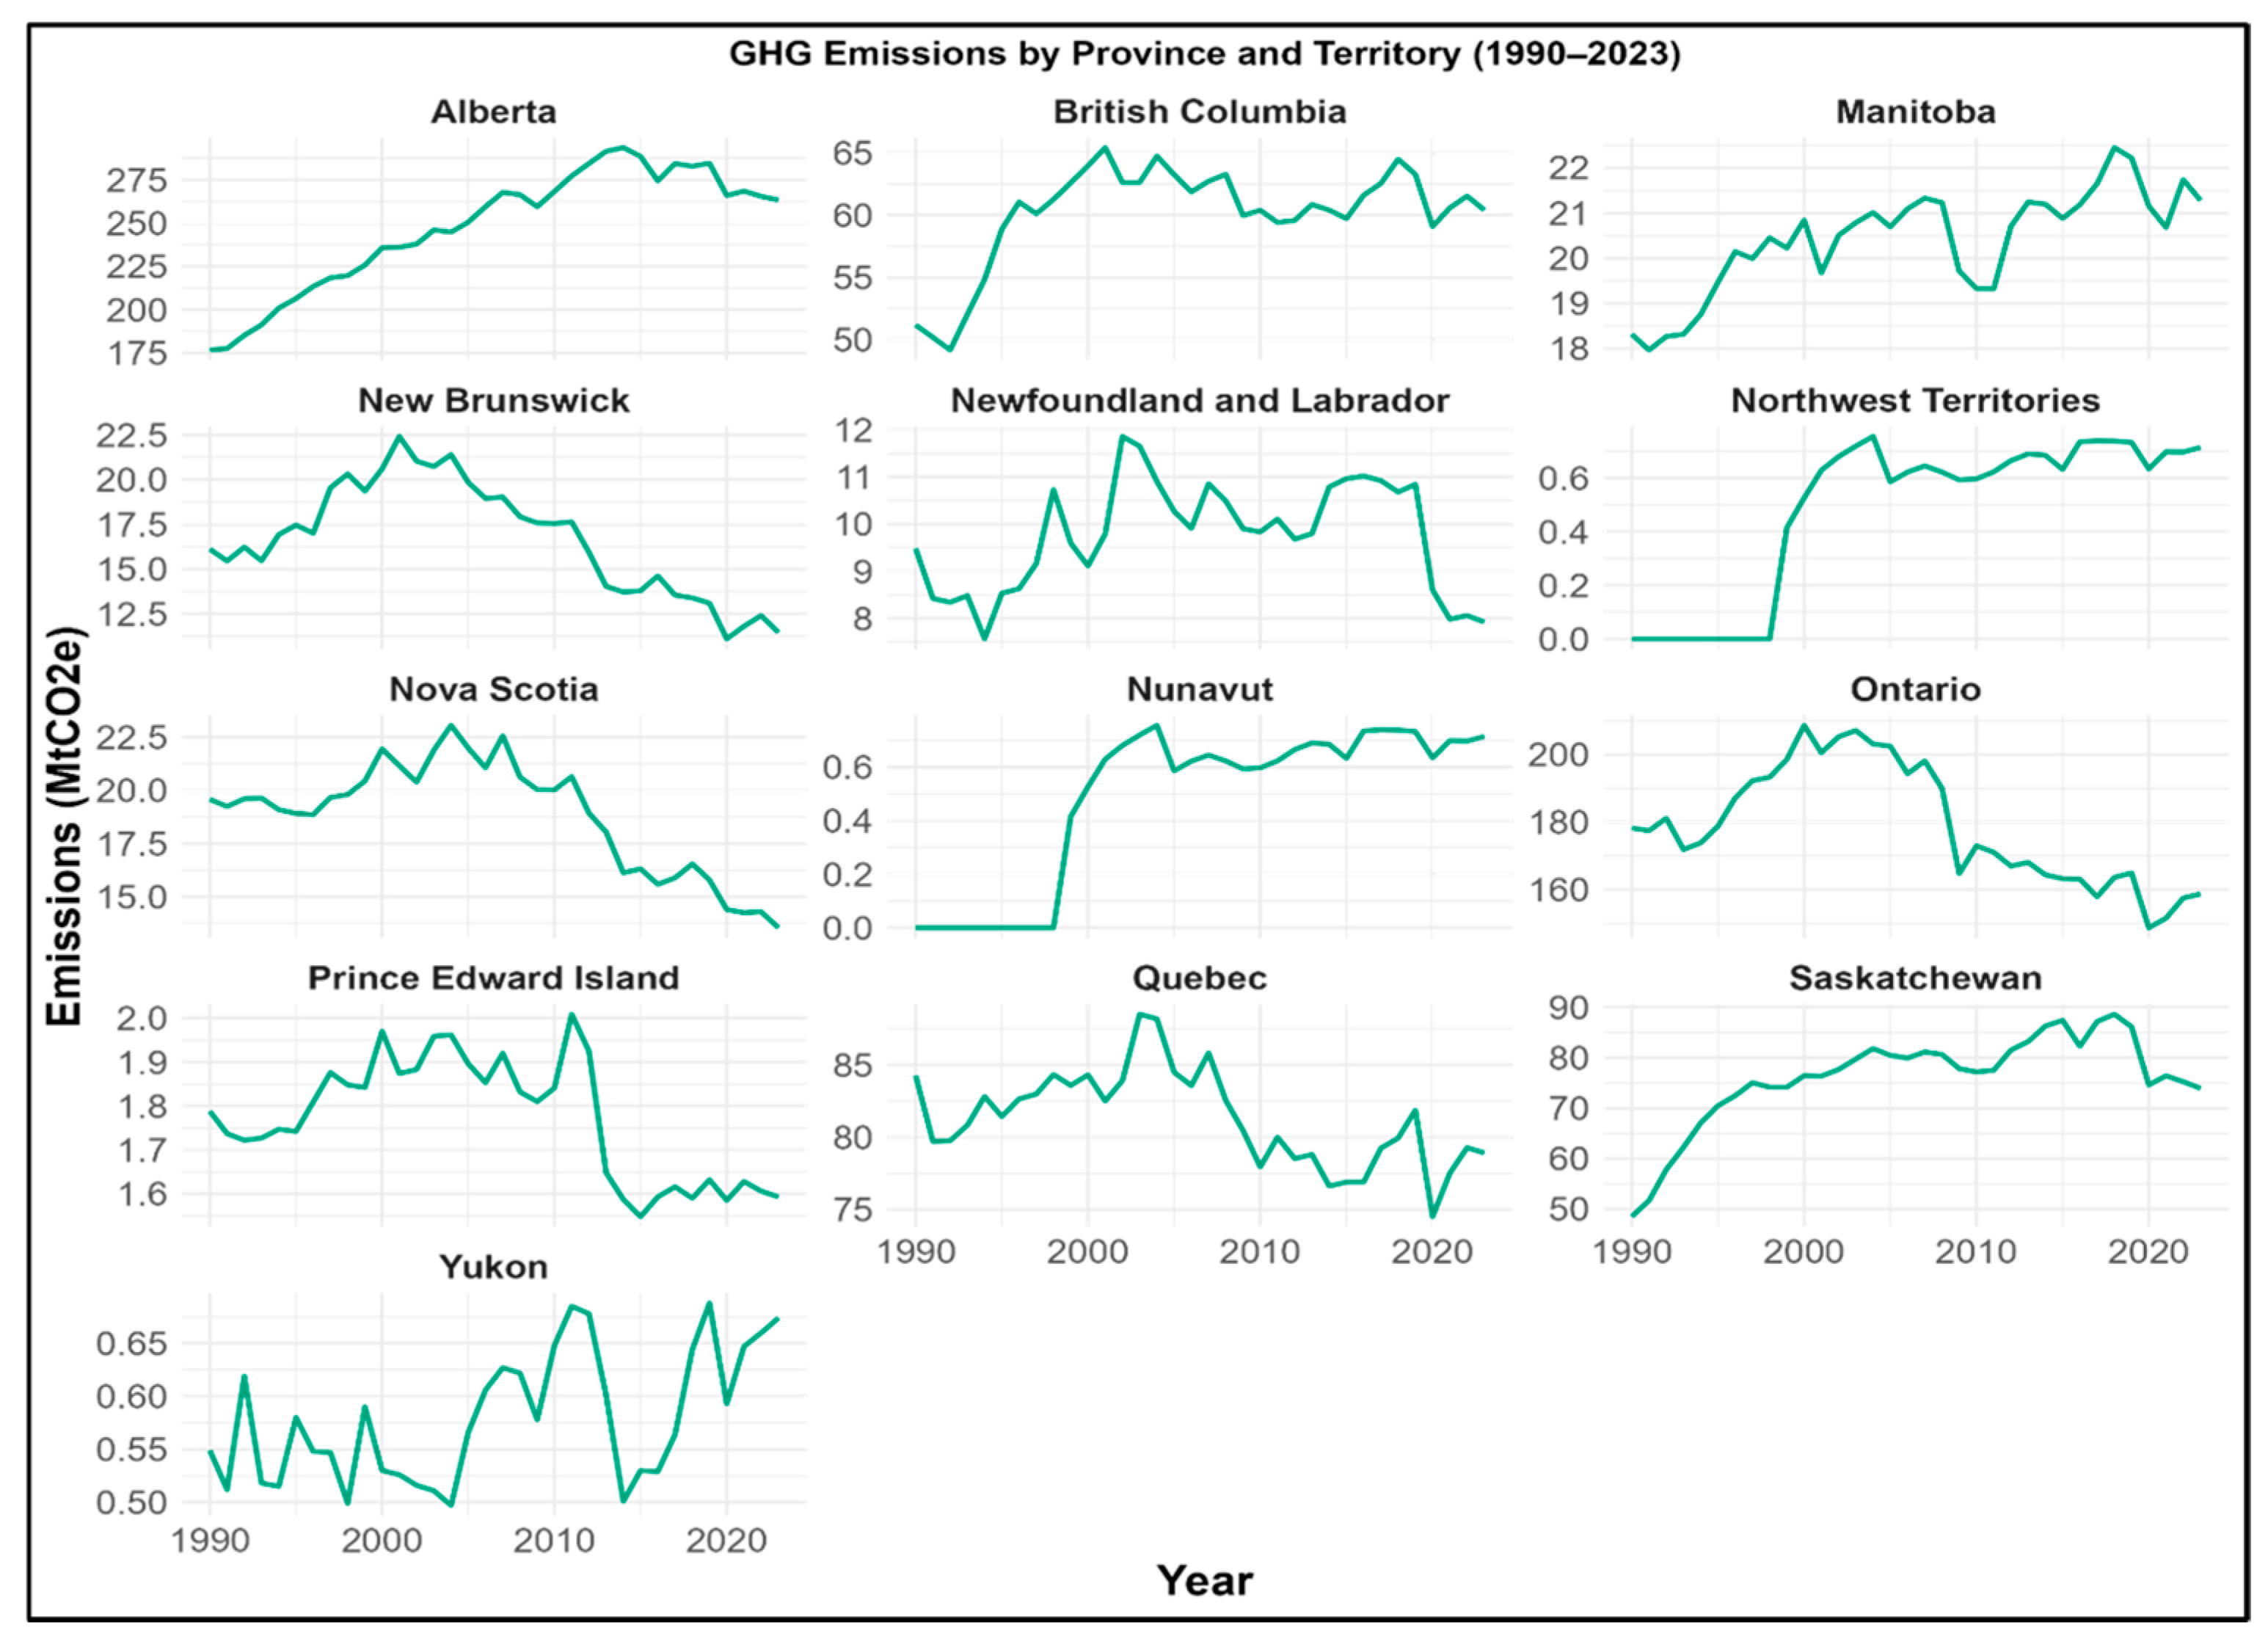
Table 1 shows the provinces’ and territories’ descriptive statistics of GHG emissions. The average GHG emissions for the Prairie provinces between 1990 and 2023 were 244.03 Mt CO
2 eq, 20.40 Mt CO
2 eq, and 75.97 Mt CO
2 eq, for AB, MB, and SK, respectively. During this period, the maximum emissions were 289.48 Mt CO
2 eq, 22.45 Mt CO
2 eq, and 88.61 Mt CO
2 eq for AB, MB, and SK, respectively. The coefficient of variation (CV) was similar in AB and SK at around 12%, whereas that of MB was around 6%. This shows that the economic sectors’ GHG values in AB and SK are more diverse than in MB. For the Central provinces, the average GHG emissions were 81.29 Mt CO
2 eq and 178.80 Mt CO
2 eq for QC and ON, respectively. For the Atlantic provinces, the GHG emissions were 16.69 Mt CO
2 eq, 9.73 Mt CO
2 eq, 18.82 Mt CO
2 eq, and 1.77 Mt CO
2 eq for NB, NL, NS, and PEI, respectively. The maximum emissions were 22.45 Mt CO
2 eq, 11.86 Mt CO
2 eq, 23.06 Mt CO
2 eq, and 2.01 Mt CO
2 eq for NB, NL, NS, and PEI, respectively. With its urban transport and industrial emissions mix, a higher CV in NB (18.81%) suggests more significant heterogeneity than in the NL (11.95%), NS (13.93%), and PEI (7.75%) emission profiles. The average emissions from the three territories are 0.65 Mt CO
2 eq and 0.58 Mt CO
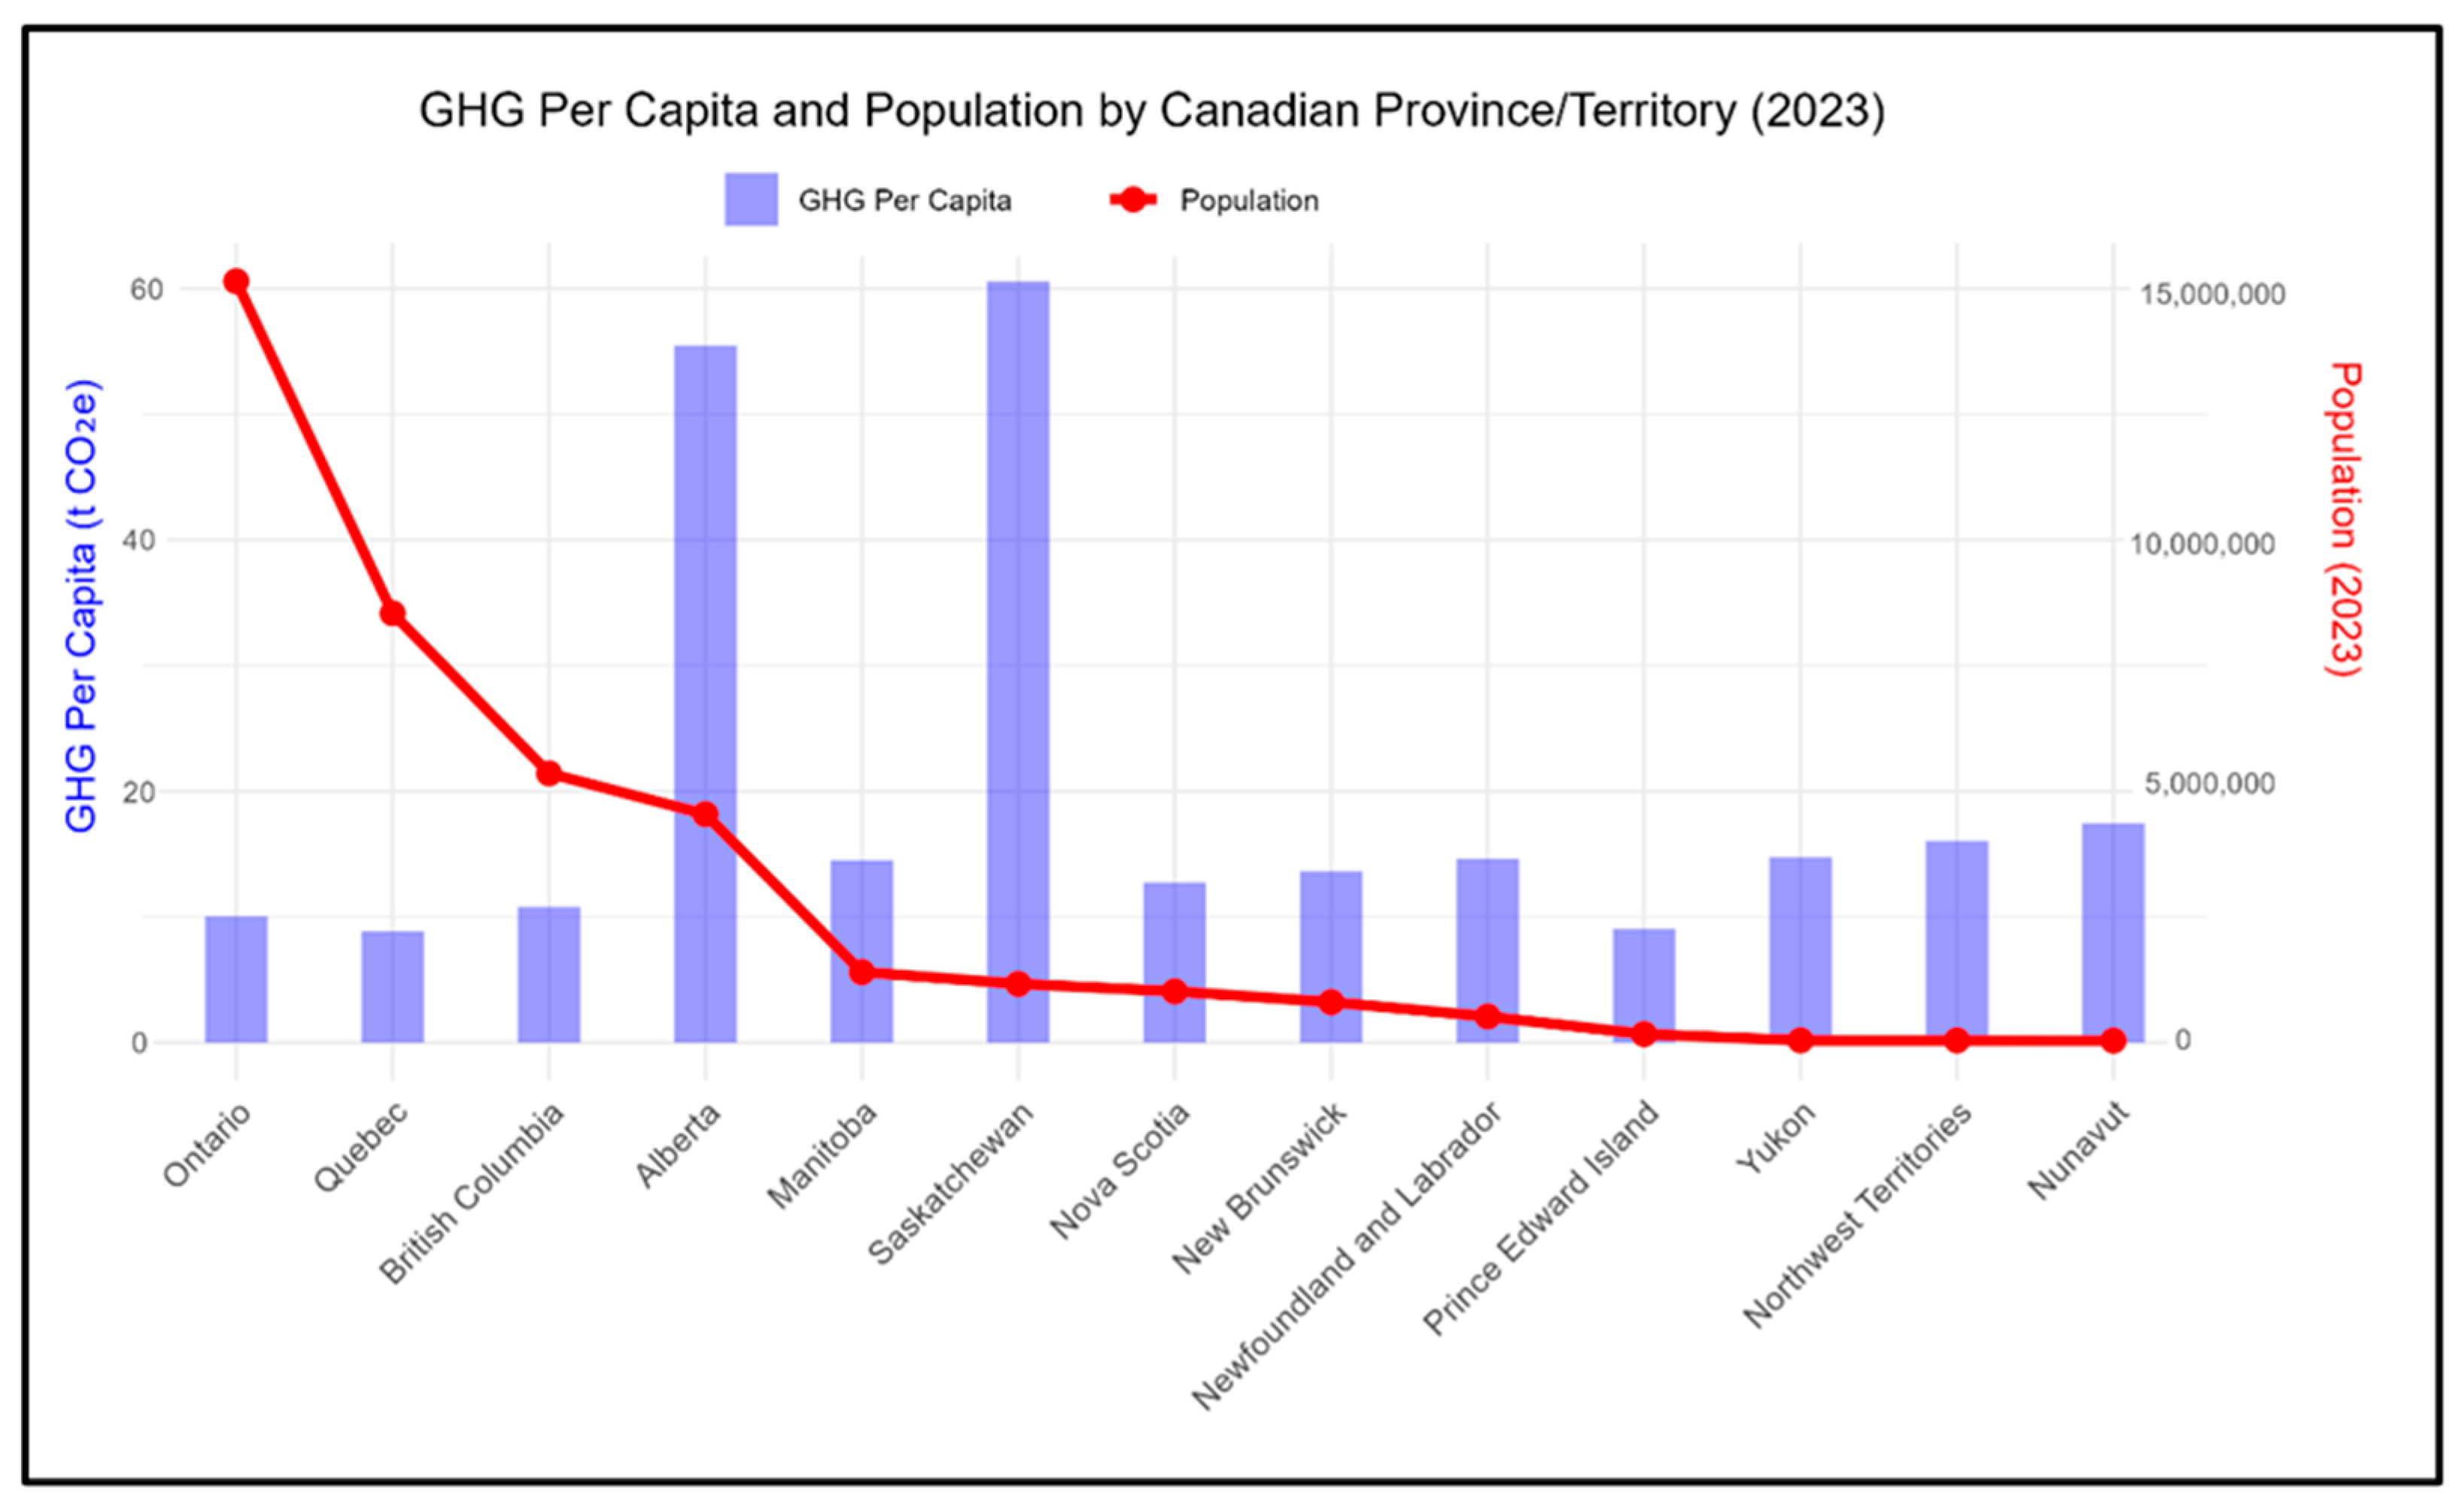
2 eq for NT and NU and YU, respectively. Compared to other provinces, the GHG emissions from these jurisdictions are minimal due to demographic, economic, geographic, and infrastructural factors. The combined population of the three territories is approximately 126,000, which is less than 0.3% of Canada’s total. Therefore, population-driven emissions from the transportation, industry, and energy sectors will be very low. In addition, emissions from agriculture will be low or non-existent due to the Arctic climate, a vast area that limits farming practices, thereby reducing GHG emissions such as methane or N
2O. These descriptive statistics of GHG emission profiles above revealed significant provincial and regional variabilities, supporting targeted mitigation strategies across the country.
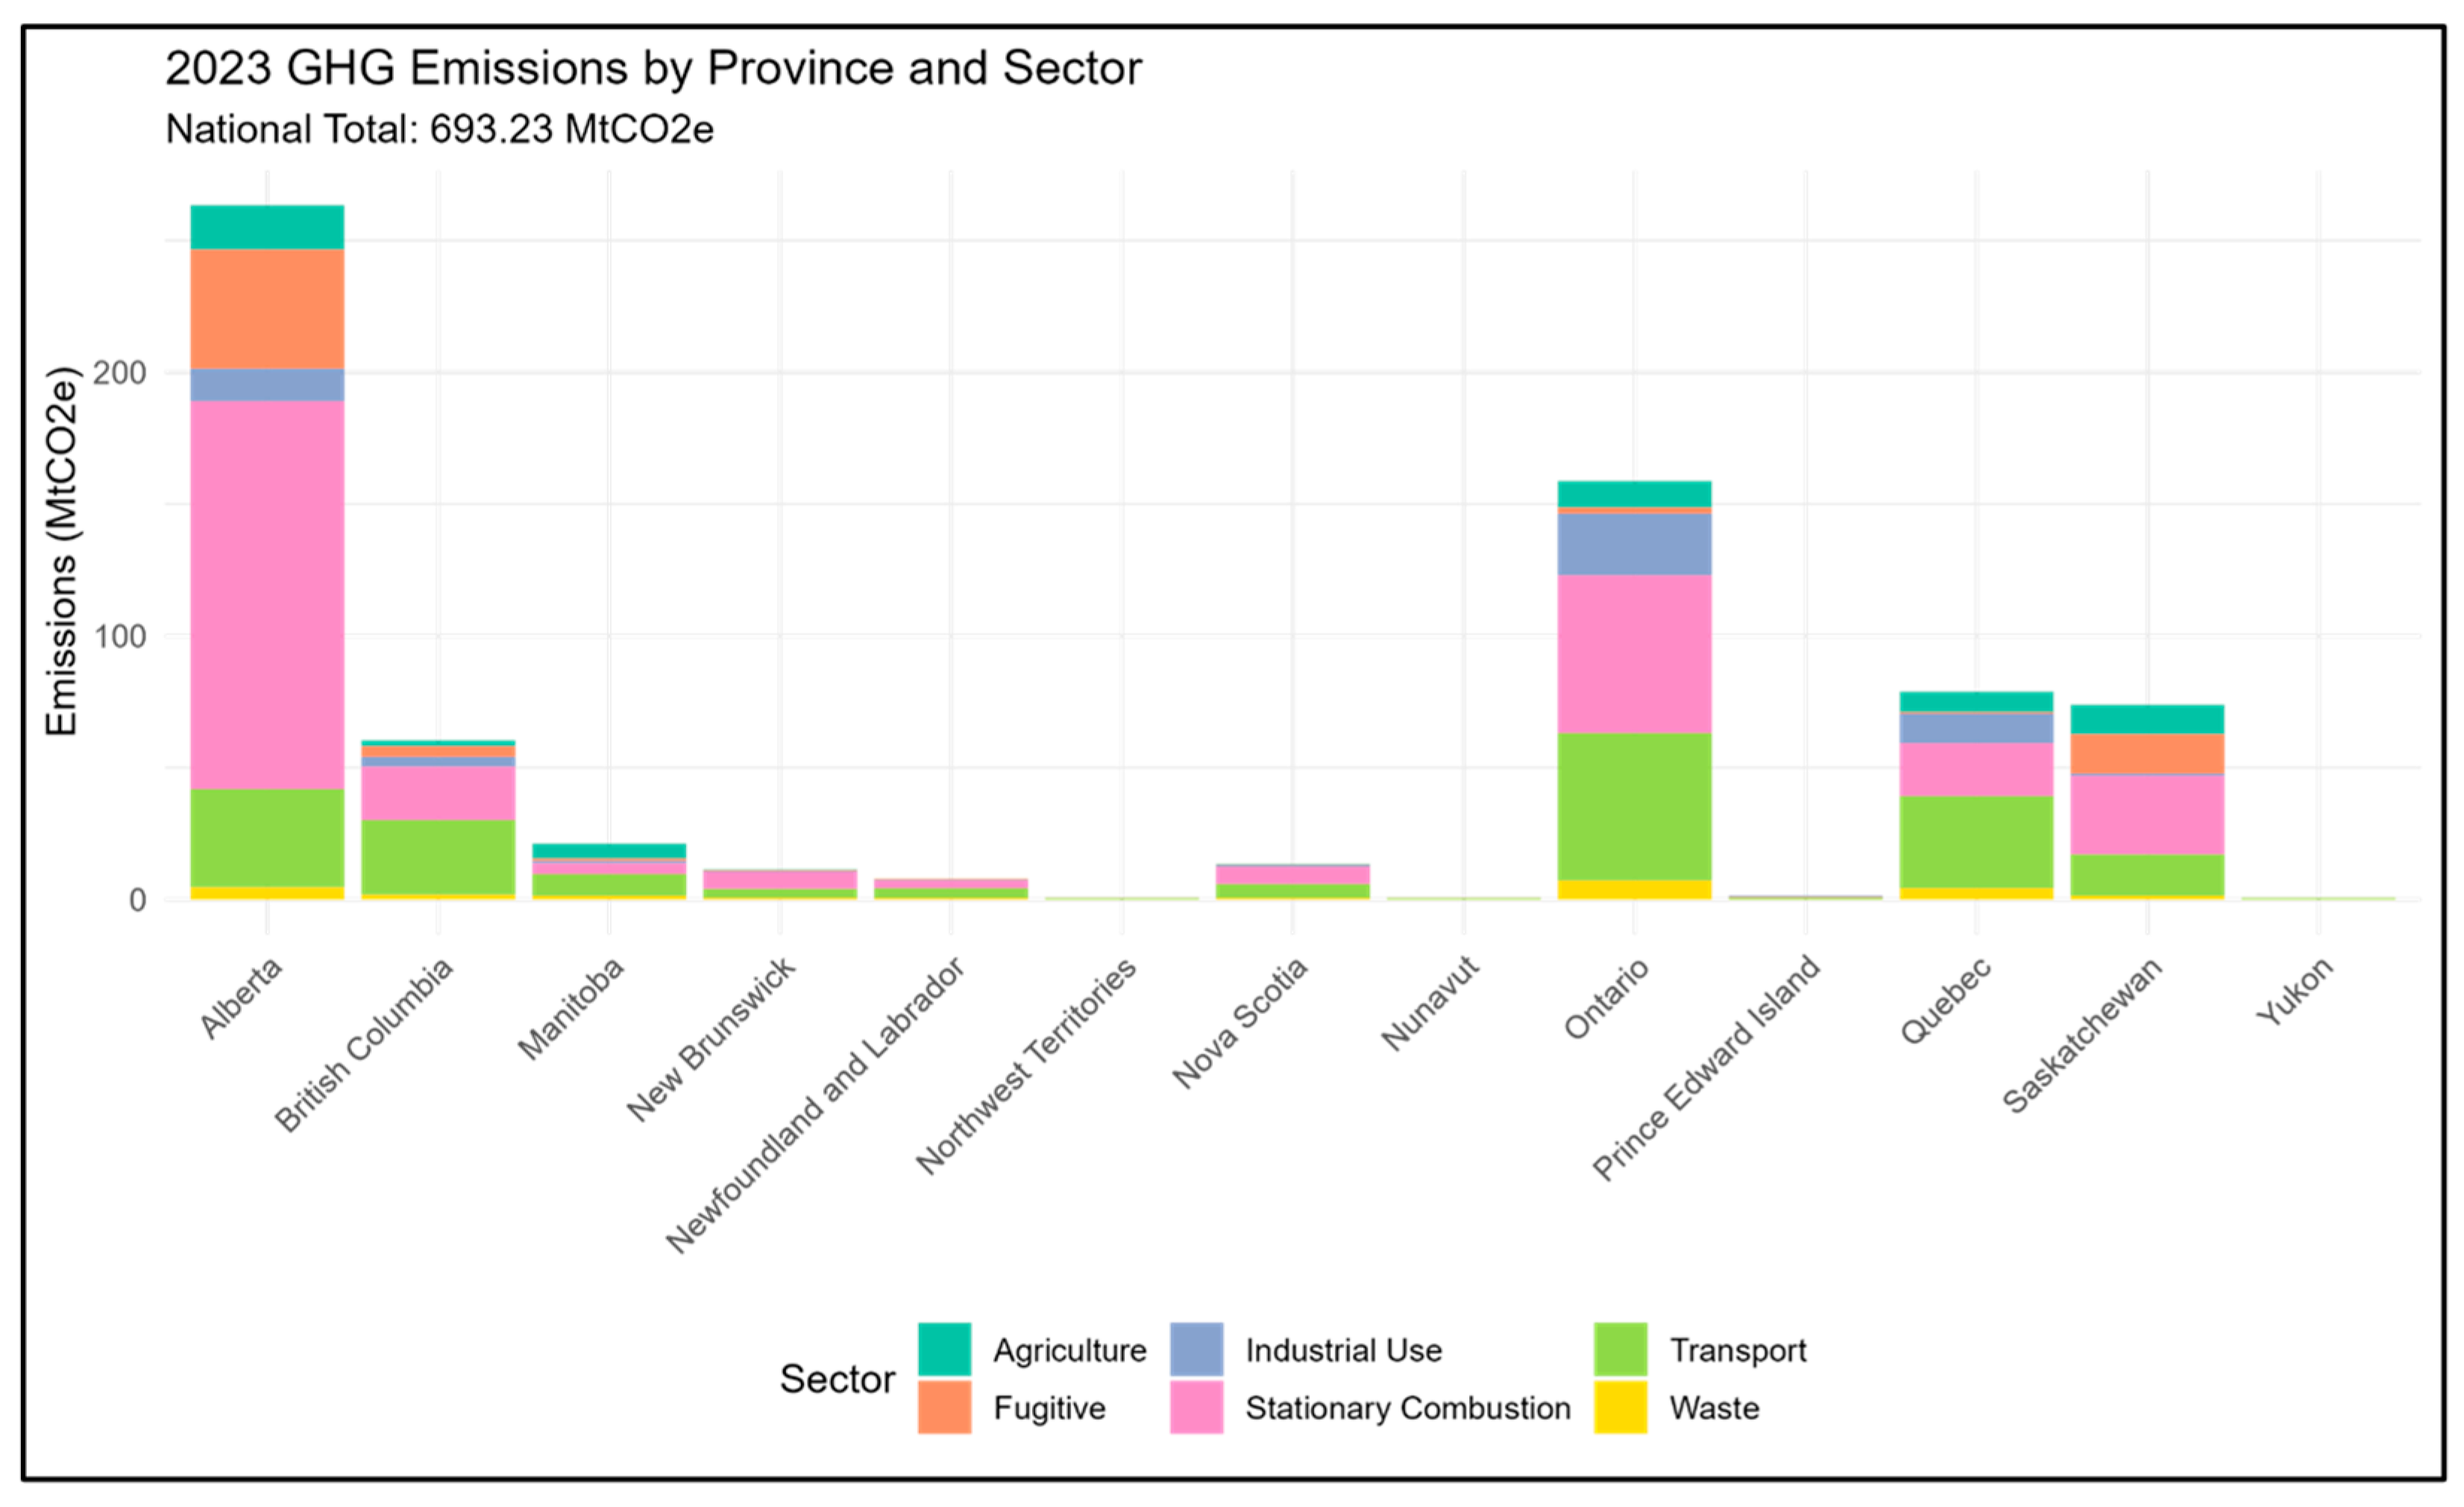
Table 2 shows the GHG emissions from the Canadian economic sector. For the entire country, the GHG emissions for agriculture, fugitive, industrial use, stationary combustion, transport, and waste are 52.08 Mt CO
2 eq, 88.62 Mt CO
2 eq, 54.80 Mt CO
2 eq, 313.63 Mt CO
2 eq, 180.80 Mt CO
2 eq, and 19.30 Mt CO
2 eq, respectively. Maximum and minimum emissions indicate the range of emission sources within each sector. The stationary combustion high maximum (352.81 Mt CO
2 eq), which is from petroleum refining industries, oil and gas extraction, public electricity and heat production, etc., contrasts with waste (20.58 Mt CO
2 eq), which is from the treatment and disposal of liquid and solid wastes and indicates a relatively minor role in Canada’s GHG emissions total. Transport (mean: 180.80 Mt CO
2 eq) and fugitive emissions (Mean: 88.62 Mt CO
2 eq) are significant contributors, followed by industrial use and agriculture. Industrial use and waste have similar CVs (4.66% and 4.17%), which means that the proportional uncertainty or variability in their emission measurements and generation is similar across the country.
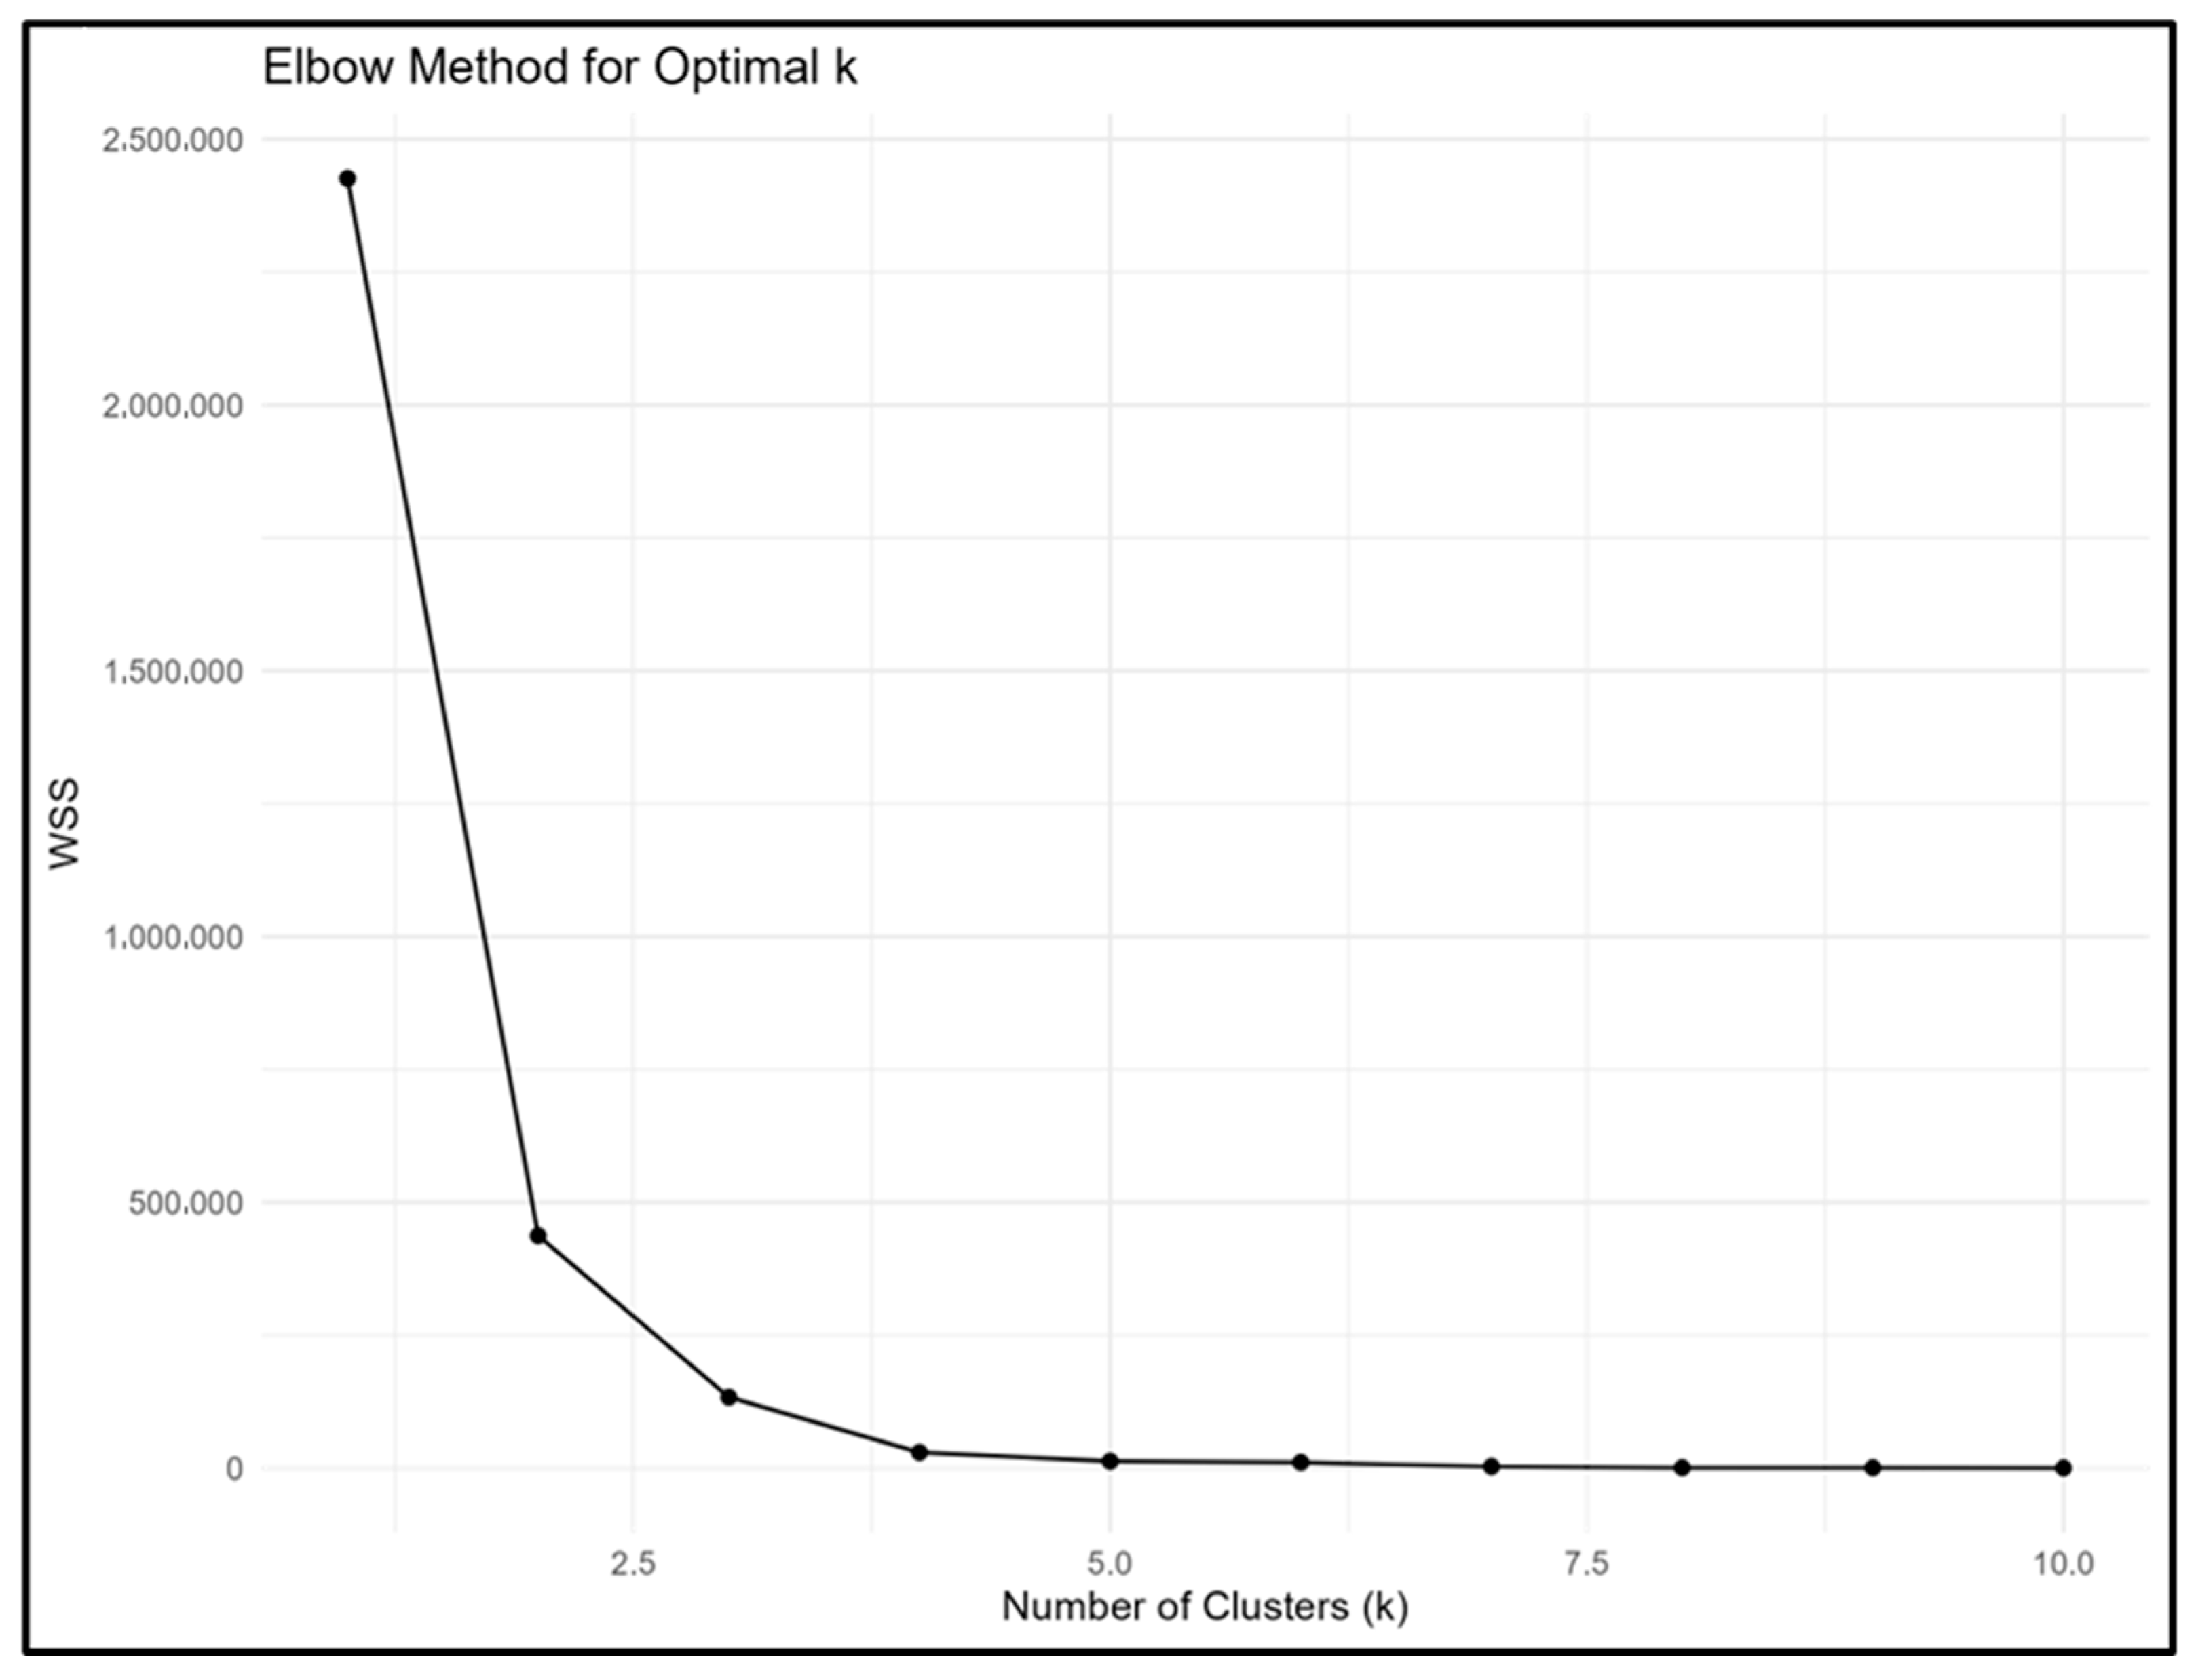
3.3. K-Means and Selection of the Optimal Number of Clusters
The machine learning technique (K-means) was used to cluster the total GHG emissions profile from all the jurisdictions.
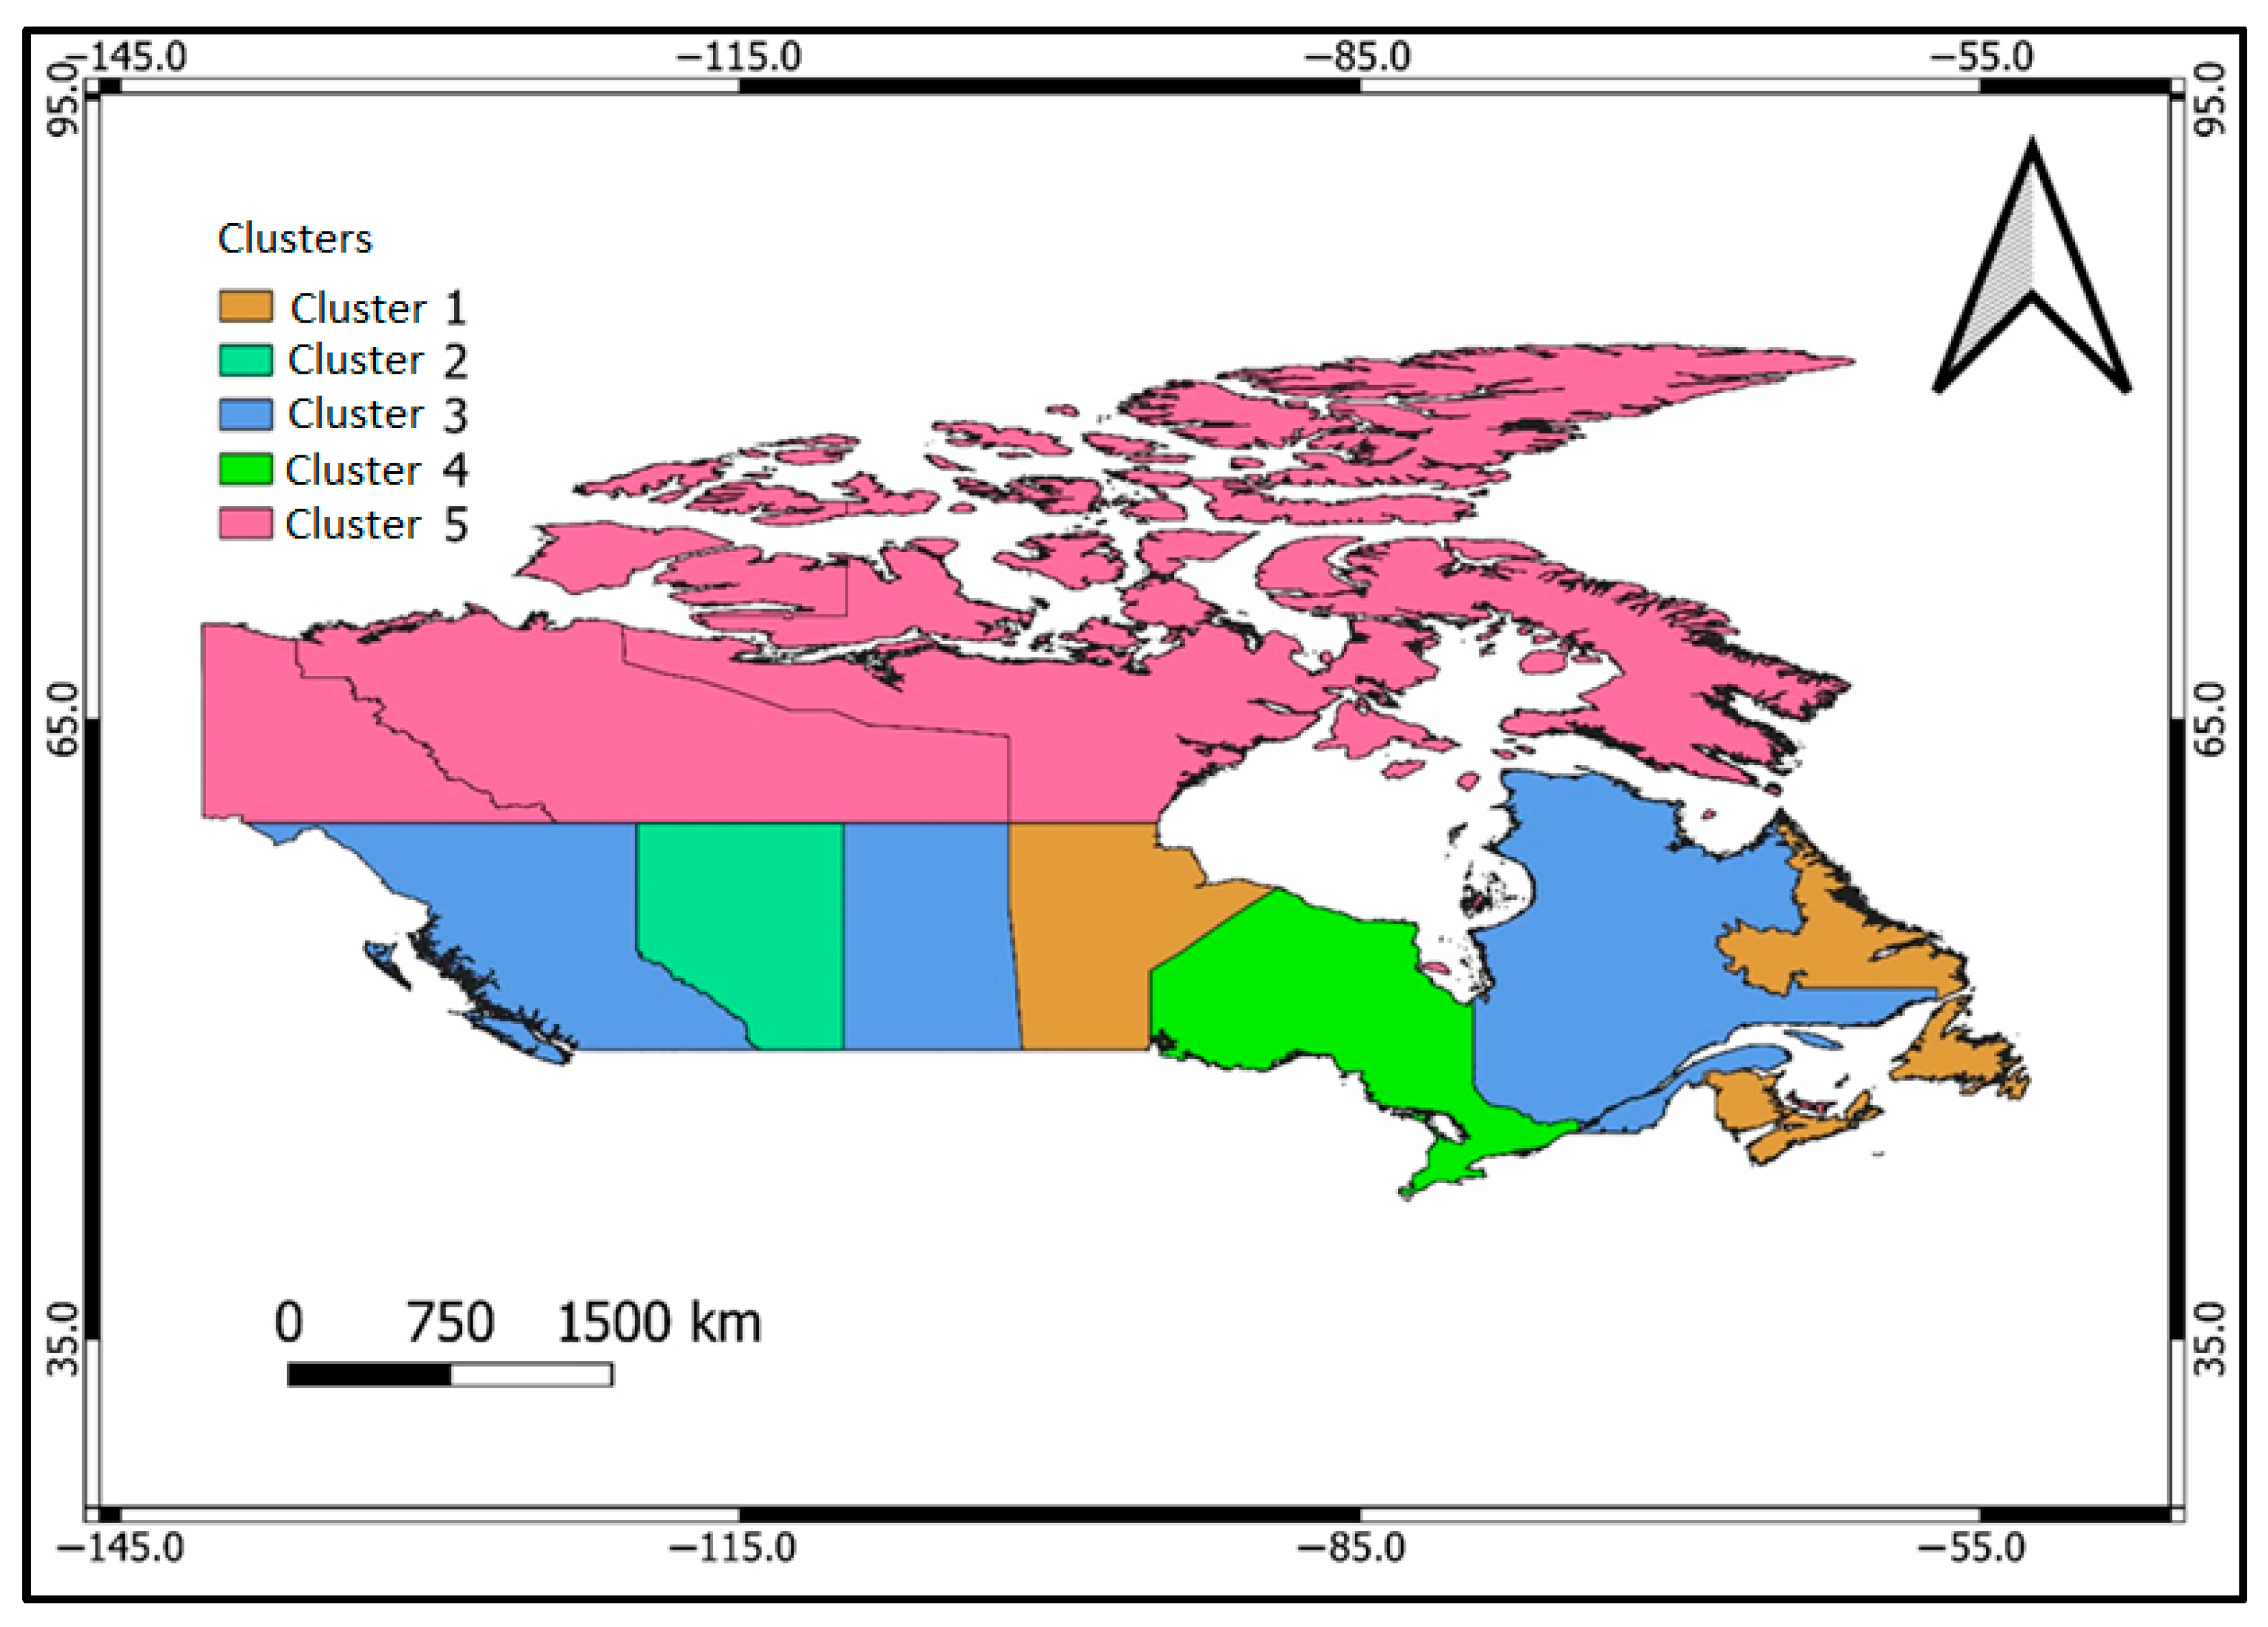
Figure 5 shows the plot of WSS and the potential number of clusters. WSS shows the compactness of variance within each cluster, meaning that a low value indicates that the GHG data points within each cluster are closer to their respective centroids, suggesting compact, more cohesive clusters. The Elbow method is used to determine the optimal number of clusters to cut off. There is a clear, pronounced, sharp descent at Cluster 5. Beyond this number, there seems to be no more descent. Therefore, five clusters are determined for Canada’s jurisdiction. The five clusters were mapped back to the respective provinces/territories, as shown in
Figure 6. The five clusters derived from the analysis are identified as follows:
Cluster 1: MB, NB, NS, and NL
Cluster 2: AB
Cluster 3: QC and SK
Cluster 4: ON and
Cluster 5: PEI, NT, NU, YK
From the clusters identified above, the highest emitters (Cluster 2 and Cluster 4) are partitioned separately. At the same time, all the intermediate emitters are partitioned separately (Clusters 3 and 1), while the smallest emitters are grouped (Cluster 5). These clusters are realistic as they reflect the GHG emissions of the provinces/territories. The following section will now focus on applications of CMI stabilization wedges to proportions of the GHG emissions required to be reduced by each province-specific sector.
- (a)
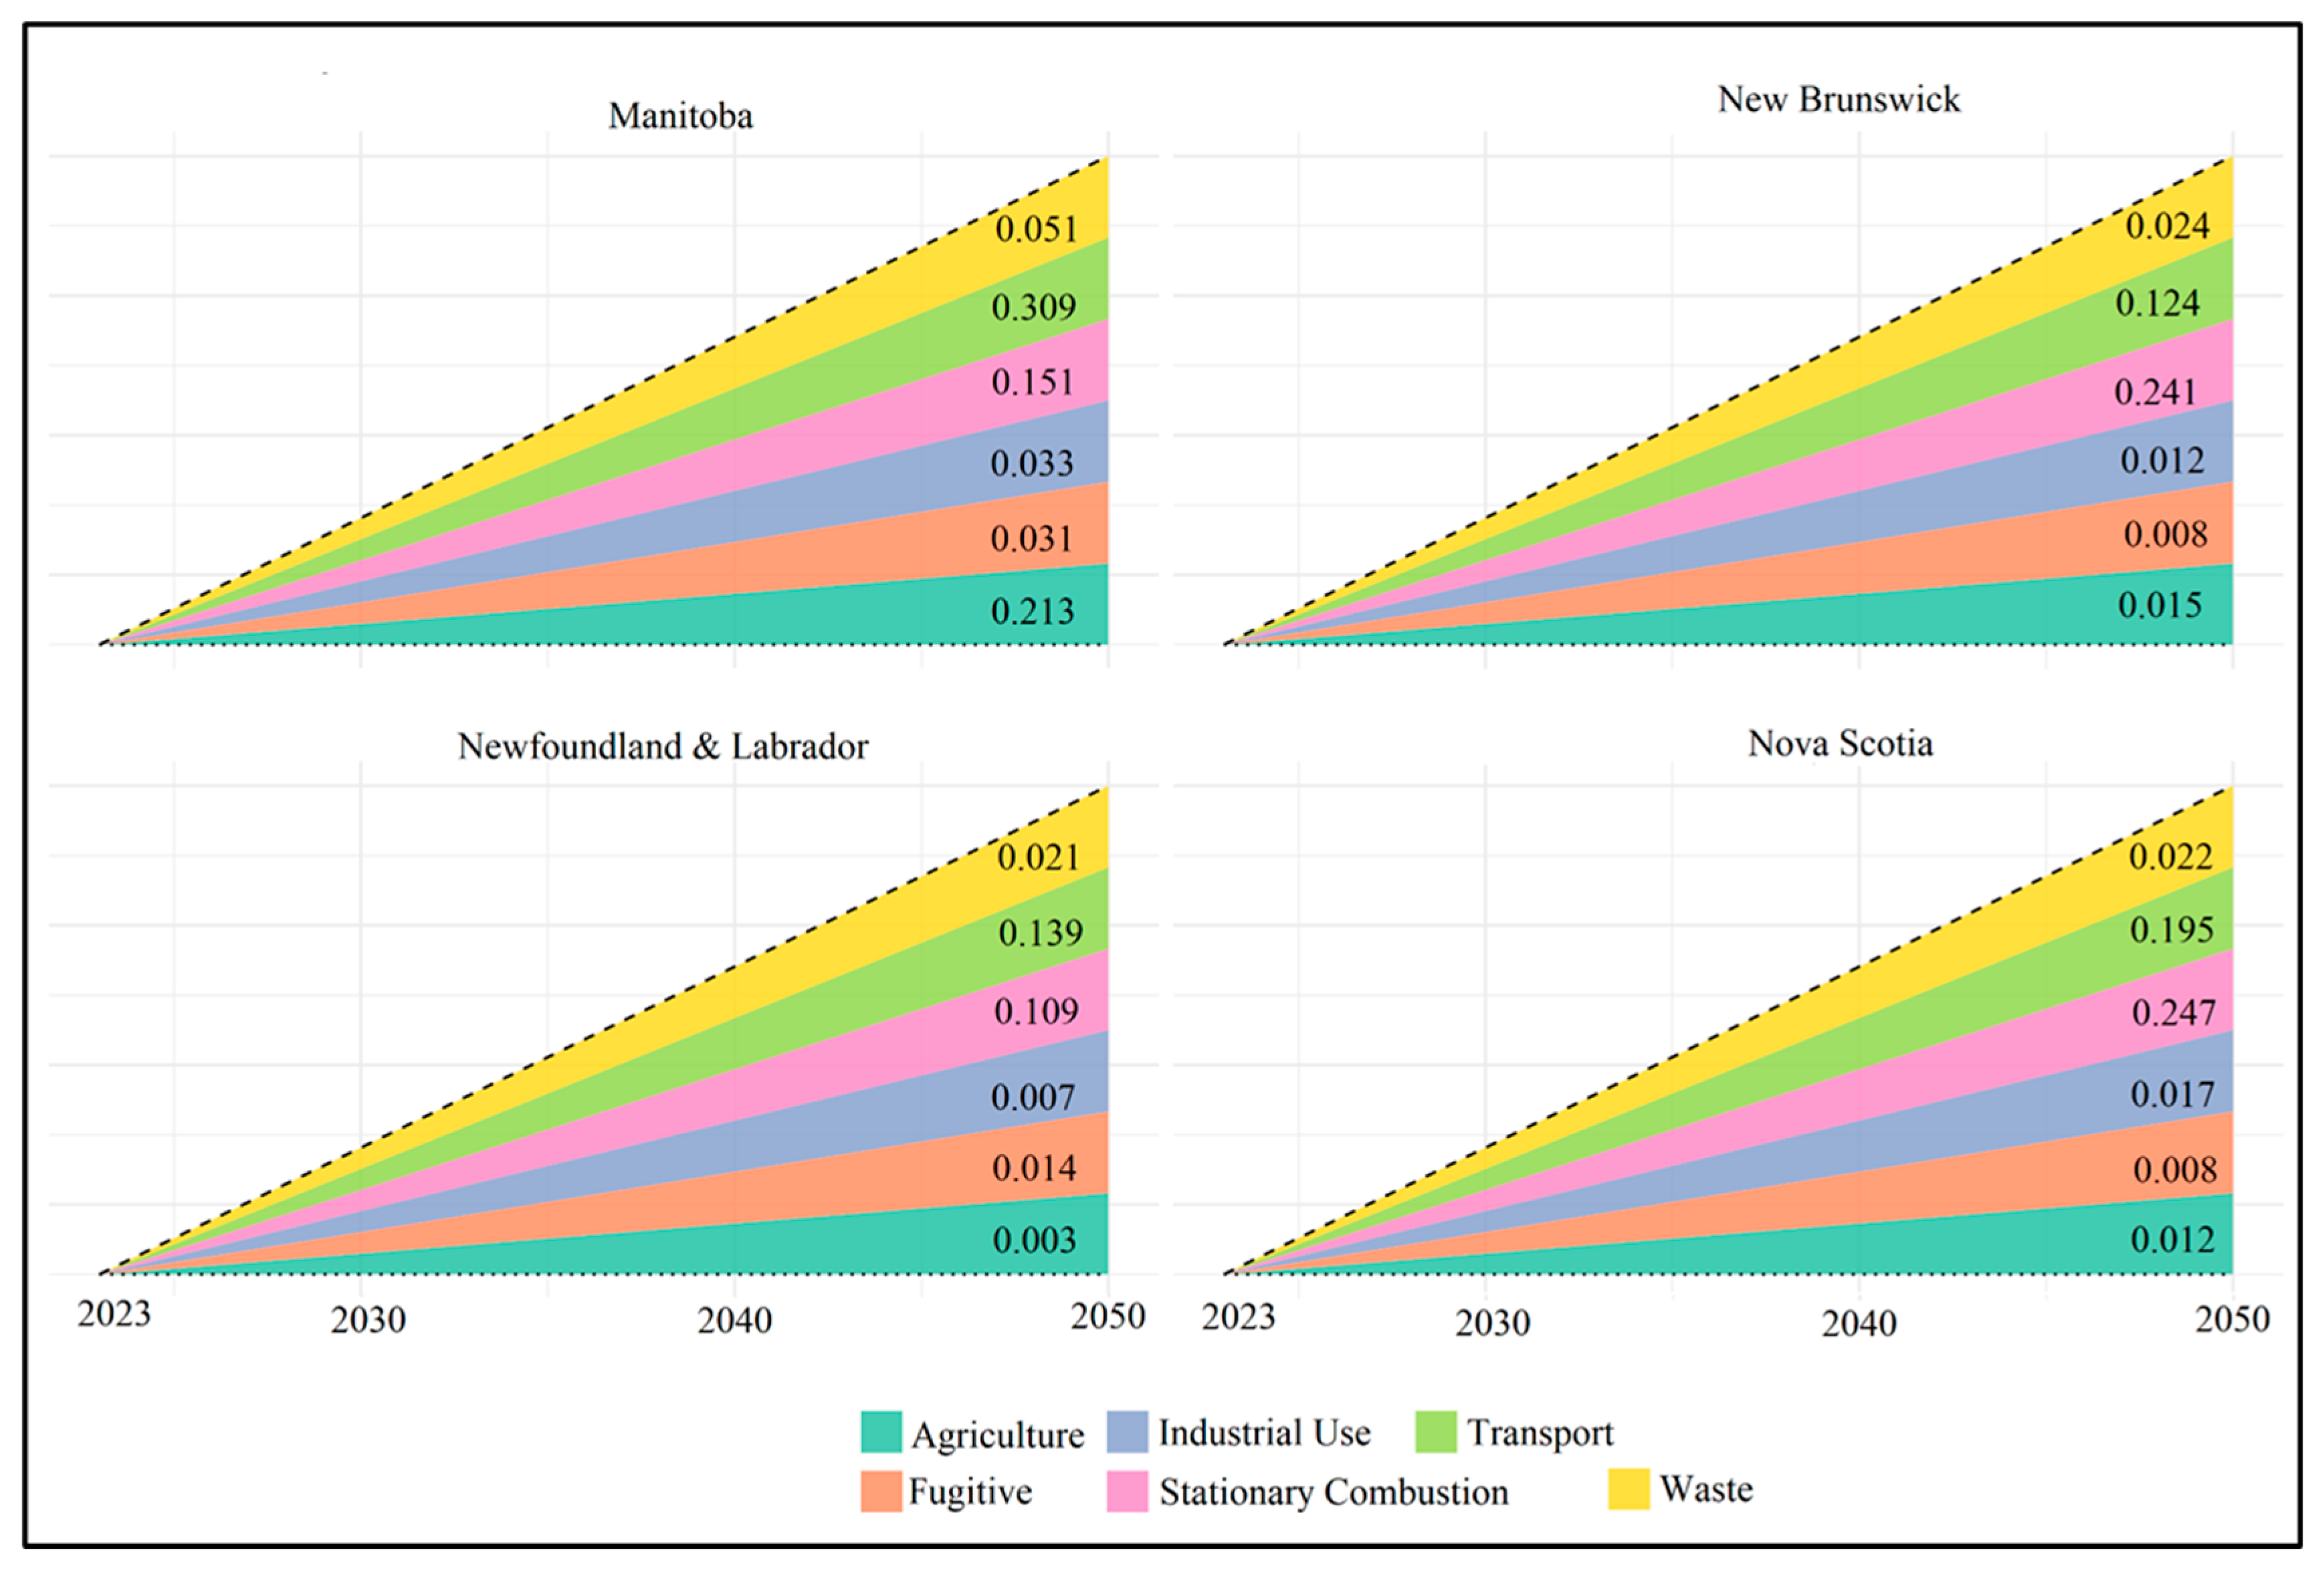
Cluster 1: Manitoba, New Brunswick, Nova Scotia, Newfoundland and Labrador, and Carbon Mitigation Initiative’s Stabilization Wedge Application
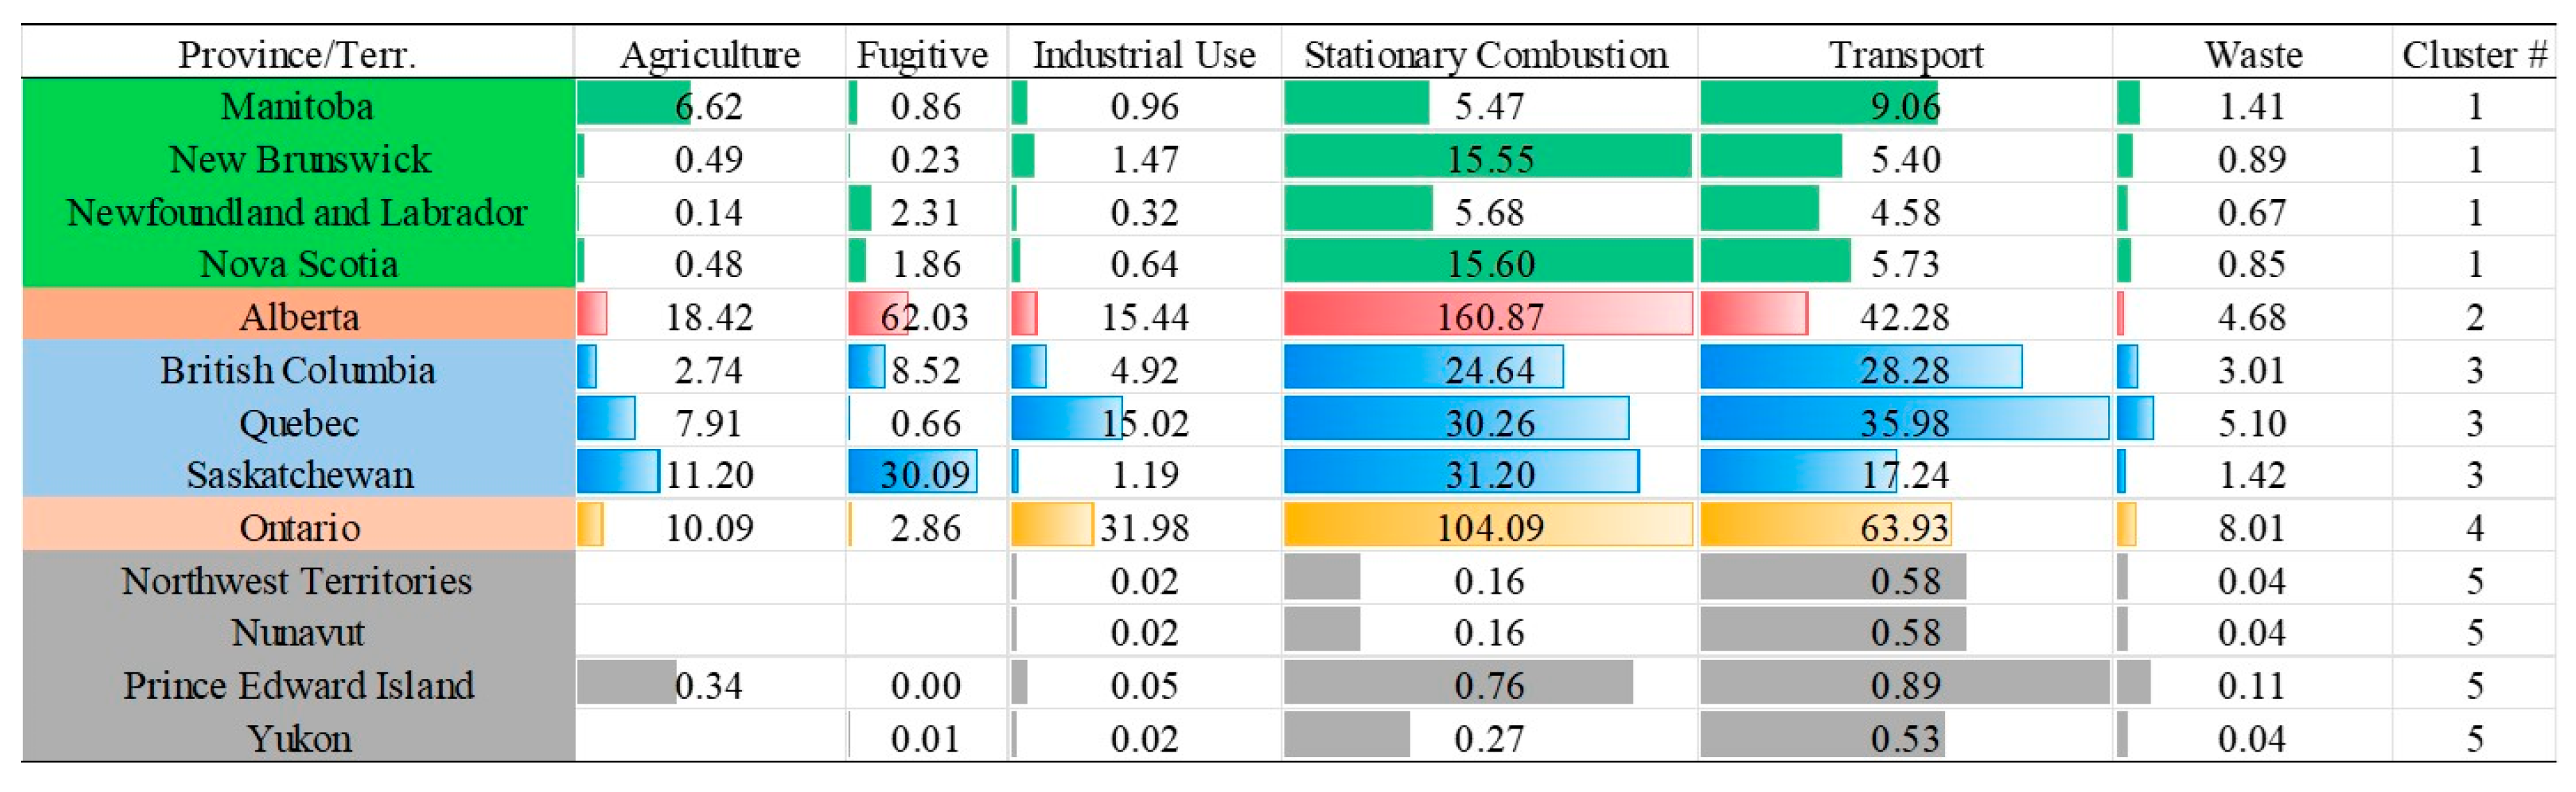
Figure 7 shows Cluster 1’s moderate emissions hotspot, which is dominated by stationary combustion (15.56 Mt CO
2 eq. and 15.55 Mt CO
2 eq.) and transportation (9.06 Mt CO
2 eq.) in NS, NB, and MB, reflecting reliance on vehicles and freight across the Atlantic provinces and Manitoba’s mixed economy. Considering the GHG emissions reductions (
Figure 8) needed to reach net-zero and the associated actionable climate solutions required for MB, in the transport sector (0.309 Mt CO
2 eq/year), incentives need to be provided for EV purchases and to increase rural charging stations targeting Winnipeg’s urban vehicles. In agriculture (0.213 Mt CO
2 eq/year), precision agriculture could use soil moisture, nutrient sensors, and variable-rate technology to reduce fertilizer emissions. For stationary combustion (0.151 Mt CO
2 eq/year), the energy efficiency protocol could include retrofitting public buildings and homes with geothermal heating systems. Waste (0.051 Mt CO
2 eq/year) reduction could include implementing composting and biogas facilities to reduce landfill methane. Industrial Use (0.033 Mt CO
2 eq/year) reduction potentials could involve adopting cleaner production techniques in manufacturing (e.g., food processing). Reducing fugitive (0.031 Mt CO
2 eq/year) emissions could include methane capture and utilization through installing methane capture at wastewater treatment plants. NB’s emissions reductions in stationary combustion sources (0.241 Mt CO
2 eq/year) could include replacing oil-fired power with biomass and tidal energy while leveraging local resources. Furthermore, more electric bus fleets and carpooling programs must be promoted in the transport sector, where 0.124 Mt CO
2 eq/year must be cut. By developing regional waste-to-energy plants to process municipal waste, waste-to-energy systems can be implemented in the waste sector, where 0.025 Mt CO
2 eq/year is required to reach net-zero. In the agriculture sector, sustainable livestock management involves methane inhibitors for cattle, and rotational grazing will drastically reduce the 0.015 Mt CO
2 eq/year emissions. Process optimization techniques include optimizing refinery and pulp mill operations with energy-efficient equipment or real-time energy usage monitoring, which could help reduce the 0.012 Mt CO
2 eq/year in the industrial use sector. GHG emissions from fugitive sources (0.008 Mt CO
2 eq/year) could be reduced through capturing methane from small-scale industrial leaks. For NL, emissions from stationary combustion and transport dominate, and strategies similar to those of NB can also be implemented for the economic sectors. Renewable microgrids can support fishing vessels and ferries to cut the 0.139 Mt CO
2 eq/year required in the transport sector. Furthermore, emissions from stationary combustion sources (0.109 Mt CO
2 eq/year) can be reduced through a transition to renewable energy, such as expanding the hydroelectric capacity (e.g., Muskrat Falls) to replace diesel generators. The emission reductions required in the waste sector (0.021 Mt CO
2 eq/year) can be achieved through developing small-scale anaerobic digesters for remote communities. Methane from offshore oil platforms, upgrading fish processing plants with low-emission technologies, and optimizing small-scale farming with methane-reducing practices can help cut 0.014 Mt CO
2 eq/year, 0.007 Mt CO
2 eq/year, and 0.003 Mt CO
2 eq/year emissions from fugitive, industrial use, and agriculture, respectively.
- (b)
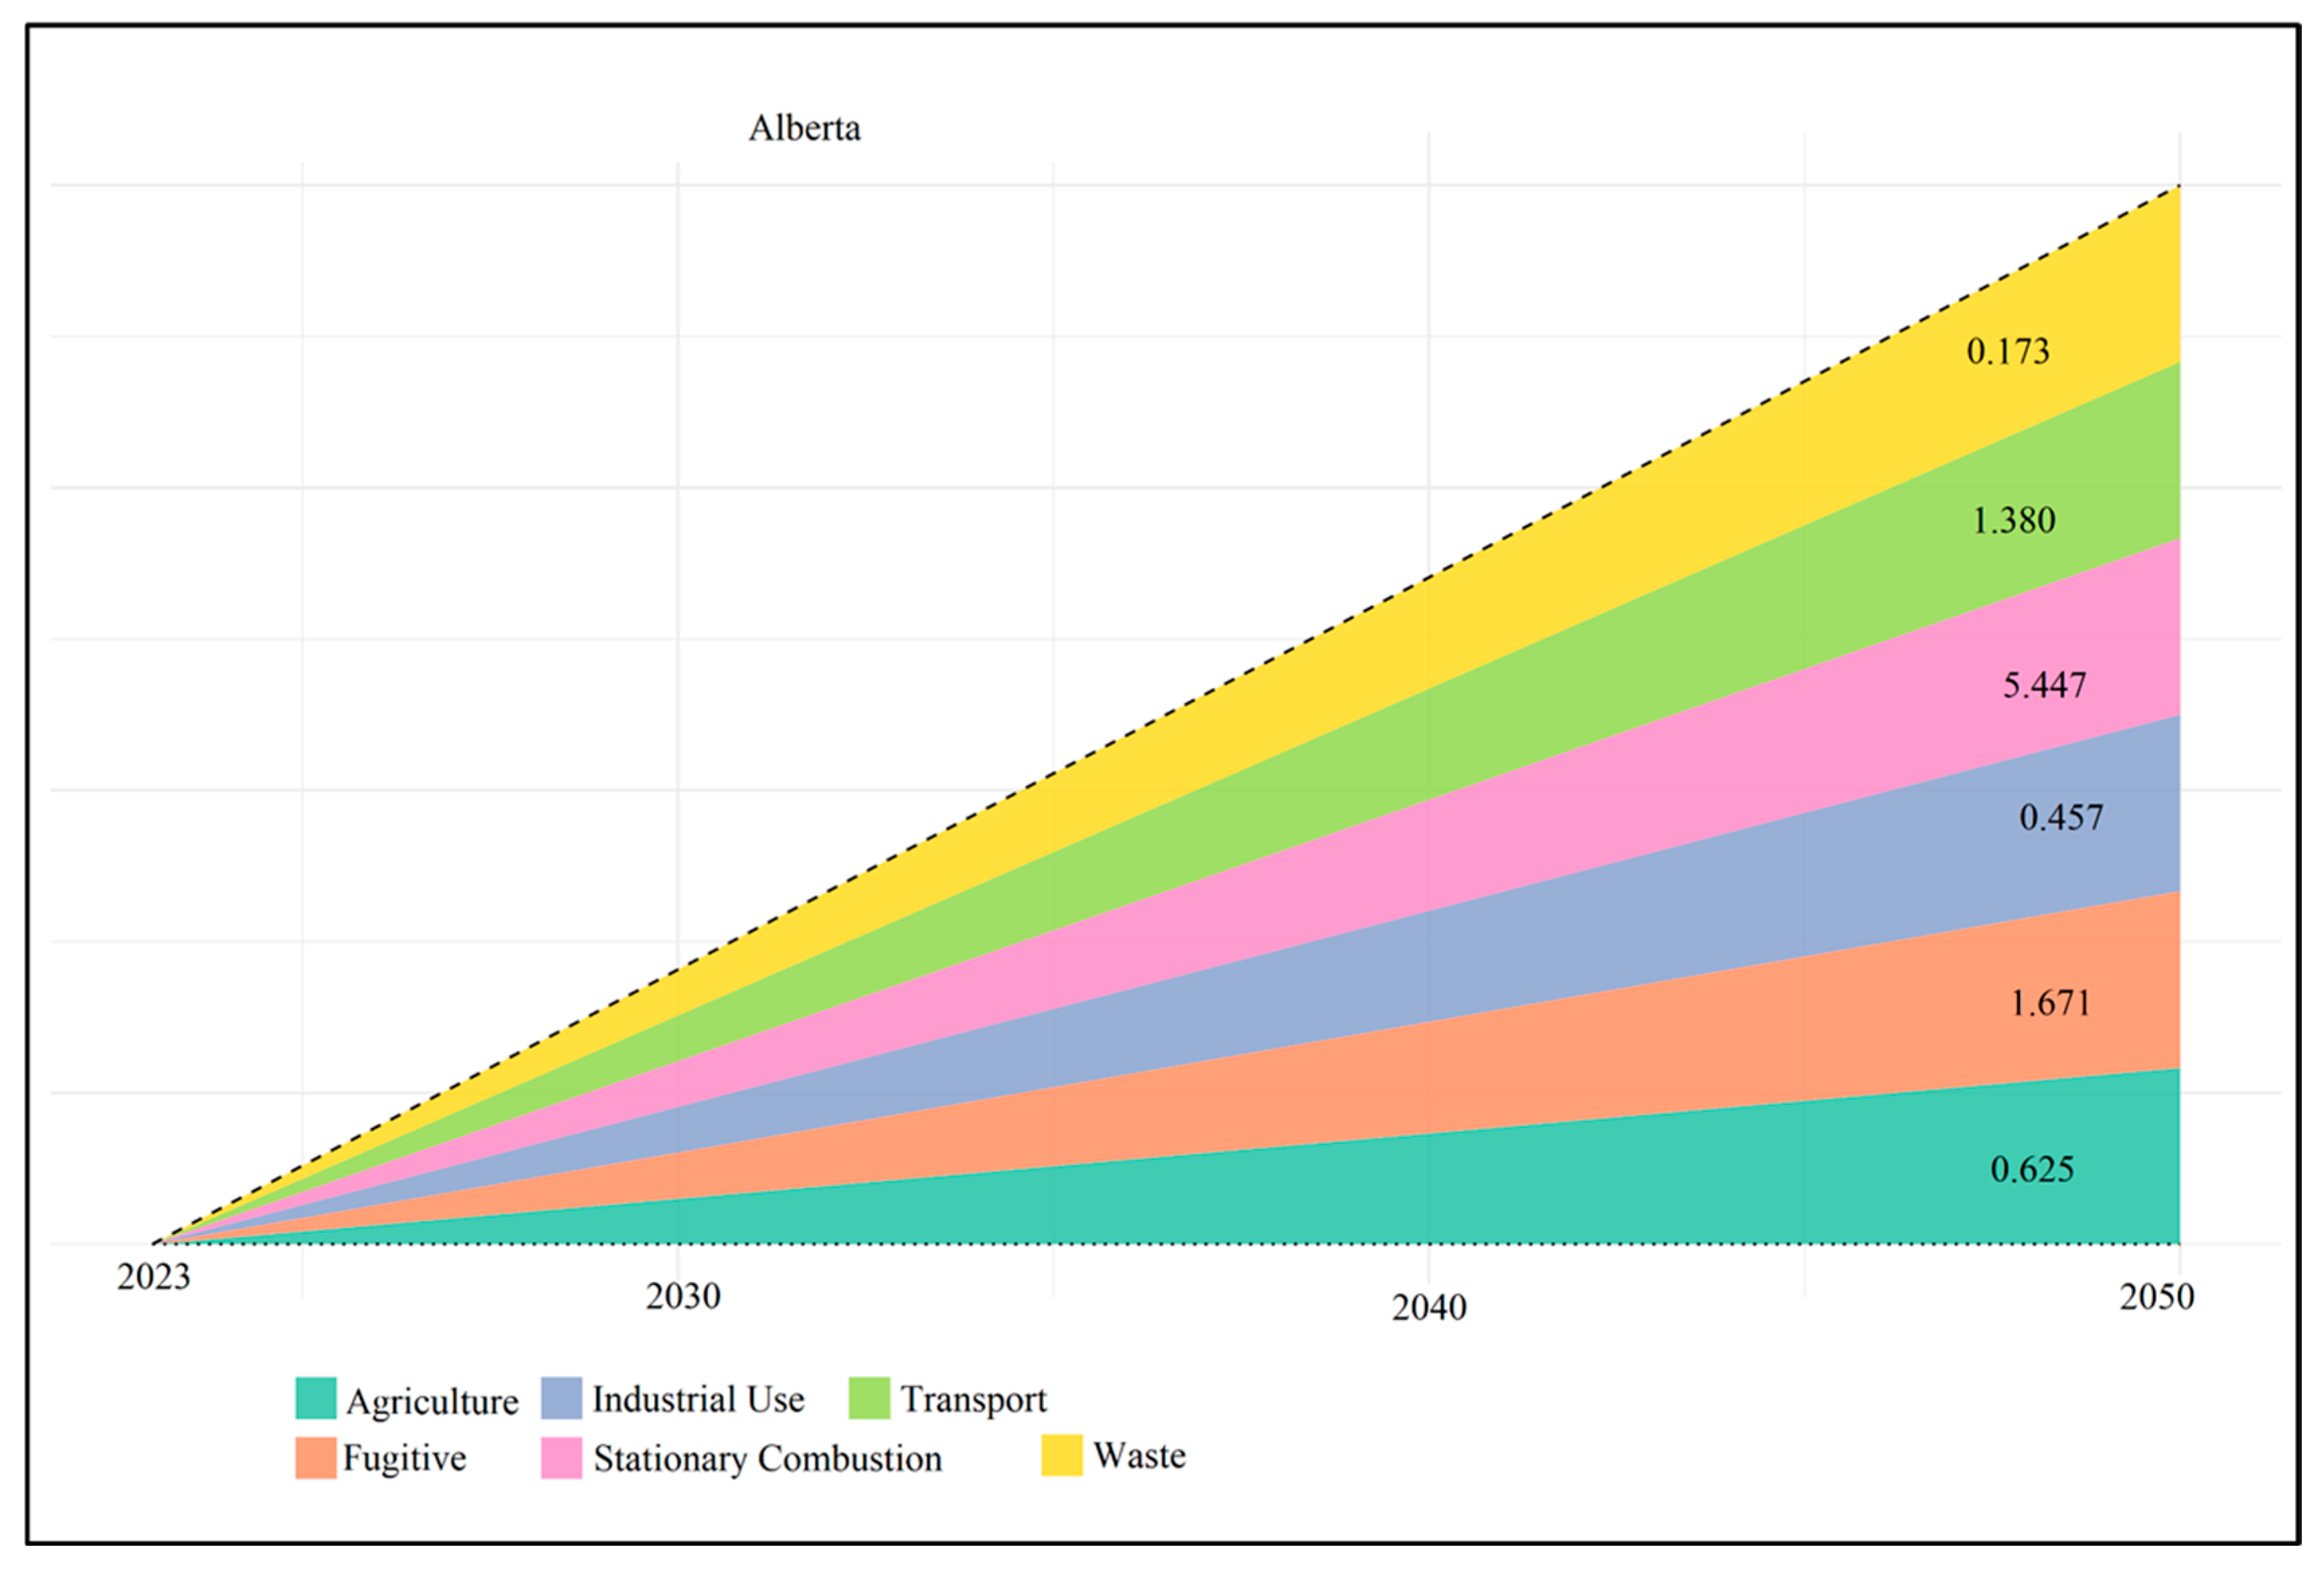
Cluster 2: Alberta GHG Emissions Standalone Cluster and Carbon Mitigation Initiative’s Stabilization Wedge Application
This is a standalone cluster, which is an indication of AB’s outsized GHG emissions. As shown in
Figure 4, this cluster is dominated by stationary combustion and transport, having maximum GHG emissions of 160.87 Mt CO
2 eq., 62.03 Mt CO
2 eq., and 42.28 Mt CO
2 eq. for stationary combustion, fugitive, and transport, respectively. These relatively large emissions are due to varied emission sources such as oil sands and natural gas facilities (ECCC, 2025). The annual GHG emissions reduction target required for AB includes 0.173 Mt CO
2 eq., 1.380 Mt CO
2 eq., 5.447 Mt CO
2 eq., 0.457 Mt CO
2 eq., 1.671 Mt CO
2 eq., and 0.625 Mt CO
2 eq. for waste, transport, stationary combustion, industrial use, fugitive, and agriculture, respectively (
Figure 9). The five CMI stabilization wedges suggested to meet these reduction targets include a transition to renewable energy, methane capture and utilization, the electrification of transport, precision agriculture, and CCS. Considering the dominance of stationary combustion in Alberta, actionable climate solutions could include accelerating the shift from coal and natural gas power plants to wind, solar, and hydroelectric power. This will leverage Alberta’s considerable renewable energy potential (e.g., the wind power potential in southern Alberta). The fugitive GHG emissions reduction could include deploying advanced leak detection and repair systems in oil and gas operations, capturing methane for energy use, or flaring reduction. Moreover, the transport sector initiatives could include expanding electric vehicle (EV) infrastructure and incentivizing EV adoption for personal and freight transportation. This could target oil sands-related stocks of vehicles. Emissions in the agricultural sector could be reduced by implementing precision farming technologies or variable rate irrigation, which include using GPS-guided equipment to optimize fertilizer use and application in the prairies. This will reduce nitrous oxide emissions. In the Industrial sector, CCS applications and techniques include retrofitting cement and chemical plants with CCS to capture CO
2 emissions at source. This will also leverage Alberta’s geological storage capacity. In the waste sector, a context-based approach could include developing anaerobic digestion and incineration facilities to convert organic waste into energy.
- (c)
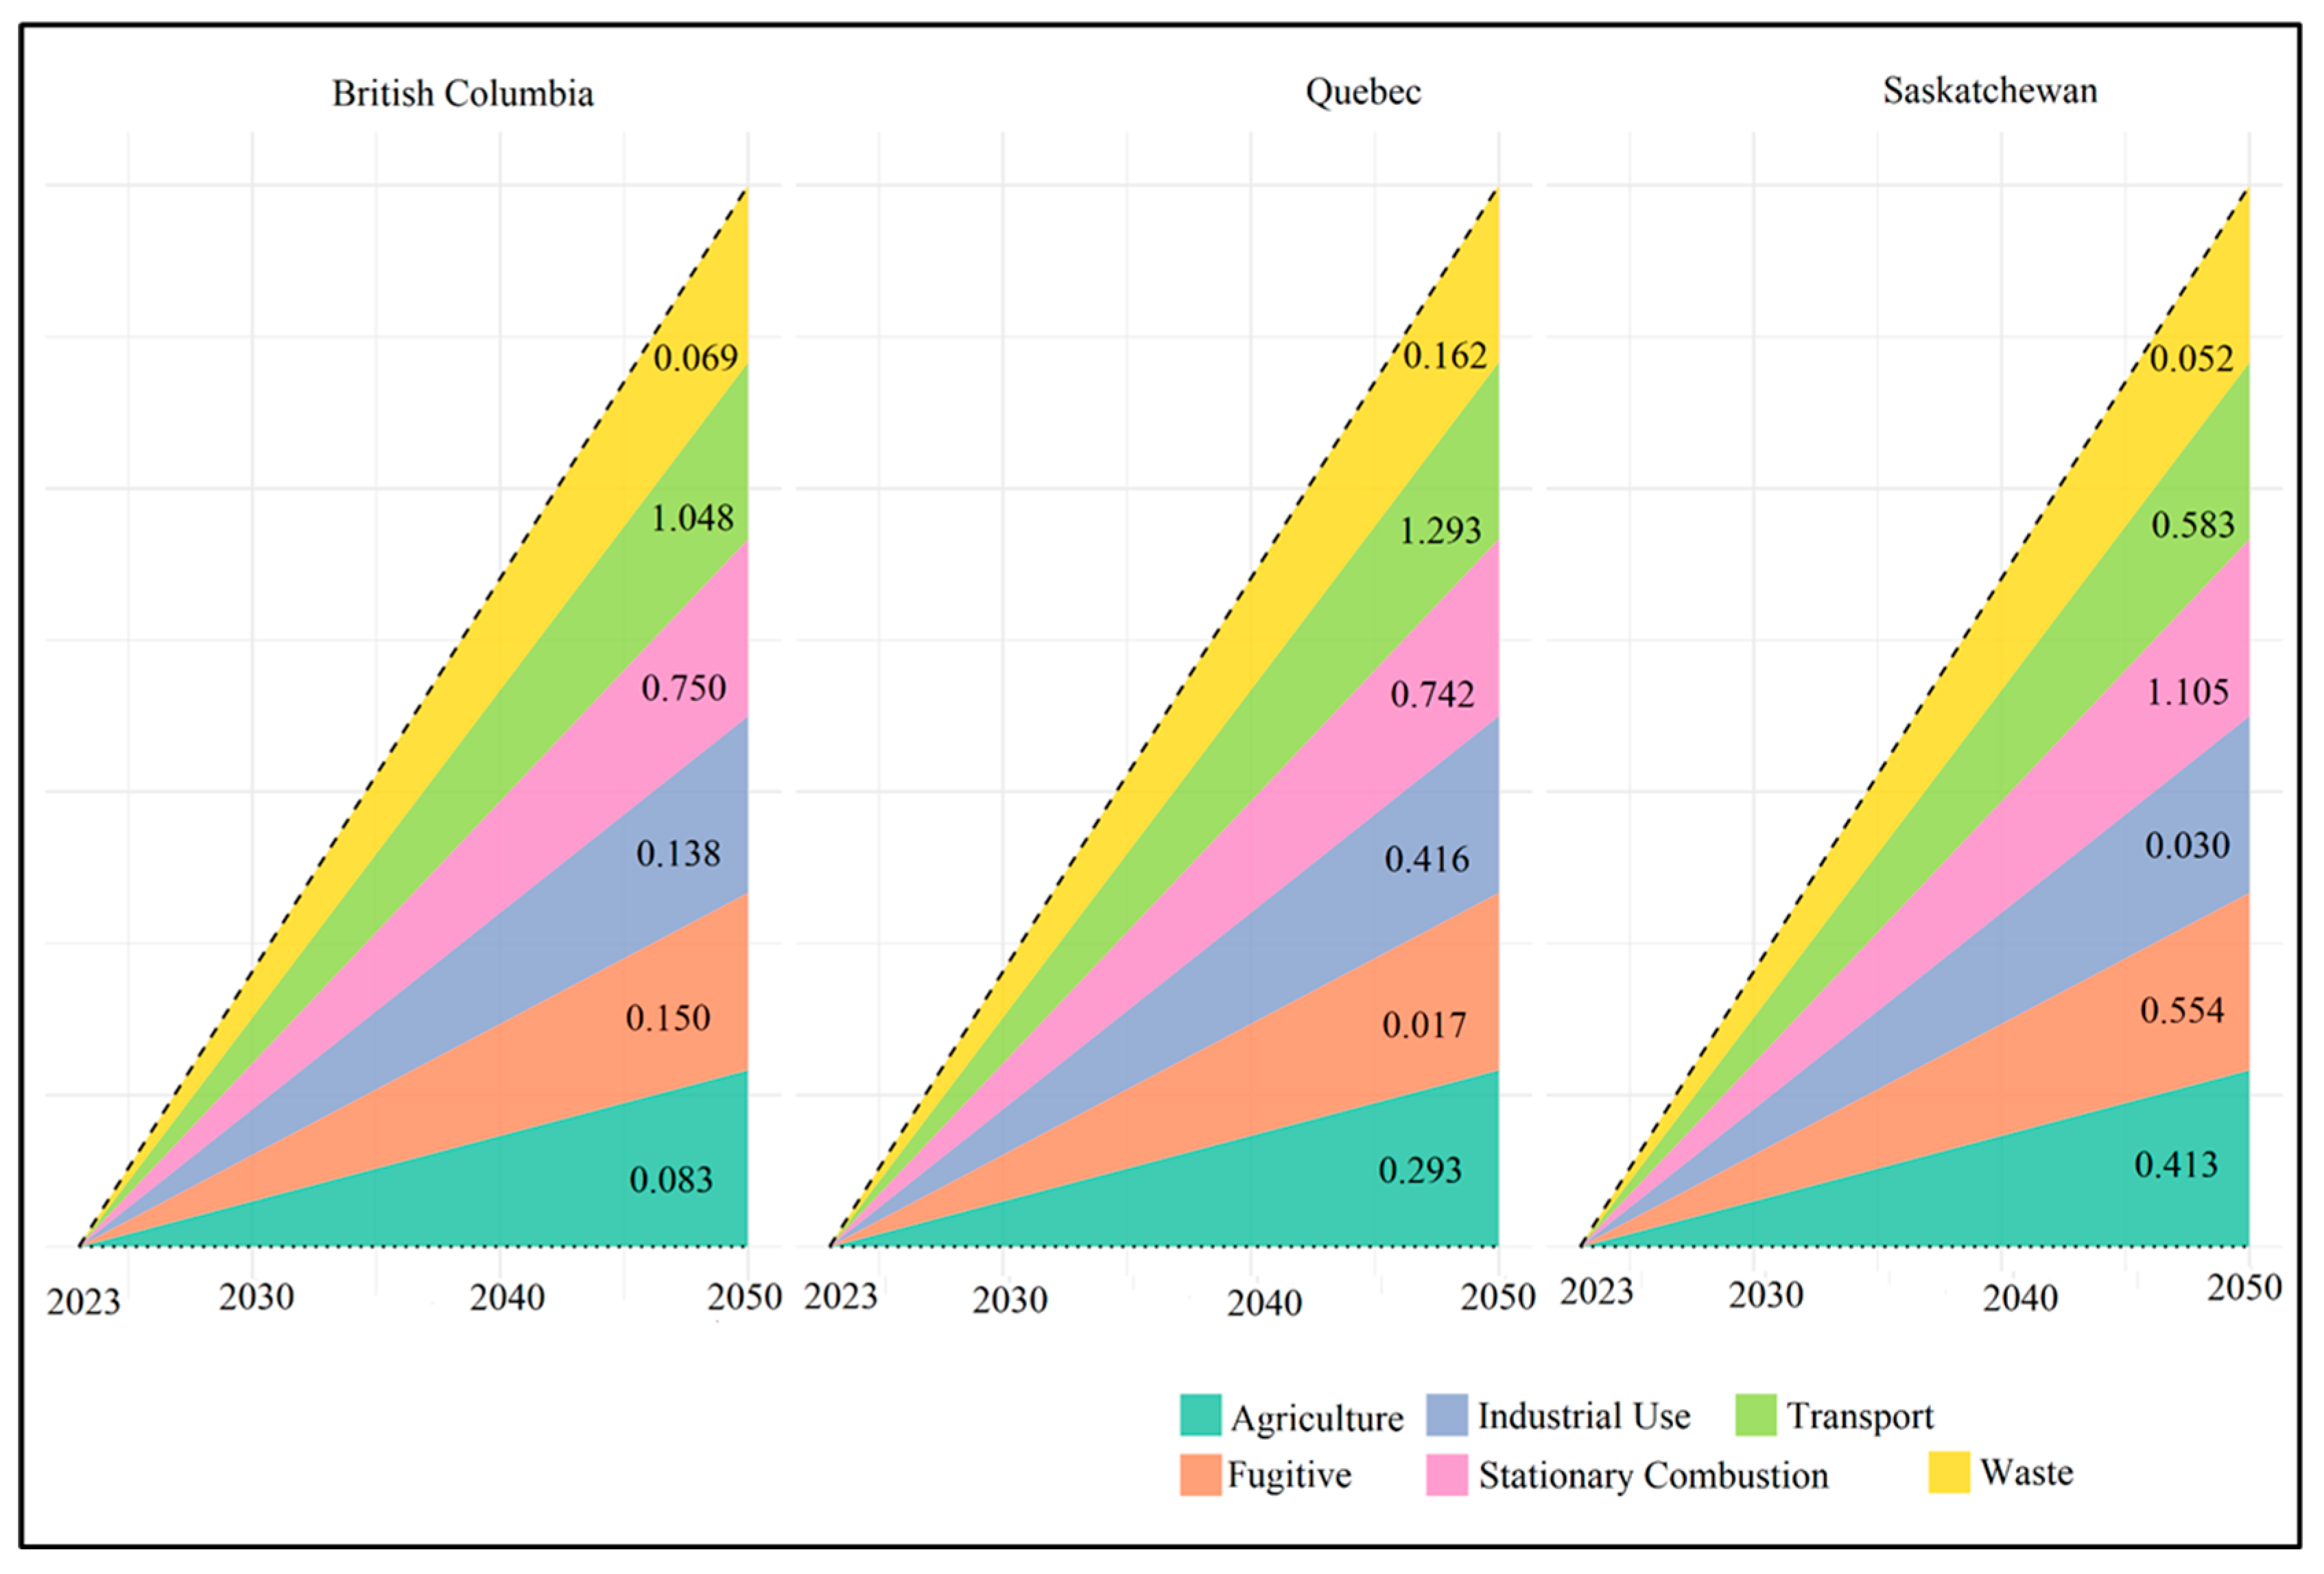
Cluster 3: British Columbia, Quebec, and Saskatchewan GHG Emissions Standalone Cluster And Carbon Mitigation Initiative’s Stabilization Wedge Application
This cluster includes provinces with intermediate emission profiles. The heatmap in
Figure 4 shows that emissions from stationary combustion and transportation dominated this cluster. There are high emissions from SK from agricultural and fugitive sources. This shows that climate solutions that focus on energy reduction strategies, electrifying the transportation sector, precision agriculture through site-specific nutrient and water management, and modern methane monitoring should be prioritized for this cluster. For QC (
Figure 10), the transport sector must cut 1.293 Mt CO
2 eq/year, which can be achieved by electrifying Montreal’s metro and rural vehicle fleets. Furthermore, throughout the province, more electric buses should be added to popular routes, including an increase in the frequency of the buses. For stationary combustion, 0.742 Mt CO
2 eq/year must be cut through retrofitting older buildings in Montreal, Quebec City, etc., with hydroelectric-powered heat pumps. CCS can be applied to decrease the 0.416 Mt CO
2 eq/year in the Industrial Use sector. The agriculture sector must reduce emissions by 0.293 Mt CO
2 eq/year, which can be achieved using methane digesters for dairy operations. The expansion of waste-to-energy initiatives in urban areas in QC can help reach the target of 0.162 Mt CO
2 eq/year required in the waste sector. Capturing methane from pulp mills in places like Trois-Rivières, Matane, Clermont, Château-Richer, and Dolbeau-Mistassini can significantly reduce the 0.017 Mt CO
2 eq/year from fugitive sources. In SK, the transition to renewable energy through a shift from coal to solar and wind farms would help bring emissions from stationary combustion sources (1.105 Mt CO
2 eq/year) to zero by 2050. A fugitive emissions reduction of 0.554 Mt CO
2 eq/year could be achieved through enhanced methane capture in oil and gas fields. In the Agricultural sector, GHG emissions of 0.413 Mt CO
2 eq/year can be reduced through precision agriculture using satellite-guided and proximal soil sensing, farming nutrient application, and efficient water management. The development of regional biogas plants can help achieve the 0.052 Mt CO
2 eq/year reduction needed in the waste sector. Furthermore, industrial optimization by applying cleaner technologies in fertilizer production can help achieve the 0.030 Mt CO
2 eq/year reduction required in the Industrial Use sector.
For BC to reach net-zero in 2050, the province is required to reduce GHG emissions annually by 1.048 Mt CO2 eq, 0.750 Mt CO2 eq, 0.150 Mt CO2 eq, 0.138 Mt CO2 eq, 0.083 Mt CO2 eq and 0.069 Mt CO2 eq in transport, stationary combustion, fugitive, industrial use, agriculture, and waste, respectively. Applying the CMI stabilization wedge, emissions reductions in the transport sector could include expanding and increasing rebates for EV, expanding EV charging networks, electrifying public transit (e.g., BC Ferries), and building on existing CleanBC initiatives. Stationary combustion emissions reductions can be achieved by mandating retrofits for buildings and industrial facilities to reduce heating and power emissions using heat pumps and insulation. Enhancing methane capture from landfills and natural gas infrastructure, which can be converted to biogas, will target the emissions from fugitive sources. Industrial Use emissions reductions could include upgrading industrial processes in pulp and paper factories with low-emissions technologies and alternative fuels. Promoting methane-reducing feed additives and manure management systems can help tackle GHG emissions from the agricultural sector. Developing anaerobic digestion and incineration facilities to convert organic waste into energy can reduce emissions in the waste sector.
- (d)
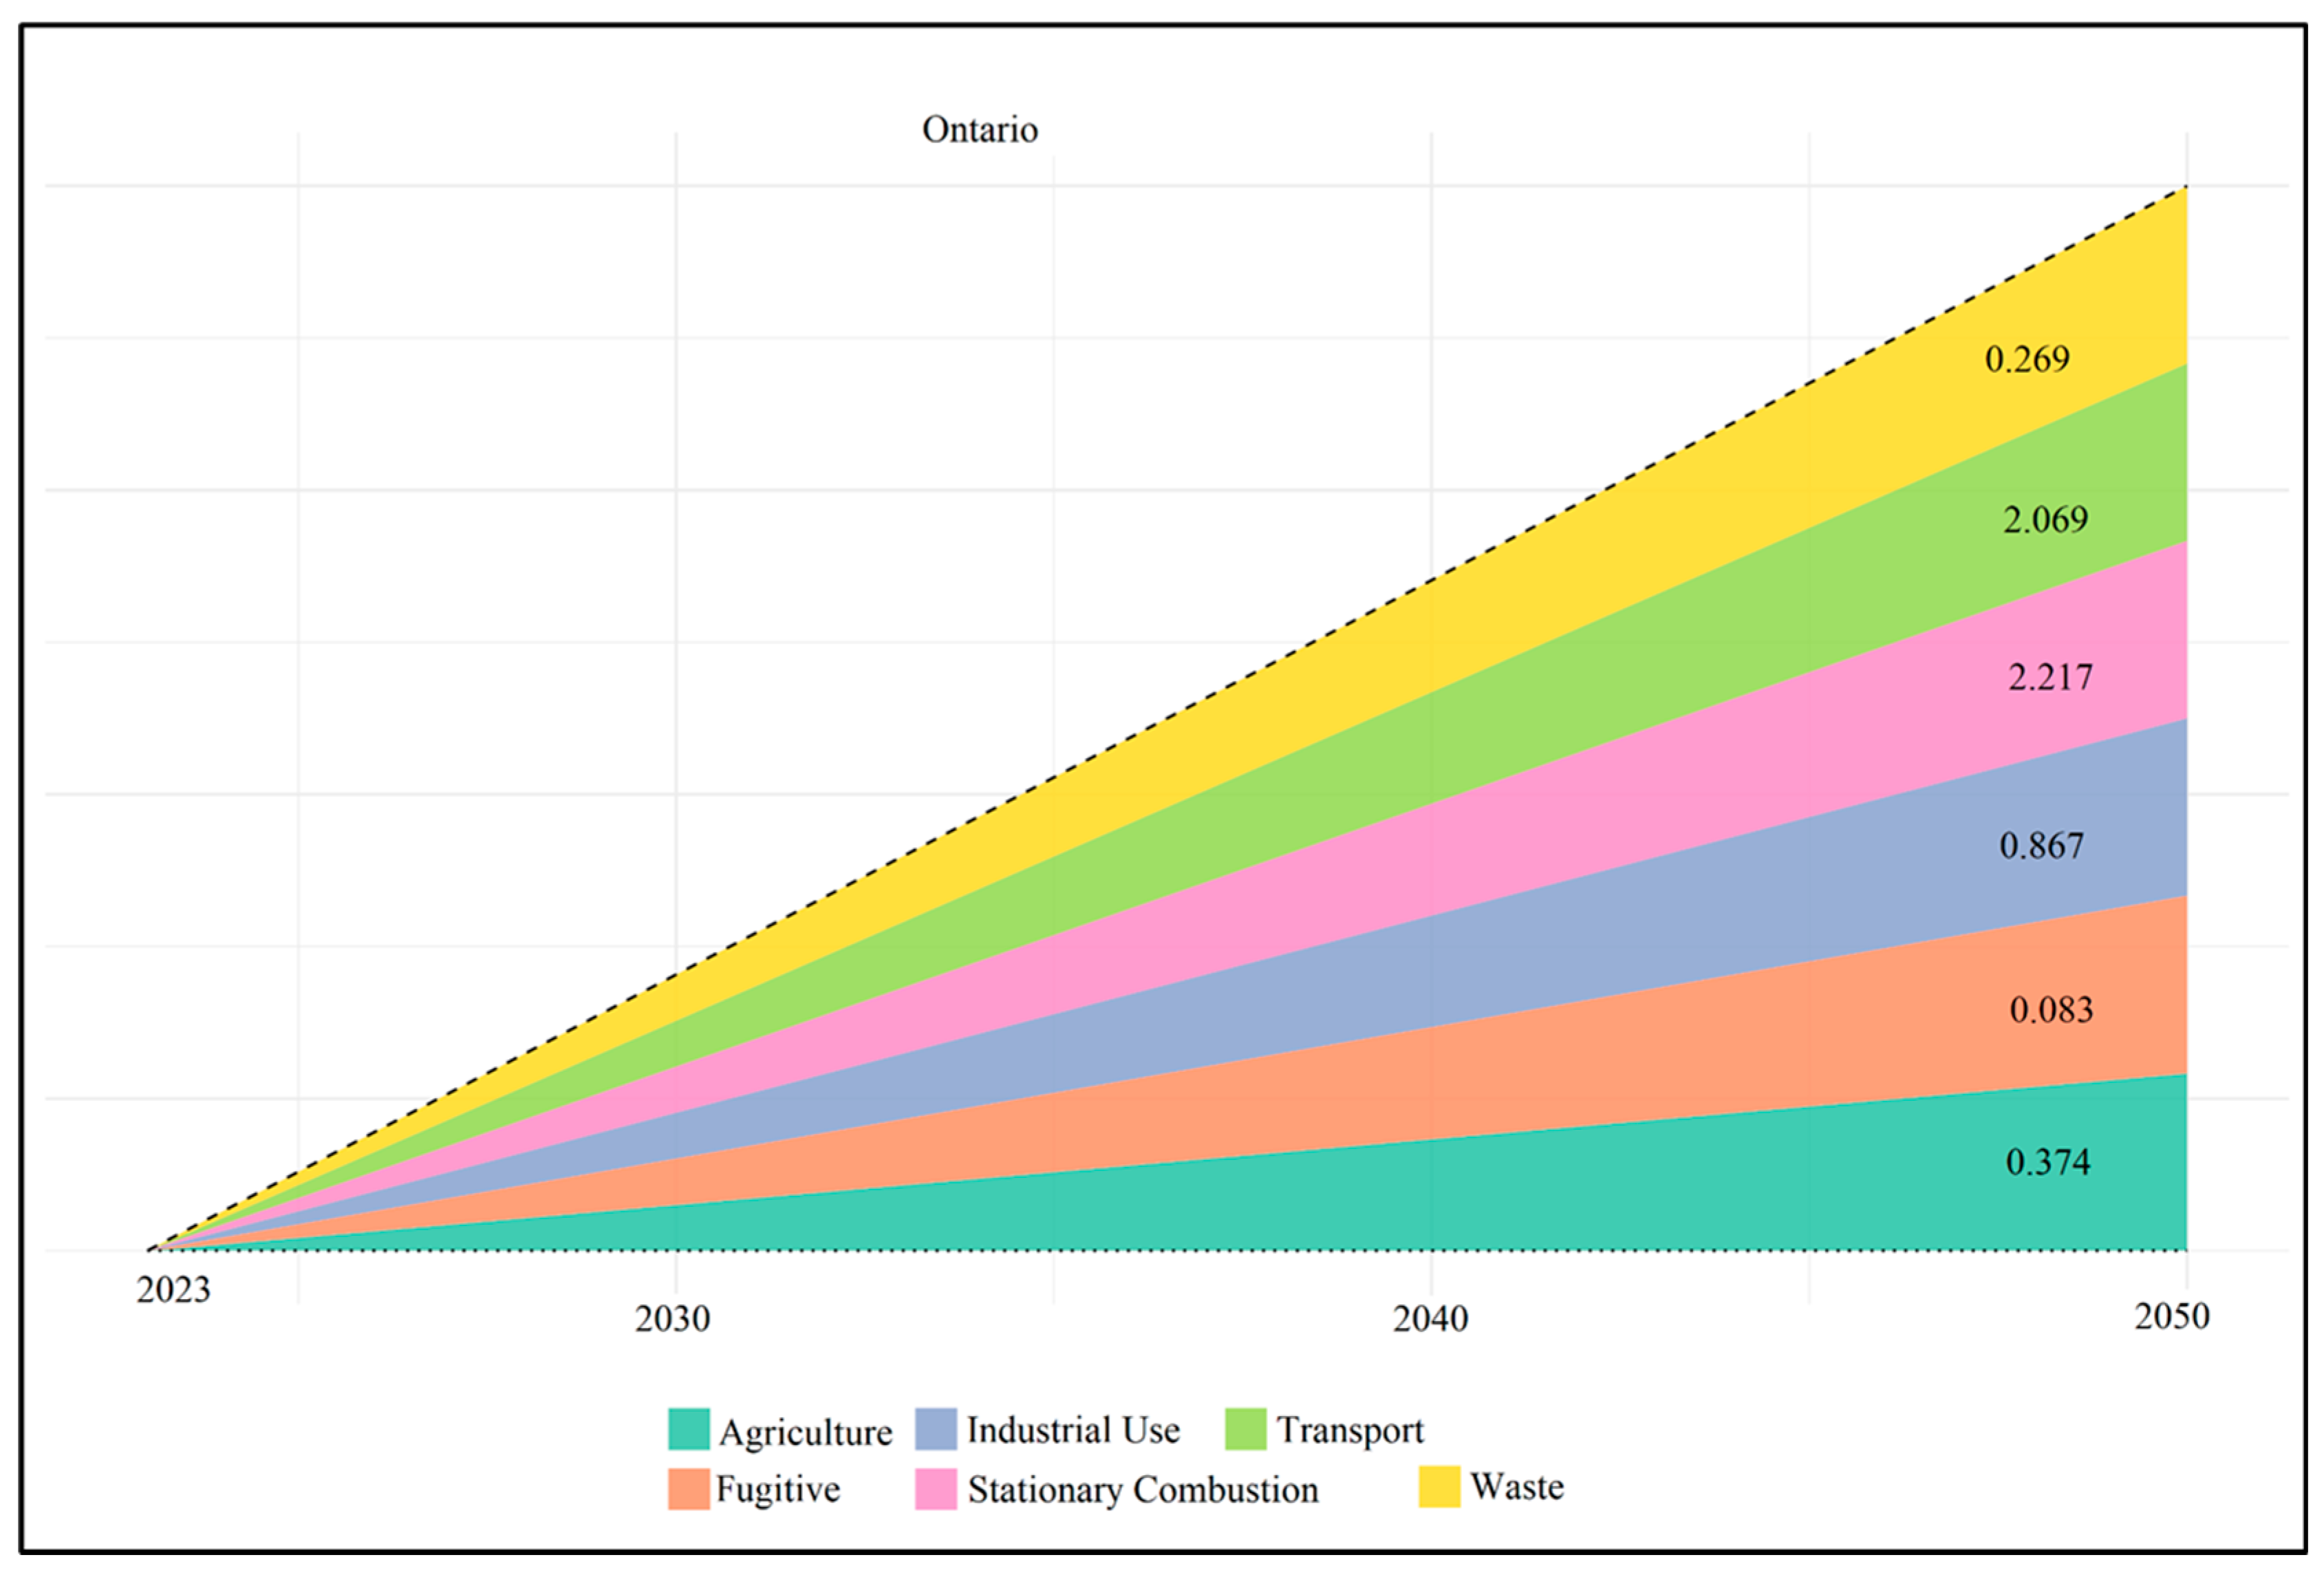
Cluster 4: Ontario GHG Emissions Standalone Cluster and Carbon Mitigation Initiative’s Stabilization Wedge Application
ON is a standalone cluster and one of Canada’s dominant sources of GHG emissions. For this province to reach net-zero by 2050, ambitious, yet doable and proactive, strategies are required. The province’s GHG emissions are dominated by up to 104.09 Mt CO
2 eq., 63.93 Mt CO
2 eq., and 31.98 Mt CO
2 eq. in stationary combustion, transport, and industrial use, respectively. Using the 2023 GHG emissions as the reference period, annually (
Figure 11), 2.217 Mt CO
2 eq, 2.069 Mt CO
2 eq, 0.867 Mt CO
2 eq, 0.374 Mt CO
2 eq, 0.269 Mt CO
2 eq, and 0.083 Mt CO
2 eq must be cut in the stationary combustion, transport, industrial use, agriculture, waste and fugitive sources, respectively. Applying the CMI stabilization wedge concept, energy efficiency retrofitting industrial and residential buildings with heat pumps and smart grids can significantly reduce energy usage and reduce stationary combustion emissions by expanding the infrastructure and electrifying GO Transit. Emissions from the transport sector can be reduced, especially in the Greater Toronto Area (GTA). Moreover, the provincial government should provide more incentives for adopting an EV fleet. CCS technologies can be applied to steel and cement plants in Southern Ontario to drastically reduce the Industrial Use sector’s emissions. By deploying drones, satellites, aerial-borne sensors, and proximal soil sensors for fertilizer management, precision agriculture can help reduce emissions in the agricultural sector. Initiatives can include scaling up anaerobic digestion in urban centers like Toronto, London, Waterloo, and Mississauga, which can reduce GHG emissions from the waste sector. Fugitive emissions can be captured from landfills and wastewater using methane capture and utilization protocols.
- (e)
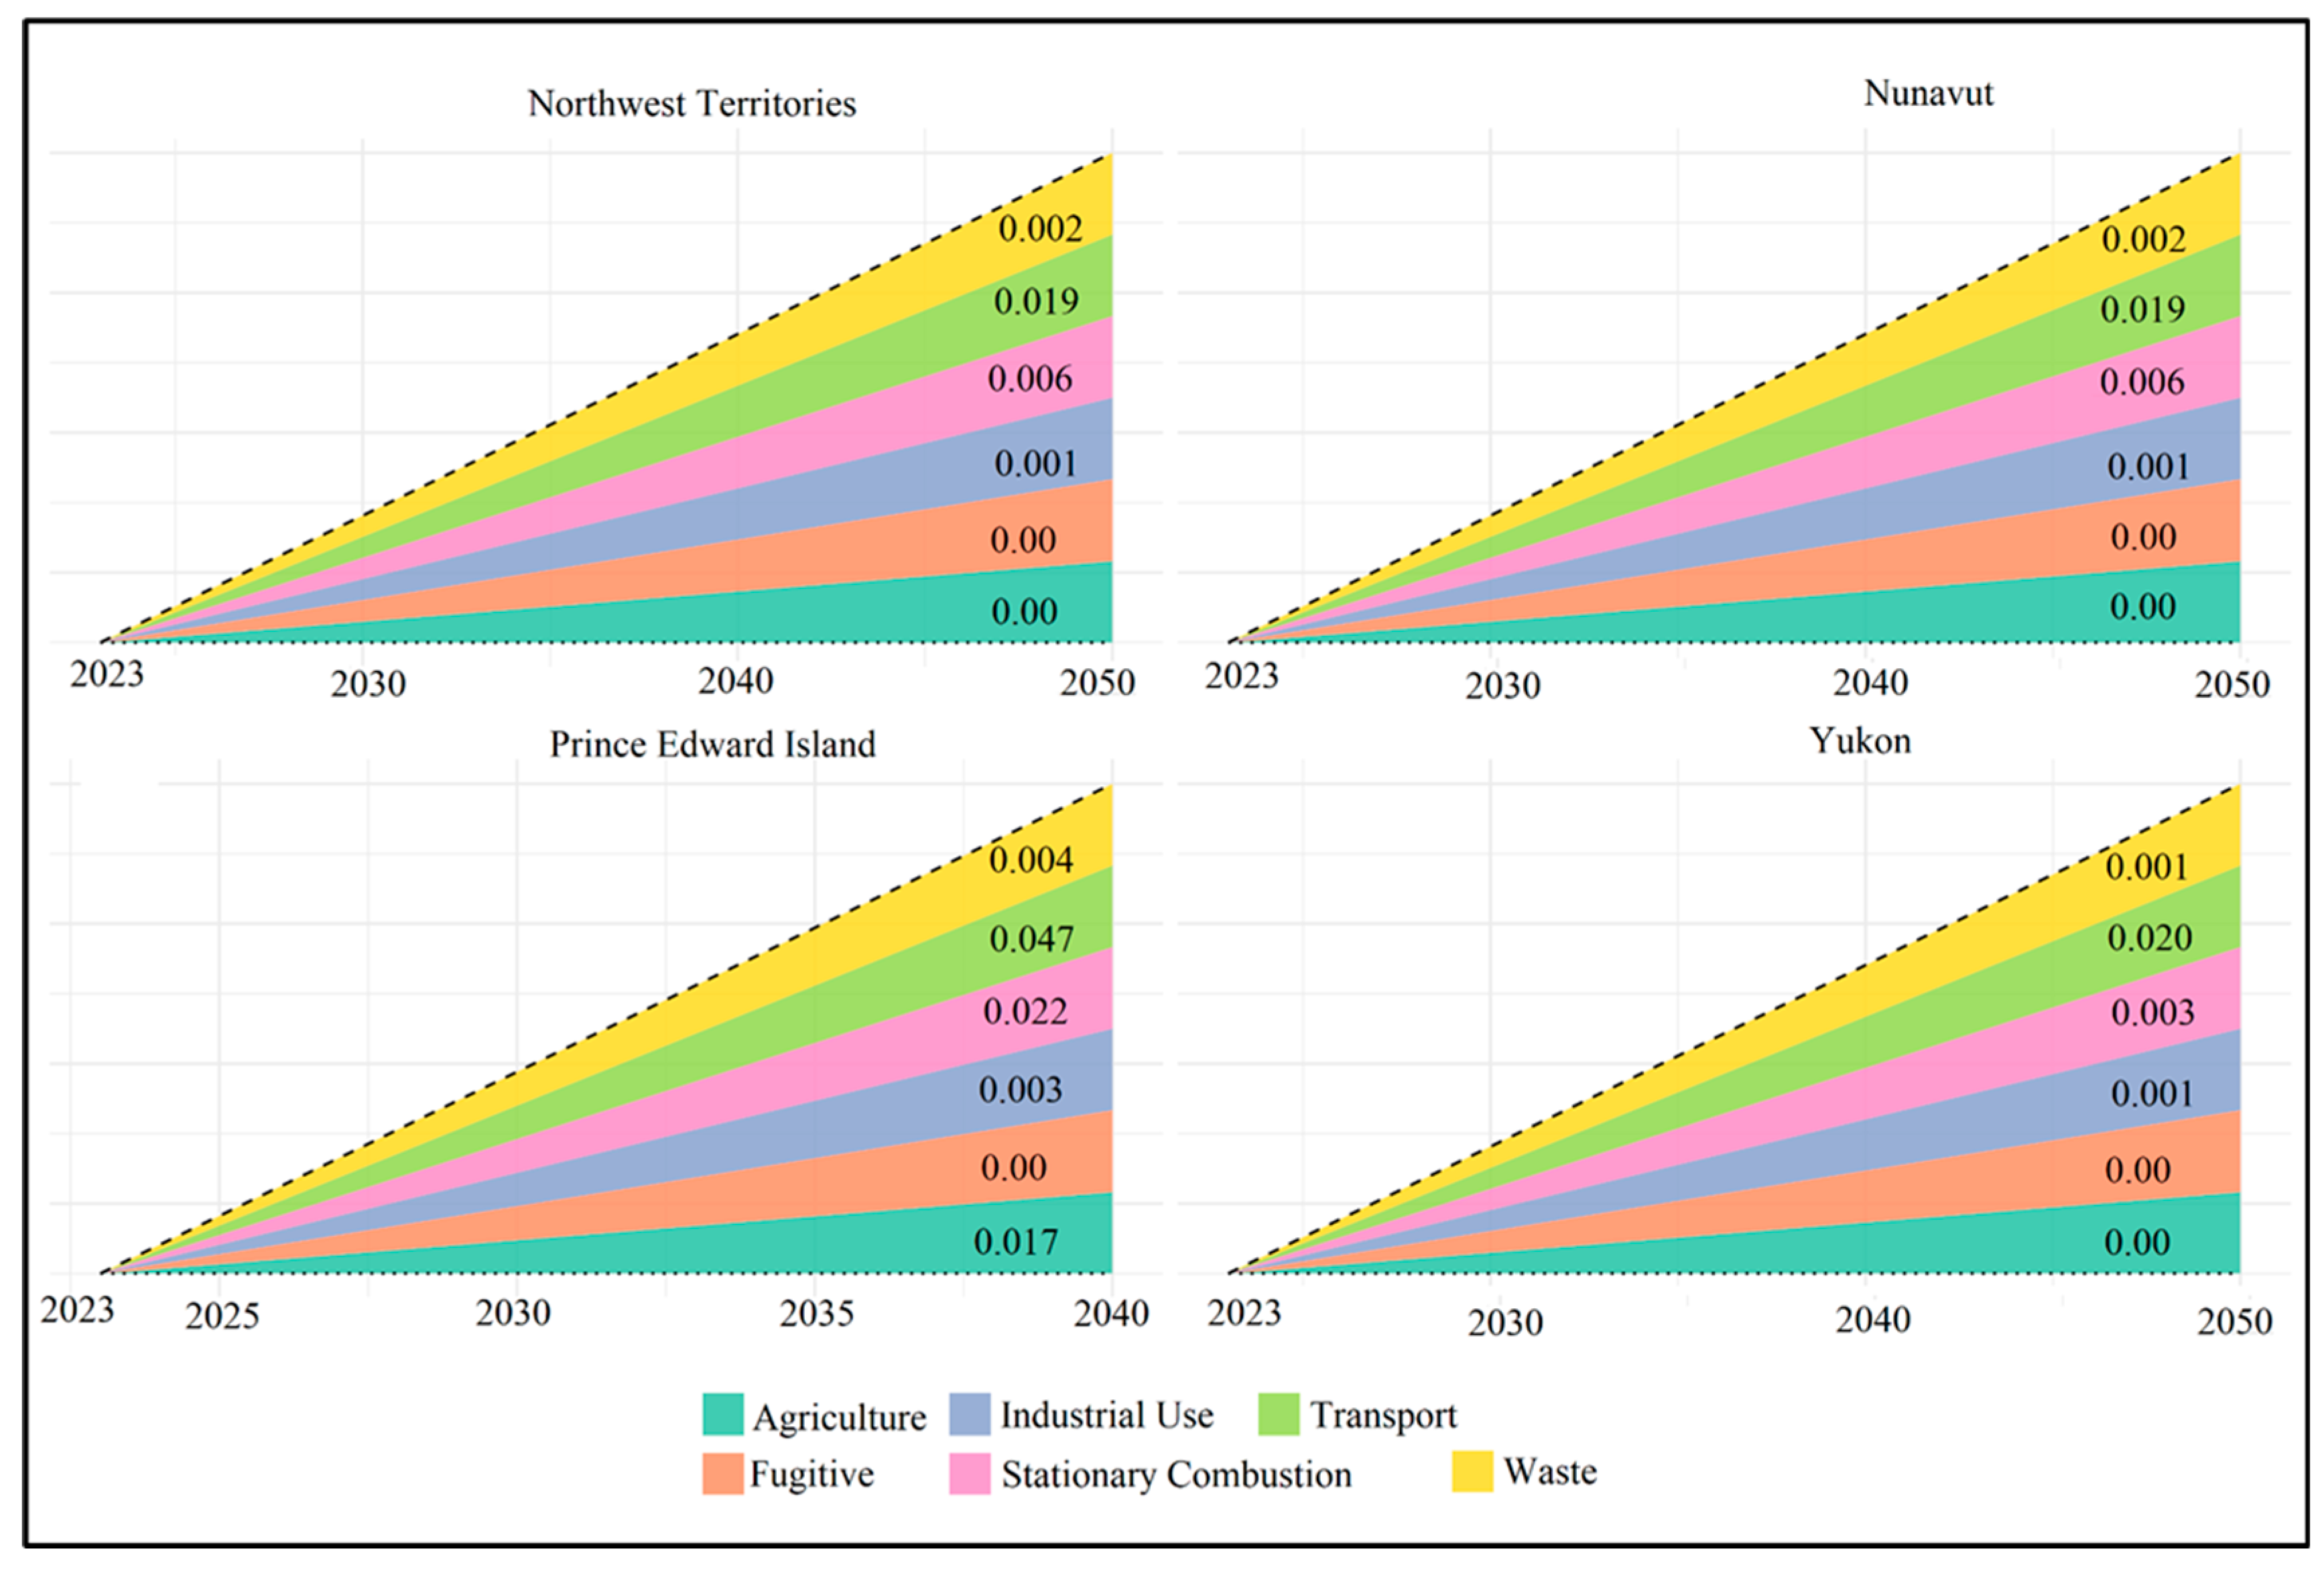
Cluster 5: Prince Edward Island, Northwest Territories, Nunavut, and Yukon emissions standalone cluster and carbon mitigation initiative’s stabilization wedge application
Cluster 5 encompasses PEI and the territories, as seen in
Figure 6. The heatmap shows that GHG emissions from transportation dominate this cluster. This is due to personal vehicle usage in most of these jurisdictions. PEI dominates this cluster with emissions as high as 0.89 Mt CO
2 eq, 0.76 Mt CO
2 eq, and 0.34 Mt CO
2 eq in the transport, stationary combustion, and agriculture sectors. This province has an ambition of being the first Canadian province to reach net-zero, with a 2040 target. Therefore, using 2023 as the reference, we linearly project the net-zero to 2040 for PEI (
Figure 12). The GHG emissions need to be annually reduced by 0.047 Mt CO
2 eq, 0.022 Mt CO
2 eq, 0.017 Mt CO
2 eq, 0.004 Mt CO
2 eq, 0.003 Mt CO
2 eq, and 0.00006 Mt CO
2 eq in the transport, stationary combustion, agriculture, waste, and industrial use sectors, respectively. Public transit enhancement is key for the transport sector, which contributes more than 40% of PEI’s total emissions. This could include electrifying buses, increasing rural transit routes, simplifying road networks, and promoting cycling infrastructure. Stationary combustion GHG emissions could be reduced through increasing renewable energy, which could expand the wattage of wind farms, and government subsidies to replace oil heating with heat pumps. Emissions from agriculture (0.017 Mt CO
2 eq) can be reduced through precision agriculture in potato farming that uses variable rate irrigation and fertilization. Best management practices, such as nutrient application timing and methane monitoring from animal husbandry, can contribute to annual GHG emissions reductions. Composting and small-scale biogas for waste in the three areas can significantly reduce waste emissions. Food processing can be upgraded with energy-efficient systems. Methane capture and utilization technologies can handle the small amounts of emissions from the Industrial Use sector. In NT, there are no emissions from agriculture and fugitive due to the Arctic climate, which allows only limited or no farming practices. Other sectors such as transport, stationary combustion, waste, and industrial use will require an annual GHG reduction of 0.019 Mt CO
2 eq, 0.006 Mt CO
2 eq, 0.002 Mt CO
2 eq, and 0.001 Mt CO
2 eq, respectively. The CMI stabilization wedges for these sectors could include deploying EV and hybrid vehicles for private and government fleets in the transport sector. In the stationary combustion, Waste and Industrial Use sectors, climate solutions could include retrofitting remote diesel-powered homes, government facilities with solar, expanding battery storage, using micro-scale environmental incineration for waste generated in isolated communities, and enhancing mining operations with energy-efficient machinery through Internet of Things (IoT) technology. NU also lacks emissions from both agricultural and fugitive sources for the same reason mentioned above; however, annual emission reductions of 0.019 Mt CO
2 eq, 0.006 Mt CO
2 eq, 0.002 Mt CO
2 eq, and 0.001 Mt CO
2 eq are needed for the transport, stationary combustion, waste, and industrial use sectors, respectively. The CMI stabilization wedges for this territory could include efficient electric or hybrid snowmobiles and ATVs for community use. Transitioning to renewable energy sources, such as wind farms, could replace diesel with wind-diesel hybrid systems in remote grids, drastically reducing stationary combustion emissions. Implementing small-scale waste, environmentally friendly incineration, and energy recovery could help reduce emissions from the waste sector. The optimization of small industrial activities (e.g., construction) with efficient equipment could help cut the emissions from Industrial Use. For YK, an annual GHG emission reduction of 0.020 Mt CO
2 eq, 0.003 Mt CO
2 eq, and 0.001 Mt CO
2 eq is required in the transport, stationary combustion, and waste (also in Industrial Use) sectors, respectively. No emissions reduction is required in the agricultural and fugitive sectors, though a maximum GHG emission of 0.01 Mt CO
2 eq has been recorded for fugitive in the past (
Figure 4). To address this, an efficient monitoring system would be required in the fugitive sector. For this territory to reach net-zero by 2050, the transport sector must be electrified, with the government promoting EVs in Whitehorse through rebates and incentives. EV infrastructure, such as charging stations, should be made available. The Stationery Combustion sector must retrofit old buildings, cottages, and off-grid cabins with solar panels and heat efficiency through insulation rebates and programs. Using micro-digesters for community waste can help cut the GHG emissions from the waste sector. New and efficient machinery in the mining sector can help reduce emissions from the Industrial sector. Due to challenges facing the Canadian territories from the location and socio-economic perspective, knowledge sharing and collaboration with other jurisdictions should be promoted, especially the sharing of best practices for what works in various sectors.
This study used a linear reduction technique from 2023 to 2050 and from 2040 for all Canadian jurisdictions and for PEI, respectively. The methodology can be refined for future studies by employing a non-linear model that uses artificial intelligence. Methods such as long short-term memory (LSTM) neural networks can be used to model the non-linear trajectories of GHG emissions from sectoral profiles, thereby capturing the complex relationships between socio-economic, technological, and policy indicators that impact GHG reductions. Using historical emissions from 1990 to 2023, LSTM can be trained, and external covariates such as economic indicators (e.g., GDP, industrial output), energy data (e.g., renewable energy adoption rates, fossil fuel consumption), policy variables (e.g., carbon pricing, subsidy levels), and technological factors (e.g., CCS deployment costs, EV penetration) can be integrated into the model to provide a more realistic pathway to net-zero by 2050 (2040 for PEI). It would also be interesting to apply advanced clustering techniques, such as variational autoencoders (VAEs), that can identify latent patterns in the emissions dataset. VAEs will potentially help reveal new groupings or clusters based on sectoral or temporal dynamics picked up by the k-means clustering method. There are still gaps in understanding the relationship between GHG emissions trajectories and climatic variables (e.g., temperature trends, degree days, relative humidity, extreme weather frequency). Future studies will also integrate the dynamics of various economic factors and possibly the associated estimated costs, budget constraints, and potential impact of tariff threats for each climate solution suggested for a more realistic recommendation.


