Article

Financial Technology Expenditure and Green Total Factor Productivity: Influencing Mechanisms and Threshold Effects

1
School of Business, Nanjing University, Nanjing 210008, China
2
School of Government, Nanjing University, Nanjing 210008, China
*
Authors to whom correspondence should be addressed.
Sustainability 2025, 17(14), 6653; https://doi.org/10.3390/su17146653
Submission received: 26 May 2025 / Revised: 17 July 2025 / Accepted: 18 July 2025 / Published: 21 July 2025
(This article belongs to the Special Issue Circular Economy and Sustainability)

Abstract

The integration of financial technology expenditures and green total factor productivity (GTFP) constitutes a critical impetus for sustainable economic advancement. This study employs provincial panel data from China (2012–2020) and uses the SBM model with undesirable outputs, the PVAR model, moderation effect analysis, and threshold regression to investigate the underlying mechanisms and threshold effects of financial technology expenditure on GTFP. The results show that (1) financial technology expenditure has a significant promoting effect on the growth of GTFP, with a coefficient of 0.614 (p < 0.05), indicating the need for further increases in fiscal investment in science and technology; (2) the effect of financial technology expenditure on GTFP varies across the eastern, central, and western regions of China, with stronger effects observed in the eastern region, suggesting that the government should formulate differentiated financial technology expenditure policies on the basis of local conditions; and (3) that educational investment and industrial upgrading play strong moderating roles in the impact of financial technology expenditure on GTFP, with interaction term coefficients of 0.059 (p < 0.05) and 0.206 (p < 0.1), respectively. Threshold analysis further reveals that the positive effect strengthens significantly once educational investment surpasses a log value of 9.3674 and industrial upgrading exceeds a ratio of 0.0814. However, currently, China’s education investment and industrial structure upgrading are still insufficient, necessitating further increases in education investment and promoting the transformation and upgrading of the industrial structure.

1. Introduction

Environmental sustainability has become an increasingly urgent priority in the 21st century, as societies grapple with the negative externalities of industrialization and resource overuse. Governments worldwide, especially in emerging economies such as China, are under pressure to shift toward green, inclusive, and innovation-driven development models. Green total factor productivity (GTFP), which integrates environmental efficiency into productivity metrics, offers a critical lens for evaluating this transition.
Many studies have examined the drivers of GTFP from various perspectives, including green finance [1], environmental regulation [2], innovation capability [3], and education input [4]. However, the role of financial technology expenditure in promoting GTFP remains underexplored, particularly in terms of its interaction with structural factors such as education and industrial upgrading. Moreover, little is known about the threshold and regional heterogeneity of these effects. Existing research tends to isolate single-factor influences or use static modeling, leaving a theoretical and empirical gap in the compound effects of public fiscal investment on green productivity improvement.
From a theoretical perspective, fiscal science and technology expenditure enhances GTFP by easing innovation financing constraints caused by the public good nature of technological knowledge [5,6]. This justifies government support to correct underinvestment in green R&D. Industrial upgrading acts as a transmission channel, directing resources to high-efficiency, low-carbon sectors, thereby improving productivity through structural transformation [7]. Education investment strengthens this process by improving human capital and the capacity to absorb and apply green technologies [4,8]. These mechanisms provide an intuitive basis for our hypotheses, while recognizing that their effectiveness may vary by region and institutional context [9].
This study investigates the dynamic relationship between financial technology expenditure and GTFP in China via panel data from 30 provinces from 2012–2020. The time frame ensures consistency in statistical standards and avoids distortions from the COVID-19 pandemic’s policy shocks after 2020. The study employs panel vector autoregression (PVAR), moderating effect models, and threshold models to assess (1) whether fiscal S&T expenditure promotes GTFP; (2) whether education and industrial upgrading act as enhancers; and (3) whether threshold effects exist. By addressing theoretical, empirical, and policy gaps, this paper contributes to a more nuanced understanding of how public financial instruments can be optimized to support green growth.

2. Literature Review

2.1. Research on GTFP

2.1.1. Measurement of GTFP

GTFP extends the framework of traditional total factor productivity by incorporating resource efficiency and environmental impact into productivity metrics. This framework aligns with the principles of sustainable development and addresses the externalities overlooked in standard TFP estimates [10]. By adjusting for undesirable outputs, such as pollution and energy consumption, GTFP offers a more comprehensive picture of economic–environmental performance.
A variety of methods have been employed to measure GTFP. The Solow residual method, widely used in parametric estimation, calculates productivity growth as the residual of output not explained by labor and capital. Ahmed and Elfaki (2024) incorporated energy and carbon efficiency into the Solow model, producing a carbon-adjusted GTFP for Asian countries [11]. Stochastic frontier analysis (SFA), another parametric method, models the deviation of observed output from the optimal production frontier, accounting for statistical noise. Cui et al. (2019) applied SFA to compare industrial sectors and quantify inefficiencies in GTFP [12].
Data envelopment analysis (DEA), a nonparametric method introduced by Charnes, Cooper, and Rhodes (1978), measures efficiency without assuming a specific functional form [13]. Chung et al. (1997) improved DEA by integrating undesirable outputs via the directional distance function [14]. Färe et al. (2001) proposed the Malmquist–Luenberger index [15], whereas Tone (2002) developed a slack-based measure (SBM) to overcome limitations in radial DEA [16]. Oh (2010) further refined this with the generalized ML (GML) index, enabling dynamic and environmentally adjusted evaluations of productivity [17].

2.1.2. Influencing Factors of GTFP

GTFP is influenced by a combination of technological, economic, and institutional factors. Technological innovation, including R&D investment and digital infrastructure, has consistently been associated with productivity improvements and environmental efficiency [18,19,20]. Technological diffusion and energy efficiency measures also play essential roles.
Economic restructuring—such as industrial upgrading, urbanization, and transformation of the energy mix—enhances resource allocation and promotes cleaner production processes [7,21].
Governmental and institutional factors are equally important. Green finance, environmental regulation, and fiscal decentralization affect both the incentives and capacities for enhancing GTFP [22]. Moreover, regional absorptive capacity, innovation systems, and administrative efficiency determine the effectiveness of these interventions [23].

2.2. Financial Technology Expenditure and GTFP

Financial technology expenditure has become a crucial instrument for promoting innovation-led and environmentally sustainable development. Scholars widely acknowledge that targeted public investment in science and technology can stimulate technological innovation, reduce emissions, and enhance resource efficiency. For example, Derbentsev et al. (2021) confirmed the positive effects of R&D funding on GDP growth in central Europe [24], whereas Ma et al. (2024) have reported that government spending on higher education significantly improves GTFP at the provincial level in China [25]. Similarly, Lu et al. (2023) used spatial econometric models to show that science and technology finance strengthens green productivity growth through innovation spillovers [26].
The effectiveness of such financial investment depends not only on the level of expenditure but also on its efficiency. Recent studies emphasize nonlinearities in the impact of expenditure. Zhao and Yan (2024) and Wei et al. (2023) have demonstrated an inverted U-shaped relationship between fiscal spending and green innovation, revealing diminishing marginal effects as investment increases [27,28]. Hou et al. (2023) further identified spatial convergence, indicating that financial science and technology expenditures help harmonize innovation capacity across regions [29].
In this context, performance evaluation becomes essential. This study defines “performance evaluation” as a multi-dimensional process assessing the efficiency, innovation output, and institutional quality of public investment. Tools such as DEA, SFA, and multi-criteria decision-making methods have been applied in empirical settings [30,31]. However, most existing models lack the integration of environmental and spatial performance indicators.
This study contributes by refining the evaluation framework to better reflect green productivity objectives and regional policy differences. Specifically, it emphasizes accurate weighting of indicators, consideration of undesirable outputs, and policy alignment with sustainability goals.

2.3. Research Gaps and Contribution

Despite growing interest in the fiscal determinants of green growth, several important gaps persist. First, many studies still focus on traditional TFP, neglecting environmental constraints or failing to directly measure green productivity. This limits their relevance to the sustainable development discourse.
Second, existing studies tend to adopt enterprise-level or industry-specific datasets, offering limited insights for regional or national policy application. Spatial heterogeneity in GTFP responses to financial technology expenditure has not been sufficiently explored, particularly in China’s highly diverse regional landscape.
Third, performance evaluation frameworks for financial technology expenditure remain underdeveloped. While methods such as DEA and SFA are applied, they often omit regional institutional variables or environmental externalities, weakening their policy value.
To address these gaps, this study contributes to the literature in three key ways. First, it integrates GTFP into fiscal impact analysis, which explicitly captures green development dynamics. Second, it constructs a province-level empirical framework to examine heterogeneity in fiscal expenditure effects. Third, it adopts a GML-index-based DEA approach that accounts for both desirable and undesirable outputs, enhancing methodological precision and policy relevance. By connecting public financial investment, institutional effectiveness, and green productivity, this study offers new insights for sustainable development policy design and evaluation.

3. Theoretical Framework

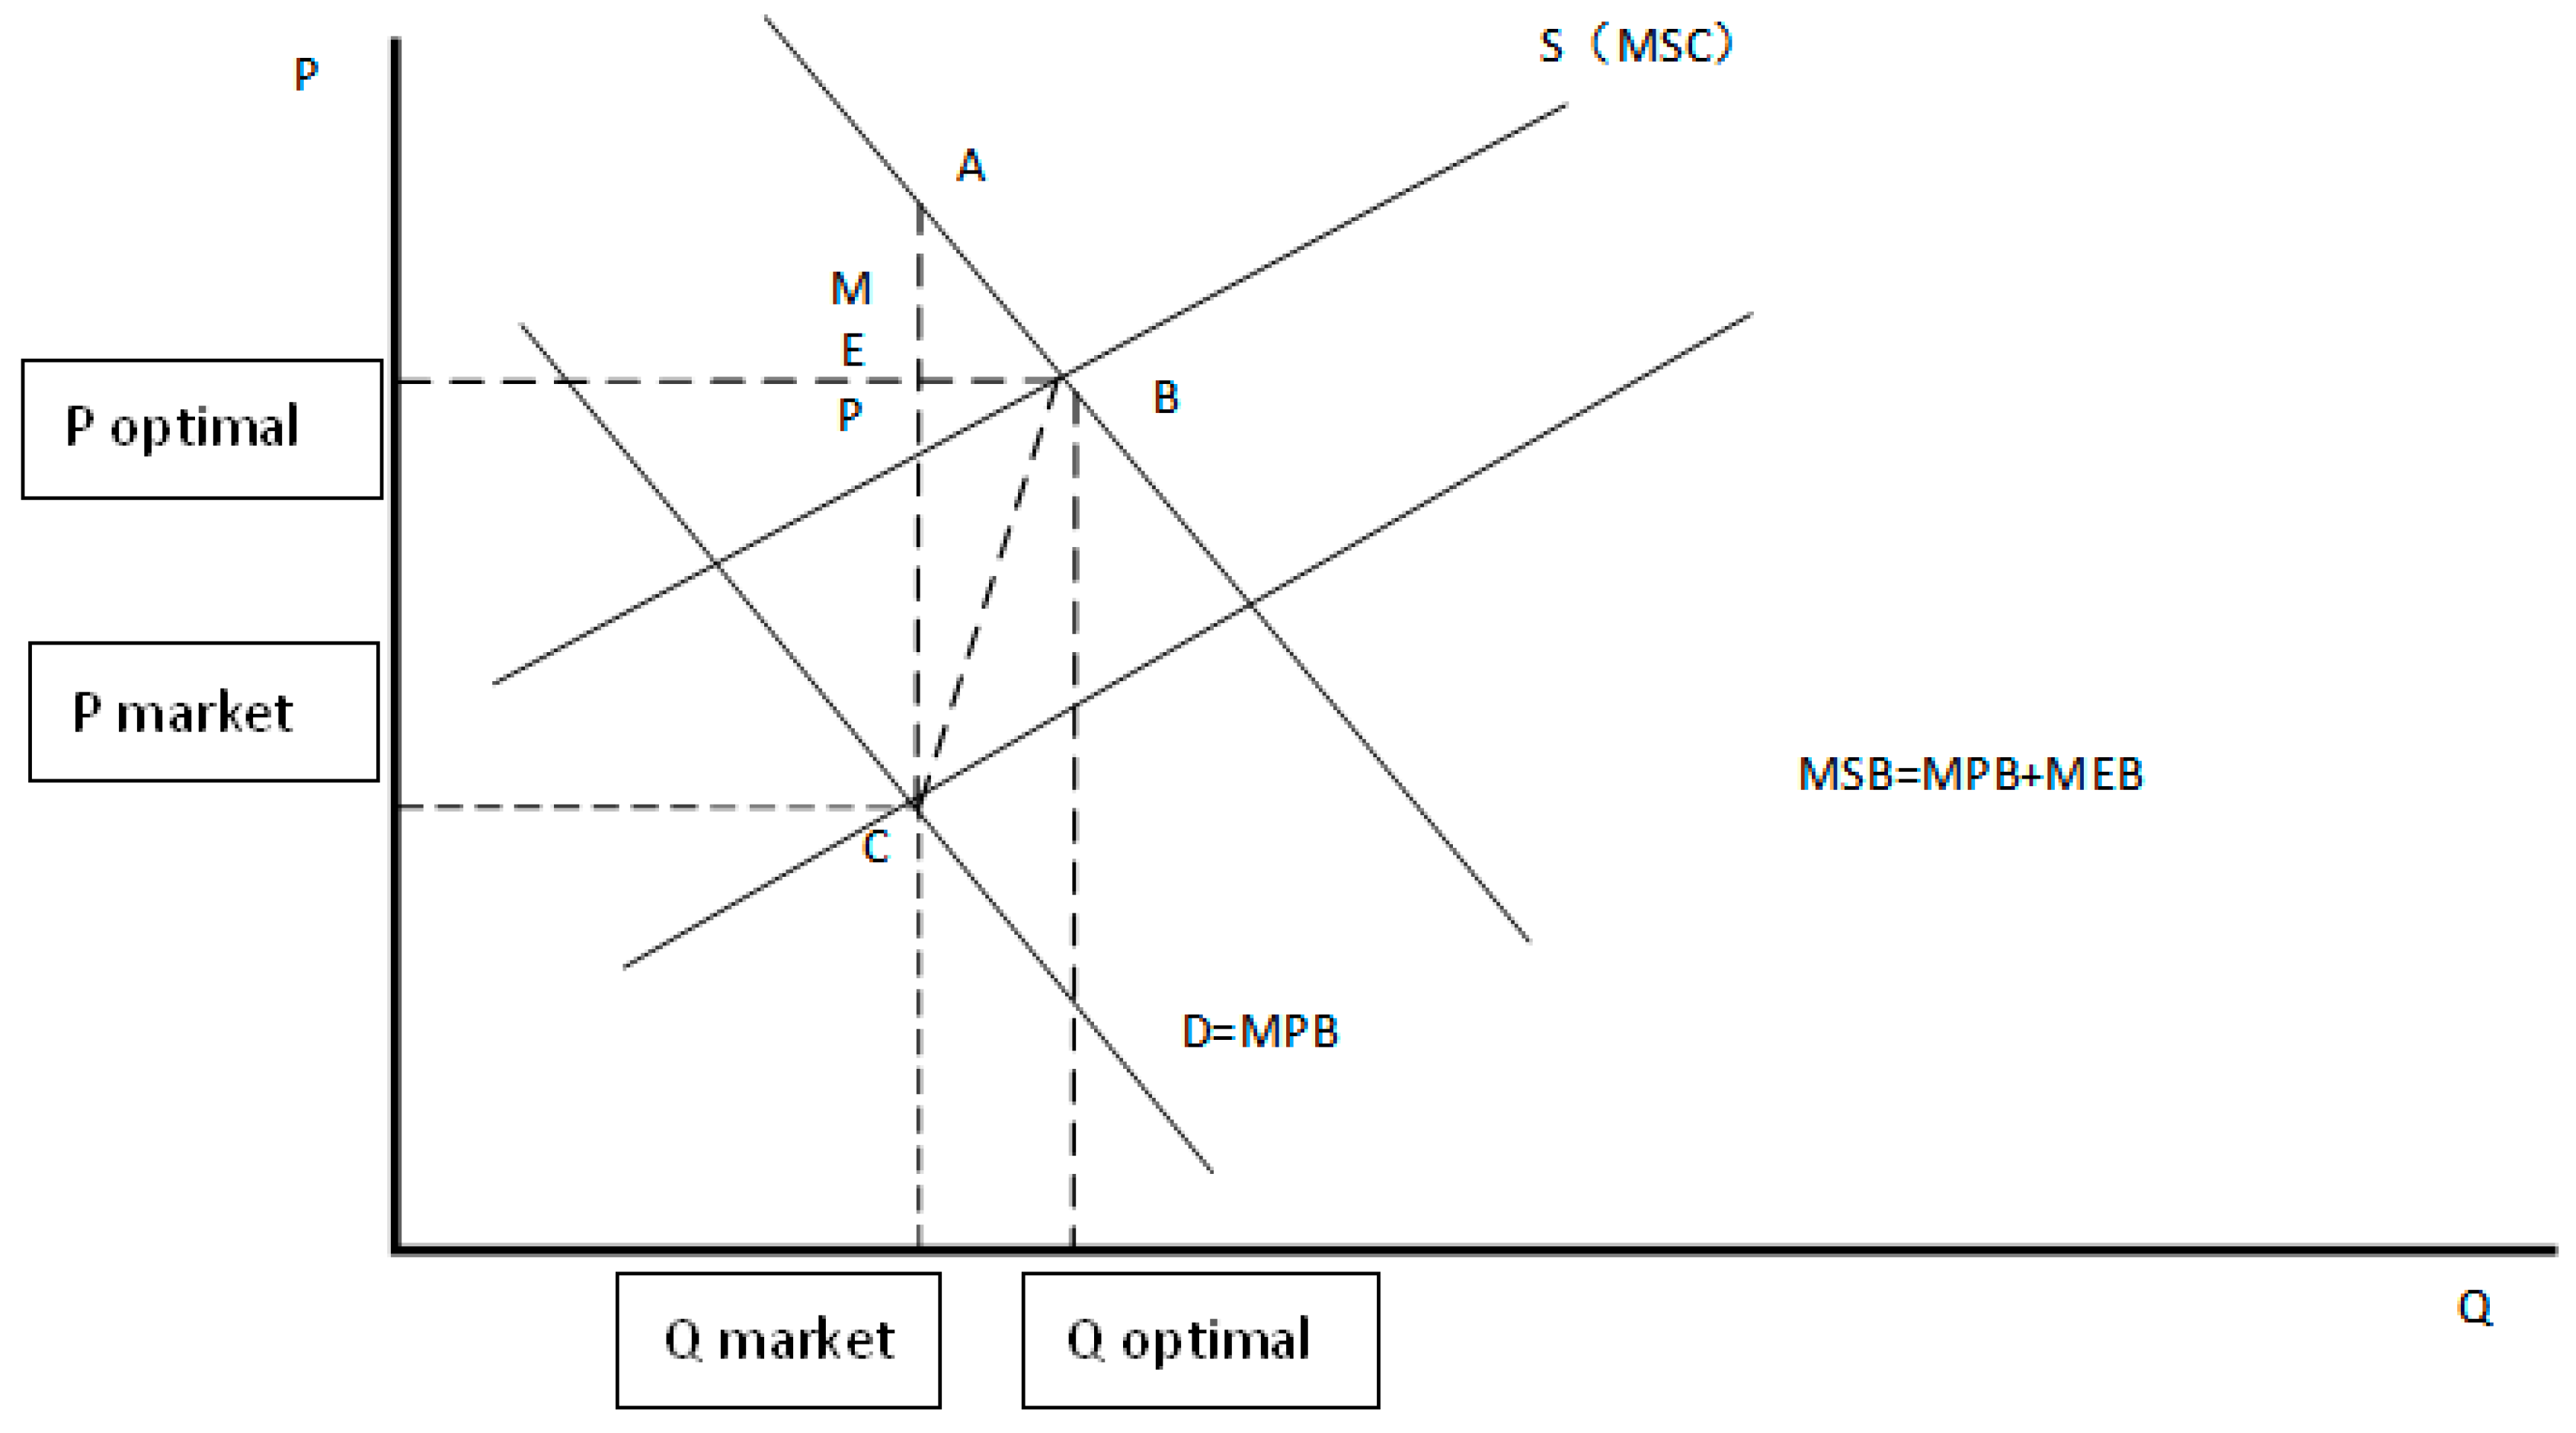
3.1. The Impact of Financial Technology Expenditure on GTFP

Financial technology expenditure can effectively promote green total factor productivity (GTFP) by correcting innovation-related market failures and stimulating systemic productivity upgrades. Traditional productivity metrics often fail to account for negative environmental externalities, making them inadequate for evaluating growth under ecological constraints. In contrast, GTFP provides a more comprehensive assessment by incorporating both resource efficiency and environmental impacts [10].
Publicly funded digital infrastructure—such as national payment systems, cross-regional clearing networks, open banking standards (e.g., government-mandated APIs), and shared cybersecurity protocols—often display public good characteristics. These technologies are non-competitive and typically non-excludable or only partially excludable, especially when operated by public agencies or designed as open-source platforms. In contrast, privately held patents or proprietary fintech applications developed by firms like Apple or ByteDance are protected by intellectual property laws and thus do not meet the public good definition. This distinction is crucial because public fintech R&D often generates strong knowledge spillovers and positive externalities that are underpriced by markets [5,32]. These lead to systematic underinvestment, as private firms cannot capture the full social returns [6]. This theoretical rationale underpins government intervention through fiscal fintech support, beyond what relative efficiency metrics alone (e.g., DEA) can reveal. Moreover, this policy logic is not exclusive to China. Countries such as the United States and members of the European Union also invest public resources in digital payment infrastructure, open banking standards, and cybersecurity protocols. These globally observed practices further validate the case for state-led digital innovation support, especially in foundational technology areas with high spillover potential and weak private incentives.
Although prior studies such as that of Hou et al. (2023) [29] utilize DEA to examine efficiency performance, DEA only measures relative—rather than absolute—improvement, and thus cannot alone justify policy intervention. Instead, our argument is grounded in the economics of public goods and innovation externalities.
As shown in Figure 1, the marginal private benefit (MPB) curve intersects the marginal social cost (MSC) at point C, resulting in suboptimal output (Q_market). The true social optimum (Q_optimal) lies at the intersection of MSC and the marginal social benefit (MSB), which includes both MPB and marginal external benefits (MEB). Government intervention in the form of public R&D subsidies, infrastructure spending, or basic research grants can internalize these externalities by shifting MPB toward MSB. This improves dynamic efficiency and promotes inclusive innovation [11,33]. Moreover, from a spatial economics perspective, such interventions can generate agglomeration and knowledge spillover effects across regions, amplifying their impact on GTFP [23,26]. Figure 1 illustrates this logic in the context of publicly shared fintech infrastructure, rather than privately protected commercial technologies.
Drawing from the foregoing theoretical discussion, this study proposes the following hypotheses:
H1. 
Financial technology expenditure promotes the growth of GTFP.

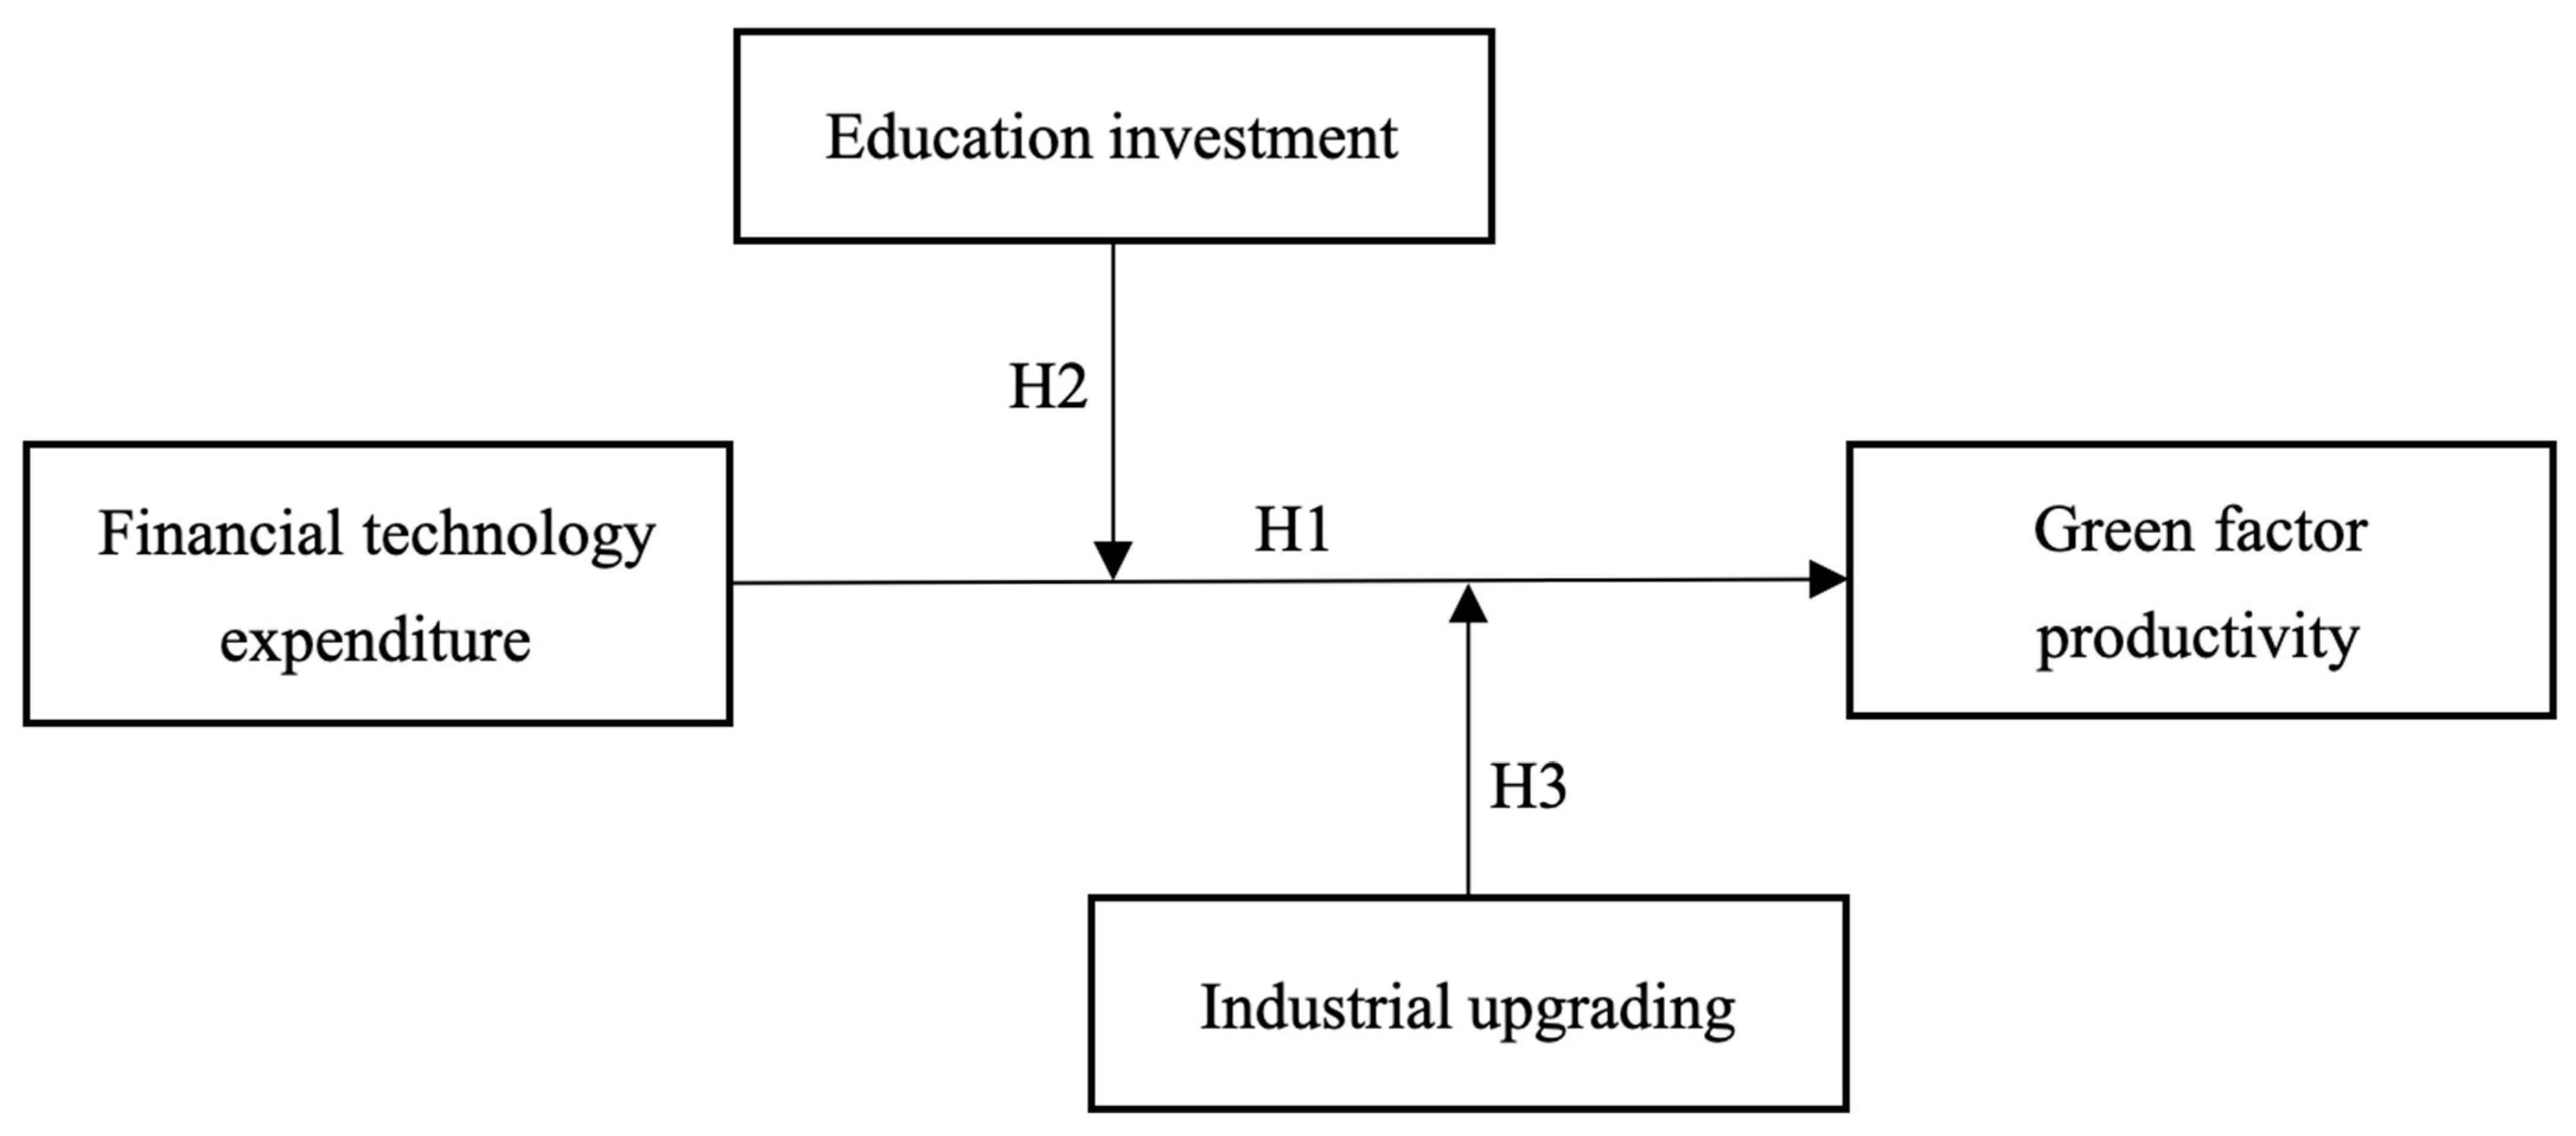
3.2. Transmission Mechanism of Financial Technology Expenditures Promoting the Growth of GTFP

In addition to direct efficiency gains, financial technology expenditure influences GTFP through two key transmission channels: industrial upgrading and human capital improvement.
At the macro level, investments in science and technology promote industrial upgrading by reallocating resources toward low-carbon and high-efficiency sectors [23]. This transition enhances resource use efficiency, reduces pollutant emissions, and drives productivity growth. Green fiscal spending also facilitates intersectoral technological spillovers, clustering effects, and green value chain integration, thereby supporting system-wide GTFP improvements [26].
At the micro level, education investment—especially in the science, technology, engineering, and mathematics (STEM) fields—improves cognitive and technical skills, thereby increasing the capacity to absorb and utilize green innovations [25]. Stronger human capital not only accelerates green technology adoption but also supports regional convergence in innovation capacity and productivity performance. Additionally, improvements in education reduce structural mismatches between the labor supply and emerging green industries, facilitating smooth industrial transitions [34].
These interactions are visualized in Figure 2 and form the conceptual basis for the following hypotheses:
H2. 
Educational investment is supposed to strengthen the promoting effect of financial technology expenditure on GTFP growth.
H3. 
Industrial upgrading is supposed to strengthen the promoting effect of financial technology expenditures on GTFP growth.

4. Framework Design

4.1. Econometric Model

To explore the dynamic effects of financial technology expenditure on green total factor productivity (GTFP), a panel vector autoregressive (PVAR) model and a series of interaction models are adopted. The baseline PVAR model is defined as follows:
y i t = θ 0 + j = 1 k θ j y i t j + α i + β t + μ i t
where y i t represents the column vector containing the two variables of financial technology expenditure and GTFP; subscripts i, t, and k index regions, years, and lag periods, respectively; θ 0 is the intercept term vector; θ j is the lag order; α i and β t are individual effects and time effects, respectively; and μ i t is the random error term.
To examine the moderating role of key structural variables, the following interaction effect models are constructed:
G t f p i t = θ 0 + θ 1 K J i t + θ 2 M i t + θ 3 E du i t K J i t + θ j c o n t r o l i t + α i + β t + δ i t
G t f p i t = θ 0 + θ 1 K J i t + θ 2 M i t + θ 3 I n d i t K J i t + θ j c o n t r o l i t + α i + β t + δ i t
Among these, Equation (2) E d u i t K J i t represents the interaction term between education investment and financial technology expenditure, which is used to measure the moderating function of education investment on financial technology expenditure and GTFP. Equation (3) I n d i t K J i t represents the interaction term of industrial upgrading and financial technology expenditure, which is used to measure the moderating function of industrial upgrading on financial technology expenditure and GTFP.
Drawing on the approach proposed by Sun [35], this study employs the super-SBM model with undesirable outputs to measure green total factor productivity (GTFP). As an integration of the super-efficiency framework and slack-based measure (SBM) model, the super-SBM method offers distinct advantages over conventional radial BCC or CCR models. Specifically, it accounts for input and output slacks, incorporates undesirable outputs, and addresses the issue of multiple decision-making units (DMUs) being simultaneously efficient, thereby enhancing the precision of efficiency evaluation. The model is specified as follows:
ρ + = min 1 + 1 m i = 1 m ( s i x i k ) 1 1 q 1 + q 2 ( r = 1 q 1 s r + y r k + t = 1 q 2 s t b b r k )
e c t t o = j = 1 , j k n x i j λ j s i x i k j = 1 , j k n y i j λ j s i y i k j = 1 , j k n b i j λ j s i b b i k 1 1 q 1 + q 2 ( r = 1 q 1 s r + y r k + t = 1 q 2 s t b b r k ) > 0 λ , s , s + , s b 0 i = 1 , 2 m ; r = 1 , 2 q ; j = 1 , 2 n ( j k )
where ρ* represents the GTFP value. When ρ* > 1, the GTFP is highly efficient; otherwise, it is inefficient. Second, xik, yrk, and btk represent inputs, desirable outputs, and undesirable outputs, respectively; s−, s+, and sb− are the slack variables of inputs, desirable outputs, and undesirable outputs, respectively; and m, q, and n are the quantities of inputs, outputs, and decision-making units, respectively. In the model, q1 and q2 denote the quantities of desirable and undesirable outputs, respectively, and λ represents the weight vector assigned to each decision-making unit.

4.2. Variable Description

Following prior research, this study constructs an integrated GTFP evaluation framework, with full documentation in Table 1. The input indicators include labor (measured by year-end employment), material capital (measured by fixed asset investment), and natural resource consumption (including water supply, urban construction land area, and energy use) [23]. These variables reflect the traditional input dimensions of production. The desirable output is captured by the gross domestic product (GDP), whereas the undesirable outputs include sulfur dioxide, smoke and dust emissions; chemical oxygen demand (COD) in wastewater; and carbon dioxide emissions. This configuration is consistent with recent green productivity studies [18,36].
The core explanatory variable, financial technology expenditure (KJ), reflects the provincial-level fiscal input into scientific research and technological advancement. It is used as a proxy for public R&D support, which addresses market failures stemming from the public good nature of technological knowledge [5]. Such expenditures aim to correct underinvestment by private sectors due to limited appropriation of social returns, thereby justifying fiscal involvement [25,37].
The moderating variables are education investment (EDU) and industrial upgrading (IND). Education investment is measured by fiscal education expenditure, as it supports human capital formation and knowledge absorption. Industrial upgrading is proxied by the ratio of tertiary industry to secondary industry output. This ratio indicates the relative importance of high-value-added, service-oriented sectors (e.g., information technology, finance, R&D) compared with resource- and energy-intensive sectors (e.g., heavy manufacturing). A higher ratio is generally interpreted as a shift toward cleaner, more sustainable economic activity, though we acknowledge certain service industries (e.g., logistics, tourism) may also contribute to emissions [7,21].
The control variables include the urbanization level (CZH), which is measured as the proportion of urban permanent residents in the total population. While some literature suggest that a higher urbanization rate improves resource allocation and infrastructure efficiency [38], other scholars find this association to be non-linear or region-specific [39]. Therefore, urbanization is treated as a structural context variable rather than a purely efficiency-enhancing factor. Transportation infrastructure (TRI), measured by highway mileage per square kilometer, captures the spatial connectivity and accessibility across provinces. We acknowledge that this indicator may not fully represent the environmental sustainability or quality of transportation networks. However, it remains a widely adopted proxy for regional accessibility and logistics efficiency, which are crucial for innovation diffusion and economic coordination in large developing economies [34].
Other control variables include the financial development level (JR), measured by the ratio of financial sector added value to GDP. This variable reflects the efficiency of financial intermediation and access to capital, which have been found to influence productivity, innovation, and environmental performance through credit allocation and investment channels [26,34].

4.3. Data Description

The dataset comprises a provincial panel of 30 Chinese administrative units, ranging from 2012 to 2020, with Tibet, Hong Kong, Macao, and Taiwan excluded owing to data limitations. We selected this period on the basis of both methodological and contextual considerations. First, data availability and consistency have been assured from 2012, at which time the implementation of China’s major financial technology policies and digital economy initiatives began. More importantly, we deliberately ended our observation window in 2020 to avoid the confounding effects of the COVID-19 pandemic and associated economic shocks.
For the purposes of regional analysis, the samples were divided into three groups: the eastern region included Beijing, Tianjin, Liaoning, Shandong, Hebei, Shanghai, Jiangsu, Zhejiang, Fujian, Guangdong, and Hainan; the western region included Chongqing, Sichuan, Guizhou, Yunnan, Shaanxi, Gansu, Qinghai, Ningxia, and Xinjiang; and the central region included Shanxi, Jilin, Heilongjiang, Henan, Anhui, Hunan, Hubei, Jiangxi, Guangxi, and Inner Mongolia [40]. Empirical evidence was compiled from officially published statistical yearbooks at both the national and sub-national levels. In cases where specific data points are missing, particularly in national yearbooks, the moving average method was adopted to maintain data consistency and continuity across the sample. The descriptive statistics for the key variables used in the empirical analysis are summarized in Table 2.

5. Empirical Analysis

5.1. Stationarity Test

To prevent the risk of spurious regression, we conduct stationarity tests on the financial technology expenditure and GTFP series via four commonly applied panel unit root tests: the Levin–Lin–Chu (LLC) test, the Im–Pesaran–Shin (IPS) test, the augmented Dickey–Fuller (ADF) test, and the Phillips–Perron (PP) test. The corresponding test results are presented in Table 3. In the national and eastern regions, financial technology expenditure and GTFP fail to pass the unit root test, but after first-order differencing, the data of financial technology expenditure and GTFP are stationary nationwide and in different regions; therefore, further cointegration tests are needed.

5.2. Cointegration Test

Given that both financial technology expenditure and GTFP become stationary after first-order differencing, it is appropriate to proceed with cointegration testing. This study employs the Kao and Pedroni tests to examine the long-run relationship between the two variables. As reported in Table 4, the null hypothesis of no cointegration is rejected at the 5% significance level across the national sample, as well as in the eastern, central, and western regions. These results suggest the existence of a stable long-term equilibrium relationship between financial technology expenditure and GTFP, thereby providing empirical justification for the application of the panel vector autoregressive (PVAR) model.

5.3. Determination of the Optimal Lag Order

Identifying the optimal lag order is essential to ensure the accuracy and reliability of the model estimation, particularly in the context of panel vector autoregression. Selecting a lag order that is too small will fail to fully reflect the information contained in the variables, whereas a lag order that is too large will lead to too few degrees of freedom, making it impossible to estimate the model. As the PVAR model is designed to capture dynamic relationships among variables, a lag length of zero eliminates the time-dependent structure and is thus not considered appropriate.
This study determines the optimal lag length via three information criteria: the Akaike information criterion (AIC), the Bayesian information criterion (BIC), and the Hannan–Quinn information criterion (HQIC). These criteria balance model fit and parsimony by penalizing excessive parameters. A lower value of each criterion indicates a better model specification. Specifically, the AIC tends to favor models with better goodness of fit but may overfit small samples. BIC imposes a stricter penalty on the number of parameters, thus favoring more parsimonious models. HQIC lies between the two in terms of stringency.
As shown in Table 5, all three information criteria reach their minimum at lag length one, suggesting that a PVAR(1) model provides the best trade-off between model complexity and explanatory power. Therefore, the PVAR(1) model is selected for the full national sample as well as for the eastern, central, and western regional subsamples.

5.4. GMM Parameter Estimation

Prior to conducting the GMM estimation of the PVAR model, the data were transformed via the Helmert procedure to eliminate both time-specific and individual fixed effects, thereby reducing potential biases in the parameter estimation. However, given that the PVAR framework is relatively theory agnostic, the estimated coefficients, particularly their signs, magnitudes, and statistical significance, do not carry out direct economic interpretations. As such, this study reports the estimation results for completeness (see Table 6) but emphasizes the subsequent Granger causality tests and impulse response analyses.

5.5. Granger Causality Test

To further explore the dynamic causal relationship between financial technology expenditure and GTFP, this paper conducts a Granger causality test on financial technology expenditure and GTFP. According to Table 7, in the eastern region, financial technology expenditures and GTFP are bidirectional Granger causes, whereas in non-eastern regions, financial technology expenditures are unidirectional Granger causes.

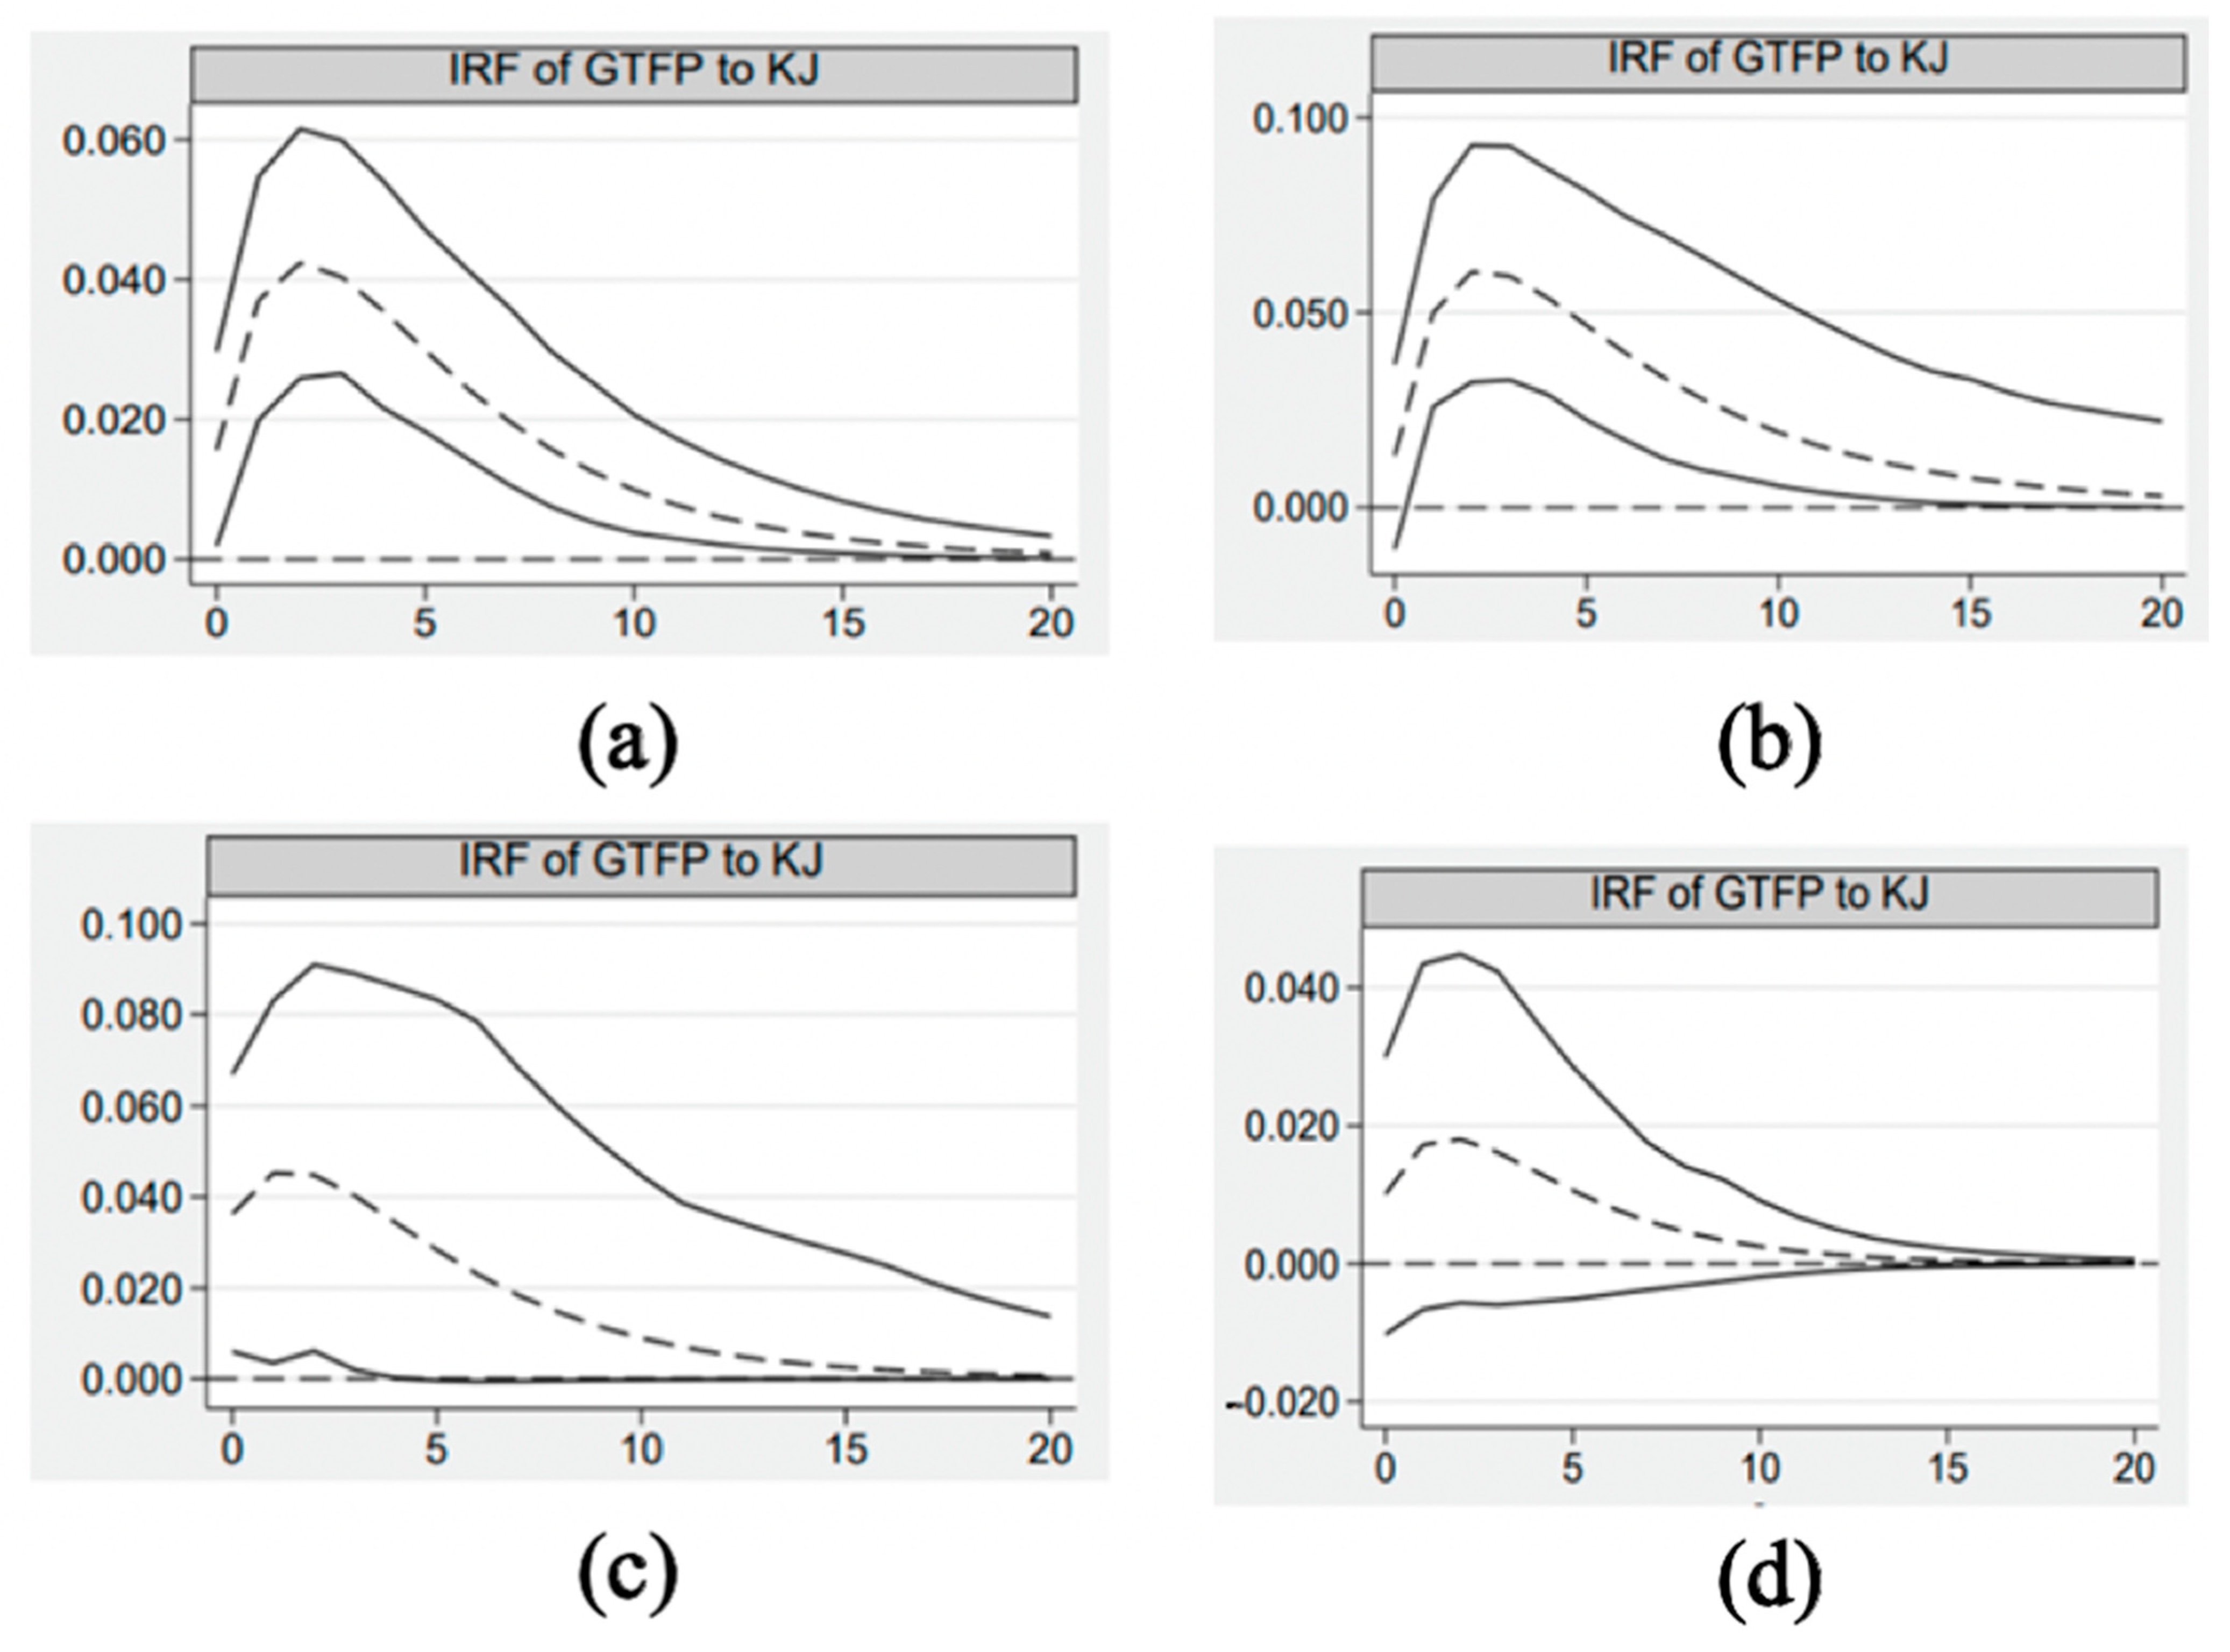
5.6. Impulse Response

After testing, the GTFP and financial technology expenditure (KJ) are both stationary sequences and are mutually causal. The optimal lag order was determined to be 1. To investigate the time-varying effects of financial technology investment on China’s green total factor productivity, building upon the PVAR(1) model, this study conducts 500 Monte Carlo simulations on financial technology expenditure and GTFP and obtains the effect of financial technology expenditure on GTFP. To explore regional heterogeneity, we further perform subsample regressions for different regions. The corresponding results are presented in the figure. Figure 3a shows the degree of response of the GTFP to the shock of financial technology expenditures nationwide. Financial technology expenditure initially had a positive impact on GTFP, which gradually strengthened, reached a maximum around the 3rd period, then began to slowly decrease, and gradually approached 0 around the 20th period. This finding indicates that fiscal technology expenditures promote the improvement of the GTFP in terms of the national scope, and this positive promoting function is sustainable. Figure 3b–d depict the impulse response functions of financial technology expenditures to GTFP shocks in the eastern, central, and western regions, respectively. Although the response patterns across the three regions broadly mirror the national-level response, the magnitude of the positive effect varies. Specifically, the eastern region has the strongest response, followed by the central region, and the western region has the weakest effect, indicating notable regional disparities in the responsiveness of financial technology expenditure to GTFP fluctuations. In general, financial technology expenditure has a positive effect on GTFP.

6. Further Analysis: Moderating Effects and Threshold Effects

6.1. Moderating Effects

The preceding group regression analysis revealed a statistically significant and positive association between financial technology expenditure and GTFP indicators. Education investment (EDU) and industrial structure (IND) were substituted into Models (2) and (3), respectively, for regression testing. Model (3) adds the interaction term of financial technology expenditure and the moderating variables to determine whether the coefficient is significant. A statistically significant result leads to rejection of the null hypothesis, thereby confirming the presence of a moderating effect.
The interaction term coefficient of financial technology expenditure and education investment in Column (1) of Table 8 is significantly positive at the 5% level, with a coefficient of 0.059, indicating that education investment has a significant moderating effect on the process by which financial technology expenditure empowers GTFP. Education investment strengthens the positive relationship between financial technology expenditure and GTFP and is an important moderating variable through which financial technology expenditure empowers GTFP. Therefore, Hypothesis H2 holds. The interaction coefficient of financial technology expenditure and industrial upgrading in column (2) of the table, the coefficient of 0.206, is significant at the 10% level, suggesting that industrial upgrading has a significant moderating effect on the process of financial technology expenditure empowering GTFP. Industrial upgrading strengthens the positive relationship between financial technology expenditure and GTFP and is an important moderating variable through which financial technology expenditure empowers GTFP. Therefore, Hypothesis H3 holds.

6.2. Threshold Effects

Educational investment and industrial upgrading are important factors through which financial technology expenditure drives GTFP growth. To this end, this study uses the threshold effect model to examine the threshold effect of education investment and industrial upgrading in the process of financial technology expenditures promoting GTFP growth to further clarify the realization conditions for financial technology expenditures to promote GTFP growth. Accordingly, the following panel threshold model was developed to capture potential nonlinear relationships:
G T F P i t = α 0 + α 1 · K J i t · I ( q i t γ 1 ) + α 2 · K J i t · I ( q i t > γ 2 ) + n = 3 5   ( α n · X n , i t ) + ε i t
where q is the threshold variable, which is education investment or industrial upgrading; I(·) is the indicator function for segmentation according to different threshold values; γ1 and γ2 are the threshold values to be estimated; and the other variable settings are the same as those in Model (1).
The threshold regression results (Table 9) reveal that education investment is significant under one- and two-threshold specifications, whereas industrial upgrading is significant only under a single-threshold framework. Specifically, the single-threshold effect of educational investment is statistically significant, with a threshold value of 9.3674. This value corresponds to the log-transformed per capita fiscal education expenditure.
Economically, the presence of a threshold implies that education investment only begins to significantly enhance green productivity once a region reaches a sufficient level of human capital infrastructure. Below this level, additional spending may be absorbed by inefficiencies such as low school quality, lack of research capacity, or poor institutional coordination. Once the threshold is surpassed, education contributes more effectively to the training of skilled labor, innovation diffusion, and the development of green technologies.
For the INN variable in Table 10, the coefficient above the education investment threshold (0.151) is statistically larger than the below-threshold coefficient (0.061). This supports the existence of increasing marginal returns to education investment, where only after meeting basic institutional and capital requirements does education serve as a true catalyst for sustainable growth. After exceeding the threshold value, it significantly enhances the growth of GTFP and shows the characteristic of a “marginal effect increasing.”
Although the eastern and central provinces have exceeded the threshold value, some western regions, such as Guangxi, Gansu, and Xinjiang, still have values below the threshold value, indicating that education investment in some provinces and cities in the western region is still insufficient. This suggests that targeted increases in education funding in lagging regions could unlock latent green productivity potential, narrow regional disparities, and strengthen national-level innovation capacity. Therefore, the central and western regions should further increase educational investment and cultivate human capital.
The analysis revealed a relatively pronounced single-threshold effect associated with industrial upgrading, with a threshold value of 0.0814. The column of variable IND in Table 10 shows that the statistical estimate is 0.31 after industrial upgrading, exceeding the threshold value and being significantly greater than 0.214 when it crosses the tipping point. After crossing the tipping point, it significantly enhances the growth of GTFP and shows the characteristic of a “marginal effect increasing.” Currently, 15 provinces and cities, including Jiangsu, Fujian, and Shanghai, have industrial upgrades of no less than 0.0814, but 50% of the provinces and cities still have not passed the threshold value of industrial upgrading, indicating that many provinces and cities’ industrial upgrades are within the interval with a lower estimated coefficient. Therefore, industrial upgrading should be promoted to increase GTFP growth.

7. Discussions and Conclusions

7.1. Discussions

The findings of this study are in line with the experiences of other countries. In BRICS economies, financial infrastructure and innovation have been shown to increase TFP, particularly when combined with human capital accumulation [34]. Korea’s renewable energy sector has demonstrated how government subsidies can effectively stimulate firm-level innovation and green output growth [41]. In the United States, public agricultural R&D has played a dual role in improving productivity and reducing environmental damage [42]. However, contrasting evidence from Sub-Saharan Africa and Central Europe suggests that the absence of institutional coordination, industrial modernization, or regulatory capacity can weaken the productivity effects of fiscal investment [8]. These comparisons reinforce the idea that the success of fiscal science and technology policies in promoting green productivity is highly conditional on regional capacity, governance, and complementary reforms.

7.2. Conclusions

To harness the role of financial technology expenditure, enhancing China’s green total factor productivity (GTFP) while advancing sustainable and high-quality economic development is essential. On the basis of panel data from 30 provincial-level regions spanning 2012–2020, this study constructs a GTFP indicator system and employs a combination of PVAR modeling, moderating effect analysis, and threshold effect modeling to examine both the mechanism and nonlinear characteristics of the impact of financial technology expenditure on GTFP. The main conclusions are as follows. First, financial technology expenditure plays a significant role in promoting the growth of green total factor productivity (GTFP). On the basis of the results of the PVAR model, including stationarity testing, Granger causality testing, and impulse response analysis, increased financial investment in science and technology meaningfully contributes to GTFP enhancement. Second, the impact of financial technology expenditure on GTFP exhibits significant regional heterogeneity. While financial investment in technology consistently promotes GTFP across all regions, the effect demonstrates an east > central > west descending gradient. Third, education investment and industrial upgrading serve as significant moderating variables, as their improvement not only strengthens the relationship between fiscal expenditure and GTFP but also triggers threshold effects that indicate increasing marginal returns.

7.3. Practical Implications

The empirical results of this study provide clear guidance for optimizing fiscal policy to increase green total factor productivity (GTFP). Given the robust positive relationship between financial technology expenditure and GTFP growth, especially confirmed through the PVAR model and threshold analysis, it is crucial for governments to further strengthen the design and prioritization of science and technology financial investment mechanisms. This includes increasing the strategic status of such expenditures within the fiscal system, ensuring a stable increase in funding, and expanding policy tools such as tax incentives, subsidies, and special innovation funds. Greater emphasis should be placed on directing resources to critical areas such as basic research, digital green technologies, and industrial low-carbon transformation to maximize long-term returns.
The regional heterogeneity identified in the study also highlights the need for differentiated policy approaches. In the eastern region, which already benefits from sound innovation infrastructure and human capital, efforts should focus on deepening the integration between financial expenditure and frontier technological innovation. Governments can support this through targeted support for university–industry collaboration, high-end talent training, and international R&D cooperation. In contrast, the central and western regions require foundational support, such as increased investment in education, R&D facilities, and industrial capacity building. Policies in these areas should focus on enhancing absorptive capacity and creating enabling conditions for sustainable innovation, thereby narrowing regional disparities in GTFP.
In addition, the significant moderating effects of education investment and industrial upgrading call for coordinated, multi-dimensional policy interventions. Fiscal support alone is insufficient to achieve optimal gains in green productivity. Governments must simultaneously promote high-quality educational expansion—particularly in science, engineering, and environmental disciplines—and accelerate the transformation of the industrial structure toward high-end, low-carbon, and service-oriented sectors. Cross-regional collaboration should also be encouraged through interprovincial R&D sharing mechanisms, joint innovation platforms, and regional innovation corridors, ensuring efficient allocation of scientific and technological resources and fostering a nationwide synergy for green development.

7.4. Limitations and Future Directions

Despite the rigorous empirical design and extensive dataset, several limitations merit acknowledgment. First, the model does not explicitly incorporate institutional and regulatory factors, such as environmental governance strength, market openness, intellectual property protection, or local policy enforcement intensity. These variables may critically influence how financial technology expenditure affects GTFP at the regional level. The omission of these institutional dimensions may lead to an underestimation or overestimation of the true effect of fiscal instruments in different provinces. Future research should therefore integrate institutional quality metrics and environmental regulation indicators to capture these moderating and mediating effects more comprehensively [22].
Second, while the PVAR model captures bidirectional dynamics and temporal effects, potential endogeneity issues remain a concern. Unobserved shocks—such as sudden policy interventions, political cycles, or external crises—may influence both GTFP and fiscal expenditure simultaneously, leading to biased coefficient estimates. Although this study partially mitigates such bias through lagged variables and panel settings, future work could adopt more advanced identification strategies, such as dynamic structural equation modeling, generalized method of moments (GMM) estimators with external instruments, or quasi-experimental designs such as difference-in-differences and synthetic control methods, to strengthen causal inference [40].
Third, the external validity of the findings is constrained by the geographical scope and macro-level perspective. The analysis is based on provincial-level panel data from China and does not account for intra-provincial disparities or firm-level heterogeneity in innovation capacity and green investment efficiency. Moreover, fiscal policy effects may vary significantly across sectors such as manufacturing, energy, and services. Future studies could expand this research by conducting cross-country comparative analyses or applying multi-level models that integrate provincial, industry, and enterprise dimensions. Additionally, as the digital economy and decarbonization efforts accelerate globally, future research should explore the synergistic impacts of digital infrastructure, green finance, and fiscal innovation on long-term GTFP trajectories.

Author Contributions

Conceptualization: Y.Q.; methodology: Y.Q. and Y.L.; visualization: H.X.; funding acquisition: Y.L.; project administration: G.S.; supervision: G.S.; writing—original draft: Y.Q. and H.X.; writing—review and editing: Y.L., H.X. and G.S. All authors have read and agreed to the published version of the manuscript.

Funding

This paper was supported by the Zhejiang Provincial Philosophy and Social Sciences Planning Project (23NDJC356YB).

Institutional Review Board Statement

Not applicable.

Informed Consent Statement

Not applicable.

Data Availability Statement

Data will be made available upon request.

Conflicts of Interest

The authors declare no conflicts of interest.

References

  1. Xu, K.; Zhao, P. Does Green Finance Promote Green Total Factor Productivity? Empirical Evidence from China. Sustainability 2023, 15, 11204. [Google Scholar] [CrossRef]
  2. Fan, F.; Lian, H.; Liu, X.; Wang, X. Can Environmental Regulation Promote Urban Green Innovation Efficiency? An Empirical Study Based on Chinese Cities. J. Clean. Prod. 2021, 287, 125060. [Google Scholar] [CrossRef]
  3. Tao, R.; Su, C.-W.; Naqvi, B.; Rizvi, S.K.A. Can Fintech Development Pave the Way for a Transition towards Low-Carbon Economy: A Global Perspective. Technol. Forecast. Soc. Chang. 2022, 174, 121278. [Google Scholar] [CrossRef]
  4. Fu, H.; Ge, R.; Huang, J.; Shi, X. The Effect of Education on Health and Health Behaviors: Evidence from the College Enrollment Expansion in China. China Econ. Rev. 2022, 72, 101768. [Google Scholar] [CrossRef]
  5. Arrow, K.J. Economic Welfare and the Allocation of Resources for Invention. In Readings in Industrial Economics; Macmillan Education: London, UK, 1972; pp. 219–236. ISBN 978-0-333-10973-1. [Google Scholar]
  6. Stiglitz, J.E. Knowledge as a Global Public Good. In Global Public Goods; Oxford University Press: New York, NY, USA, 1999; pp. 308–325. ISBN 978-0-19-513052-2. [Google Scholar]
  7. You, X.; Li, Z.; Yi, Y. Carbon Constraints, Industrial Structure Upgrading, and Green Total Factor Productivity: An Empirical Study Based on the Yangtze River Economic Belt. J. Water Clim. Chang. 2023, 14, 3010–3026. [Google Scholar] [CrossRef]
  8. Cazzavillan, G.; Donadelli, M.; Persha, L. Economic Growth and Poverty Traps in Sub-Saharan Africa: The Role of Education and TFP Shocks. Res. Econ. 2013, 67, 226–242. [Google Scholar] [CrossRef]
  9. Jiang, Y.; Ramzan, M.; Awosusi, A.A.; Adebayo, T.S. Moderating Role of Green Innovation and Fiscal Expenditure towards Achieving the Sustainable Development Agenda 2030 at Provincial-Level in China: Policy Implication from Green Total Factor Productivity. Environ. Sci. Pollut. Res. 2023, 30, 102818–102838. [Google Scholar] [CrossRef]
  10. Chen, S.; Golley, J. ‘Green’ Productivity Growth in China’s Industrial Economy. Energy Econ. 2014, 44, 89–98. [Google Scholar] [CrossRef]
  11. Ahmed, E.M.; Elfaki, K.E. Enhancing Environmental Quality and Economic Growth through Potential Effects of Energy Efficiency and Renewable Energy in Asian Economies. Sci. Rep. 2024, 14, 22914. [Google Scholar] [CrossRef]
  12. Cui, H.; Wang, H.; Zhao, Q. Which Factors Stimulate Industrial Green Total Factor Productivity Growth Rate in China? An Industrial Aspect. Greenh. Gases Sci. Technol. 2019, 9, 505–518. [Google Scholar] [CrossRef]
  13. Charnes, A.; Cooper, W.W.; Rhodes, E. Measuring the Efficiency of Decision Making Units. Eur. J. Oper. Res. 1978, 2, 429–444. [Google Scholar] [CrossRef]
  14. Chung, Y.H.; Färe, R.; Grosskopf, S. Productivity and Undesirable Outputs: A Directional Distance Function Approach. J. Environ. Manag. 1997, 51, 229–240. [Google Scholar] [CrossRef]
  15. Färe, R.; Grosskopf, S.; Pasurka, C.A., Jr. Accounting for Air Pollution Emissions in Measures of State Manufacturing Productivity Growth. J. Reg. Sci. 2001, 41, 381–409. [Google Scholar] [CrossRef]
  16. Tone, K. A Slacks-Based Measure of Super-Efficiency in Data Envelopment Analysis. Eur. J. Oper. Res. 2002, 143, 32–41. [Google Scholar] [CrossRef]
  17. Oh, D. A Global Malmquist-Luenberger Productivity Index. J. Prod. Anal. 2010, 34, 183–197. [Google Scholar] [CrossRef]
  18. Zhang, H.; Geng, C.; Wei, J. Coordinated Development between Green Finance and Environmental Performance in China: The Spatial-Temporal Difference and Driving Factors. J. Clean. Prod. 2022, 346, 131150. [Google Scholar] [CrossRef]
  19. Chen, C.; Lan, Q.; Gao, M.; Sun, Y. Green Total Factor Productivity Growth and Its Determinants in China’s Industrial Economy. Sustainability 2018, 10, 1052. [Google Scholar] [CrossRef]
  20. Liu, Y.; Wu, A.; Wang, J.; Taghizadeh-Hesary, F.; Dong, X. Green Growth in the Global South: How Does Metallic Minerals Affect GTFP Enhancement? Resour. Policy 2024, 88, 104505. [Google Scholar] [CrossRef]
  21. Wang, X.; Wu, X.; Chu, N.; Zhang, Y.; Wang, L. Coupling Relationship between Urbanization and Green Total Factor Productivity in the Context of Population Shrinkage: Evidence from the Rust Belt Region of China. Sustainability 2024, 16, 1312. [Google Scholar] [CrossRef]
  22. Fan, M.; Yang, P.; Li, Q. Impact of Environmental Regulation on Green Total Factor Productivity: A New Perspective of Green Technological Innovation. Environ. Sci. Pollut. Res. 2022, 29, 53785–53800. [Google Scholar] [CrossRef]
  23. Zhou, Y.; Lin, Z.; Zhang, Y.; Sun, W.; Lei, F.; Gao, W. Impact of Changes in Energy Structure and Industrial Structure on Green Total Factor Productivity in the Context of Environmental Protection—Evidence from China. Environ. Sci. Pollut. Res. 2024, 31, 17097–17114. [Google Scholar] [CrossRef]
  24. Derbentsev, V.; Pasichnyk, Y.; Tulush, L.; Pozhar, I. Analysis of the Impact of Expenditures on Education and R&D on GDP in Central European Countries. Stat. Stat. Econ. J. 2021, 101, 383–405. [Google Scholar] [CrossRef]
  25. Ma, C.; Ma, Y.; Wu, W. A Pathway to Sustainable Development in China: The Impact of Local Higher Education Expenditure on Green Total Factor Productivity. Heliyon 2024, 10, e34415. [Google Scholar] [CrossRef]
  26. Lu, Y.; Ahmad, M.; Zhang, H.; Guo, J. Effects of Science and Technology Finance on Green Total Factor Productivity in China: Insights from an Empirical Spatial Durbin Model. J. Knowl. Econ. 2023, 15, 7280–7306. [Google Scholar] [CrossRef] [PubMed]
  27. Zhao, J.; Yan, J. The Impact of Public Fiscal Expenditure on Industrial Transformation and Upgrading: An Inverted U-Shape Evidence from China. Heliyon 2024, 10, e38456. [Google Scholar] [CrossRef] [PubMed]
  28. Wei, L.; Lin, B.; Zheng, Z.; Wu, W.; Zhou, Y. Does Fiscal Expenditure Promote Green Technological Innovation in China? Evidence from Chinese Cities. Environ. Impact Assess. Rev. 2023, 98, 106945. [Google Scholar] [CrossRef]
  29. Hou, S.; He, J.; Song, L. Fiscal Science and Technology Expenditure and the Spatial Convergence of Regional Innovation Efficiency: Evidence from China’s Province-Level Data. Econ. Res.-Ekon. Istraž. 2023, 36, 1848–1866. [Google Scholar] [CrossRef]
  30. Zhou, C.; Zhang, X. Measuring the Efficiency of Fiscal Policies for Environmental Pollution Control and the Spatial Effect of Fiscal Decentralization in China. Int. J. Environ. Res. Public Health 2020, 17, 8974. [Google Scholar] [CrossRef]
  31. Popović, M.; Savić, G.; Kuzmanović, M.; Martić, M. Using Data Envelopment Analysis and Multi-Criteria Decision-Making Methods to Evaluate Teacher Performance in Higher Education. Symmetry 2020, 12, 563. [Google Scholar] [CrossRef]
  32. Nelson, R.R. The Simple Economics of Basic Scientific Research. J. Political Econ. 1959, 67, 297–306. [Google Scholar] [CrossRef]
  33. Yuan, B.; Xiang, Q. Environmental Regulation, Industrial Innovation and Green Development of Chinese Manufacturing: Based on an Extended CDM Model. J. Clean. Prod. 2018, 176, 895–908. [Google Scholar] [CrossRef]
  34. Rehman, F.U.; Islam, M.M. Financial Infrastructure—Total Factor Productivity (TFP) Nexus within the Purview of FDI Outflow, Trade Openness, Innovation, Human Capital and Institutional Quality: Evidence from BRICS Economies. Appl. Econ. 2023, 55, 783–801. [Google Scholar] [CrossRef]
  35. Sun, X. Analysis of Green Total Factor Productivity in OECD and BRICS Countries: Based on the Super-SBM Model. J. Water Clim. Chang. 2022, 13, 3400–3415. [Google Scholar] [CrossRef]
  36. Zhang, J.; Lu, G.; Skitmore, M.; Ballesteros-Pérez, P. A Critical Review of the Current Research Mainstreams and the Influencing Factors of Green Total Factor Productivity. Environ. Sci. Pollut. Res. 2021, 28, 35392–35405. [Google Scholar] [CrossRef] [PubMed]
  37. Zhou, Y.; Chen, G.; Huang, L.; Lin, Z.; Jin, J.; Lu, F. Empirical Analysis of the Impact of Green Finance and Technological Progress on Total Factor Productivity in China’s Industrial Sector. Proc. Bus. Econ. Stud. 2023, 6, 39–44. [Google Scholar] [CrossRef]
  38. Tan, R.; Pan, L.; Xu, M.; He, X. Transportation Infrastructure, Economic Agglomeration and Non-Linearities of Green Total Factor Productivity Growth in China: Evidence from Partially Linear Functional Coefficient Model. Transp. Policy 2022, 129, 1–13. [Google Scholar] [CrossRef]
  39. Sheng, P.; He, Y.; Guo, X. The Impact of Urbanization on Energy Consumption and Efficiency. Energy Environ. 2017, 28, 673–686. [Google Scholar] [CrossRef]
  40. Lee, C.-C.; Lee, C.-C. How Does Green Finance Affect Green Total Factor Productivity? Evidence from China. Energy Econ. 2022, 107, 105863. [Google Scholar] [CrossRef]
  41. Sung, B. Do Government Subsidies Promote Firm-Level Innovation? Evidence from the Korean Renewable Energy Technology Industry. Energy Policy 2019, 132, 1333–1344. [Google Scholar] [CrossRef]
  42. Baldos, U.L.C. Impacts of US Public R&D Investments on Agricultural Productivity and GHG Emissions. J. Agric. Appl. Econ. 2023, 55, 536–550. [Google Scholar] [CrossRef]
Figure 1. Market failure caused by scientific and technological products.
Sustainability 17 06653 g001
Figure 2. Hypothesized framework.
Sustainability 17 06653 g002
Figure 3. Impulse response graph. Note: The four graphs from left to right and top to bottom (ad) represent the impulse response functions depicting financial technology expenditures to GTFP shocks in the national, eastern, central, and western regions, respectively.
Sustainability 17 06653 g003
Table 1. GTFP indicator system.
First-Level IndicatorSecond-Level IndicatorThird-Level IndicatorUnitData Source
Input indicatorLabor capitalYear-end employment10,000 peopleChina Statistical Yearbook
Material capitalFixed asset investmentRMB 100 millionChina Statistical Yearbook
Resource consumptionWater supply100 million cubic metersChina Statistical Yearbook
Urban construction Land areaSquare kilometersChina Statistical Yearbook
Energy consumption10,000 tons of standard coalChina Energy Statistical Yearbook
Desirable output indicatorEconomic development levelGross domestic productRMB 100 millionChina Statistical Yearbook
Undesirable output indicatorPollutant dischargeSulfur dioxide emissions10,000 tonsChina Environmental Protection Yearbook
Smoke and dust emissions10,000 tonsChina Environmental Protection Statistical Yearbook
Industrial wastewater (COD)10,000 tonsChina Energy Statistical Yearbook
Carbon dioxide emissionsMillion tonsChina Statistical Yearbook
Table 2. Variable description.
Variable NameVariable DefinitionMeanStandard DeviationMinimumMaximum
Explained VariableGreen total factor productivity (GTFP)Calculated by undesirable output super-efficiency SBM method0.2930.602−1.8581.065
Explanatory VariableFinancial technology expenditure (KJ)Financial technology expenditure4.3561.0421.9717.064
Mediating VariablesEducation investment (EDU)Fiscal education expenditure2.8370.4192.0744.130
Industrial upgrading (IND)Tertiary industry/secondary industry0.1620.178−0.1680.827
Control VariablesUrbanization level (CZH)Number of urban permanent residents/total population4.0330.2013.5544.495
Financial development level (JR)Financial added value/GDP7.1530.9214.5599.212
Transportation infrastructure (TRI)Highway mileage/provincial area−0.2600.765−2.3900.791
Table 3. Stationarity test.
RegionVariableLLC TestIPS TestADF TestPP TestConclusion
NationalKJ−12.5137
−0.6336
−0.21045
(0.4167)
74.5604
(0.0978)
149.38 ***
(0.0000)
Nonstationary
D_KJ−12.1446 ***
(0.0000)
−8.1133 ***
(0.0000)
141.849 ***
(0.0000)
217.068 ***
(0.0000)
Stationary
GFTP−4.21253 ***
(0.0000)
−2.86153 ***
(0.0021)
87.7694 ***
(0.0008)
86.1054 ***
(0.0012)
Nonstationary
D_GFTP−11.6626 ***
(0.0000)
−4.30073 ***
(0.0000)
157.466 ***
(0.0000)
220.812 ***
(0.0000)
Stationary
EastKJ−4.45812 ***
(0.0000)
0.78488
(0.6833)
16.3131
(0.8000)
32.8585 *
(0.0639)
Nonstationary
D_KJ−7.0327 ***
(0.0000)
−1.3474 ***
(0.0458)
36.0838 **
(0.0297)
28.002 ***
(0.0011)
Stationary
GFTP−2.0561 ***
(0.0000)
−1.2296
(0.1402)
29.3319
(0.1356)
24.6116 **
(0.0417)
Nonstationary
D_GFTP−7.63402 ***
(0.0000)
−3.42337 ***
(0.0000)
65.1455 ***
(0.0000)
84.1528 ***
(0.0000)
Stationary
CentralKJ−10.7349 ***
(0.0000)
−0.3481
(0.2326)
56.7536 **
(0.0257)
114.68 ***
(0.0000)
Stationary
D_KJ−15.347 ***
(0.0000)
−5.162 ***
(0.0000)
103.832 ***
(0.0000)
176.703 ***
(0.0000)
Stationary
GFTP−7.51495 ***
(0.0000)
−2.67317 ***
(0.0038)
69.3391 **
(0.0014)
23.9847 ***
(0.0052)
Stationary
D_GFTP−11.8048 ***
(0.0000)
−2.5646 ***
(0.0000)
96.7376 ***
(0.0000)
144.196 ***
(0.0000)
Stationary
WestKJ−5.3244 ***
(0.0000)
0.0363 ***
(0.5145)
18.6038 ***
(0.2897)
49.4342 **
(0.0009)
Stationary
D_KJ−7.83248 ***
(0.0000)
−1.4858 ***
(0.0035)
36.5365 ***
(0.0024)
68.4536 ***
(0.0000)
Stationary
GFTP−5.81119 ***
(0.0000)
−1.2221 **
(0.0276)
30.5798 **
(0.0152)
29.8228 **
(0.0189)
Stationary
D_GFTP−9.23452 ***
(0.0000)
−2.80252 ***
(0.0025)
24.0016 ***
(0.0011)
33.3011 ***
(0.0000)
Stationary
Note: *, **, *** indicate p < 0.1, p < 0.05, and p < 0.01, respectively; the standard errors are in parentheses.
Table 4. Cointegration test.
RegionKao TestPedroni
T Valuep ValueT Valuep Value
National−1.19090.0046−7.03390.0000
East−1.99400.0011−3.53520.0000
Central−1.19010.0123−1.78640.0027
West−3.31950.0000−4.11520.0000
Table 5. Selection of the optimal lag order.
Lag
Order
NationalEastCentralWest
AICBICHQICAICBICHQICAICBICHQICAICBICHQIC
1−4.82 *−3.38 *−5.36 *−4.17 *−3.52 *−4.17 *−5.42 *−4.69 *−5.20 *−7.22 *−6.31 *−6.87 *
2−1.260.10−0.61−3.34−2.18−3.21−1.93−1.86−1.53−5.90−5.72−5.48
3−0.221.150.16−2.31−0.73−2.22−3.40−3.05−3.61−5.50−4.00−5.02
Note: * indicates p < 0.1.
Table 6. GMM parameter estimation.
RegionVariableh_dKJh_dGFTP
b_GMMtb_GMMt
NationalL.h_dKJ−0.1457 *0.2422−0.3218 ***0.0079
L.h_dGFTP−0.12640.07510.7721 ***0.0206
EastL.h_dKJ0.2291 **0.12680.1071 *0.0127
L.h_dGFTP0.38090.76280.2724 *0.1354
CentralL.h_dKJ−0.1125 *0.3295−0.2647 ***0.0947
L.h_dGFTP0.13240.22730.7239 ***0.0711
WestL.h_dKJ−0.1536 *0.1329−0.00030.0125
L.h_dGFTP−0.93818.05570.06010.6472
Note: h indicates the form that eliminated the fixed effect after the Helmert transformation; L. indicates first-order lag; *, **, *** indicate p < 0.1, p < 0.05, and p < 0.01, respectively.
Table 7. Granger test.
RegionVariableNull HypothesisF ValueConclusion
NationalGFTPKJ is not the cause1.2363 **Reject
KJGFTP is not the cause7.4583Accept
EastGFTPKJ is not the cause0.2835 **Reject
KJGFTP is not the cause0.4522 ***Reject
CentralGFTPKJ is not the cause0.2787 ***Reject
KJGFTP is not the cause7.0347Accept
WestGFTPKJ is not the cause0.5643Accept
KJGFTP is not the cause4.222 ***Reject
Note: ** and *** indicate p < 0.05 and p < 0.01, respectively.
Table 8. Moderating effect test.
(1)(2)
GTFPGTFP
KJ0.614 **0.092 *
(0.016)(0.071)
EDU0.101 **0.274 **
(0.021)(0.018)
IND0.272 *1.028 **
(0.056)(0.026)
KJ*EDU0.059 **
(0.050)
KJ*IND 0.206 *
(0.049)
N270.000270.000
R20.0280.024
Note: * and ** indicate p < 0.1 and p < 0.05.
Table 9. Threshold effect test.
ModelRSSMSEF Valuep Value
Education investmentSingle threshold88.8750.34056.30.016
Double threshold86.15670.33018.230.03
Triple threshold83.80720.32117.320.75
Industrial upgradingSingle threshold88.62280.33967.060.001
Double threshold84.2770.322913.460.17
Triple threshold82.38210.31566.000.93
Table 10. Threshold effect regression results.
Variable(1)(2)
INNIND
Threshold typeSingle thresholdSingle threshold
Threshold value9.36740.0814
KJ   ( q i t > γ 2 )0.061 **
(0.016)
0.214 ***
(0.001)
KJ   ( q i t γ 2 )0.151 **
(0.014)
0.310 **
(0.019)
Constant term9.313 **
(0.036)
6.969 **
(0.045)
Sample size270.000270.000
Time/region fixed effectYesYes
Control variablesControlledControlled
R20.0470.060
Note: ** and *** indicate p < 0.05 and p < 0.01.
Disclaimer/Publisher’s Note: The statements, opinions and data contained in all publications are solely those of the individual author(s) and contributor(s) and not of MDPI and/or the editor(s). MDPI and/or the editor(s) disclaim responsibility for any injury to people or property resulting from any ideas, methods, instructions or products referred to in the content.

