Article

Surface Moisture Control for Sustainable Manure Management: Reducing Ammonia Emissions and Preserving Nutrients

by
Ieva Knoknerienė
*,
Rolandas Bleizgys
and
Vilma Naujokienė
Department of Mechanical, Energy and Biotechnology Engineering, Engineering Faculty, Vytautas Magnus University Agriculture Academy, Studentu Str. 15, Akademija, LT-53362 Kaunas District, Lithuania
*
Author to whom correspondence should be addressed.
Sustainability 2025, 17(14), 6617; https://doi.org/10.3390/su17146617
Submission received: 14 May 2025 / Revised: 13 June 2025 / Accepted: 15 July 2025 / Published: 20 July 2025

Abstract

Researchers increasingly agree that livestock farming is the leading cause of air pollution with ammonia (NH3) gas. The existing research suggests that 30–80% of nitrogen is lost from slurry and liquid manure in the gaseous form of ammonia. Most studies have focused on environmental factors influencing ammonia volatilization and manure composition but not on controlling the moisture level on the surface of the excreta. Applying the principles of convective mass exchange, this study was undertaken to compare different types of organic covers that mitigate NH3 emissions and offer recommendations on how to properly apply organic covers on the surface of manure. Data was obtained from research in laboratory conditions comparing well-known coatings (chopped straw) with less commonly used organic materials (peat) or waste generated in other industries (sawdust, hemp chaff). This research demonstrated that applying bio-coatings can reduce ammonia (NH3) emissions at coating thicknesses of ≥5 cm for sawdust, ≥3 cm for peat, ≥10 cm for hemp chaff, and 8–12 cm for straw. These reductions are linked to the ability of the coatings to lower manure surface moisture evaporation, a key driver of ammonia volatilization, highlighting the role of surface moisture control in emission mitigation.

1. Introduction

Ammonia (NH3) is a primary gas that acidifies precipitation and harms the environment and ecosystems. These gases pollute the atmosphere and negatively affect the health of animals kept in barns and the people working there. To reduce the impact of livestock farming on climate change [1,2,3], it is necessary to minimize nitrogen (N) losses from cattle manure, which primarily occur due to evaporated ammonia.
NH3 volatilization occurs at all stages of manure formation, storage, and spreading. Thus, 78% of the total amount of ammonia is formed due to various activities in animal husbandry [4]. Cattle are a consequential source of gaseous NH3 and have the highest emission factor compared to other livestock [5,6]. Therefore, ammonia emission processes in livestock farming attract more awareness than other gases [7,8,9,10]. However, as the level of modernization of livestock farms increases, so do the opportunities to implement NH3 emission reduction measures.
To acquire reliable data, describing the processes affecting NH3 emission intensity with scrupulous attention to detail is necessary. Due to numerous factors influencing emission rates, it is complicated to fulfill this condition in production facilities [11,12,13]. Ammonia emissions from dairy cattle manure vary significantly due to changes in air velocity, turbulence, and air temperature fluctuations [14,15]. Among all the determinants, the natural crust also alters the intensity of NH3 volatilization. Its formation is greatly influenced by the amount of dry matter (DM) and straw in the manure and environmental climatic conditions, influencing the thermodynamic processes on the surface of manure [16,17].
Cattle manure can be solid, semi-liquid, or liquid, depending on the animal husbandry technology used on the farm [18,19]. The dry matter in semi-liquid manure varies between 12 and 20%, and liquid manure, or slurry, has less than 12% of DM. Solid manure contains at least 20% dry matter. The differences in DM content are mainly caused by the different amounts of bedding (straw, sawdust, etc.) used in cattle barns. The quantity of floor covering materials also determines manure density, which is approximately 1000 kg m−3 for liquid manure, 960–1120 kg m−3 for fresh solid manure, and 640–750 kg m−3 for 2–6-month-aged solid manure. Even though manure consistency, density, and the amount of nutrients found in manure depend on many factors, such as farm animal species, age, or feed ratio, bedding is one of the most critical components of manure [19,20].
Nitrogen’s transition to ammonia nitrogen (NH3–N) is prolonged due to the strong bonds N develops in manure and slurry. Under aerobic conditions, urine bacteria slowly break down protein in cattle droppings. However, multiple highly variable and interrelated factors affect this process. Consequently, the ammonia diffusion process is vastly intricate and arduous to analyze. It is complicated to assess the impact of separate factors on ammonia evaporation comprehensively. Therefore, researchers distinguish the most prominent factors and determine their effect on nitrogen transformation. A significant number of scientists [21,22,23,24,25,26,27] agree on which factors are dominant in influencing NH3 volatilization. Although experts agree on the significant factors influencing ammonia emission, the views on the effect of each contributor frequently contradict each other.
According to Hempel and Saha [28], as the air temperature elevates, NH3 emission intensifies exponentially. Some scientists [29] determine air temperature as the foremost factor affecting ammonia volatilization. However, a strong correlation between air temperature and NH3 emission can be determined only if the air temperature ranges between 5 and 14 °C. When the temperature exceeds 14 °C, an intense process of natural crust formation begins on the surface of the manure. Therefore, the intensification of ammonia volatilization abates [30]. As a crust gradually forms on the manure surface, surface moisture dynamics change. However, natural crust development can take up to 60 days. Therefore, rapid and effective strategies are needed to regulate moisture levels on the surface of the manure to suppress aerobic processes and mitigate environmental pollution. This study aims to evaluate the effectiveness of biocoatings in rapidly regulating manure surface moisture levels.

2. Materials and Methods
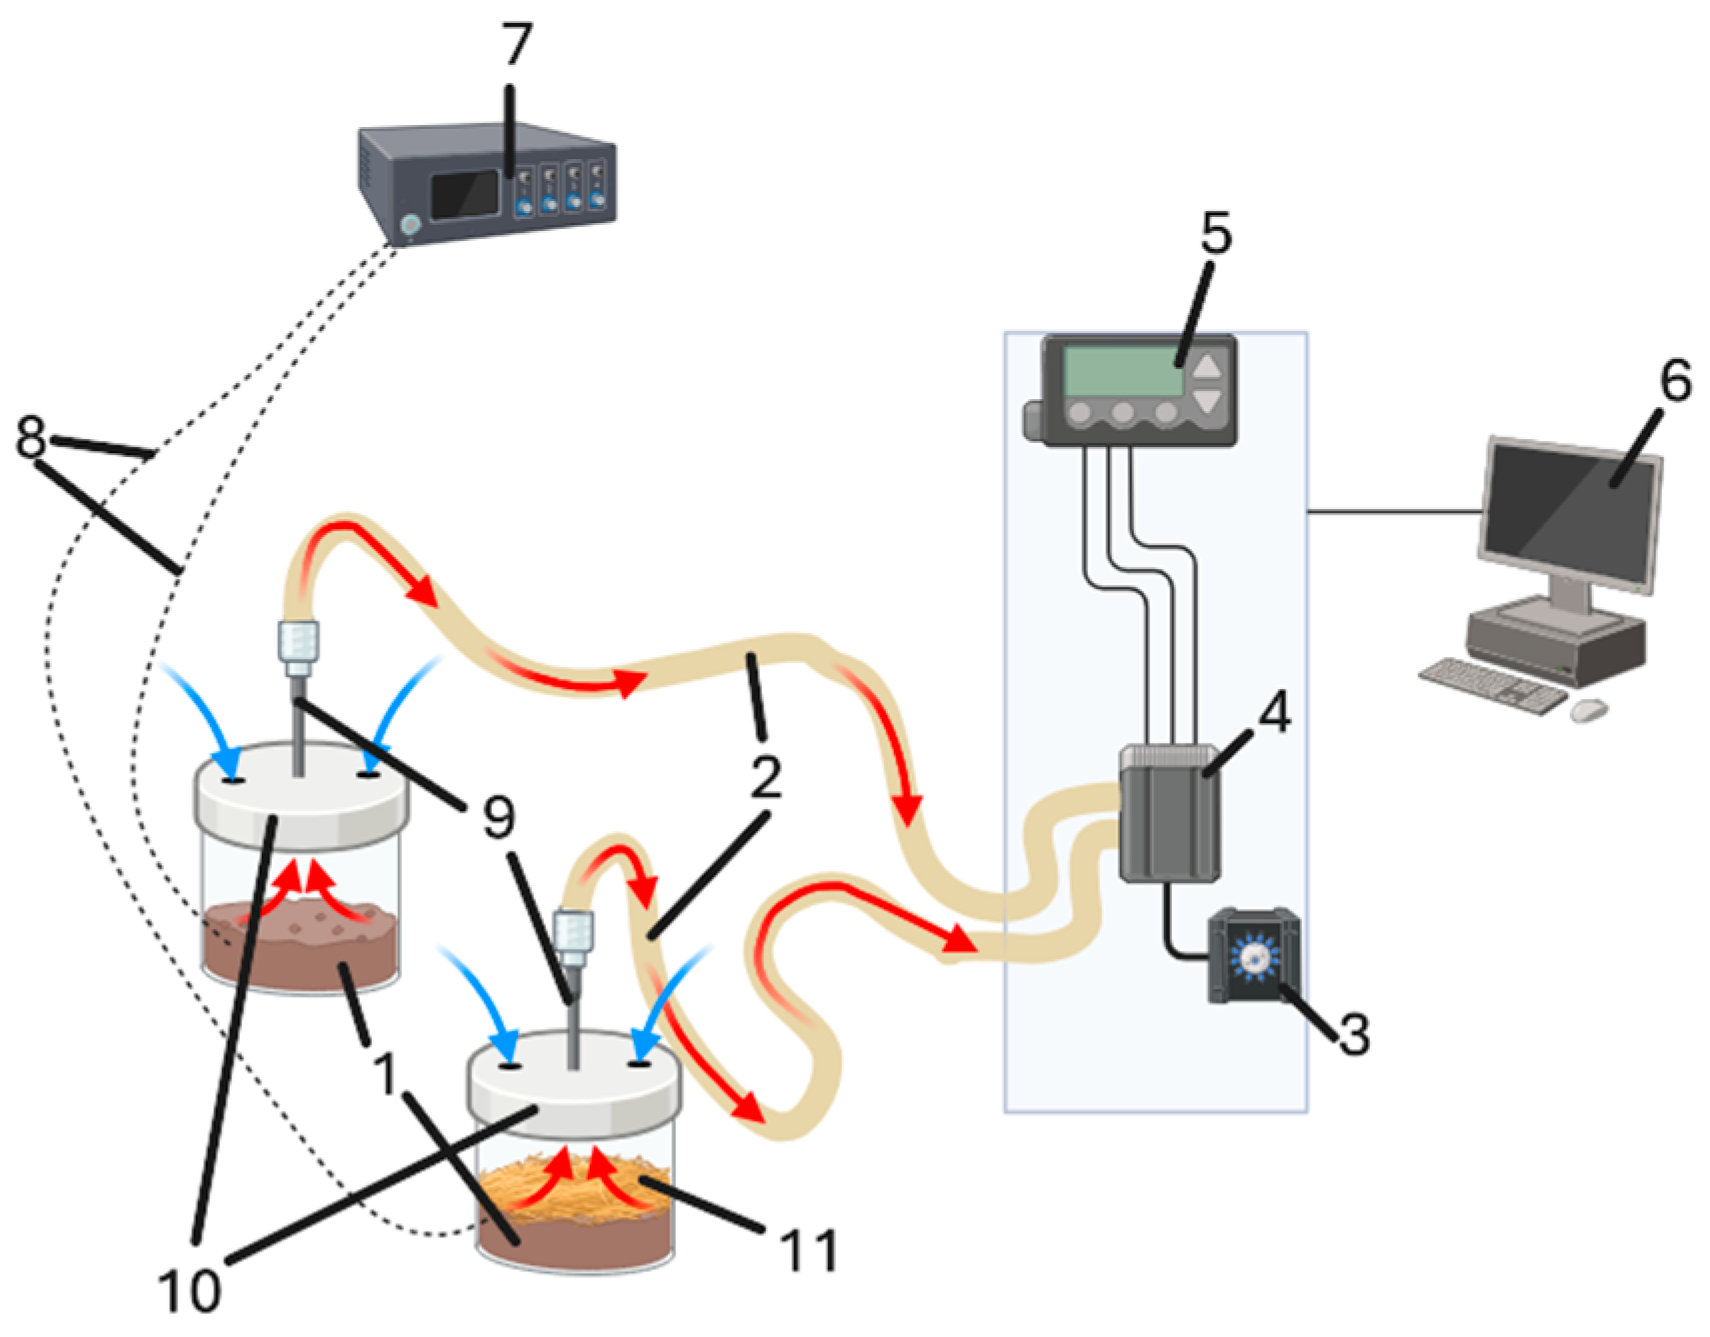
2.1. Methods

The intensity of ammonia gas emissions ( E N H 3 , mg m−2 h−1) into the atmosphere was determined through the mass flow method using the equation written below:
E NH 3 = C 0     C e G
where Ce—NH3 concentration in the air entering the manure chamber (Figure 1), mg m−3; C0—NH3 concentration in the air exiting the chamber, mg m−3; and G—manure chamber ventilation intensity, m3 h−1.
The DM content in manure was calculated according to the requirements of standard LST 1530:2004. Approximately 200 g of fresh manure was added to the drying container, forming an 8 cm thick layer of the manure sample. Prepared samples were dried at 105 °C using a Memmert Model 100–800 drying oven. The process was carried out until the mass of manure became constant, and then each sample was weighed. Afterwards, the dry matter content in manure was calculated based on the weighing data. At least eight repetitions were performed to acquire data on DM content in each manure sample.

2.2. Cattle Housing System and Diet

Fresh semi-liquid cattle manure was collected at the VMU-AA Training farm. About 160 Holstein dairy cows are kept on this farm. All year-round cows are divided into two groups, dry cows (consisting of ~40 cows) and lactating cows, which include early-, mid-, and late-lactation-stage cows.
All cattle were fed with a fodder mixture of straw, corn silage, grass silage, hay, and water. The feed was enriched with all essential mineral compounds, additional nutrients, and other trace elements. Lactating cows’ rations included more crushed wheat, barley, oats, rapeseed oilcake, and soy groats.
The cattle shed was designed depending on loose housing system parameters. Cow beds were made by fusing the cubicle and straw yard systems (two major bed systems used in loose housing technology). Cubicles and straw yards were cleaned and bedded with fresh chopped straw daily. During the summertime, up to 5 bales of straw (weighing around 200 kg each) were used for bedding. In winter, the number of straw bales used for cow beds increased to 8.

2.3. Analysis of Manure Characteristics

Experimental research was carried out in the Vytautas Magnus University Agriculture Academy (VMU-AA) laboratory of Thermoenergetic Processes and Emissions to determine the influence of bio-coatings (e.g., straw, hay, peat, hemp chaff) on NH3 evaporation during the 2023–2024 period.
The research bench shown in Figure 1 was used to measure the NH3 emission fluctuation induced by various bio-covers continuously.
The measuring of NH3 concentration was performed with analyzer GME700 (SICK MAIHAK GmbH, Reute, Germany) (range: 0–2000 ppm; accuracy: 2–4%). This device works based on the laser spectroscopy principle and takes measurements in automatic continuous or cyclic mode, simultaneously accumulating data in the integrated memory storage. The analyzer has heated air supply hoses (2) and a three-channel valve (4). Due to this, the analyzer’s cell is protected from condensation and contamination, and the measuring device can take accurate measurements in less than 360 s. With an airflow of 6 L min−1 and NH3 concentration no higher than 30 ppm, measured values stabilize within 60–80 s, and the analyzer can determine accurate data of NH3 concentration in the air.
Air temperature and humidity were measured by sensors connected to a measuring device, “Almemo 2590-9” (Ahlborn GmbH, Ilmenau, Germany) (7). The temperature measuring range −30–60 °C, relative air humidity measuring 5–98%. Device accuracy—±0.1%. Airflow intensity was also measured with “Almemo 2590-9” connected to an anemometer integrated into the air supply system next to sampling probes (9). Air movement was measured by the air speed in the duct and then converted into the airflow intensity in m s−1. Measuring range: 0–10 m s−1; accuracy—±0.1 m s−1.
Manure temperature was measured with thermocouples (8) made of Cu-CuNi, which had a diameter of 0.5 mm. The measuring range was −25–200 °C, and the precision was 0.1 °C. The sensors were connected to a data collector, “Almemo 2590-9.”
The pH meter HI98130 determined the value of the manure’s hydrogen ions (pH). This is an electronic device with a measuring range from 0 to 14 pH and an accuracy of 0.05 of the measured value.
Fresh semi-liquid dairy cattle manure was gathered during the grazing season, when 5 bales of straw were used for bedding every day.
Semi-liquid manure (1), used for this research, was homogenized and mixed in a large container, then divided into two manure chambers (10) (H = 37 cm; Ø = 32 cm; V = 30 L). Manure in chamber I was not treated in any way. Manure in chamber II was covered with bio-covers (11) (straw, peat, hemp chaff, sawdust). When ammonia emissions became steady, the layer of the covering material was gradually thickened. Both chambers contained 15 L of manure and had the same environmental conditions, such as air temperature and airflow right above the surface of the manure.
Manure chambers had a fresh air supply (). Contaminated air () was taken via probes (9) and supplied to the gas analyzer GME700 (5) through heated air supply hoses (2). Air was continuously supplied to the analyzer by a pump (3) at an airflow rate of 6 L min−1. The reduced pressure inside the chamber created a pressure difference between the internal and external environments, and vacuum suction occurred. This led to a continuous flow of fresh air into the chamber at the same rate as the contaminated air was removed from the chamber and supplied to the analyzer.
To investigate the effect of precipitation on the performance of bio-covers in mitigating ammonia emissions, a precipitation simulation was conducted during the experimental period. Rainfall was simulated using a sprayer capable of delivering water uniformly onto the bio-cover surface. The amount of the simulated precipitation was selected to reflect average local rainfall patterns typical for the study region. During each simulation event, 300 mL of water was applied, corresponding to a rainfall intensity of approximately 4.3 mm (calculated based on the surface area over which the water was distributed). This approach allowed for the assessment of moisture infiltration and its impact on the ammonia emission rates from covered manure. Water application was carefully controlled to avoid excessive saturation, ensuring realistic conditions while maintaining the integrity of the bio-cover layer.
The data gathered from the analyzer was recalculated into NH3 emission intensity per square meter or manure surface area (mg m−2 h−1) and ventilation intensity per square meter of manure surface area (m3 m−2 h−1).

2.4. Statistical Analysis

Data gathered during the research was evaluated by calculating the arithmetic averages of the indicators and their confidence intervals. Statistical reliability was assessed by determining the least significant difference at the 95% significance level (p < 0.05) using ANOVA two-way analysis and Tukey HSD test. The results were presented using descriptive statistics.

3. Results and Discussion

3.1. The Intensity of NH3 Emissions When Bio-Coatings Are Used

Chopped straw, hemp chaff, fine wood sawdust, peat, oil, zeolite, and more organic coatings can reduce ammonia emissions from manure. The data gathered during the research confirmed that ammonia emissions can be reduced by controlling moisture levels on the surface of the manure. When no coatings are used to cover manure, due to the convective mass exchange process, the surface of the manure loses moisture content and dries out, and the process of natural crust formation begins. In addition, when moisture is lost from the surface of the manure, urine bacteria can no longer proceed with breaking down proteins. However, it takes up to 2 weeks for this phenomenon to begin naturally and 40 to 60 days for the natural crust to stabilize and become hard [31,32]. Therefore, bio-coatings such as chopped straw, peat, hemp chaff, and sawdust used for the experiment significantly reduce moisture levels and control NH3 emission intensity as soon as they are applied on the surface of the manure.
The most intensive NH3 gases were released from fresh dairy cattle manure at an average rate of 730 ± 67 mg m−2 h−1. At a constant ambient and manure temperature of 19–20 °C and ventilation above the surface of the manure intensity of 0.36 m3 h−1, volatilization severity lessened by 26.5% to an average level of 525 ± 24 mg m−2 h−1 during the first 5 days. The cause of this was naturally occurring crust. A similar trend was described by Zhuang and Shan [33]. The researchers experimented with cattle manure in traditional Chinese farms and determined that the evaporation intensity was the highest during the first 8 days. Other scientists [34,35] state that ammonia evaporation from fresh cattle manure is the most intense throughout the first 10–14 days. In up to 14 days, when the NH3 volatilization is the highest, a greater quantity of all the ammonia produced through the manure storage period is released into the environment. Hence, manure must be covered. According to research data and various scientists, by using appropriate manure covers and covering techniques, NH3 emissions can be reduced by 40–85%. However, improperly selected or applied NH3 emission reduction measures can have the opposite effect.
Emmerling and Krein [36] found that it is essential to evaluate the properties of the bio-coating of the manure, such as porosity and absorbency. According to the author, non-porous and hardly air-permeable coatings can reduce ammonia emissions into the atmosphere by up to 68%.
Chopped straw is the most commonly used bedding material in animal farms. This coating is relatively inexpensive and easily available to farmers. It can also be used as a manure bio-coating. Even a thin layer of chopped straw significantly reduced the evaporation of NH3 into the environment (Figure 2a). When the manure was covered by a 5 cm thick layer of chopped straw, the intensity of NH3 volatilization decreased from 707 ± 19 mg m−2 h−1 to 135 ± 12 mg m−2 h−1 (by 80%). However, subsequent diffusion of slurry from the inner layers of manure to the surface occurred and dampened the straw. Within a few hours, the straw became wet, and ammonia emission increased again to 479 ± 24 mg m−2 h−1. When the thickness of the straw cover was increased to 12 cm, an instant NH3 emission intensity reduction to 48 ± 7 mg m−2 h−1 could be seen. As time passed, ammonia evaporation in chamber II stabilized again and reached 210 ± 4 mg m−2 h−1. A thicker layer of straw reduced NH3 emissions more efficiently.
The impact of fine sawdust on ammonia emissions from manure was very high (Figure 2b). Even a 1 cm thick layer of sawdust decreased ammonia evaporation up to 73% (from 704 ± 16 mg m−2 h−1 to 194 ± 11 mg m−2 h−1). This was due to the low porosity of the sawdust layer. However, the slurry diffused through the covering material and reached the surface (open air) in 5 h. This led to an NH3 emission intensity increase of up to 558 ± 7 mg m−2 h−1. After 11 h, ammonia volatilization increased to 640 ± 18 mg m−2 h−1 and continued to vary slightly.
When the sawdust coating was thickened to 5 cm, NH3 emissions changed from 665 ± 29 mg m−2 h−1 to 20 ± 4 mg m−2 h−1. The efficiency of a 5 cm thick fine sawdust cover reached up to 97%. However, once again, the surface of the bio-coating dampened in 24 h, and ammonia evaporated to the atmosphere at a rate of 175 ± 11 mg m−2 h−1. A 10 cm layer of sawdust reduced NH3 volatilization to 5–8 mg m−2 h−1 in 40 h, then rose to 31 ± 6 mg m−2 h−1.
Ammonia volatilization can be minimized by lowering pH levels [37]. Covering manure with acidic (pH 3.8) peat is very effective. As Schmidhalter [38], Ellersiek and Olfs [39], and other scientists declare, acidifying manure to a pH level of 5.0 or 6.0 can reduce ammonia volatilization by 58–83%. During this research, NH3 emissions were reduced up to 88% (Figure 2c) by using only a 0.5 cm thick peat layer. Slurry diffused through peat slower than through the layer of sawdust. Therefore, ammonia emission remained low for 10–13 h before it shot up to 450–530 mg m−2 h−1. When the peat layer was thickened up to 3 cm, NH3 was lowered significantly to 3–6 mg m−2 h−1. It also took about 60 h for the ammonia emission to slightly increase.
Hemp chaff is a byproduct of hemp processing. This material is rich in carbon and has properties that can help reduce NH3 emissions. Research on the hemp chaff as a manure bio-cover is still emerging. However, existing research on other organic materials suggests that it could be effective in reducing ammonia volatilization.
Hemp chaff efficiently reduced ammonia emission from manure but required a thicker material layer. Only a 6 cm or thicker layer of hemp chaff minimized the intensity of the NH3 evaporation (Figure 2d). When manure was covered with a 2 cm layer of hemp chaff, ammonia emission decreased by up to 96% (from 446 ± 18 mg m−2 h−1 to 27 ± 11 mg m−2 h−1). But the effect only lasted around two hours. Afterwards, NH3 volatilization intensified and, in 20 h, reached an intensity greater than 400 ± 13 mg m−2 h−1.

3.2. The Efficacy of Various Bio-Coatings

The straw forms a porous layer through which ambient air enters the surface of the manure. Due to the large concentration gradient of ammonia in the air and on the surface of the manure, NH3 intensively evaporates into the environment. Zhu et al. [40] conducted a similar study. They covered slurry with sawdust and straw. During their experimental study, 1, 2, 3, and 5 cm thick sawdust layers and a 6 cm thick straw layer were used. A 6 cm thick layer of straw reduced emissions by 90%.
The highest average efficiency of a 5 cm thick chopped straw layer was 82 ± 3.9% (Figure 3a). However, the effectiveness of this coating decreased to an average of 54 ± 5.3% in 10 h and to 46 ± 3.9% in 20 h. With a small layer of straw (5 cm), the slurry diffused to the surface more quickly, and the ammonia emissions were significantly reduced only for a short time. When the straw layer was increased to a thickness of more than 8 cm, the slurry reached the surface of the bio-coating at a significantly slower rate, and the reduction in NH3 emissions remained for a longer time (up to 85% within 20 h). Covering the manure with a layer of straw at least 8 cm thick is recommended. With such a layer of straw, the intensity of ammonia emissions was lowered by more than 60% for at least 20 h. A 61% long-term effectiveness of straw covering was also determined by Turbí and Garrido [41] in their recent research.
Even a thin layer (1 cm) of sawdust reduced the intensity of NH3 volatilization by 64 ± 6.1% (Figure 3b). Yet the effect lasted only for an hour. Within 20 h, the efficiency of the coating declined to only 19 ± 5.3% (Figure 3b). Matulaitis et al. [42], in their research, used a 4 cm thick sawdust layer to cover fresh manure. It was determined that the coating reduced the intensity of NH3 emission by 73.4%. To achieve better efficiency and extend the duration of the effect of lowering ammonia emissions from manure, the sawdust cover’s thickness must be at least 5 cm. ≥6 cm or thicker layers of fine sawdust reduced NH3 emissions into the environment by at least 90%. The effect of this lasts for at least 20 h.
Peat had better liquid absorption properties than most materials used during this research. After peat application, the diffusion process was significantly slower. Additionally, due to acidic amendments, ammonia (NH3) was transformed into ammonium (NH4+), which is less volatile and remains in manure [43]. Thus, even 0.5 mm of peat reduced NH3 emissions to 88 ± 5.3% in the first hour (Figure 3c). As with other coatings, the effectiveness of the peat layer decreased over time. However, even after 20 h, a 0.5 mm thick layer reduced ammonia emissions up to 68 ± 3.1%. By increasing the thickness of the peat layer on the manure to ≥3 cm, the ammonia emissions decreased by more than 93%. This research data complies with the results Kupper et al. [44] gathered during their research.
The effect of hemp chaff on the intensity of ammonia emissions was like that of straw. A thin layer (2 cm) reduced NH3 emission effectively but briefly (Figure 3d). When layer thickness was increased to 6 cm, emission reduction lasted longer. However, a layer of more than 10 cm of hemp chaff is recommended since the intensity of ammonia evaporation to the atmosphere can be reduced by 91% for up to 20 h.
Ammonia emissions can be significantly reduced by altering the physical and chemical properties of the manure surface. Organic covers, such as straw, peat, and others, are capable of absorbing moisture and limiting the exposure of manure to the air, thereby reducing the volatilization of NH3 [23,45]. However, the timing, method of application, and thickness of the organic cover are critical (Figure 4).
The covering layer needs to be compacted to increase the effectiveness of highly porous bio-coatings, such as chopped straw or hemp chaff. When bio-coating material cannot form a dense layer, it is necessary to use more material to build a thicker cover. The thicker the manure coating, the better results can be achieved. However, a thicker layer results in more expenses [46]; therefore, the optimal thickness of every cover material must be determined. For example, when coating consists of chopped straw, it is recommended to use a layer thicker than 5 cm. An 8 cm thick layer reduced NH3 emissions by 74.45 ± 2.31% and had 30.76% higher efficiency than a 5 cm thick coating. When the thickness was increased to 12 cm, efficiency also increased by an additional 4.90%. However, this increase is not statistically significant, at 95% probability (p ≤ 0.05). Based on this, the recommended thickness of the straw cover is 6–12 cm. The same methodology was used to determine the optimal thickness of other coatings (peat, 3–5 cm; hemp chaff, 10–13 cm; fine sawdust, 10–13 cm).

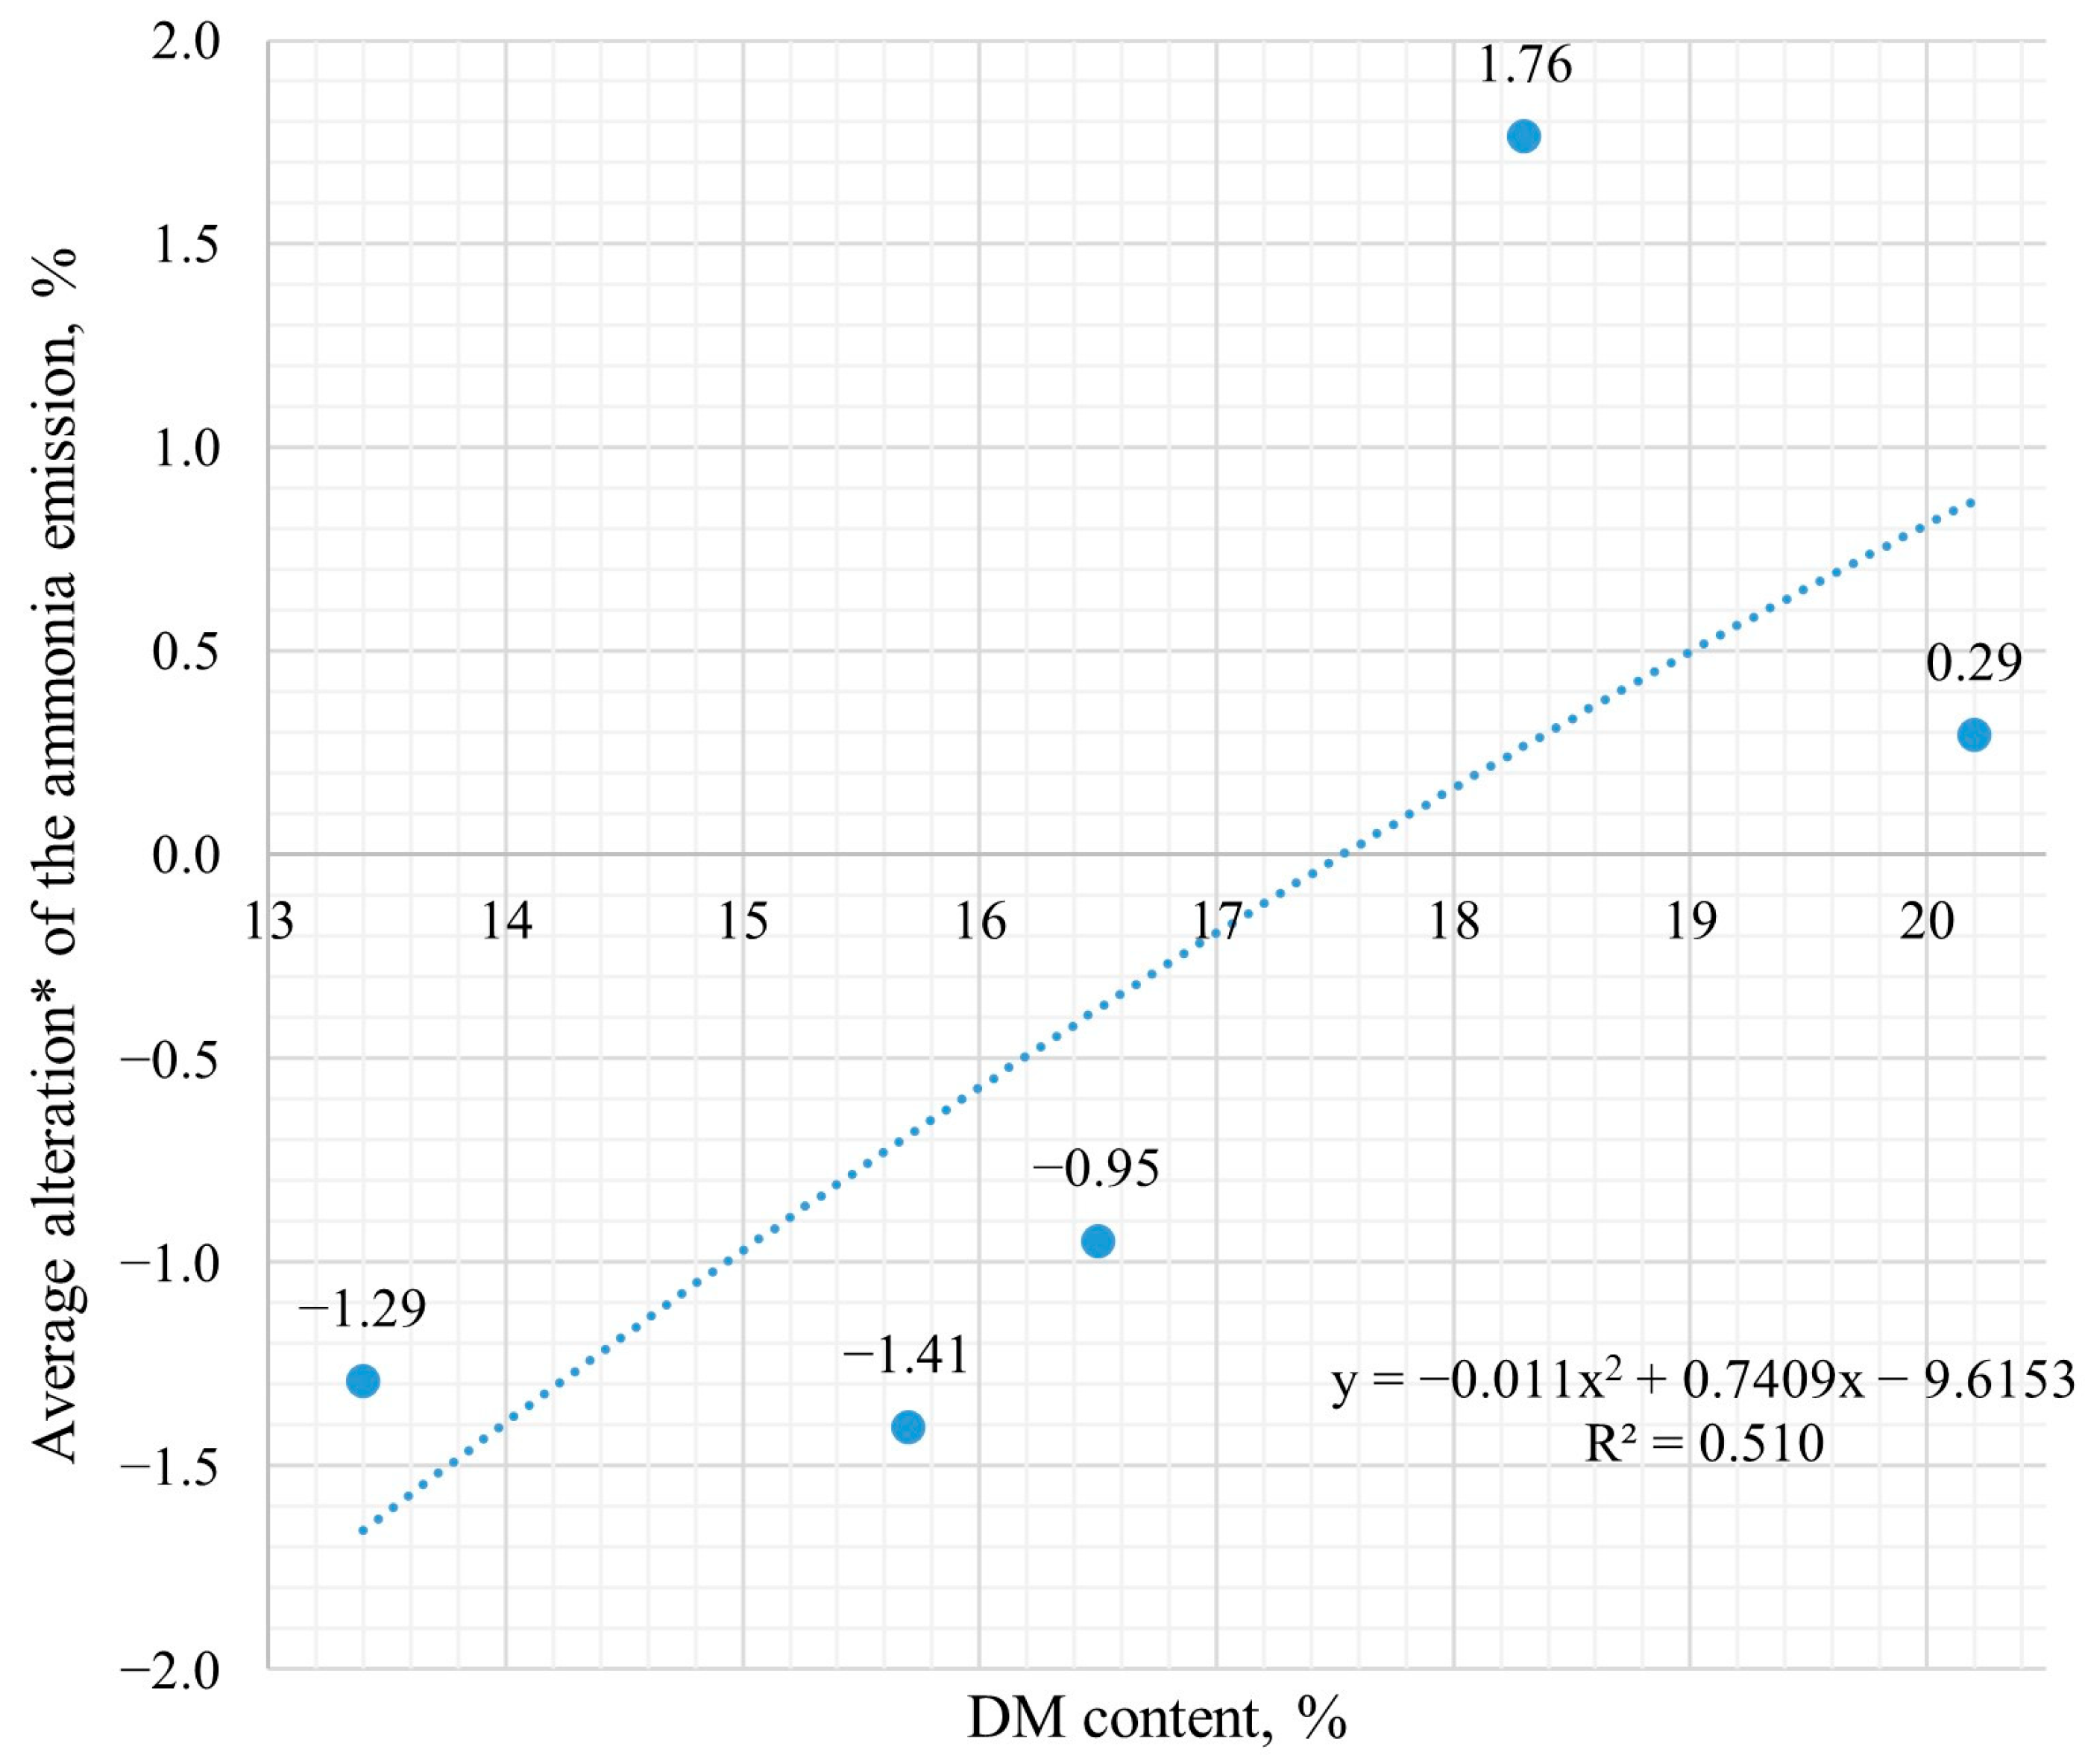
3.3. Impact of Precipitation and DM Content

Simulating 4.3 mm rainfall on the surface of manure samples displayed a positive effect in both chambers. Upon surface contact, clean water migrated into the inner layers of the manure, simultaneously carrying nitrogen compounds deeper into the manure. Ammonia emissions decreased by 89–92% when a cover of chopped wheat straw was used.
The imitation of rain and the spraying of 4.3 mm of water on the sawdust coating gave similar results to those of straw (Figure 5a). Right after water application, ammonia evaporation dropped by 63–85%. In the chamber without manure cover, the intensity of NH3 emissions returned to levels close to the previous one in 3.5 h. When manure was covered with sawdust, ammonia evaporation took about 12 h to return to nearly the previous level.
When hemp chaff was sprayed with water, NH3 volatilization decreased by 72–80% right after the application. However, in 5 h, the intensity of volatilization increased more than twice. Ammonia emissions from uncovered manure increased from 108 ± 12 mg m−2 h−1 to 260 ± 22 mg m−2 h−1 and from covered manure from 13 ± 7 mg m−2 h−1 to 28 ± 14 mg m−2 h−1.
The impact of precipitation with peat cover was not evaluated due to extremely low ammonia emission values. Using a 5 cm layer of peat reduced ammonia emissions to 98–99%, so it was impossible to reliably assess the influence of precipitation on ammonia emission from manure covered with peat.
Rainfall (clean water) falling on the surface of the manure influenced the intensity of ammonia evaporation. Imitating 4.3 mm of precipitation significantly reduced NH3 volatilization from manure regardless of the type of bio-coating used (Figure 5b). However, it had a short-term effect. As water diffused into the inner layers of manure and slurry diffused to the surface of the manure, the humidity and the amount of ammonia nitrogen on the surface of the manure increased, and, therefore, ammonia emissions intensified.
Precipitation falling on the surface of the manure can significantly reduce the intensity of NH3 evaporation (up to 44.9 ± 14.1%). Judging by this single criterion, manure could be left uncovered and sprayed with water. However, bio-coatings can significantly increase the effect of water on ammonia emissions. When clean water was applied, the intensity of NH3 evaporation from manure with bio-coatings lowered to 85.6 ± 5.2%. Unfortunately, it was a short-term impact. In 50 h, the emission reduction from covered manure decreased to 25.1 ± 9.1%. However, the efficiency of reducing NH3 evaporation from uncovered manure decreased to 27.4 ± 11.9%—2.5 times faster—only in 20 h. Therefore bio-coatings helped lengthen the positive effect of water in reducing ammonia evaporation from manure.
Conversely, when NH3 emission reduction measures are applied improperly, ammonia evaporation can increase (Figure 6).
When manure is liquid or semi-liquid, rainfall helps reduce ammonia emissions by diluting the existent slurry and lowering the concentration of nitrogen compounds in manure [36,47,48]. Thus, in the long term, the intensity of NH3 emissions decreases. When cattle manure has more than 18% DM, precipitation has the opposite effect (Figure 7). When precipitation was imitated, it took about 20 h for the ammonia emission to stabilize. After 20 h, periodic measurements showed that ammonia emissions decreased when DM content was below 18.3%. However, when more than 18.3% of DM was in the manure 20 h after the precipitation, ammonia emissions rose again.
The primary source of NH3 gases is a liquid fraction of cattle manure. Solid manure has little to no liquid fraction in its natural state. When water was added, a liquid fraction contaminated with nitrogen compounds was created, and NH3 emissions increased compared to the emission levels before precipitation.
The data implies that it is important to evaluate the properties of manure when applying methods and strategies to reduce ammonia emissions. However, further research is needed to demonstrate the correlation of dry matter content with the effectiveness of precipitation in reducing the intensity of ammonia emissions to the environment.

4. Conclusions and Further Research

Effective control of surface moisture on manure is critical for mitigating ammonia (NH3) emissions and enhancing nitrogen (N) retention. NH3 volatilization accounts for up to 40–60% of total ammoniacal nitrogen (TAN) loss from untreated manure surfaces, representing both an environmental burden and a reduction in the agronomic value of manure as fertilizer. Maintaining optimal surface moisture levels and applying bio-covers can substantially reduce these emissions and improve nitrogen use efficiency, contributing to more sustainable livestock farming systems.
In this study, biodegradable bio-coatings primarily composed of agricultural and forestry residues, commonly considered waste materials (straw, sawdust, hemp chaff), were tested as sustainable alternatives for manure covering. These materials not only reduce waste but also enhance resource circularity. The application of these covers reduced NH3 emissions by over 60% for periods longer than 20 h (p ≤ 0.05), with optimal effectiveness achieved using 5–12 cm of straw, 10–13 cm of fine sawdust or hemp chaff, and 3–5 cm of acidic peat (pH 3.8).
The efficacy of these coatings was influenced by their thickness, porosity, density, and liquid absorption capacity. Fine-particle coatings formed dense barriers that initially suppressed emissions but could lose effectiveness due to slurry diffusion. Coarse-particle materials formed porous layers that allowed for gas exchange via concentration gradients. To minimize NH3 emissions and maximize nitrogen retention, coatings must prevent surface moisture loss and create non-porous, diffusion-resistant barriers.
Moreover, natural crust formation, while beneficial, takes 40–60 days to stabilize and is highly variable, making bio-covers a more immediate and reliable mitigation strategy. Precipitation also showed a complex effect, temporarily diluting surface nitrogen but occasionally enhancing volatilization upon re-wetting. A moderate correlation (R2 = 0.65) was found between dry matter content and NH3 emission reduction.
Overall, the use of waste-derived organic materials as bio-covers represents a cost-effective, environmentally beneficial solution to reduce nitrogen loss, lower environmental pollution, and promote sustainable nutrient recycling in agriculture.

Author Contributions

Conceptualization, I.K., R.B., and V.N.; methodology, R.B.; validation, R.B. and V.N.; formal analysis, I.K., R.B., and V.N.; investigation, I.K. and V.N.; resources, R.B. and V.N.; data curation, R.B.; writing—original draft preparation, I.K.; writing—review and editing, R.B. and V.N.; visualization, I.K. and V.N.; supervision, R.B. and V.N. All authors have read and agreed to the published version of the manuscript.

Funding

This research received no external funding.

Institutional Review Board Statement

Not applicable.

Informed Consent Statement

Not applicable.

Data Availability Statement

All data are available from the authors upon reasonable request.

Conflicts of Interest

The authors declare no conflicts of interest.

Abbreviations

The following abbreviations are used in this manuscript:
DMDry matter
NH3Ammonia
NH4+Ammonium
NH3-NAmmonia nitrogen
NNitrogen
TANTotal ammoniacal nitrogen
VMU-AAVytautas Magnus University Agriculture Academy

References

  1. Cao, X.; Reichel, R.; Brüggemann, N. Potential of High Organic Carbon Soil Amendments to Mitigate Greenhouse Gas and Ammonia Emissions from Pig and Cattle Slurry Treated Soils. Geophys. Res. Abstr. 2019, 21, 1. [Google Scholar]
  2. Horrillo, A.; Gaspar, P.; Escribano, M. Organic Farming as a Strategy to Reduce Carbon Footprint in Dehesa Agroecosystems: A Case Study Comparing Different Livestock Products. Animals 2020, 10, 162. [Google Scholar] [CrossRef] [PubMed]
  3. Yang, Y.; Kumar, A.M.; Du, W.; Ren, X.; Lei, T.; Lv, J. Compost Supplementation with Nitrogen Loss and Greenhouse Gas Emissions during Pig Manure Composting. Bioresour. Technol. 2020, 297, 122435. [Google Scholar] [CrossRef] [PubMed]
  4. Murawska, A.; Prus, P. The Progress of Sustainable Management of Ammonia Emissions from Agriculture in European Union States Including Poland—Variation, Trends, and Economic Conditions. Sustainability 2021, 13, 1035. [Google Scholar] [CrossRef]
  5. European Environment Agency. Sources and Emissions of Air Pollutants in Europe. In Web Report; European Environment Agency: Copenhagen, Denmark, 2022. [Google Scholar]
  6. Ding, L.; Li, Q.; Wang, C.; Zhang, G.; Jiang, R.; Yu, L.; Zheng, W.; Gao, R.; Ma, W.; Zhang, S.; et al. Determination of the Mass Transfer Coefficient of Ammonia Emissions from Dairy Open Lots using a Scale Model. Biosyst. Eng. 2020, 190, 145–156. [Google Scholar] [CrossRef]
  7. Ni, J.; Erasmus, M.A.; Croney, C.C.; Li, C.; Li, Y. A Critical Review of Advancement in Scientific Research on Food Animal Welfare-Related Air Pollution. J. Hazard. Mater. 2021, 408, 124468. [Google Scholar] [CrossRef] [PubMed]
  8. Huang, D.; Guo, H. Diurnal and Seasonal Variations of Odor and Gas Emissions from a Naturally Ventilated Free-Stall Dairy Barn on the Canadian Prairies. J. Air Waste Manag. Assoc. 2017, 67, 1092–1105. [Google Scholar] [CrossRef] [PubMed]
  9. Yi, Q.; Zhang, G.; König, M.; Janke, D.; Hempel, S.; Amon, T. Investigation of Discharge Coefficient for Wind-Driven Naturally Ventilated Dairy Barns. Energy Build. 2018, 165, 132–140. [Google Scholar] [CrossRef]
  10. Morsing, S.; Strøm, J.S.; Zhang, G.; Kai, P. Scale Model Experiments to Determine the Effects of Internal Airflow and Floor Design on Gaseous Emissions from Animal Houses. Biosyst. Eng. 2008, 99, 99–104. [Google Scholar] [CrossRef]
  11. Zhang, G.; Bjerg, B.; Strøm, J.S.; Morsing, S.; Kai, P.; Tong, G.; Ravn, P. Emission Effects of Three Different Ventilation Control strategies—A Scale Model Study. Biosyst. Eng. 2008, 100, 96–104. [Google Scholar] [CrossRef]
  12. Wu, W.; Zhang, G.; Kai, P. Ammonia and Methane Emissions from Two Naturally Ventilated Dairy Cattle Buildings and the Influence of Climatic Factors on Ammonia Emissions. Atmos. Environ. (1994) 2012, 61, 232–243. [Google Scholar] [CrossRef]
  13. Ngwabie, N.M.; Jeppsson, K.-H.; Gustafsson, G.; Nimmermark, S. Effects of Animal Activity and Air Temperature on Methane and Ammonia Emissions from a Naturally Ventilated Building for Dairy Cows. Atmos. Environ. (1994) 2011, 45, 6760–6768. [Google Scholar] [CrossRef]
  14. Pereira, J.; Misselbrook, T.H.; Chadwick, D.R.; Coutinho, J.; Trindade, H. Effects of Temperature and Dairy Cattle Excreta Characteristics on Potential Ammonia and Greenhouse Gas Emissions from Housing: A Laboratory Study. Biosyst. Eng. 2012, 112, 138–150. [Google Scholar] [CrossRef]
  15. Van der Stelt, B.; Temminghoff, E.J.M.; Van Vliet, P.C.J.; Van Riemsdijk, W.H. Volatilization of Ammonia from Manure as Affected by Manure Additives, Temperature and Mixing. Bioresour. Technol. 2007, 98, 3449–3455. [Google Scholar] [CrossRef] [PubMed]
  16. Aguerre, M.J.; Wattiaux, M.A.; Powell, J.M. Emissions of Ammonia, Nitrous Oxide, Methane, and Carbon Dioxide during Storage of Dairy Cow Manure as Affected by Dietary Forage-to-Concentrate Ratio and Crust Formation. J. Dairy Sci. 2012, 95, 7409–7416. [Google Scholar] [CrossRef] [PubMed]
  17. Finzi, A.; Riva, E.; Bicoku, A.; Guido, V.; Shallari, S.; Provolo, G. Comparison of Techniques for Ammonia Emission Mitigation during Storage of Livestock Manure and Assessment of their Effect in the Management Chain. J. Agric. Eng. 2019, 50, 12–19. [Google Scholar] [CrossRef]
  18. Bleizgys, R.; Čėsna, J. Gyvulininkystės Technologijų Inžinerija: Mokomoji Knyga; Aleksandro Stulginskio Universiteto Leidybos Centras: Akademija, Lithuania, 2012. [Google Scholar]
  19. Kavolėlis, B. Galvijų Fermų Technologinio Projektavimo Taisyklės Ir Patarimai; Kavolėlis, P.B., Ed.; Lietuvos Žemės Ūkio Universiteto Žemės Ūkio Inžinerijos Institutas: Raudondvaris, Lithuania, 2006. [Google Scholar]
  20. Skurdenienė, I.; Bakutis, B.; Ribikauskas, V. Ekologinio Ūkio Privalumai Gyvulininkystėje: [Ūkininkaujantiems Ekologiškai]; Lututė: Kaunas, Lithuania, 2007. [Google Scholar]
  21. Loyon, L.; Guiziou, F. Ammonia Volatilization from Different Pig Slurries Applied on Wheat Stubble using Different Land Spreading Techniques Under French Conditions. Agric. Ecosyst. Environ. 2019, 280, 114–117. [Google Scholar] [CrossRef]
  22. Bleizgys, R.; Bagdoniene, I. Control of Ammonia Air Pollution through the Management of Thermal Processes in Cowsheds. Sci. Total Environ. 2016, 568, 990–997. [Google Scholar] [CrossRef] [PubMed]
  23. Bleizgys, R.; Naujokienė, V. Ammonia Emissions from Cattle Manure Under Variable Moisture Exchange between the Manure and the Environment. Agronomy 2023, 13, 1555. [Google Scholar] [CrossRef]
  24. Bagdonienė, I.; Bleizgys, R. Ammonia Emissions from Dairy Cattle Manure Under Variable Ventilation Rates. Ann. Anim. Sci. 2014, 14, 141–151. [Google Scholar] [CrossRef]
  25. Kavolėlis, B. Amoniako Emisija Karvidėse, 1st ed.; Žemės Ūkio Mokslai; Vytauto Didžiojo Universiteto Žemės ūkio Akademija: Kaunas, Lithuania, 2004; p. 46. [Google Scholar]
  26. Wang, H.; Zhang, X.; Ma, Y.; Hou, Y. Mitigation Potential for Carbon and Nitrogen Emissions in Pig Production Systems: Lessons from the North China Plain. Sci. Total Environ. 2020, 725, 138482. [Google Scholar] [CrossRef] [PubMed]
  27. Nguyen, Q.H.; Le, P.D.; Chim, C.; Le, N.D.; Fievez, V. Potential to Mitigate Ammonia Emission from Slurry by Increasing Dietary Fermentable Fiber through Inclusion of Tropical Byproducts in Practical Diets for Growing Pigs. Asian-Australas. J. Anim. Sci. 2019, 32, 574–584. [Google Scholar] [CrossRef] [PubMed]
  28. Hempel, S.; Saha, C.K.; Fiedler, M.; Berg, W.; Hansen, C.; Amon, B.; Amon, T. Non-Linear Temperature Dependency of Ammonia and Methane Emissions from a Naturally Ventilated Dairy Barn. Biosyst. Eng. 2016, 145, 10–21. [Google Scholar] [CrossRef]
  29. Sanchis, E.; Calvet, S.; Prado, A.D.; Estellés, F. A Meta-Analysis of Environmental Factor Effects on Ammonia Emissions from Dairy Cattle Houses. Biosyst. Eng. 2019, 178, 176–183. [Google Scholar] [CrossRef]
  30. Pedersen, J.; Nyord, T.; Feilberg, A.; Labouriau, R. Analysis of the Effect of Air Temperature on Ammonia Emission from Band Application of Slurry. Environ. Pollut. 2021, 282, 117055. [Google Scholar] [CrossRef] [PubMed]
  31. VanderZaag, A.C.; Gordon, R.J.; Glass, V.M.; Jamieson, R.C. Floating Covers to Reduce Gas Emissions from Liquid Manure Storages: A Review. Appl. Eng. Agric. 2008, 24, 657–671. [Google Scholar] [CrossRef]
  32. Scotto di Perta, E.; Mautone, A.; Oliva, M.; Cervelli, E.; Pindozzi, S. Influence of Treatments and Covers on NH3 Emissions from Dairy Cow and Buffalo Manure Storage. Sustainability 2020, 12, 2986. [Google Scholar] [CrossRef]
  33. Zhuang, M.; Shan, N.; Wang, Y.; Caro, D.; Fleming, R.M.; Wang, L. Different Characteristics of Greenhouse Gases and Ammonia Emissions from Conventional Stored Dairy Cattle and Swine Manure in China. Sci. Total Environ. 2020, 722, 137693. [Google Scholar] [CrossRef] [PubMed]
  34. Zhu, Z.; Li, L.; Dong, H.; Wang, Y. Ammonia and Greenhouse Gas Emissions of Different Types of Livestock and Poultry Manure during Storage. Trans. ASABE 2020, 63, 1723–1733. [Google Scholar] [CrossRef]
  35. Chadwick, D.R. Emissions of Ammonia, Nitrous Oxide and Methane from Cattle Manure Heaps: Effect of Compaction and Covering. Atmos. Environ. 2005, 39, 787–799. [Google Scholar] [CrossRef]
  36. Emmerling, C.; Krein, A.; Junk, J. Meta-Analysis of Strategies to Reduce NH3 Emissions from Slurries in European Agriculture and Consequences for Greenhouse Gas Emissions. Agronomy 2020, 10, 1633. [Google Scholar] [CrossRef]
  37. Kriška, T.; Škarpa, P.; Antošovský, J. Effect of Natural Liquid Hydroabsorbents on Ammonia Emission from Liquid Nitrogen Fertilizers and Plant Growth of Maize (Zea Mays L.) Under Drought Conditions. Plants 2023, 12, 728. [Google Scholar] [CrossRef] [PubMed]
  38. Schmidhalter, U. 15 N Mass Balance Technique for Measuring Ammonia Losses from Soil Surface-applied Slurries Containing various Additives. J. Plant Nutr. Soil Sci. 2024, 187, 443–453. [Google Scholar] [CrossRef]
  39. Ellersiek, N.C.T.; Olfs, H. An Incubation System for the Simulation of Ammonia Emissions from Soil Surface-Applied Slurry: Effect of pH and Acid Type. Agronomy 2024, 14, 1078. [Google Scholar] [CrossRef]
  40. Zhu, H.; Zuo, F.; Dong, H.; Luan, D. Effects of Covering Materials and Sawdust Covering Depths on Ammonia and Greenhouse Gase Emissions from Cattle Manure during Storage. Trans. Chin. Soc. Agric. Eng. 2015, 31, 223–229. [Google Scholar] [CrossRef]
  41. Turbí, M.A.T.; Gómez-Garrido, M.; El bied, O.; Bencosme, J.G.C.; Cano, Á.F. Preliminary Results on the use of Straw Cover and Effective Microorganisms for Mitigating GHG and Ammonia Emissions in Pig Slurry Storage Systems. Agriculture 2024, 14, 1788. [Google Scholar] [CrossRef]
  42. Matulaitis, R.; Juskiene, V.; Juska, R. The Effect of Floating Covers on Gas Emissions from Liquid Pig Manure. Chil. J. Agric. Res. 2015, 75, 232–238. [Google Scholar] [CrossRef]
  43. Kim, S.; Shim, S.; Won, S.; Ra, C. Assessment of a Novel Real-Time Bio-Liquor Circulation System for Manure Management and Mitigation of Odor Potential in Swine Farming. Animals 2023, 13, 3849. [Google Scholar] [CrossRef] [PubMed]
  44. Kupper, T.; Häni, C.; Neftel, A.; Kincaid, C.; Bühler, M.; Amon, B.; VanderZaag, A. Ammonia and Greenhouse Gas Emissions from Slurry Storage—A Review. Agric. Ecosyst. Environ. 2020, 300, 106963. [Google Scholar] [CrossRef]
  45. Lemes, Y.M.; Nyord, T.; Feilberg, A.; Kamp, J.N. Effect of Covering Deep Litter Stockpiles on Methane and Ammonia Emissions Analyzed by an Inverse Dispersion Method. ACS Agric. Sci. Technol. 2023, 3, 399–412. [Google Scholar] [CrossRef]
  46. Chen, G.; Wu, P.; Dong, J.; Zheng, J.; Wang, E. Use of a Wheat Straw Covering to Reduce Nitrogen Loss during Pig Slurry Storage and Reuse of the Straw Covering in Biochar Production for Nitrogen Retention in the Slurry. Waste Manag. 2023, 168, 406–412. [Google Scholar] [CrossRef] [PubMed]
  47. Mohankumar, S.E.P.; Winiwarter, W.; Amon, B. Greenhouse Gas and Ammonia Emissions from Different Stages of Liquid Manure Management Chains: Abatement Options and Emission Interactions. J. Environ. Qual. 2018, 47, 30–41. [Google Scholar] [CrossRef] [PubMed]
  48. de-Jiménez-Santiago, D.E.; Ovejero, J.; Antúnez, M.; Bosch-Serra, A.D. Ammonia Volatilization from Pig Slurries in a Semiarid Agricultural Rainfed Area. Sustainability 2024, 16, 238. [Google Scholar] [CrossRef]
Figure 1. Schematic image of the research bench measuring ammonia emission from manure: 1—NH3 gas source (manure); 2—heated air supply hoses; 3—membrane air pump; 4—electrically heated three-channel valve; 5—laser gas analyzer; 6—data collecting computer (AMR software v5.19.1.22); 7—data accumulator-gauge “Almemo 2590-9”; 8—thermocouples; 9—air sampling probes; 10—manure chamber; 11—bio-cover; —clean air; —air contaminated with NH3.
Sustainability 17 06617 g001
Figure 2. Alterations in NH3 emissions from semi-liquid manure without coating (chamber I, except for graph (d)) and covered with bio-coating (chamber II): (a) chopped wheat straw; (b) sawdust; (c) acidic peat; (d) hemp chaff.
Sustainability 17 06617 g002
Figure 3. Average reduction in NH3 emissions from manure over different periods after adding a layer of bio-coating to the manure: (a) chopped wheat straw; (b) sawdust; (c) acidic peat; (d) hemp chaff.
Sustainability 17 06617 g003
Figure 4. The capability of different bio-coating types and thicknesses in reducing NH3 emissions from dairy cattle manure in the long term (“a”, “b”, “c”, “d”, “e”, “f”—there is no statistically significant difference between data marked with the same letter).
Sustainability 17 06617 g004
Figure 5. Change in ammonia emission intensity from manure after simulating 4.3 mm of precipitation (a) and efficiency of various bio-coatings in reducing ammonia emissions after the imitation of precipitation (b).
Sustainability 17 06617 g005
Figure 6. NH3 emission intensity after simulated rainfall for manure with different DM content.
Sustainability 17 06617 g006
Figure 7. Correlation of manure DM content and precipitation effect on ammonia emissions. * Alterations are assessed by comparing the measurement values of the data recorded at 30 min intervals; each measurement is compared to the previous one, and the average alteration is calculated from 20 h after water application to 140 h after water application.
Sustainability 17 06617 g007
Disclaimer/Publisher’s Note: The statements, opinions and data contained in all publications are solely those of the individual author(s) and contributor(s) and not of MDPI and/or the editor(s). MDPI and/or the editor(s) disclaim responsibility for any injury to people or property resulting from any ideas, methods, instructions or products referred to in the content.

