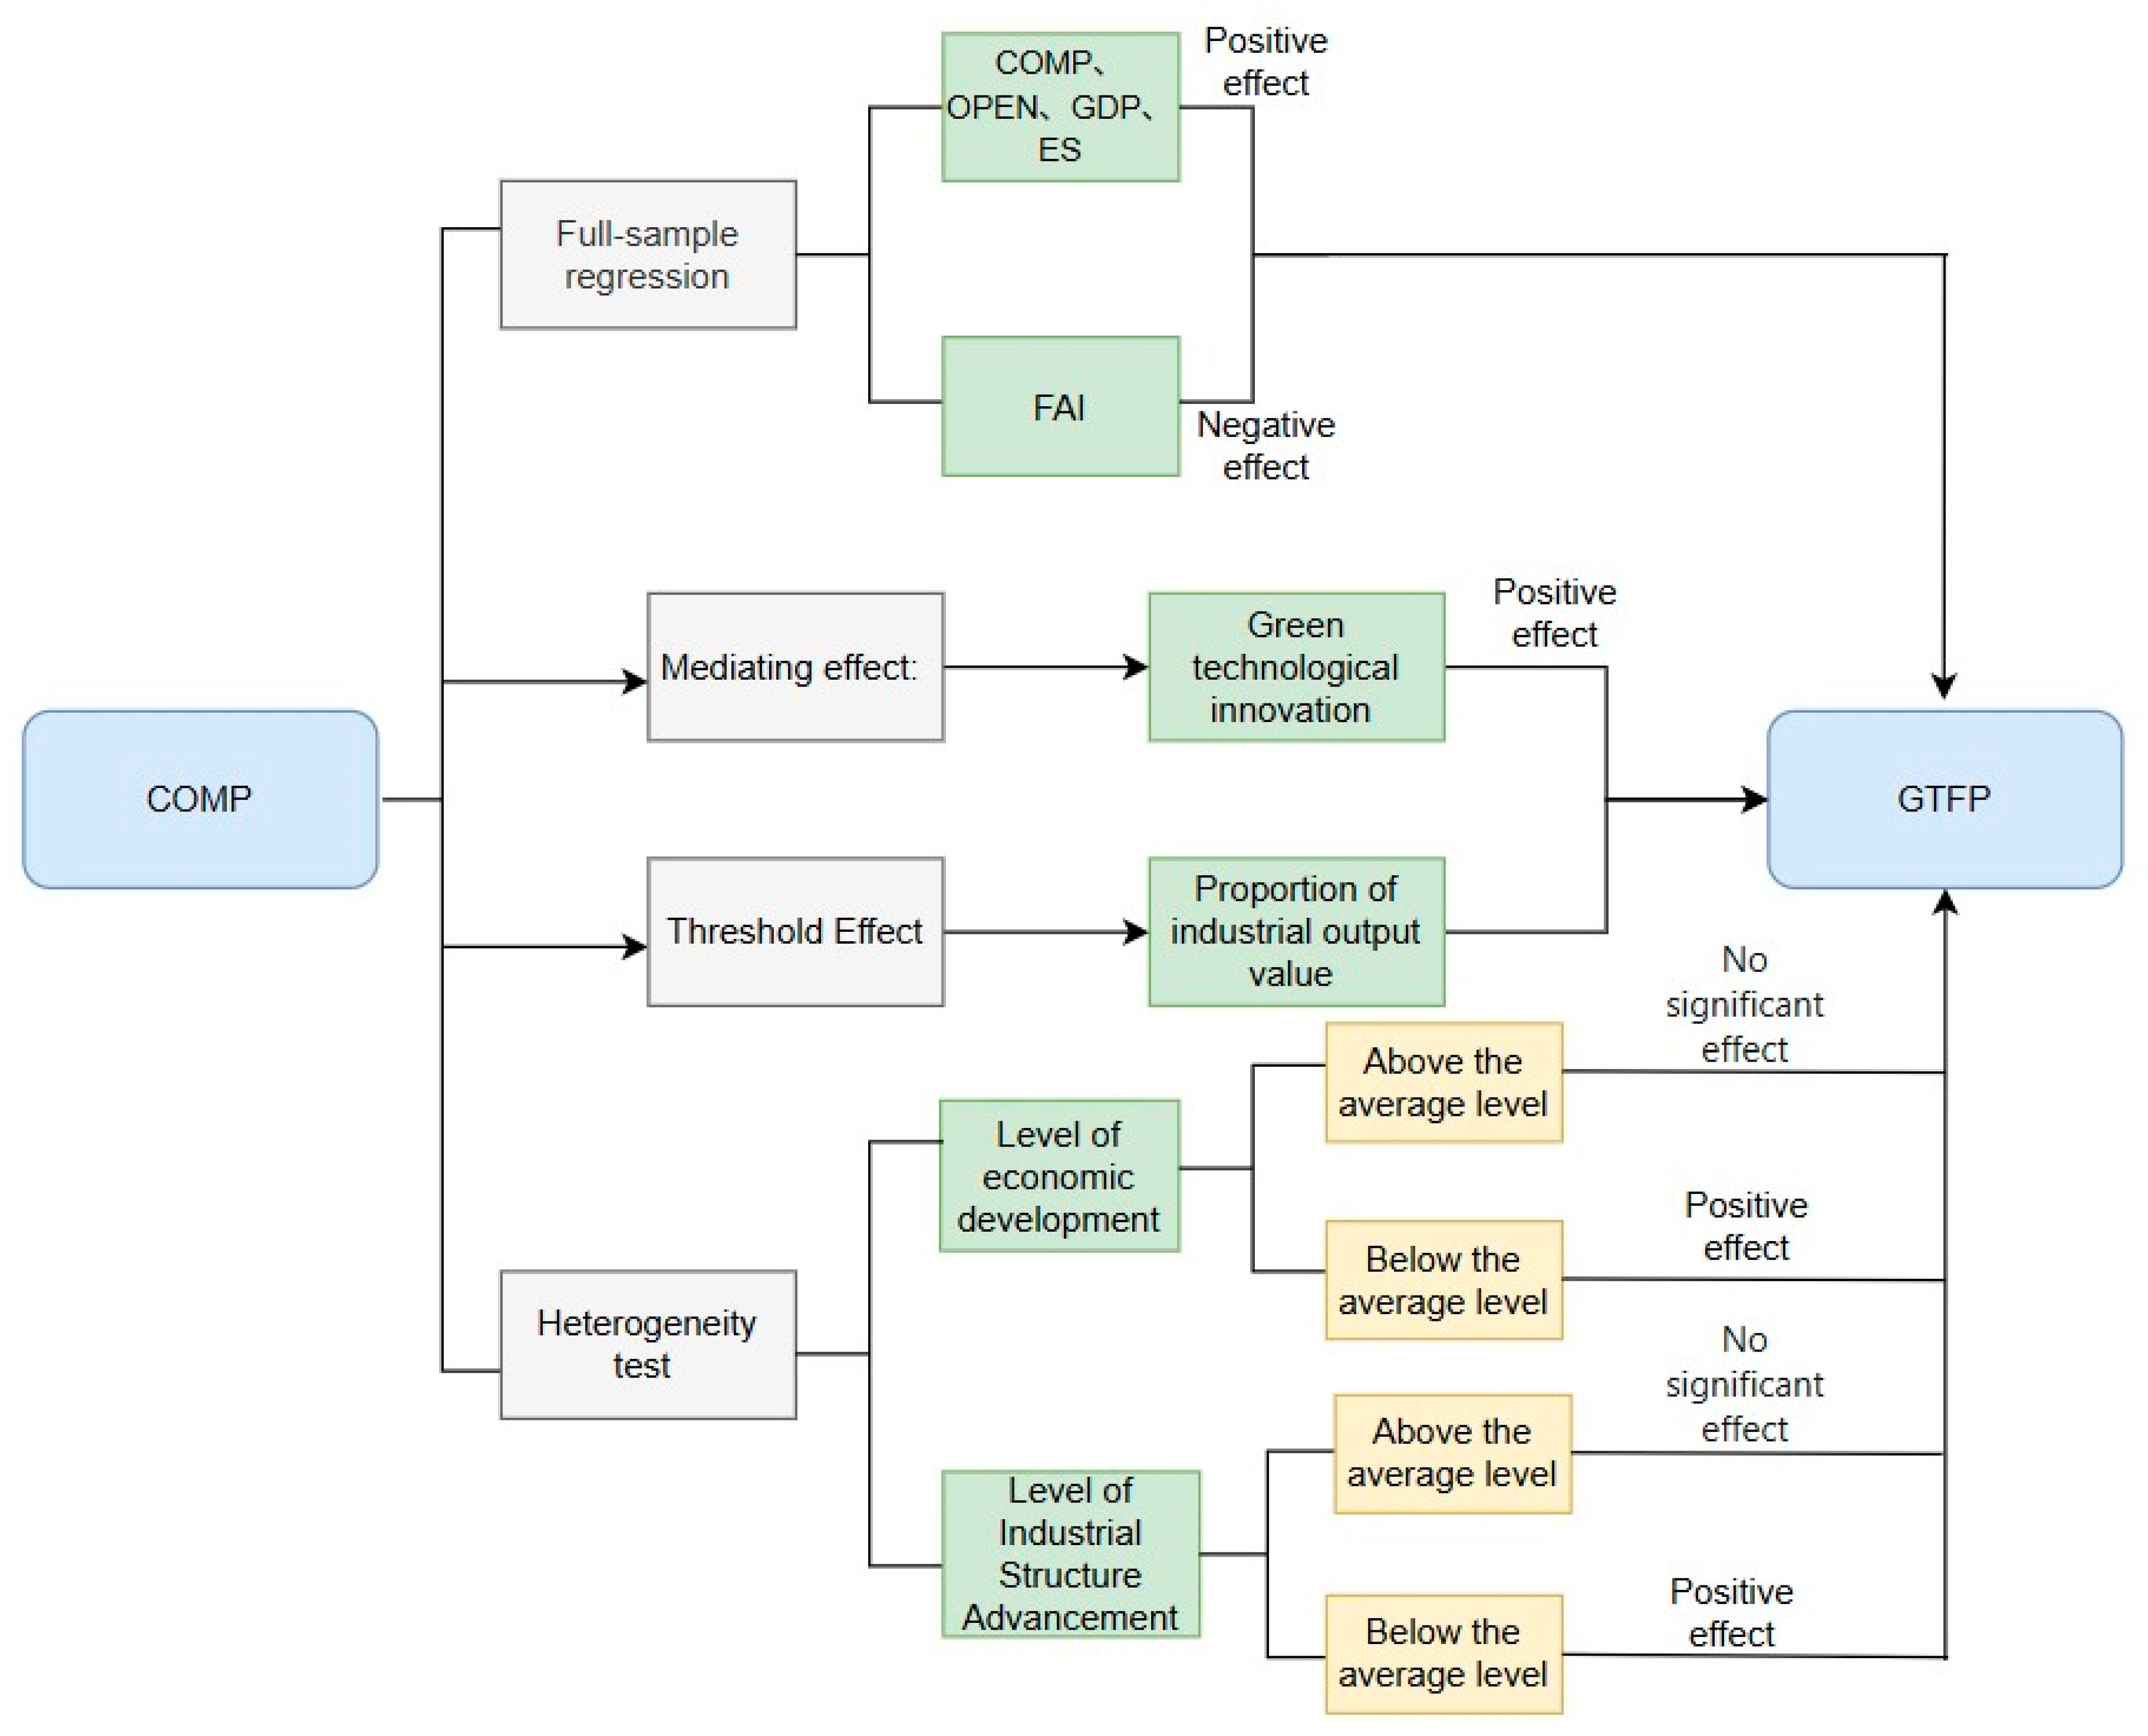
4.2. Analysis of Full-Sample Regression Results
Statistical analyses were executed using Stata 18.To avoid errors arising from multicollinearity, we first conducted a multicollinearity test on the variables involved in the study, as shown in
Table 4. All variables have VIF values below 5, indicating that multicollinearity is weak in the regression model.
Before conducting the overall regression, we performed a Hausman test on the model to assess its appropriateness, with results shown in
Table 5. The Hausman test rejects the null hypothesis (
p < 0.01), indicating that the fixed-effects model is more suitable for the empirical analysis.
On this basis, we conducted a full-sample regression, and the results are presented in
Table 6. Urban compactness has a positively significant effect on GTFP at the 5% level (0.65), indicating that greater compactness can promote GTFP improvement. As economic compactness increases and economic activities become more concentrated, economies of scale emerge, boosting production efficiency and reducing resource consumption, thereby enhancing urban GTFP. Through denser road-network planning combined with compact spatial planning, increases in network density and functional-zone compactness reduce greenhouse gas emissions caused by excessive traffic and long commuting distances, further improving GTFP. Moreover, higher population density and concentrated human capital improve labor productivity. For example, the spillover of high-quality education and medical resources from central cities raises the human-capital level in surrounding areas. A concentrated population also fully leverages shared public services (e.g., transportation and healthcare), lowering living costs, attracting more highly skilled people, and creating a positive cycle that provides a human-capital advantage for upgrading urban industrial technology, thus affecting GTFP.
Among the control variables, the level of foreign direct investment, the economic value per unit of carbon emissions, and the employment structure each have a positive and significant impact on GTFP at the 1% level. In contrast, fiscal decentralization has a negative and significant effect on GTFP at the 1% level.
OPEN also shows a positive and significant effect on GTFP, suggesting that higher openness advances marketization, fosters a fairer competitive environment for enterprises, and helps channel production factors such as capital and labor toward high-technology, high-efficiency, lower-energy-consumption, and higher-value-added firms, thereby optimizing resource allocation. A higher level of external investment typically reflects stronger intellectual-property protection and more thoroughly price-mediated production factors, which encourage firms to pursue green technological innovation, gain competitive advantage, and, in turn, drive improvements in GTFP.
The positive and significant effect of GDP on GTFP indicates that increasing this metric helps enhance GTFP. Higher economic returns per unit of carbon emissions optimize the return on investment in green technologies, raise their economic value, and facilitate their diffusion and application, thereby boosting GTFP. In addition, a higher economic value per unit of carbon emissions improves resource-allocation efficiency: strong economic incentives steer capital and production inputs toward low-carbon industries such as renewable energy and services, further enhancing GTFP.
The negative and significant effect of FAI on GTFP suggests that excessive administrative intervention may occur in resource allocation. When governments allocate resources through administrative directives rather than market signals, capital and labor may flow into suboptimal sectors, inhibiting the green transformation of industry. In the Dianzhong and Chengdu–Chongqing urban agglomerations, economic development lags overall, and local fiscal revenues are limited, making these regions heavily dependent on higher-level transfer payments. Preferring broad, short-term spending to quickly generate revenue, local governments fail to provide targeted support for green industries and struggle to build long-term green-technology capacity.
The positive and significant impact of ES on GTFP indicates that a higher share of tertiary-industry employment promotes GTFP growth. Compared with primary and secondary sectors, the tertiary industry typically generates greater economic value with lower pollution emissions. Moreover, tertiary-industry jobs usually offer higher incomes, and increasing their share supports higher household incomes, drives an upgrade in consumption patterns, and stimulates spending on culture, education, and entertainment. This shift encourages green consumption and influences producers to adopt green-industry practices and technological upgrades.
To examine potential spatial spillover effects within urban agglomerations, we employed a spatial Durbin model (SDM) to test the spatial spillover effects of urban compactness on GTFP in the Chengdu–Chongqing urban agglomeration. Given that the Central Yunnan agglomeration comprises only three prefecture-level city samples—insufficient to meet the sample size requirements for spatial econometric analysis—it was excluded from this analysis. Prior to model estimation, Lagrange multiplier (LM) tests were conducted to detect spatial dependence in the data, and likelihood ratio (LR) tests were performed to select the appropriate model for spatial effects analysis. As presented in
Table 7, both the LM test for spatial error autocorrelation (LM-error) and the LM test for spatial lag dependence (LM-lag) yielded statistically significant positive results at the 5% level, revealing spatial dependence in the study data and necessitating spatial correlation analysis. The LR test results (
Table 7: LR Test SDM vs. SEM and LR Test SDM vs. SAR) indicate that both tests produced
p-values less than 0.01. This demonstrates that the spatial Durbin model is more suitable for examining spatial spillover effects in this study compared to the spatial error model (SEM) or spatial autoregressive model (SAR).
As presented in
Table 7, the spatial lag effect test indicates that the explanatory variable COMP exhibits a statistically significant positive local direct effect on GTFP (
p < 0.05) while its impact on neighboring cities’ GTFP is insignificant (
p > 0.1). Conversely, the spatial spillover effect of the dependent variable itself (rho) shows statistically significant negativity at the 5% level, with a coefficient of −0.3. This indicates the presence of negative spatial spillover effects of GTFP on neighboring cities.
The explanatory variable COMP and other control variables exhibit statistically significant positive direct local effects on GTFP. This indicates strong localized impacts of individual urban compactness on GTFP within the Chengdu–Chongqing urban agglomeration, whereby enhanced local transportation efficiency, land-use efficiency, industrial agglomeration, and population density—achieved through compact urban development—facilitate localized knowledge spillovers. These improvements collectively elevate comprehensive urban efficiency while reducing production-related pollution emissions.
However, the spillover effects of neighboring cities’ COMP on GTFP remain statistically insignificant. This can be attributed to the agglomeration’s distinct topography: its western region features rugged hilly terrain while the eastern portion comprises plains. Apart from Chengdu and Chongqing situated on flat terrain, most cities occupy the western hilly areas where terrain constraints limit transportation connectivity, thereby weakening spatial spillovers. Furthermore, although Chengdu and Chongqing—the twin cores—are administratively adjacent, their central districts exceed 200 km in straight-line distance and 300 km by road, impeding effective diffusion of green technologies and industries. Concurrently, secondary centers like Luzhou and Yibin collectively account for less than 10% of the agglomeration’s economic output, rendering their regional influence limited.
The negative spatial spillover effect (rho) of GTFP itself reveals competitive dynamics among cities within the agglomeration, reflecting underdeveloped regional integration. Chengdu and Chongqing concentrate most high-end production factors due to their advanced economic development and geographic advantages, generating twin-core resource-siphoning effects. Yet constrained by transportation and topography, their radiating influence remains geographically bounded. While elevating their own GTFP, they attract skilled labor from peripheral cities, creating GTFP depressions in surrounding resource-dependent cities and upstream green industrial chains. Consequently, GTFP gains in core cities occur at the expense of green development potential in peripheral areas, manifesting as a core-periphery divergence in sustainable development trajectories.
4.4. Mediation Effect Test
To ensure the scientific rigor and reliability of the mediation-effect test, we applied the bootstrap method to assess the robustness of the mediation effect. Bootstrap is a nonparametric resampling method that simulates the sampling distribution of a statistic by repeatedly drawing random samples with replacement from the original dataset. In testing mediation effects, the focal concern is whether the independent variable influences the dependent variable through the mediator. This relationship can be conceptualized through two pathways: the effect of the independent variable on the mediator (path a) and the effect of the mediator on the dependent variable (path b). The indirect effect is quantified as the product of *a* and *b*. Since the sampling distribution of the product term a × b is not amenable to normal distribution-based derivation of standard errors and confidence intervals, the bootstrap method provides a more robust approach for estimating mediation effects and their corresponding confidence intervals. The results are shown in
Table 11. The total-effect coefficient is 0.653, which represents the estimated overall effect of the independent variable (urban compactness) on the dependent variable (GTFP) via the mediator (green technological innovation). The “a” coefficient (0.977) measures the effect of COMP on the mediator, and the “b” coefficient (0.371) measures the effect of the per-10,000-population green patent authorizations on GTFP. The direct-effect coefficient (c′) is the coefficient on COMP from the full model. Hence, the product a × b (0.363) is the mediation-effect value, with
p < 0.01 and a 95% confidence interval that does not include 0, indicating a robust mediation effect.
The coefficient of 0.977 for the effect of urban compactness on green technological innovation (a-value) indicates that increased compactness promotes green technological innovation. Through intensive land use, cities can implement centralized green infrastructure investments, providing policy and environmental support for firms’ green transformation; compact spatial layouts intensify land-price competition, forcing low-value-added, high-energy-consumption industries either to relocate or upgrade via green technologies, thereby enhancing GTFP; and compact urban forms facilitate the efficient flow of information, technology, and talent, improving resource-allocation efficiency, accelerating technology diffusion, and fostering industrial synergies that underpin the development of low-energy-consumption, high-tech industries and modern services.
The effect of green technological innovation on GTFP is positive and significant at the 5% level, with a coefficient of 0.371 (b-value), demonstrating that green technological innovation fosters GTFP improvement. Green technological innovation raises firms’ production efficiency and reduces energy consumption, aiding traditional manufacturing in its structural transformation and weakening carbon-emission intensity. Moreover, it drives firms to diversify green-product portfolios and lower production costs, which tends to reduce prices, satisfy and stimulate green-consumer demand, and thus support the sustainable growth of GTFP.
4.5. Heterogeneity Analysis
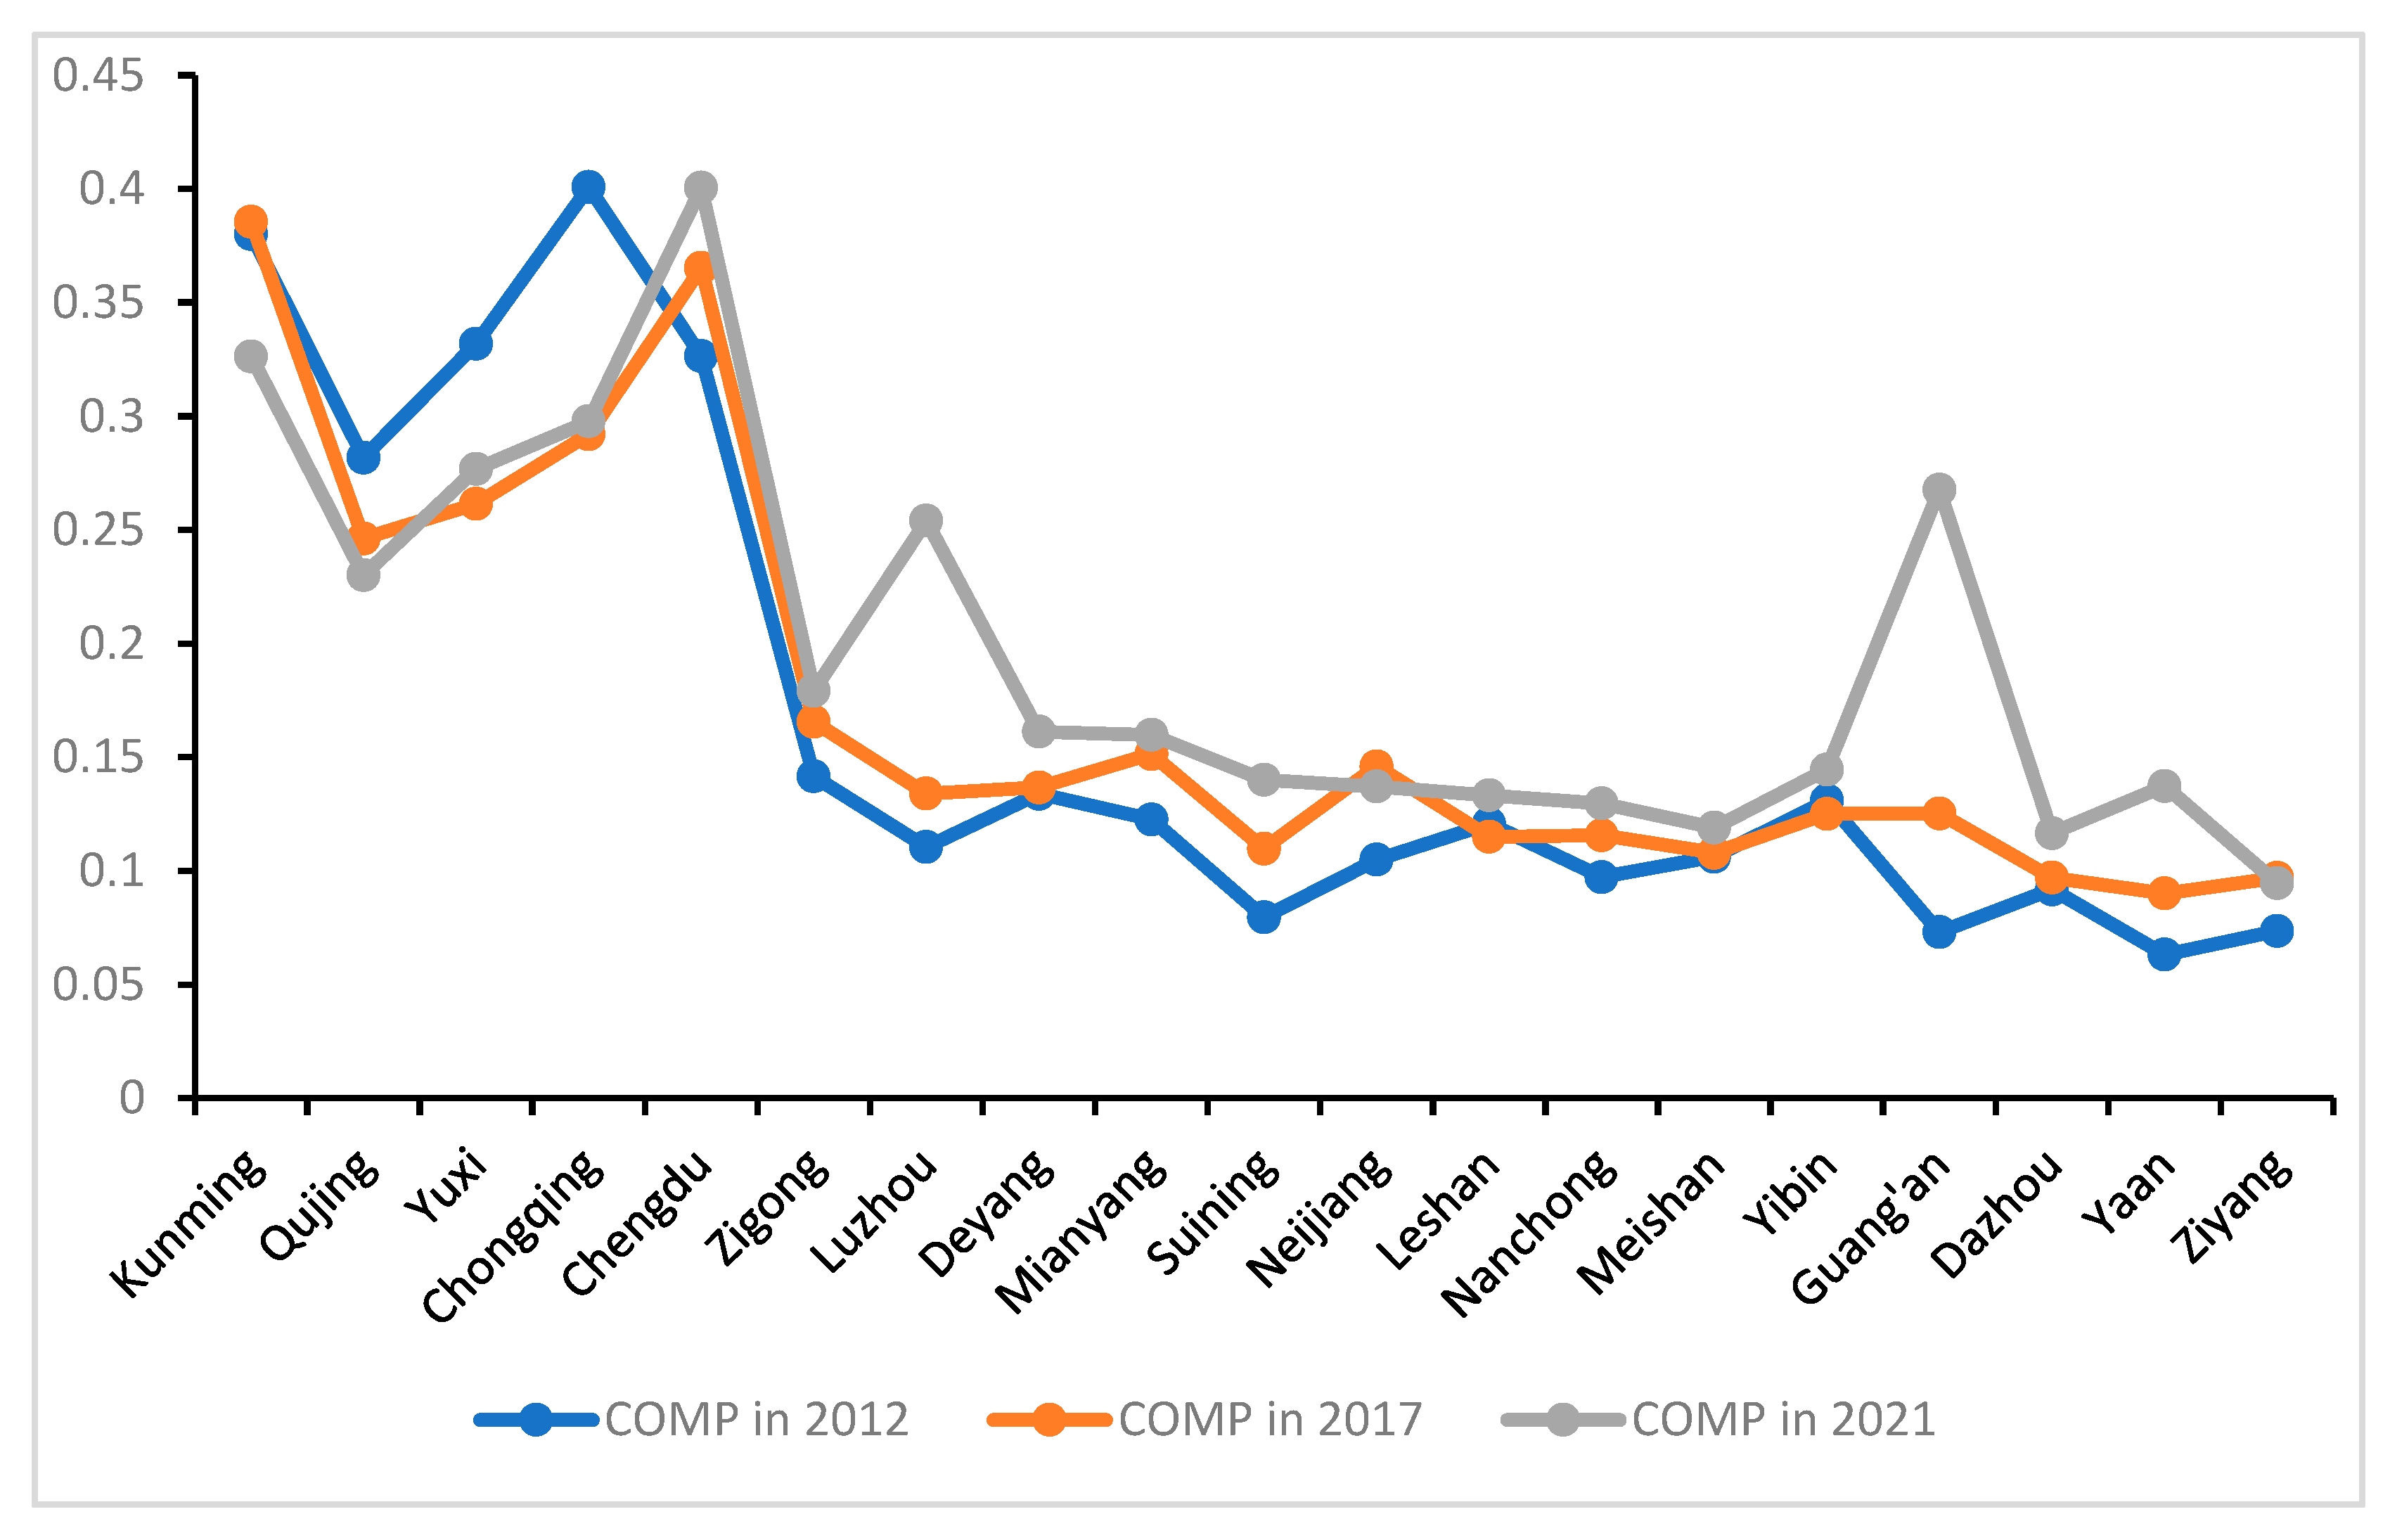
The above sections have examined the overall effect of urban compactness on GTFP and the mediating role of green technological innovation. However, cities in our sample belong to different geographic contexts and stages of economic development, so the impact of compactness on GTFP may vary with economic development level. To test this, we used the 2021 per-capita GDP of each city: those above the sample average were classified as “higher-development” cities and those below as “lower-development” cities. The higher-development group comprises 9 cities: Kunming, Yuxi, Chongqing, Chengdu, Zigong, Deyang, Mianyang, Leshan, and Yibin; the lower-development group comprises 10 cities: Qujing, Luzhou, Suining, Neijiang, Nanchong, Meishan, Guang’an, Dazhou, Ya’an, and Ziyang.
4.5.1. Heterogeneity Test by Economic Development Level
We divided the sample into the two development-level groups and estimated the effect of urban compactness on GTFP separately for each. The results, shown in
Table 12, indicate that for cities with above-average economic development, compactness has a positive and significant impact on GTFP, with a coefficient of 0.88. In contrast, for cities below the average, the effect of compactness on GTFP is not statistically significant.
Cities with higher economic development typically have more advanced industrial structures and higher value added, which raises the demand for green technological innovation to reduce production costs. Moreover, the clustering of technology-intensive industries facilitates green-technology learning and diffusion among firms, further improving productivity and GTFP growth. Conversely, less-developed cities often lack adequate infrastructure and remain in an industrial transition phase, with limited capacity to absorb green industries. Their constrained fiscal resources are largely directed toward basic infrastructure and social services, weakening support for emerging green sectors and potentially crowding out green investment, which may explain the insignificant effect of compactness on GTFP in these cities.
4.5.2. Heterogeneity Test by Industrial Structure Advancement
We measured industrial structure advancement as the ratio of tertiary sector value-added to secondary sector value-added. Based on the 2021 average value of this metric, the sample was divided into two groups: above-average and below-average advancement levels. Heterogeneity analysis results (
Table 11) reveal that the impact of COMP on GTFP is statistically insignificant in the above-average industrial advancement group while exhibiting a significantly positive effect (coefficient = 1.49) in the below-average group.
These regression outcomes demonstrate that in regions with higher industrial advancement—characterized by greater tertiary sector shares and superior technical efficiency—economic activities show weaker dependence on spatial agglomeration while shifting toward high-skilled talent demand. Consequently, enhanced urban compactness exerts limited influence on GTFP. Conversely, in regions with lower industrial advancement, COMP demonstrates a strongly positive impact on GTFP (β = 1.49; originally noted as 1.7 in text). These areas typically exhibit extensive development patterns with lower technological sophistication. Increased compactness facilitates resource concentration, reduces production pollution through industrial clustering, and enables technology and infrastructure sharing, thereby elevating GTFP. Moreover, the relatively higher secondary sector share in such regions enhances productivity through spatial agglomeration efficiencies (
Table 13).
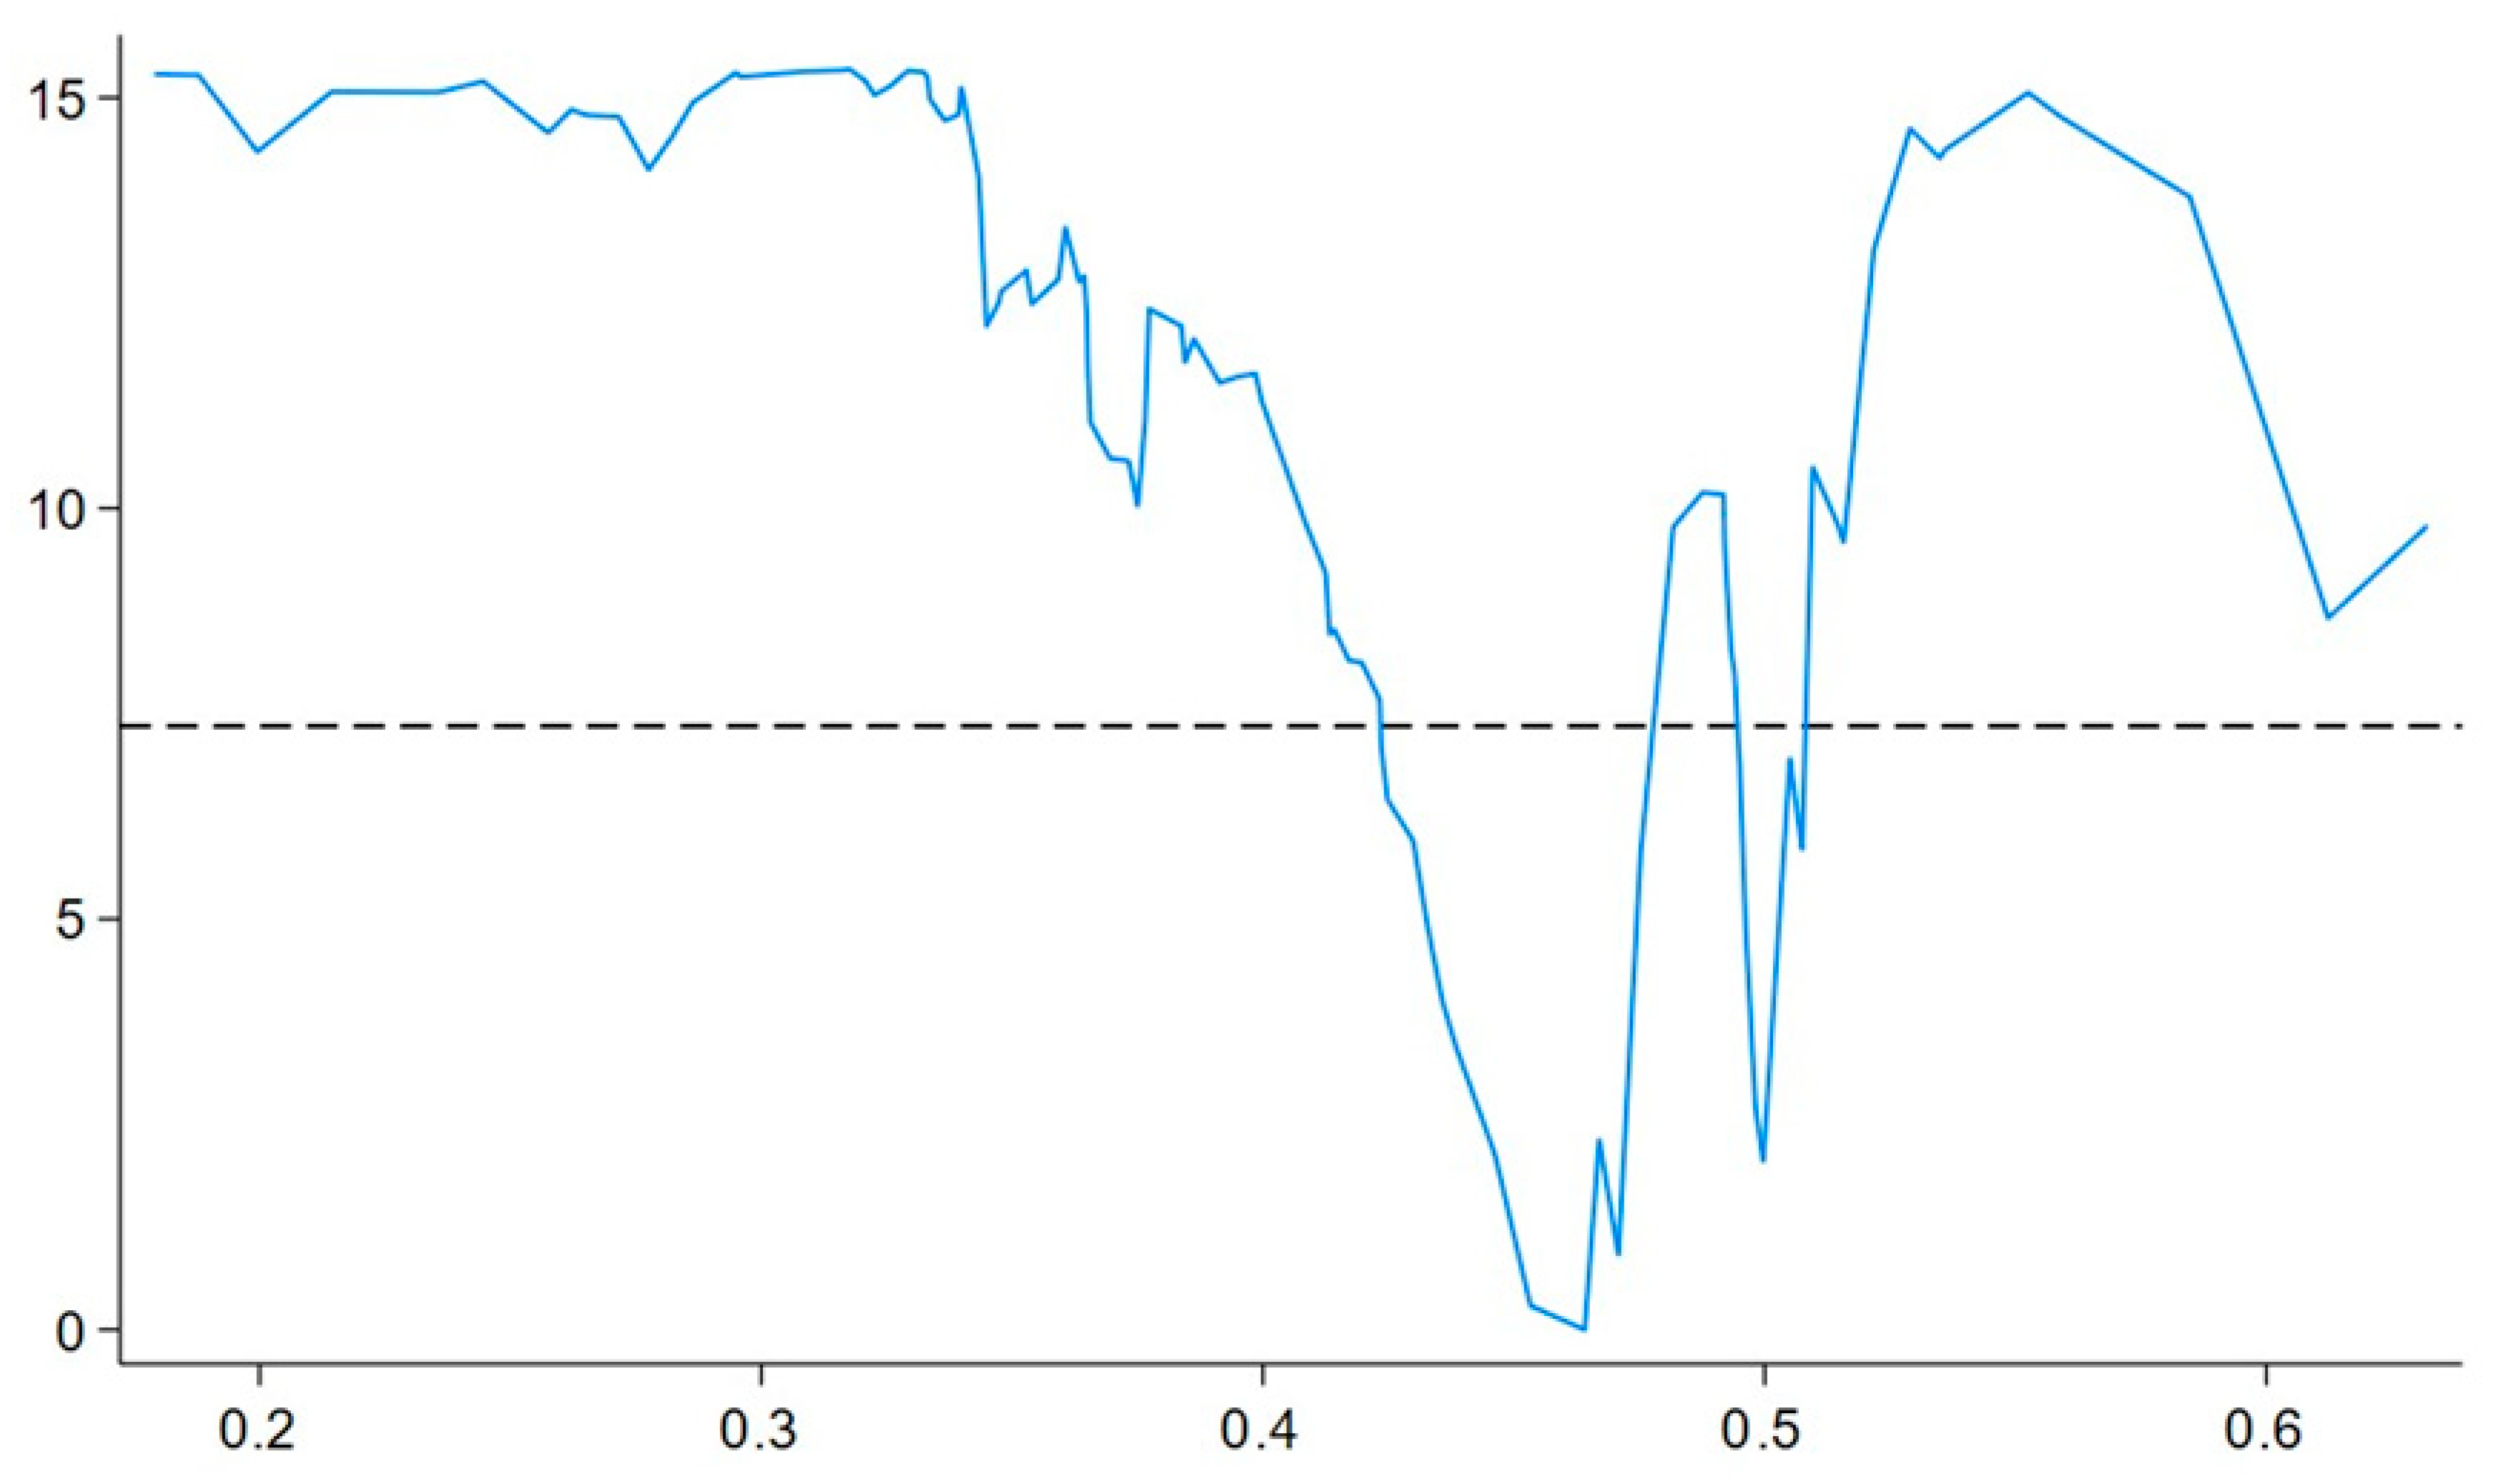
The threshold-effect regression results are shown in
Table 14. The test indicates that when the share of industrial output is at a lower level, urban compactness has a positive and significant effect on GTFP at the 5% level, with a coefficient of 0.606. Once the industrial-output share exceeds the threshold value, compactness exerts a positive and significant effect on GTFP at the 1% level, with a coefficient of 1.528. This suggests that at lower levels of industrial output, a more compact urban form reduces transportation costs and improves land-use efficiency, thereby enhancing overall resource-allocation efficiency and positively driving GTFP. However, because the industrial system is relatively small at this stage, the spillover effects of green technology are limited, so the impact of compactness on GTFP remains modest.
When the industrial-output share is at a higher stage, infrastructure and public services are more fully developed. In this context, the economies-of-scale and agglomeration effects induced by spatial compactness become more pronounced, attracting greater green-technology investment and providing sufficient research funding, which strengthens the capacity for green-technology development and diffusion. Furthermore, advancing a compact spatial layout facilitates knowledge sharing and accelerates green-technology progress.
Figure 4 plots the nonlinear marginal-effect curve of urban compactness on GTFP across different compactness scores. The figure indicates that the value at the lowest inflection point on the
x-axis aligns with the threshold value of 0.464 in the test table, confirming this inflection point as the threshold for the nonlinear effect. Below this threshold (0.464), the impact curve of urban compactness on GTFP remains relatively flat, corresponding to the coefficient (0.606) for Regime 0 in
Table 11. Once exceeding this threshold, the slope of the compactness–GTFP relationship steepens substantially, matching the coefficient (1.529) for Regime 1 in
Table 11, consistent with the analysis above. This figure provides enhanced visual evidence for the nonlinear relationship between urban compactness and GTFP.
Table 15 presents the bootstrap test results, with
p < 0.01, indicating that the threshold-effect test is robust.


