Article

Whether Digital Villages Can Alleviate Towns–Rural Clean Energy Consumption Inequality in China?

1
Sichuan Key Laboratory of Energy Security and Low-Carbon Development, Chengdu 610500, China
2
School of Economics and Management, Southwest Petroleum University, Chengdu 610500, China
3
Southwest Oil and Gas Field Company Natural Gas Economic Research Institute, Chengdu 610051, China
*
Authors to whom correspondence should be addressed.
Sustainability 2025, 17(14), 6599; https://doi.org/10.3390/su17146599
Submission received: 24 June 2025 / Revised: 16 July 2025 / Accepted: 17 July 2025 / Published: 19 July 2025

Abstract

The equitable allocation of clean energy access across towns–rural divides is a critical benchmark of modernization in developing economies. This is because it is intricately linked to the realization of strategic goals such as shared prosperity, ecological civilization advancement, and national energy security reinforcement. This research examines the impact of China’s digital village (DV) construction in reducing the urban–rural disparity in household clean energy access, evaluates the effect on towns–rural clean energy consumption inequality (CEI), explores the mediating mechanisms, and considers regional heterogeneity. It is an innovative approach to test the influence of digital village construction on clean energy consumption inequality between urban and rural areas, beyond which conventional research is limited to infrastructure investment and policy considerations. We can reach the following three results: (1) With the continuous improvement of digital village construction, CEI between towns and rural areas shows an “inverted U-shaped” change. (2) From the perspective of the intermediary mechanism, agricultural technological progress (ATP) and industrial structure upgrading (IND) can facilitate digital village construction and reduce the disparity in clean energy consumption between towns and rural regions. (3) From the perspective of heterogeneity analysis, digital village construction in areas with low urbanization levels, high terrain undulation, and non-clean energy demonstration provinces can significantly alleviate CEI. It is on this basis that the present paper proposes a policy recommendation for the Chinese government to effectively reduce the gap between towns and rural clean energy consumption in the process of digital village construction.

1. Introduction

Energy is an important cornerstone for the development of social and economic activities, but the carbon emissions generated during its consumption process are the main cause of global climate change. According to the statistics and analysis of the International Energy Agency (IEA), over 90% of global energy-related carbon emissions come from the combustion of fossil fuels. The development, supply, and consumption of clean energy have become key links in coordinating economic growth with ecological protection. Clean energy has significant environmental advantages throughout its life cycle, with significantly lower carbon emissions; significantly reduced negative impacts on the atmosphere, water, soil, and other environmental elements; and a lower potential for threats to human health [1]. As a result, more and more countries have taken the renewable energy transition as a strategic choice to address climate change and improve environmental quality [2], and are actively promoting the transition from traditional to clean and low-carbon energy sources in order to achieve synergistic development of the economy, society, and the environment [3].
The significance of energy consumption equality has been widely recognized by the academic community. The theory of equality of feasible capacity points out that the essence of the inequality in access to energy is the deprivation of the right to development. Some scholars have pointed out that the uneven distribution of energy resources has particularly led some countries to fall into energy poverty [4]. Although there have been advancements in energy technology in developing countries, energy poverty remains prominent [5]. Some scholars have also confirmed through cross-border research that for every 10% expansion of the energy consumption gap between urban and rural areas, the rural poverty rate will increase by 3.2% [6]. The seventh United Nations Sustainable Development Goal (SDGs), “affordable and clean energy”, lists energy accessibility and equity as core indicators, emphasizing “ensuring that everyone has access to affordable, reliable and sustainable modern energy”, increasing the proportion of renewable energy in the energy structure can reduce energy poverty in countries where energy poverty is widespread [7]. Thus, a few scholars have begun to focus on the relationship between the development of digital technology in rural areas and the consumption of clean energy [8], and some scholars have focused their research samples from Norway on the “coordination between smart cities and rural areas” in developed countries [9], but have not extended it to the context of developing countries. Some scholars have also found that the insufficiency of clean energy infrastructure in rural areas, such as India, has led to rural households’ reliance on traditional energy sources being much higher than that in urban areas [10]. These studies lack large-scale panel data evidence for large developing countries such as China and Indonesia. In emerging economies in Asia and low-income developing countries in Africa and Latin America, the digital development in rural areas is slow, and the gap in clean energy consumption between urban and rural areas is the largest [11].
In China, the proportion of clean energy consumption, such as natural gas and electricity, in urban areas is 57.3%, while in rural areas it is only 28.6%. Moreover, the proportion of traditional non-clean energy, such as biomass energy, in rural areas remains as high as 41.2%, the inequality in clean energy consumption (CEI) between towns and rural areas still exists [12,13], mainly reflected in aspects such as infrastructure, energy accessibility, and the utilization of clean energy [14]. Specifically manifested in the differences in access to clean energy [15], especially with the rapid economic growth in cities, which leads to higher investment in clean energy facilities than in rural areas. There are differences in the quality of clean energy consumption and service levels [16]; 25.6% of people cannot afford basic energy services [17], while natural gas and direct electric heating are unaffordable for low-income rural families [18]. Under the promotion of the rural revitalization project and the towns–rural integration strategy, the “going to the countryside” of rural renewable energy has been significant [19], and the clean energy business forms in rural areas have become more diverse. The integration of digital technology and rural development offers new possibilities for resolving this contradiction. Data from China’s Ministry of Industry and Information Technology show that in 2022, the Internet penetration rate in rural areas reached 61.5%, cumulative investment in digital village construction exceeded CNY 500 billion, and smart energy platforms covered 83% of administrative villages across the country. Has this infiltration reshaped the energy consumption pattern of clean energy in urban and rural areas? What characteristics does its influence mechanism present? It has become a realistic proposition that urgently needs to be answered.
This article provides three outstanding contributions. Firstly, incorporate China’s digital villages (DV) and the equality of clean energy between urban and rural areas into a unified research framework. Nowadays, many researchers at home and abroad have been discussing the socio-economic significance of rural digitalization and how rural digitalization affects rural economic growth [20,21] and how to implement China’s targeted poverty alleviation policy [22,23]. The research was also conducted on how to promote towns–rural integration [24,25], that is, digital villages bring economic, governance, or industrial effects to the development of rural areas in China. A small number of studies have focused on the achievements of digital village construction projects related to energy [22], and some scholars have quantified the poverty alleviation performance of energy-targeted poverty alleviation infrastructure projects [26,27]. There is a serious lack of attention to the core dimension of social equity, namely, the equality of energy consumption, especially the equality of clean energy consumption. This article places greater emphasis on the significance of the impact of DV construction on the inequality in clean energy consumption between urban and rural areas, and is committed to assisting the government in formulating effective social and energy policies to alleviate this inequality.
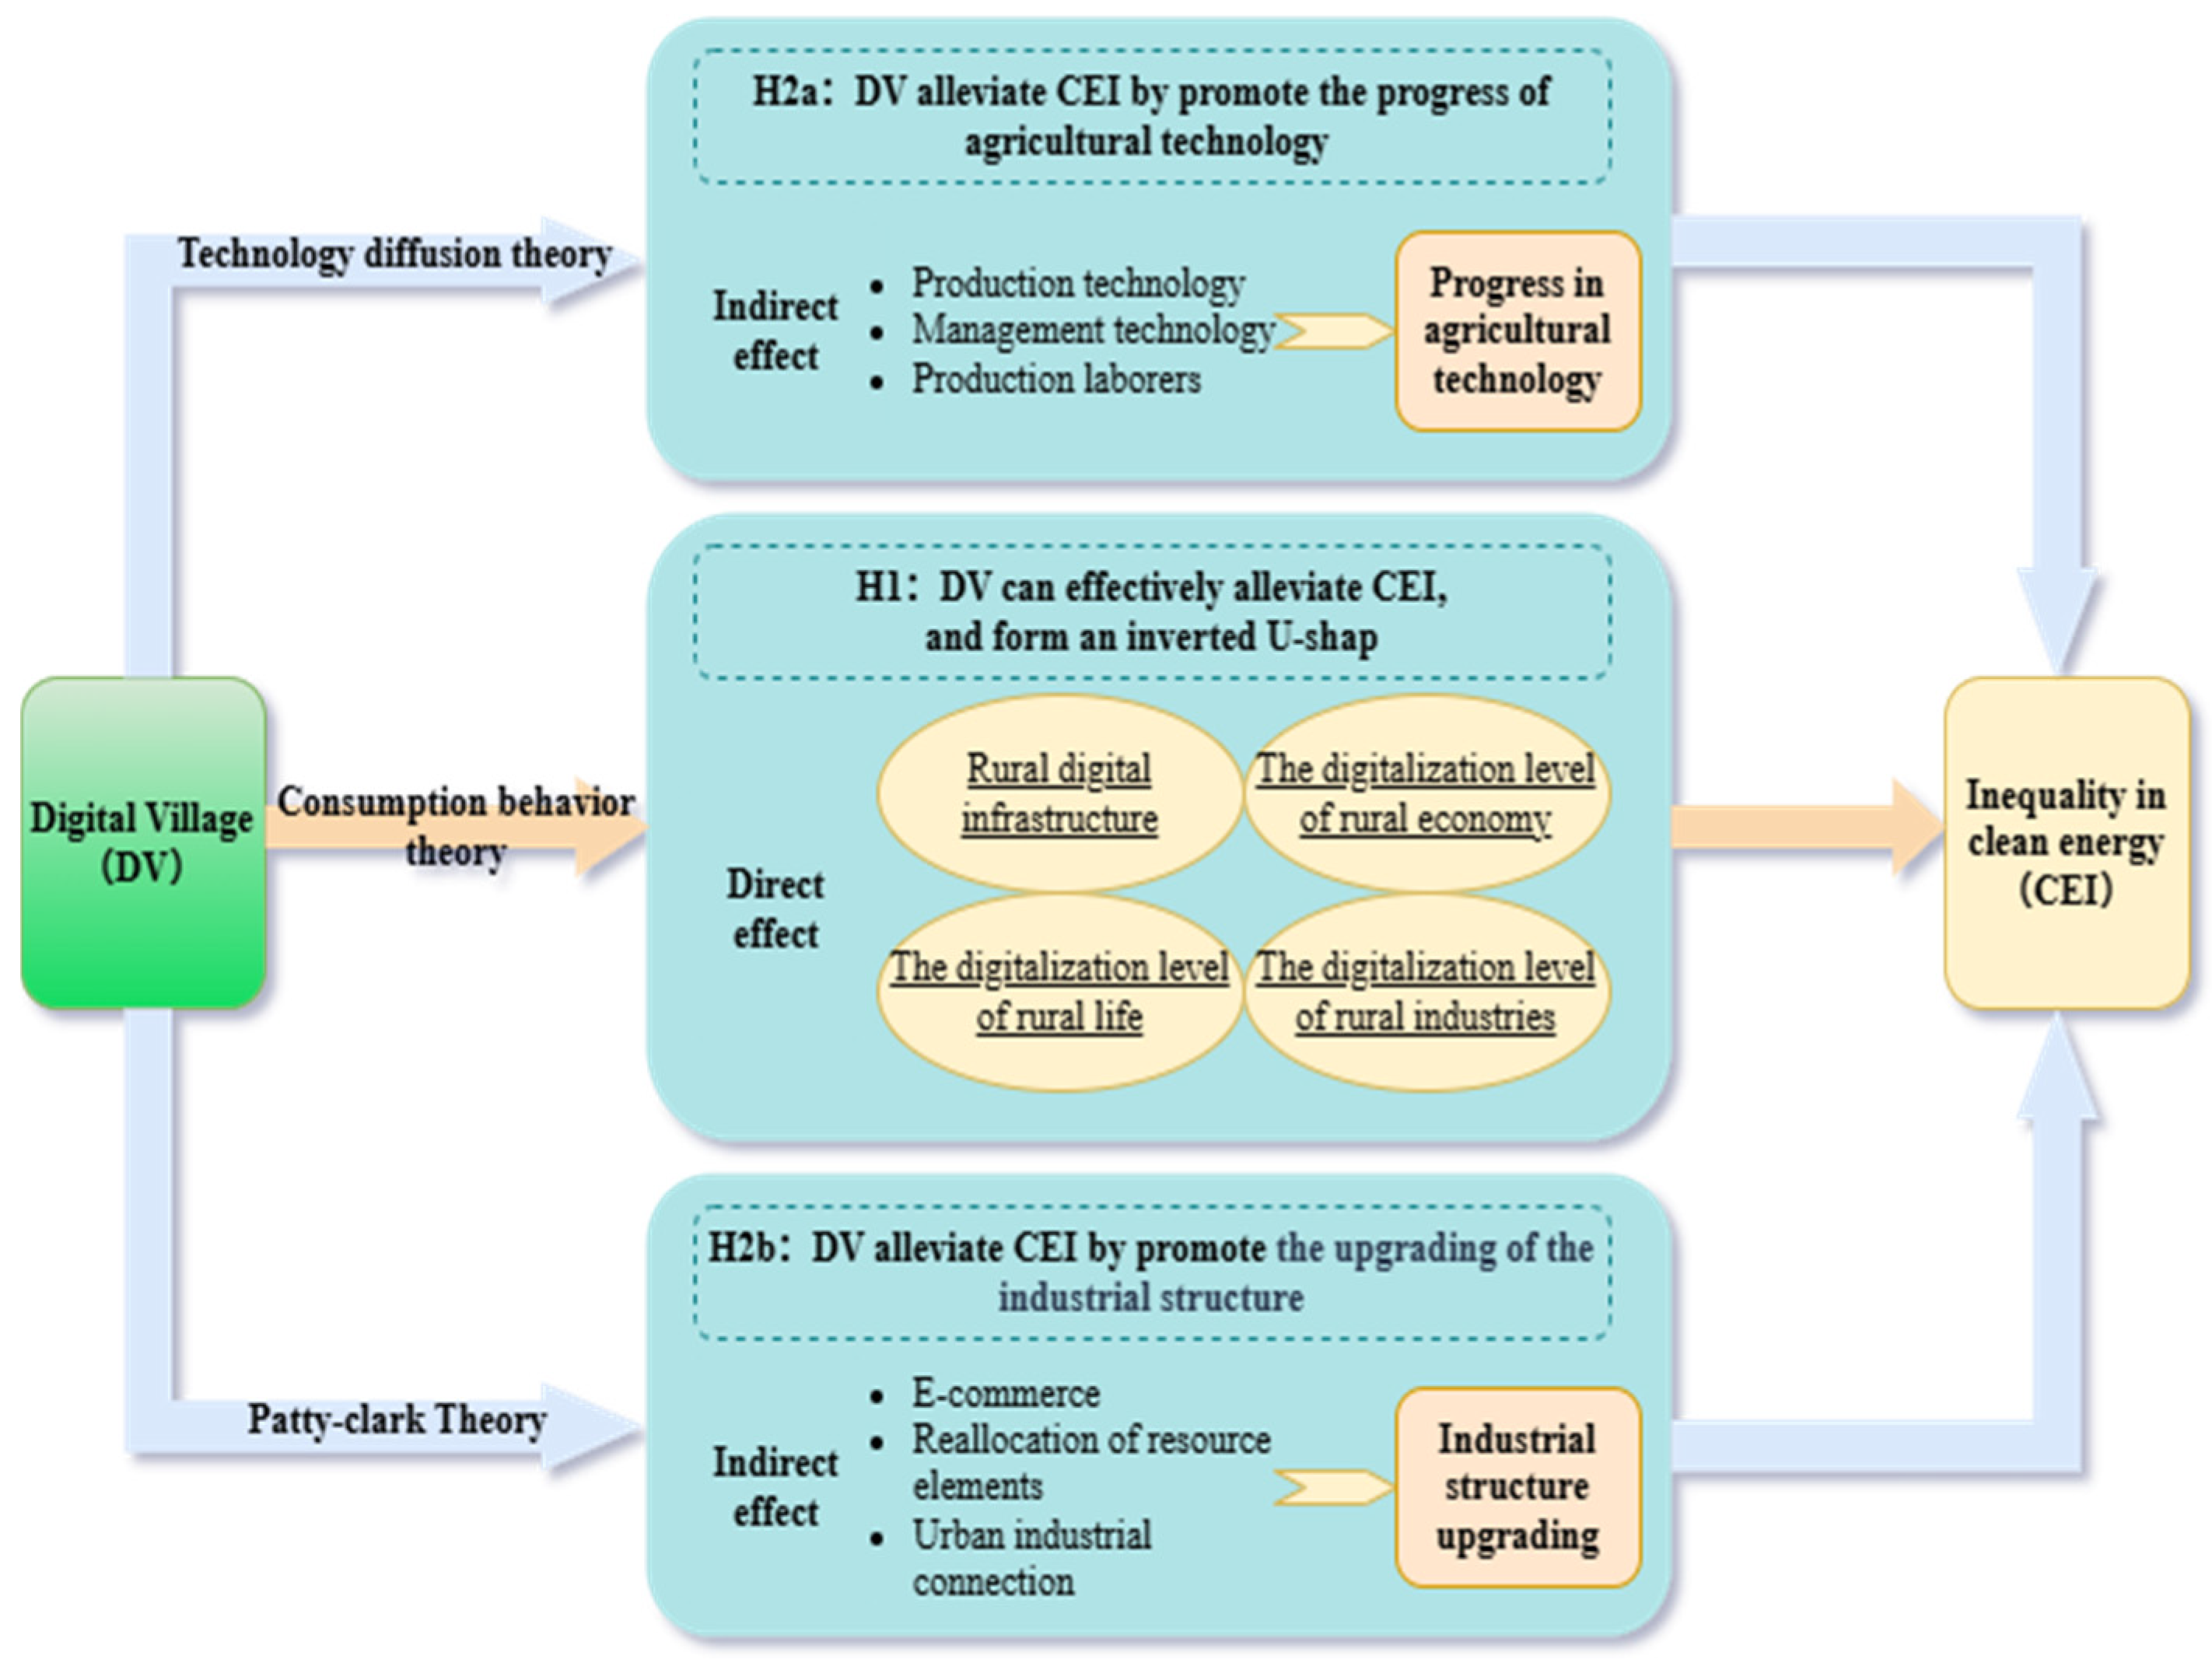
Secondly, this study explores the transmission mechanism of digital villages on clean energy fairness. Promoting sustainable development and the energy revolution has always been a research focus in the academic community. Some scholars have found that the development of DV has a particularly significant impact on the agricultural sector [28]. It promotes the digitalization of agriculture, helping farmers enhance their industrial development and technical levels. Other scholars have focused on the potential impact of information technology advancements on alleviating energy poverty; the innovation and application of digital village technology have opened up new paths for addressing issues such as unequal energy access [29,30]. However, it did not investigate how rural development gradually alleviates the inequality in clean energy consumption. This study emphasizes the mediating mechanism of agricultural technological progress (ATP) and industrial structure upgrading (IND) in the construction of DV, and the unequal relationship of clean energy between towns and rural areas.
Thirdly, considering the differences in towns’ social and economic development, geographical limitations of clean energy, resource endowments, and national policy pilots, this paper explores the effect of digital village construction in alleviating clean energy consumption inequality between towns and rural areas under different influencing factors. Empirical studies by other scholars mostly adopt cross-sectional data at the county or household level. There is a problem of limited sample range, making it difficult to reflect regional differences. By disentangling the spatial heterogeneity in how DV development influences towns–rural energy consumption inequities, this study reveals regional differences and provides suggestions for precise government decision-making.

2. Literature Review and Research Hypotheses

2.1. Literature Review

2.1.1. CEI and Its Influencing Factors

At present, the research on energy inequality between towns and rural areas [31] focuses on the differences in energy consumption, carbon emissions, electricity consumption, etc. Studies have shown that energy consumption and carbon performance in urban areas are higher than those in rural areas, leading to inequality in energy and carbon emissions between towns and rural areas and widening the carbon performance gap [32,33]. Some scholars have also studied the inequality of energy consumption between towns and rural areas through carbon footprint [34]. The carbon emission intensity of energy consumption in rural areas is relatively high due to traditional biomass energy and inefficient coal-burning methods. However, with the optimization of the rural energy structure and the promotion of clean energy, the gap in greenhouse gas footprints between towns and rural areas has been continuously narrowing [35]. Considering non-commercial energy consumption, the per capita energy consumption of rural residents is much higher than that of town residents. Nowadays, the consumption of clean energy in rural areas has increased, indicating that the CEI between towns and rural areas in China will be alleviated.
The inequality in the consumption of clean energy itself is a social and energy issue influenced by multiple factors. Domestic and foreign research mainly focuses on socio-economic factors among regions [36,37], energy utilization efficiency [38], energy supply system [39,40], and other related aspects. Studies show that the consumption inequality of clean energy is influenced by the following factors. Firstly, the inequality is caused by resource endowment. Some regions with abundant wind and solar energy resources have inherent advantages in developing clean energy, and local residents are more likely to obtain and consume clean energy [41]. Secondly, the inequality is caused by regional economic development. Developed regions have sufficient funds and technologies to invest in the research and development, production, and supply of clean energy, which can provide residents with more clean energy options [42], and at the same time accelerate the development scale and speed of the clean energy industry. Thirdly, the inequality is caused by the level of educational cognition. High-income and highly educated consumer groups often have certain purchasing power and willingness to consume clean energy equipment, such as purchasing solar water heaters, electric vehicles [43]. Fourth, the inequality is caused by local policy support. There are significant differences among different regions in terms of subsidies for clean energy consumption and investment in infrastructure. Strong policies are conducive to the production and supply of clean energy, as well as the rapid iteration of energy technologies, providing town residents with better energy products and services [44].
Overall, the CEI is influenced by multiple factors such as resource endowment, regional economic development level, educational awareness, and local policy support. While towns–rural disparities in energy consumption, carbon emissions, and electricity usage have garnered moderate research attention, a systematic exploration of CEI between towns and rural contexts remains conspicuously underdeveloped.

2.1.2. The Impact of Digital Technology Development on Clean Energy Consumption

With the wide application and implementation of digital technology, China has entered a new stage of rapid digital development, and the construction of DV has become an important force promoting rural revitalization [45,46]. According to previous studies, the construction of DV covers the construction of rural digital infrastructure [47], the digitalization of rural economy [26], the digitalization of rural industries [21], the digitalization of rural life [47], rural digital governance [45], and the digitalization of environmental monitoring. The gradual improvement of digital infrastructure, such as 5G base stations and fiber-optic networks in rural areas, has also brought about a digital transformation opportunity for energy management and usage models. On the one hand, through technical means such as smart grids and Internet of Things monitoring systems [48], the rural clean energy distribution network can achieve precise scheduling and dynamic optimization [49]. It has significantly enhanced the stability and service quality of clean energy supply, as well as the fairness and adaptability of consumption [50], and injected strong impetus into the green and low-carbon development of rural areas. On the other hand, due to the relatively high cost of digital construction in rural areas, some rural regions that are already economically poor and energy-deficient may not be able to afford the cost of transformation, thereby further exacerbating the double inequality in the supply and consumption of clean energy between towns and rural areas [51].
At present, the construction of DV has enhanced the stability and efficiency of rural energy supply through digital energy management systems. Previous studies have noted that digital technology has a certain positive impact on energy transition [52,53,54]. Digital technology has provided technical support for the development and utilization of new energy sources such as solar and wind energy, promoting the transformation of the energy structure towards clean energy [38]. Meanwhile, the development of digital technology promotes the links of energy production, transmission, and consumption, and enables real-time sharing and analysis of digital information, which is conducive to the optimization of energy allocation and the improvement of energy utilization efficiency [55]. Therefore, the widespread application of digital technology is reshaping the rural landscape at an unprecedented speed, triggering profound changes in areas such as natural ecological protection, economic structure transformation, and social relationship reconstruction [56]. However, extant research has rarely undertaken in-depth explorations of how DV development influences towns–rural CEI through towns–rural comparative analyses. Conceptually, a lack of unified conceptualization of digital village construction in the energy consumption domain has led to inconsistencies in research outcomes. Furthermore, the absence of a robust and systematic indicator framework to assess the magnitude of the impact of DV on towns–rural clean energy consumption disparities restricts the reliability and cross-study comparability of research conclusions.

2.2. Research Hypothesis

2.2.1. The Impact of DV Construction on the CEI Between Towns and Rural Areas

In the early stage of digital village construction, there is an intrinsic connection between the expansion of the required infrastructure and the surging energy demand, which may bring multiple challenges to towns and rural development. Specifically, the tight supply of clean energy, the imbalance in the distribution of production factors, and the mismatch between consumption concepts and technological applications have become increasingly prominent [57]. It is notable that with the significant upgrade of digitalization, the continuous increase in electricity consumption further intensifies the contradiction between supply and demand of clean energy, resulting in limited consumption vitality. Meanwhile, traditional energy may form a “rebound effect” [58]. According to the theory of diminishing time preference in consumption behavior theory, individuals often attach more importance to current gains than to future ones. Therefore, rural residents are more inclined to choose low-cost and easily accessible traditional energy sources, while they have a weaker perception of the long-term environmental and economic benefits of clean energy. And, the behavioral life cycle consumption theory emphasizes that consumption decisions are influenced by mental accounts and consumption inertia. In the early stage of DV construction, the power grid infrastructure in rural areas was weak, and the long-term consumption inertia of relying on traditional energy sources formed a “path dependence”, which further restricted the application of clean energy in digital infrastructure. Urban areas have inherent advantages in the rapid iteration of clean energy technology and digital technology research and promotion. This technological gap will widen with the advancement of DV construction, making rural areas lag even further behind cities in clean energy consumption and thereby exacerbating the CEI between urban and rural areas.
With the continuous development and optimization of DV in the later stage, the problem of CEI between towns and rural areas can be alleviated. Firstly, improving the digital infrastructure in rural areas is a fundamental guarantee for promoting the consumption of clean energy in rural areas. The construction of network coverage and smart grids meets the electricity demands of rural areas, facilitates access to information such as subsidy policies, enhances the awareness and acceptance of clean energy, and promotes the promotion and application [47], thereby narrowing the gap with cities in the acquisition and use of clean energy. Secondly, the digitalization of the rural economy has formed payment methods for clean energy consumption in rural areas. Rural digital e-commerce platforms and digital financial services have enabled the sales of agricultural products in rural areas to break through geographical restrictions, increase farmers’ economic income, and reduce financing costs [59], promoting the development of rural clean energy projects, thereby enhancing the supply capacity of rural clean energy and narrowing the economic gap in clean energy consumption between towns and rural areas. Thirdly, the digitalization of rural life can change the green lifestyle and clean energy consumption concept of rural residents [47]. The digital life service platform enables rural residents to have access to more environmentally friendly and efficient clean energy products, guiding them to form green and low-carbon living habits, enhancing their environmental protection awareness, especially their recognition of clean energy, reducing their reliance on traditional energy, and gradually narrowing the gap with town residents in clean energy consumption. Fourthly, the digitalization of rural industries has promoted the development of rural agriculture and prompted the transformation of the energy consumption structure of agriculture towards clean energy [60]. With the support of digitalization, precision agriculture technology has effectively enhanced agricultural production efficiency, reduced the use of fuel-powered equipment, increased the demand for clean energy, and raised the overall consumption level in rural areas through centralized supply of clean energy facilities. Therefore, DV can alleviate the CEI between towns and rural areas. However, in the early stage of construction, the rebound effect of traditional energy has exacerbated this inequality.
Based on this, Hypothesis H1 is proposed: In the initial stage of digital village construction, the CEI between towns and rural areas will be exacerbated. With the advancement of the construction process, it will gradually improve, presenting an inverted U-shaped feature.

2.2.2. The Mediating Role of Agricultural Technological Progress

The construction of DV can promote the progress of agricultural technology and its wide application. According to the theory of technology diffusion, that is, through specific dissemination channels, self-generated agricultural technological inventions or achievements are widely distributed and applied among rural areas, and along with the changes in time and space, a continuous evolution process occurs [61]. When agricultural technology achieves large-scale diffusion in rural areas, its transformation of production and lifestyle is radiative. Firstly, digital technology as a carrier can drive the further development of agricultural technology. For example, intelligent irrigation technology can precisely supply water, avoid waste, and reduce reliance on fuel-powered water pumps in traditional irrigation methods [62], thereby lowering the consumption of traditional energy in agricultural production, and switch to cleaner electric energy. This not only significantly enhances the efficiency of agricultural production but also prompts the energy consumption structure of agricultural production to gradually shift toward clean energy, thereby narrowing the gap in energy consumption in agricultural production between towns and rural areas. Secondly, with the development of digital village construction, the utilization technology of clean energy in the agricultural field has developed rapidly [63]. ATP has reduced the consumption of traditional energy and shifted to the consumption of clean energy, using technology to enhance the self-sufficiency capacity of rural energy [64]. Thirdly, the promotion speed of clean energy utilization technologies such as solar and wind energy in rural areas has accelerated. Distributed photovoltaic power generation technology not only enhances the stability of clean energy supply in rural areas but also improves self-sufficiency and consumption capacity [65,66]. Therefore, the construction of DV promotes technological progress in agriculture, thereby driving up the demand for clean energy technologies in agriculture and gradually narrowing the gap with cities in terms of clean energy consumption.
Based on this, hypothesis H2a is proposed: Agricultural technological progress plays a mediating role between the construction of DV and the CEI between towns and rural areas. The construction of DV indirectly alleviates the CEI between towns and rural areas by promoting technological progress in agriculture.

2.2.3. The Mediating Role of Industrial Structure Upgrading

The construction of DV can drive the optimization and upgrading of the industrial structure [21]. According to the Petty–Clark theorem, as the per capita national income increases, the labor force transfers from the primary industry to the secondary industry and eventually to the tertiary industry. The construction of DV promotes the digital development of rural areas and also drives the agglomeration of non-agricultural industries, which can rapidly increase the demand for clean energy. DV effectively promotes the integration of towns and rural industries, attracts town residents to “move into villages”, and drives the consumption of clean energy. Firstly, the rise of rural e-commerce will become a digital bridge between rural agricultural products and the towns’ consumer market [67,68]. Smart logistics distribution optimizes the rural logistics network, enabling agricultural products to reach town consumers [69]. The digital development of rural areas may form a closer industrial chain with cities and promote the transfer of town industries to high-value-added links. Secondly, the construction of DV enables the redistribution of rural resources, including agricultural products, labor force, and other resource elements [70]. Through digital means, it can more efficiently connect with urban industries, activate clean energy consumption scenarios, and form a close urban–rural industrial chain [24]. The demand for clean energy from the emerging industries generated by the integrated development of urban and rural areas has driven the transformation of the energy consumption structure in rural areas [67]. Thirdly, in the process of transferring agricultural products to the towns’ industrial structure, enterprises and rural residents will adopt more agricultural equipment driven by clean energy to reduce economic costs and meet the requirements of green environmental protection. Therefore, DV and towns’ industrial upgrading are not independent of each other. The construction of DV promotes the transformation of the towns and rural industrial structure from single agriculture to the integrated development of the secondary and tertiary industries, thereby driving the growth of rural demand for clean energy.
Based on this, hypothesis H2b is proposed: industrial structure upgrading plays a mediating role between the construction of DV and the CEI between towns and rural areas. The construction of DV promotes the upgrading of industrial structure and indirectly alleviates the CEI between towns and rural areas.
Finally, based on the above literature review and the two-dimensional assumptions, direct effect and mediating effect, a theoretical analysis diagram was drawn (Figure 1).

3. Research Design

3.1. Variable Selection

3.1.1. Independent Variable: Digital Villages

The core explanatory variable of this article is the level of digital village construction in each province. It combines the conceptual connotation of digital rural development as understood by relevant scholars [71,72], research on evaluation system [73,74,75], while following the principles of scientific, representativeness and data availability, an evaluation index system for the construction level of DV was constructed from four dimensions: rural digital infrastructure, the digitalization level of rural economy, the digitalization level of rural life, and the digitalization level of rural industries (Table 1). Based on the research methods of the above-mentioned scholars, this paper still uses the entropy weight-TOPSIS method to measure the development level of DV. The entropy weight-TOPSIS method is widely applied in multi-index comprehensive evaluation because it can comprehensively consider multiple indicators, transforming complex multi-index problems into simple distance calculation issues. By determining the weights of each indicator through the entropy weight method, the influence of subjective factors is reduced, making the evaluation results more objective and reasonable, which meets the research requirements for the comprehensive evaluation of the development level of DV. To minimize the loss of data and information as much as possible.

3.1.2. Dependent Variable: Inequality of Clean Energy

Due to data availability and the prevailing development reality, this paper adopts “transitional clean energy”, namely fossil fuels (natural gas, LPG) with low pollutant emissions and low carbon, as well as electricity, to measure the fairness of energy transition in towns and rural areas.
In this study, the conversion coefficient stipulated in the Chinese national standard “General rules for calculation of the comprehensive energy consumption” (GB/T 2589) [76] was adopted for standardization, achieving a consistent calculation of the clean energy consumption pattern in towns and rural areas. From the existing research, the calculation research on inequality mainly focuses on measurement indicators such as the towns–rural ratio, the Theil Index [5], and the Gini coefficient [77]. Considering the applicability and accuracy of the variables, this paper adopts the Theil Index to measure the inequality of clean energy between towns and rural areas [78], and its calculation formula is expressed as
C E I i t = C E U , i t l n C E U , i t P U , i t + E R , i t l n C E R , i t P R , i t
where C E I i t denotes the Theil Index of inequality between towns and rural clean energy consumption in year t of province i , and varies between 0 and 1; C E U and C E R denote the proportion of clean energy consumption in towns and rural areas, respectively, and P U and P R denote the proportion of the population in towns and rural areas, respectively. Higher values indicate higher CEI between towns and rural areas in the region.
To enhance the robustness of empirical estimation, this study introduces the towns–rural per capita clean energy consumption ratio (CE) as an auxiliary metric for assessing clean energy inequity. This alternative indicator offers intuitive interpretability and is calculated as follows:
C E i t = U C E i t / R C E i t
In Equation (2), C E i t represents the ratio of per capita clean energy consumption in towns and rural areas in province i in year t . U C E and R C E represent per capita clean energy consumption in towns and villages, respectively, with the unit of calculation being 10,000 tonnes of standard coal per 10,000 people.

3.1.3. Control Variable

In order to accurately analyze the impact of digital village construction on the inequality of energy consumption between towns and rural areas in China, the following control variables are selected. The level of economic development, usually measured by per capita gross domestic product (PGDP), has a close correlation with energy consumption [79]. The level of foreign direct investment (FDI) is usually measured by the proportion of FDI inflows to the gross domestic product (GDP) [80]. Research and development investment (RD) can be measured by the proportion of internal R&D expenditure to GDP [81]. The intensity of fiscal support for agriculture (FSA) is measured by the proportion of fiscal expenditure on supporting agriculture to the total fiscal expenditure [82]. The educational level gap (EDU) can be measured by the difference in the average years of education received by towns and rural residents [83].

3.1.4. Mediating Variable

Agricultural technological progress (ATP) refers to the dynamic process in which, throughout the entire process of agricultural production, through various technological innovations, improvements, and widespread applications, significant enhancements and improvements are achieved in various aspects such as the efficiency of agricultural production, the quality of products, economic benefits, and the ecological environment [84]. This paper uses the degree of agricultural cultivation mechanization to represent the progress of agricultural technology [73].
Industrial structure upgrading (IND) refers to the process of optimizing and adjusting the proportion and structure of various industries in the economic system to meet the demands of economic development and improve the quality of economic growth [85]. This paper uses the proportion of the added value of the secondary industry to that of the tertiary industry to represent the upgrading of the industrial structure [78].
The definitions and descriptions of all variables are listed in Table 2.

3.2. Econometric Model

In order to effectively test the non-linear relationship between digital village construction and towns–rural clean energy consumption inequality [86], this paper constructs an econometric model that also includes the secondary term of digital village construction (DV2):
C E I i t = α 0 + α 1 D V i t + α 2 D V 2 i t + k = 3 8 α k M i t + λ i + φ t + ε i t
where i denotes the individual series variable and t denotes the time series variable. C E I i t denotes the Theil Index of towns–rural clean energy consumption inequality in province i in year t . D V i t and D V 2 i t are the core explanatory variables, denoting the construction of DV and their quadratic terms, respectively. M i t denotes the set of control variables that may affect towns–rural clean energy consumption inequality at the provincial level. λ i is the provincial and municipal fixed effect, controlling for characteristics that do not change over time at the provincial level. φ t is the year fixed effect, controlling for characteristics that change over time at the macro level. ε i t is the random distance term.
An in-depth study was conducted to examine the impact of digital rural development on towns–rural clean energy consumption inequality through technological advances in agriculture. The objective was to elucidate the potential mechanisms through which digital village construction could impact clean energy consumption inequality by examining the mediating role of ATP. To validate this result, an empirical estimation of a mediation effect model was applied. The model is constructed as follows:
A T P i t = β 0 + β 1 D V i t + β 2 D V 2 i t + k = 3 8 β k M i t + λ i + φ t + ε i t
C E I i t = γ 0 + γ 1 D V i t + γ 2 D V 2 i t + γ 3 T A A i t + k = 4 9 γ k M i t + λ i + α t + ε i t
ATP is the mediating variable of agricultural technological progress, and β 2 is the impact coefficient of digital village construction on agricultural technological progress. γ 3 is the impact coefficient of agricultural technological progress on towns–rural clean energy consumption inequality.
In addition to the above factors, this paper examines the role of industrial structure upgrading as a mediator. The model is constructed as follows:
I N D i t = θ 0 + θ 1 D V i t + θ 2 D V 2 i t + k = 3 8 θ k M i t + λ i + φ t + ε i t
C E I i t = η 0 + η 1 D V i t + η 2 D V 2 i t + η 3 I N D i t + k = 4 9 η k M i t + λ i + α t + ε i t
where IND stands for industrial structure upgrading and θ 2 is the impact coefficient of digital village construction on industrial structure upgrading. The coefficient, η 3 is the impact of industrial structure upgrading on towns–rural energy inequality.

3.3. Data Source

This paper selects datasets from 30 provinces (including four municipalities directly under the Central Government) in China from 2011 to 2022 to explore and analyze the potential impact of digital village construction on the inequality of clean energy between towns and rural areas. It should be noted that, based on data availability, the research data do not include Tibet, Taiwan, Hong Kong, Macao, etc. Among them, except for the inclusive finance digital index, which adopts the provincial index released by the Digital Finance Research Center of Peking University, data on clean energy consumption between towns and rural areas, as well as the digital level of rural development, are mainly derived from the China energy statistical yearbook and China statistical yearbook and EPSDATA (https://www.epsnet.com.cn/index.html#/index, accessed on 22 March 2025). Data processing includes some interpolation to fill in some missing values.
In conclusion, based on the available data, the observed values, maximum values, minimum values, means (central trend), and standard deviations (discrete trend) of all the variables listed in Table 3, etc. The maximum value of DV is 0.711, the median is only 0.135, and the standard deviation is 0.098, indicating that the distribution of digital village construction levels varies greatly. The maximum value of CEI is 0.383, and the median is 0.030, indicating that the difference in clean energy consumption between towns and rural areas is relatively large.

4. Results

4.1. The Current Situation of Digital Village Construction and the Inequality of Clean Energy Between Towns and Rural Areas

Figure 2 shows the spatial distribution of digital village construction levels in various regions of China in 2011, 2014, 2018, and 2022. During the period from 2011 to 2014, the construction of rural informatization was merely a method to meet the needs of rural residents to improve their information processing capacity and transmission efficiency. Therefore, the level of digital village construction in most areas was still in a relatively low range, and the differences among regions were not significant. It was not until 2018 that rural informatization construction made a leap towards digitalization. The core mandate of digital rural development is to foster comprehensive rural revitalization, drive the restructuring of rural economic systems, and facilitate synergistic towns–rural integration. In economically advanced regions, such as Guangdong, Shandong, and Jiangsu, they have begun to stand out. The level of digital village construction has improved and entered a relatively high range (0.249–0.534), forming a certain “leading effect”. By 2022, the construction levels in many places, such as Beijing, Tianjin, Shanghai, and Sichuan, had also significantly improved, reflecting the overall accelerated trend of digital village construction across the country. There is an obvious regional imbalance in the level of digital village construction. The economic belts of the Beijing–Tianjin–Hebei region, the Yangtze River Delta, and the Guangdong–Hong Kong–Macao Greater Bay Area have demonstrated a stronger development trend at each time point. Relying on its own geographical and first-mover advantages, the eastern coastal areas have achieved in-depth integration and development of digital technologies such as big data and cloud computing, meeting the requirements of economic and technological capabilities for the construction of DV. At the same time, the two batches of national digital village pilot county and city lists are mainly concentrated in the eastern region and some central regions, which have the advantage of policy support and meet the requirements of DV for pioneering trials and demonstration leadership.
Figure 3 illustrates the spatial-temporal dynamics of towns–rural clean energy consumption inequality across Chinese provinces at discrete time points. Over time, urban-rural clean energy consumption inequality has generally trended downward. Between 2011 and 2022, the Theil Index in most regions rose initially before declining, though some saw significant fluctuations or sustained increases. Spatially, western provinces recorded the most dramatic drops in the Theil Index, as accelerated diffusion of clean energy technologies in rural areas rapidly narrowed the urban–rural gap. In contrast, the eastern and central regions showed clear polarization: urban clean energy use surged due to economic growth and technological advancement, while rural consumption lagged—hampered by energy scarcity, cost barriers, and inadequate grid infrastructure—widening the divide. Notable temporal and spatial disparities emerged in provinces like Hebei, Shanxi, and Zhejiang, shaped by structural factors such as energy endowments, industrial layouts, and policy implementation. For instance, Hebei’s urban focus on meeting heavy chemical enterprises’ clean energy demands marginalized rural areas; Shanxi’s historical reliance on coal left rural regions more resilient to environmental and energy transition pressures; and Zhejiang’s booming urban clean energy consumption outpaced rural adoption, constrained by fragmented land ownership and limited grid capacity.

4.2. Benchmark Regression

In the provincial samples, the estimated impact of digital village construction on the inequality of clean energy between towns and rural areas is shown in Table 4. Stepwise regression results validate a non-linear association between digital village development and towns–rural clean energy consumption inequality. The significantly positive coefficient of the linear term and significantly negative coefficient of the quadratic term collectively indicate an inverted U-shaped trajectory: CEI initially increases and subsequently decreases as DV initiatives advance. In the early stage of digital village construction, the development levels of clean energy in towns and rural areas showed a binary differentiation. A relatively mature clean energy application system has been established in town areas, and the penetration rate and utilization rate of clean energy have reached a relatively high level. The long-formed energy consumption pattern in rural areas has solidified the core position of traditional fossil energy, and the dependence on traditional energy is constantly increasing. This has led to environmental pollution, climate change, and population health issues [87] while seriously hindering the promotion process of clean energy in the construction of rural digital infrastructure. Additionally, there is also a considerable “digital divide” between towns and rural areas. There are significant differences in the research and development and capital investment in digital infrastructure construction [23]. The path lock-in effect of digital technology is obvious, and the resulting economic benefits vary greatly. Moreover, rural residents still have a considerable gap compared with town residents in terms of the application of clean energy technologies and digital technologies, as well as their knowledge literacy [23]. During the mid-to-late stages of DV development, the continuous upgrading of digital infrastructure, dissemination of energy-related information, enhancement of environmental awareness, policy interventions, and efficient resource allocation—coupled with expanded clean energy deployment across regions—can generate decentralized economic benefits and employment opportunities. These developments collectively foster regional economic growth and elevate consumer welfare. With the continuous improvement of digital village construction, it can not only alleviate environmental and social problems such as pollution and residents’ health, but also reduce energy prices and provide consumers with more equal opportunities for clean energy services [50]. The synergistic advancement of digital and low-carbon energy technologies has driven cost reductions, rendering clean energy consumption prices increasingly accessible to rural households. This affordability enhances clean energy acceptability among a broader spectrum of rural residents, thereby fostering sustainable economic and energy transitions. This indicates that the construction of DV can alleviate the CEI between towns and rural areas.

4.3. U-Shaped Model Test

In the context of empirical analysis, it is a common assumption that a linear relationship exists between the independent variable and the dependent variable. However, in reality, research subjects are often in complex environments, and frequently, there may be a non-linear relationship between the independent variable and the dependent variable. It is customary for researchers to incorporate square terms, and indeed higher-order ones, into the model. Therefore, the research method of Lind and Mehlum was utilized to ascertain whether there is an inverted “U-shaped” relationship between the two variables, thereby enhancing the accuracy of the results [88].
As clearly illustrated in Figure 4, the association between digital village development and towns–rural clean energy consumption inequality exhibits a complex non-linear pattern. With the progressive advancement of digital rural initiatives, CEI first follows an upward trajectory before gradually declining, forming an overall inverted U-shaped curve. Table 5 reports the empirical validation of digital village construction and the inequality of clean energy between towns and rural areas. There exists a maximum point of 0.532, while the interval value range of the digital village index is [0.059, 0.711]. Meanwhile, the p-values of the upper and lower bounds, as well as the total test, are all less than 0.05. It can be known that the extreme points are within the data range and can reject the null hypothesis at the 1% significance level. Notably, the estimated slope in this interval is negatively signed and statistically significant, providing robust empirical support for the existence of an inverted U-shaped relationship between digital rural development and CEI. These results confirm Hypothesis H1, establishing a statistically validated causal linkage.

4.4. Robustness Test Analysis

To ensure the reliability of the benchmark results, in this study, three methods were adopted for the robustness test: changing the estimation model, replacing the dependent variable, and eliminating special samples.
Robustness tests in Table 6, column 1 demonstrate that replacing the original estimation with a time-fixed effects model yields a significantly positive linear term and a significantly negative quadratic term, confirming the model’s applicability. The consistency between alternative estimation results and benchmark findings validates the robustness of the regression conclusions. Additionally, redefining the dependent variable as the towns–rural per capita clean energy consumption ratio (column 2) produces consistent results: the linear term remains positively significant, while the quadratic term is negatively significant, aligning with the baseline analysis. Due to the significant differences in politics, economy, culture, and other aspects between municipalities directly under the Central Government and ordinary provincial administrative regions in China, a regression analysis was conducted by eliminating samples from municipalities directly under the Central Government. As shown in column (3) of Table 6, the results continue to indicate that the construction of DV can effectively alleviate the inequality of clean energy between towns and rural areas in China over time.
Overall, the results of this study support the proposition that the construction of DV can effectively alleviate the inequality of clean energy between towns and rural areas in China.

4.5. Endogeneity Test

This paper adopts the lag of one period of the core explanatory variable as the instrumental variable to handle the endogeneity problem and alleviate the regression bias problem as much as possible. This paper refers to relevant studies [89], taking the one-period lag of DV and the one-period lag of the quadratic term of DV as instrumental variables, with the instrumental variables as independent variables and the inequality of clean energy as the dependent variable for regression, satisfying the instrumental variable (IV) assumptions of correlation with endogenous regressors and exogeneity to the error term. Meanwhile, the regression results from columns (1) to (3) in Table 7 demonstrate that the p value of endogenous regressors is 0.007, and the p value of Kleibergen–Paap rk LM is 0.081, which is less than 0.1, thereby rejecting the unidentifiable null hypothesis. The F value of the Cragg–Donald Wald F test was 207.843, and the F value of the Kleibergen–Paap rk Wald F test was 70.644. This finding lends further credence to the hypothesis that the risk of weak instrumental variables is relatively low. All of the aforementioned variables successfully passed the “unidentifiable” and “weak instrumental variable” tests. Collectively, these tests validate the IVs’ relevance and exogeneity. Notably, estimates for digital village development (including quadratic terms) remain consistent with benchmark regression results.

4.6. Analysis of Mediating Effect

4.6.1. The Role of Agricultural Technological Progress

The results in Table 8 (columns 1–3) investigate the mediating role of agricultural technological advancement in the relationship between digital village development and towns–rural clean energy consumption inequality. Column 1 illustrates the benchmark regression results of DV on the inequality of clean energy between towns and rural areas. Column 2 indicates that for every 1% increase in the primary item of digital village construction, the degree of ATP decreases by approximately 0.567%, and for every 1% increase in the secondary item, the degree of ATP increases by approximately 0.488%. This indicates that DVs have certain negative or positive effects on the technological progress of agriculture in China. Column 3 shows that for every 1% increase in the degree of ATP, the initial inequality of clean energy between towns and rural areas will increase by 0.405%, but it will decrease by 0.387% as the construction of DV is gradually improved. The research results emphasize the direct and indirect impacts of DV on the inequality of clean energy between towns and rural areas, highlighting the key role of ATP as a channel for DV to alleviate the inequality of clean energy between towns and rural areas in China. It is assumed that H2a is proved.

4.6.2. The Role of Industrial Structure Upgrading

The results in Table 8 (columns 1, 4, and 5) show the mediating effect of digital village construction on the inequality of clean energy in both towns and rural areas through IND. Similarly, column 1 represents the benchmark regression of digital village construction to the inequality of clean energy between towns and rural areas. The research results in column 4 show that for every 1% increase in the primary item of digital village construction, the degree of IND decreases by approximately 1.826%, while for every 1% increase in the secondary item, the degree of IND increases by approximately 1.805%. Furthermore, the results in column 5 indicate that for every 1% increase in the degree of IND, the initial inequality in clean energy between towns and rural areas will increase by 0.409%, but it will decrease by 0.382% as the construction of DV is gradually improved. This indicates that the upgrading of the industrial structure will play a significant role in reducing the inequality of clean energy between towns and rural areas in China in the future. The emerging industries that have emerged from the development of DV exhibit an inherent “light energy consumption” attribute, suggesting a non-linear correlation between the construction of DV and the enhancement of industrial structure. This correlation initially exhibits a negative relationship, subsequently transitioning to a positive one. Digital platforms have been instrumental in facilitating the free flow of factors and the integrated development of industries, thereby enhancing the optimization and IND and alleviating CEI between towns and rural areas in China. It is assumed that H2b is proven.

4.7. Heterogeneity Analysis

4.7.1. Social Development: The Difference Between High Urbanization Rate and Low Urbanization Rate

This article, referring to the “National New-Type Urbanization Plan (2014–2020)”, proposes to follow a new urbanization path with Chinese characteristics, taking the steady improvement of the urbanization level and development quality as an important goal, and requires that the urbanization rate of the permanent resident population reach about 60% by 2020. Each province with an urbanization rate higher than 60% each year is classified as high urbanization, and those with a rate lower than 60% are classified as low urbanization. As shown in the results of Table 9 (columns 1 and 2), in areas with lower urbanization rates, the construction of DV has a more significant impact on improving the CEI between towns and rural areas. Overall, in areas with lower urbanization, traditional energy infrastructure is weak. The Chinese government is committed to strengthening the development of clean energy. With the intervention of digital technology, rural areas can give priority to using clean energy for consumption, which not only meets the requirements of sustainable development but also promotes the integration of towns and rural areas, keeping pace with the development of clean energy in towns. Secondly, digital technology has solved the dual problems of policy implementation and market transactions in rural areas, opening up multiple financing channels for rural clean energy projects. In some rural areas, through the “source-grid-load-storage” microgrid integrated smart energy management and control platform, scattered energy sources such as rooftop photovoltaic and biomass power plants have been integrated into a unified system, achieving “self-generation for self-consumption and surplus power fed to the grid”.

4.7.2. Topography and Landforms: The Difference Between High Undulation and Low Undulation

To explore the impact of digital village construction in areas with different altitudes on the equity of clean energy in towns and rural areas, this paper is based on the research of relevant scholars [90]. The terrain undulation of each province was divided into high undulations and low undulations, and the results are shown in Table 9 (columns 3 and 4). In areas with high altitudes, the intensity of solar radiation is high, the air is thin, precipitation is scarce, and the duration of sunlight is long, which is conducive to the efficiency of photovoltaic development. Meanwhile, in high-altitude areas, the temperature difference between day and night is large, forming local thermal circulation (mountain valley wind), which prolongs the effective power generation time. The potential energy generated by the vertical drop of hydropower resources can be converted into electrical energy. The reason why digital village construction can better alleviate the energy inequality between towns and rural areas in regions with high undulation lies in two points. Firstly, the low-altitude areas in high-undulation regions are mostly cultivated land or residential areas. There is a problem of “spatial dispersion and temporal asynchrony” between rural energy production and towns’ energy demand in these areas. However, the blockchain energy trading system for digital village construction can achieve precise cross-regional matching between towns and rural areas, solving the problem of “temporal and spatial mismatch” in the supply and demand of clean energy between towns and rural areas. Secondly, in areas with high fluctuations, rural power grids generally suffer from the problems of “low voltage and high loss”. DVs achieve low-cost transformation through edge computing and smart meters to make up for the shortcomings of traditional infrastructure, significantly narrowing the gap in clean energy services between towns and rural areas.

4.7.3. Energy Supply: The Differences Between High Energy Transition and Low Energy Transition

To assess the impact of DVs on the inequality of clean energy between towns and rural areas and identify potential regional differences in the level of energy transition [91], this paper calculates the average energy transition index from the clean energy supply side. This index is measured by the ratio of hydropower, wind power, and solar power generation in each province to the total power generation in each year [92], and these data are all sourced from the “China Electric Power Statistical Yearbook”. Meanwhile, in this paper, the areas with an index higher than the average value are classified as high energy transition areas (high ET), and the areas with an index lower than the average value are classified as low energy transition areas (low ET). The results are shown in Table 9 (columns 5 and 6). Whether it is a high-energy transition area or a low-energy transition area, the impact of digital village construction on the inequality of clean energy between towns and rural areas is consistent with the benchmark regression results in the previous text. Therefore, it can be concluded that digital village construction can not only alleviate the CEI between towns and rural areas, but also alleviate the inequality of clean energy supply between towns and rural areas. However, the coefficients of both the primary and secondary terms of the development level of digital village construction in areas with high energy transition are higher than those in areas with low energy transition. Firstly, areas with high energy transition may have more opportunities to access clean energy. By promoting the rational allocation of resources symmetrically based on informatization and digitalization, energy costs can be reduced, and energy inequality will also decrease. Conversely, regions characterized by a limited energy transition may encounter constrained access to clean energy sources, leading to increased reliance on fossil fuels. This phenomenon can precipitate elevated energy expenditures and accentuate the disparity in clean energy access between towns and rural regions. Secondly, in the context of high-energy-transition areas, the implementation of digital technology within the power grid emerges as a pivotal consideration. The smart grid optimizes and adjusts the clean energy supply system in real time, ensuring that clean energy is delivered more efficiently to every corner of the countryside and narrowing the gap in clean energy consumption between towns and rural areas.

4.7.4. Government Policies: Differences in the Pilot Programs of Clean Energy Demonstration Provinces

This article refers to the policy document of the National Energy Administration on establishing a monitoring and evaluation system for clean energy demonstration provinces (regions), which designates five provinces, namely Zhejiang, Sichuan, Gansu, Ningxia, and Qinghai, as clean energy demonstration provinces (clean policy). Conversely, heterogeneity analysis was conducted on other provinces and cities as non-clean energy demonstration provinces [93]. The results are shown in Table 9, columns 7 and 8. The construction of DV in the clean energy demonstration province cannot alleviate the inequality of clean energy between towns and rural areas. Instead, it may intensify this inequality. There are three possible reasons for this: Firstly, the “demonstration effect” may lead to an intensification of the “Matthew effect” in the distribution of clean energy. The policy design of demonstration provinces often leans towards cities and advantageous regions, and enterprise investment often follows the principle of “efficiency first”. As a result, a large amount of labor, funds, and other inputs are concentrated in towns, while clean energy projects in remote rural areas are seriously marginalized. Secondly, there is a significant “digital divide” in the demonstration provinces, which has been transformed into a gap in clean energy services. The “dual-track system” of towns and rural energy networks is seriously differentiated. The demonstration provinces have built a new generation of smart grids in cities, while traditional distribution networks are still used in rural areas. Digital transformation lags behind, and the technical adaptability is insufficient. Thirdly, the institutional design neglects the “intrinsic demand” of rural areas, creating a “passive supply” trap. The construction of DV in demonstration provinces mostly focuses on “completing clean energy consumption targets” and “reducing towns carbon emissions”, ignoring the real demands of rural residents for energy security and energy use costs. Meanwhile, the construction of digital platforms is led by the government and enterprises. Rural collectives and farmers lack channels to participate in decision-making. Therefore, the construction of DV in demonstration provinces (autonomous regions) does not necessarily alleviate the inequality of clean energy between towns and rural areas.

5. Conclusions and Policy Recommendations

5.1. Conclusions

The study focuses on the influence of digital village construction on the CEI between towns and rural areas. Through an in-depth analysis of DV data to evaluate CEI in China from 2011 to 2022 using methods such as the bidirectional fixed model, this paper also undertakes an investigation into a robustness check to ensure the reliability of the benchmark results obtained.
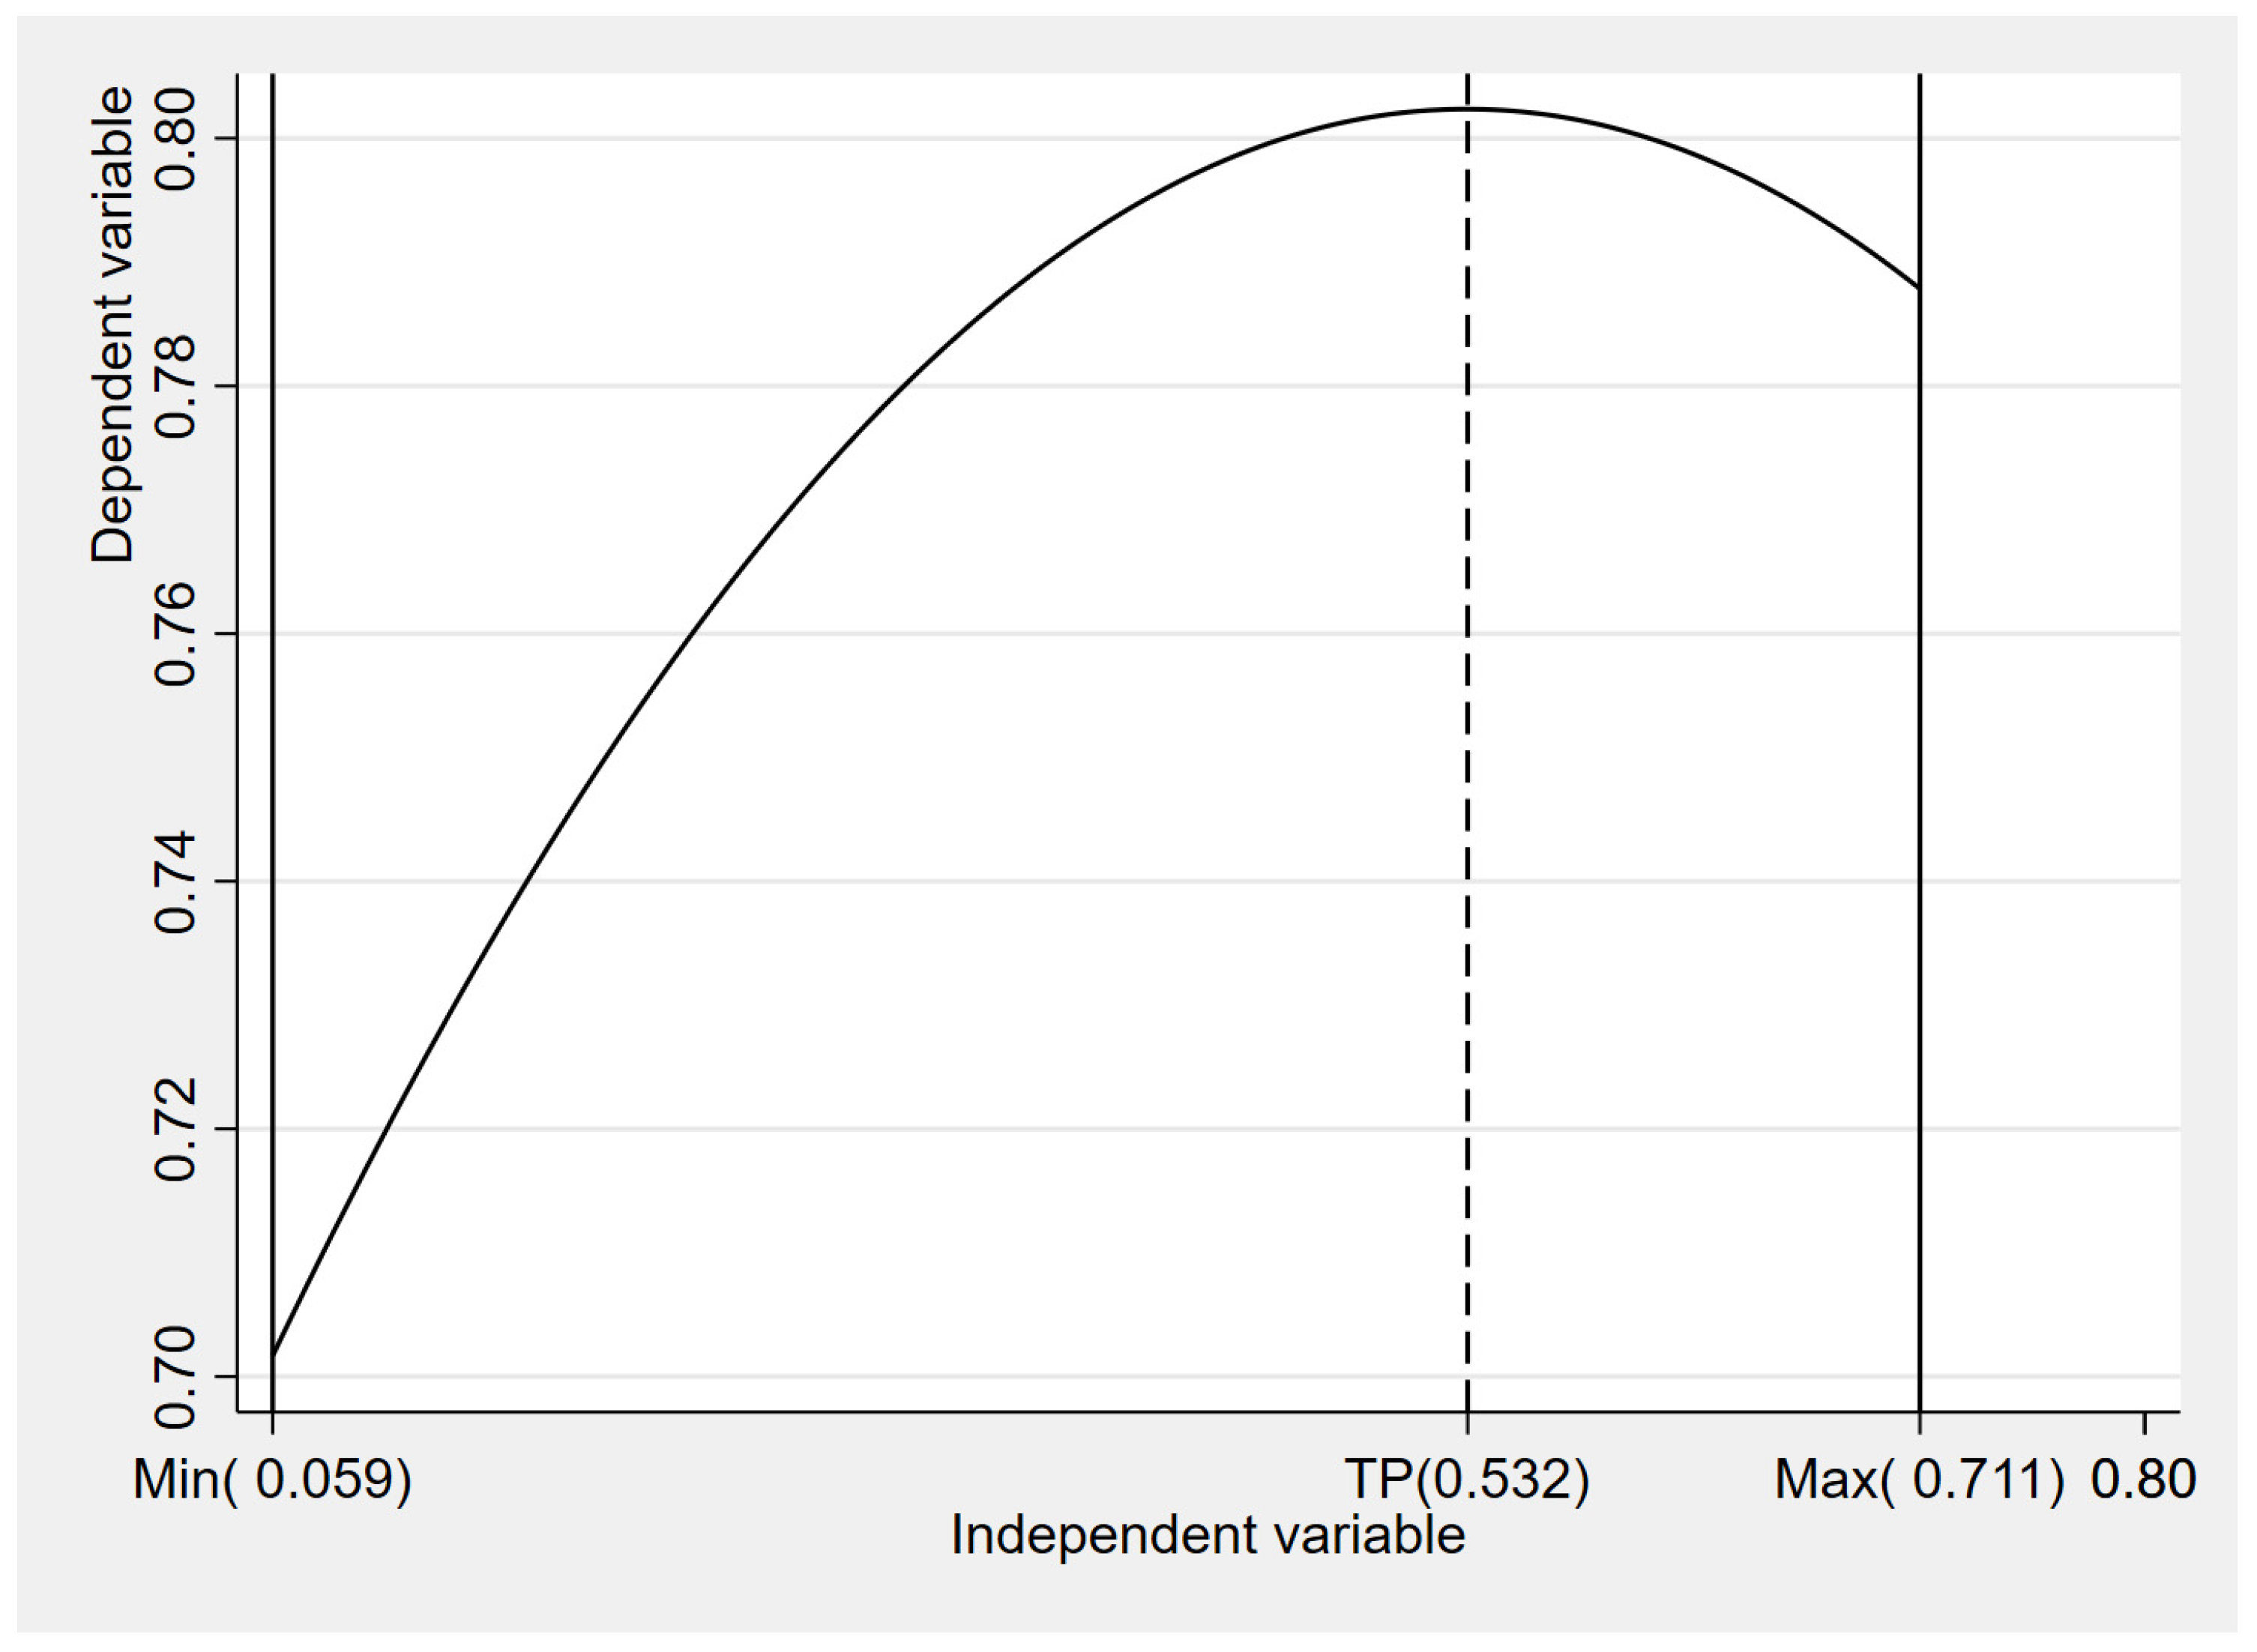
The research results of this paper demonstrate that: Firstly, A statistically significant inverted U-shaped relationship exists between DV development and towns–rural CEI. During the early construction phases, DV initiatives may inadvertently exacerbate clean energy consumption disparities as town areas rapidly adopt advanced technologies while rural regions face infrastructure and adoption lags. However, upon reaching a certain stage of construction, it is anticipated that the project will assume a pivotal role in addressing the disparity in clean energy consumption between towns and rural regions. Secondly, it is evident that ATP and IND play a pivotal mediating role in the relationship between the construction of DV and the CEI between towns and rural areas. The establishment of DV has been demonstrated to encourage technological advancement within the agricultural sector, facilitate the transition of agricultural production to clean energy sources, and enhance the self-sufficiency capacity of rural energy systems. Concurrently, it will drive the upgrading of the industrial structure, optimize the energy consumption structure in rural areas, and increase the demand for clean energy. Thirdly, under differing social and economic development conditions, topography and landforms, degrees of energy transition, and government policies, the impact of digital village construction on the CEI between towns and rural areas varies. In regions exhibiting a lower level of urbanization, elevated terrain undulation, non-clean energy demonstration provinces, and varying degrees of the energy transition, the effect of digital village construction in alleviating the CEI between towns and rural areas is more significant.

5.2. Policy Recommendations

Based on the above research conclusions, we propose the following policy suggestions.
Firstly, efforts must be made to ensure the equitable advancement of digital technologies within the domain of rural construction. On the one hand, the government should increase investment in the construction of digital infrastructure in the central and western regions, areas with lower urbanization levels, and rural areas. It should support the construction of 5G base stations, fiber-optic networks, smart grids, and other infrastructure in rural areas, enhance the application capacity of digital technology in rural areas, and narrow the gap in digital village construction among regions. Conversely, the promotion of social capital participation in the construction of DV, the application of digital technology in agricultural production and other fields, the enhancement of agricultural production efficiency and farmers’ income levels, the ensuring of the benefits of digital village construction to all rural residents more widely and evenly, and the promotion of the fairness of clean energy consumption in towns and rural areas are recommended.
Secondly, the coordinated development of ATP and IND should be promoted. It is imperative to encourage digital technology to drive ATP. Furthermore, there is a need to develop and promote green and energy-saving agricultural technologies and equipment suitable for rural areas. In addition, the provision of purchase subsidies and technical guidance for intelligent irrigation systems, solar agricultural equipment, etc., is essential, as is the improvement of the efficiency of clean energy utilization in agricultural production. Conversely, efforts must be made to guide the optimization and upgrading of the rural industrial structure, cultivate and develop the third emerging industries such as digital agriculture, rural e-commerce, and digital rural cultural tourism, promote the development of rural industries towards low energy consumption and high added value, further boost the growth of clean energy consumption in rural areas, and alleviate the CEI between towns and rural areas.
Thirdly, the policy design for clean energy demonstration provinces should be optimized. In the case of provinces that have been designated for the demonstration of clean energy, it is imperative that the policy orientation is adapted, placing particular emphasis on the coordinated development of both towns and rural regions. It is imperative to give full consideration to the actual needs and development characteristics of rural areas in order to circumvent the so-called “Matthew effect”. Conversely, there is a necessity to pursue the augmentation of investment and the endorsement of rural clean energy initiatives. Furthermore, the promotion of the digital transformation of rural energy networks is imperative, as is the narrowing of the so-called “digital divide” between towns and rural regions. It is imperative to ensure that the construction of DV in the demonstration province can effectively alleviate CEI between towns and rural areas.
Fourthly, efforts must be made to consolidate the construction of the clean energy supply system. In the context of diverse energy transition regions, the formulation of distinct clean energy development strategies is imperative, with these strategies being informed by local resource endowments and energy supply characteristics. In contrast, regions characterized by a high energy transition should focus on the optimization of smart grids, with the objective of enhancing the efficiency of clean energy transmission and distribution. Conversely, regions experiencing a low energy transition should prioritize augmenting support for the development and utilization of clean energy sources, while concomitantly reducing their reliance on fossil fuels.
Fifth, enhance rural residents’ attention to and implementation of clean energy tools in reality. Carry out publicity and education through digital technology to show rural residents the usage methods, advantages, and environmental benefits of clean energy. Build a digital energy service system, monitor the usage of clean energy, and provide optimization guidelines for gas and electricity usage. Organize digital skills training to enhance the ability of rural residents to operate energy equipment and utilize service platforms. In combination with the digital industry, promote the application of clean energy, encourage rural digital industries to give priority to the use of clean energy, and play a leading and exemplary role.

6. Limitations

This study has the following limitations. Firstly, there is a lack of a unified standard for measuring the equality of clean energy consumption. Previous studies have adopted different methods to measure energy equality from various dimensions. However, due to the scarcity of research on the equality of clean energy and the limitation of data availability, this study may have deficiencies in the measurement of the equality of clean energy consumption. Future research should consider including more data or using multiple methods for measurement. Secondly, this study takes the provincial regions of China as samples. In the governance structure of digital rural areas, cities or county-level units are the basic units for policy implementation. Future research should consider using more advanced methods to collect more microscopic data to explore this issue. Thirdly, due to methodological limitations, this paper only measured the equality of clean energy consumption. In the future, it can be considered to further explore the consequences of the impact of digital rural construction on the equality of clean energy between urban and rural areas from different perspectives, such as opportunity equality, outcome equality, and efficiency equality.

Author Contributions

Conceptualization, X.W.; methodology, X.W.; software, J.W.; validation, X.W. and J.W.; formal analysis, J.W.; investigation, J.W.; resources, X.W.; data curation, J.W. and Z.Y.; writing—original draft preparation, J.W. and Z.Y.; writing—review and editing, X.W.; visualization, J.W.; supervision, X.W.; project administration, X.W.; funding acquisition, X.W. All authors have read and agreed to the published version of the manuscript.

Funding

This research was funded by the National Social Science Foundation of China (24XJY024).

Institutional Review Board Statement

Not applicable.

Informed Consent Statement

Not applicable.

Data Availability Statement

The raw data supporting the conclusions of this article will be made available by the authors on request.

Conflicts of Interest

Author Zhibo Yu was employed by the company Southwest Oil and Gas Field Company, Natural Gas Economic Research Institute. The remaining authors declare that the research was conducted in the absence of any commercial or financial relationships that could be construed as a potential conflict of interest.

References

  1. Al-Shetwi, A.Q. Sustainable development of renewable energy integrated power sector: Trends, environmental impacts, and recent challenges. Sci. Total Environ. 2022, 822, 153645. [Google Scholar] [CrossRef]
  2. Vanegas Cantarero, M.M. Of renewable energy, energy democracy, and sustainable development: A roadmap to accelerate the energy transition in developing countries. Energy Res. Soc. Sci. 2020, 70, 101716. [Google Scholar] [CrossRef]
  3. Chen, H.; Li, Z.; Cui, X.; Zhao, M.; Shi, Y.; Lin, H.; Zhu, T. Analysis of sustainable spatial structure of cities under the framework of “Economy-Society-Environment”: A case study Beijing-Tianjin-Hebei urban agglomeration. Ecol. Indic. 2025, 173, 113416. [Google Scholar] [CrossRef]
  4. Teschner, N.; Sinea, A.; Vornicu, A.; Abu-Hamed, T.; Negev, M. Extreme energy poverty in the urban peripheries of Romania and Israel: Policy, planning and infrastructure. Energy Res. Soc. Sci. 2020, 66, 101502. [Google Scholar] [CrossRef]
  5. Jianchao, H.; Minghua, W.; Malin, S. Carbon emission inequality and fairness from energy consumption by prefecture-level cities in China. Ecol. Indic. 2024, 158, 111364. [Google Scholar] [CrossRef]
  6. Sovacool, B.K. How long will it take? Conceptualizing the temporal dynamics of energy transitions. Energy Res. Soc. Sci. 2016, 13, 202–215. [Google Scholar] [CrossRef]
  7. Śmiech, S.; Karpinska, L.; Bouzarovski, S. Impact of energy transitions on energy poverty in the European Union. Renew. Sustain. Energy Rev. 2025, 211, 115311. [Google Scholar] [CrossRef]
  8. Choi, J.; Eom, D.; Park, B.; Song, J.; Kook, M.; Park, S. Clean energy supply and demand strategies of Jeju Island to achieve carbon net-zero by using digital twin technology. Energy 2025, 314, 134178. [Google Scholar] [CrossRef]
  9. Søraa, R.A.; Vik, J. Boundaryless boundary-objects: Digital fencing of the CyborGoat in rural Norway. J. Rural Stud. 2021, 87, 23–31. [Google Scholar] [CrossRef]
  10. Bansiya, M. Analyzing the Progress and Disparities in Access to Clean Energy Technologies: A Comparative Study of Rural and Urban Areas of India. Int. J. Multidiscip. Res. Rev. 2023, 5, 1–14. [Google Scholar]
  11. Javed, M.S.; Nisar, U.; Warsi, S.H.; Billah, M.M.; Karkkulainen, E.A. Mapping the Disparities Between Urban and Rural Areas in the Global Attainment of Sustainable Development Goals, Economic and Social Aspects of Global Rural-Urban Migration. Educ. Adm. Theory Pract. 2024, 30, 2052–2064. [Google Scholar]
  12. He, W.; Sun, J.; An, M.; Ramsey, T.S. Spatial-temporal evolution characteristics and driving factors analysis of regional energy supply and demand in China. Energy Strategy Rev. 2024, 55, 101542. [Google Scholar] [CrossRef]
  13. Tan, X.; Lin, S.; Liu, Y.-L.; Xie, B.-C. Has the inter-regional transmission grid promoted clean power development? A quantitative assessment on China’s electricity sector. J. Clean. Prod. 2020, 269, 122370. [Google Scholar] [CrossRef]
  14. Zhong, H.; Zhang, X.; Shao, X.; Xiao, J.; Tian, P. Dissecting household carbon and energy inequality: A decade’s insight into regional disparities and urban-rural dynamics in China. Energy Policy 2024, 192, 114243. [Google Scholar] [CrossRef]
  15. Alola, A.A. Global urbanization and ruralization lessons of clean energy access gap. Energy Policy 2024, 188, 114101. [Google Scholar] [CrossRef]
  16. Wan, G.; Zhang, J.; Zeng, T.; Zhang, X. Multidimensional energy poverty and its urban-rural and regional disparities: Evidence from China. J. Clean. Prod. 2024, 466, 142874. [Google Scholar] [CrossRef]
  17. Zhang, D.; Li, J.; Han, P. A multidimensional measure of energy poverty in China and its impacts on health: An empirical study based on the China family panel studies. Energy Policy 2019, 131, 72–81. [Google Scholar] [CrossRef]
  18. Li, Y.; Qiao, L.; Liu, M.; Yang, Y.; Yu, F.; Yuan, X.; Wang, Q.; Ma, Q.; Zuo, J. Access to affordable and clean domestic heating: A critical review on rural clean heating transformation in China’s Jing-Jin-Ji and its surrounding areas. Energy Build. 2024, 323, 114829. [Google Scholar] [CrossRef]
  19. Liu, G.; Du, S.; Gao, Y.; Xiong, X.; Lombardi, G.V.; Meng, F.; Chen, Y.; Chen, C. A study on energy-water-food-carbon nexus in typical Chinese northern rural households. Energy Policy 2024, 188, 114100. [Google Scholar] [CrossRef]
  20. Gong, Q.; Zhang, R. Digital finance as a catalyst for energy transition and sustainable rural economic growth. Financ. Res. Lett. 2025, 71, 106405. [Google Scholar] [CrossRef]
  21. Wang, S.; Peng, T.; Du, A.M.; Lin, X. The impact of the digital economy on rural industrial revitalization. Res. Int. Bus. Financ. 2025, 76, 102878. [Google Scholar] [CrossRef]
  22. Hu, J.; Xie, W.; Liu, M. How does digital village alleviate rural household energy poverty? Energy 2025, 318, 134713. [Google Scholar] [CrossRef]
  23. Fu, H.; Guan, J.; Wang, R.; Kong, L.; Dai, Q. How does digitalization affect the urban-rural disparity at different disparity levels: A Bayesian Quantile Regression approach. Technol. Soc. 2024, 78, 102633. [Google Scholar] [CrossRef]
  24. Zhou, M.; Guo, F.; Sun, Y.; Ren, J.; Zhang, X. Promotion or inhibition? Exploring the influence of the digital economy on urban-rural integration: A case study of yellow River basin. Sustain. Futures 2024, 8, 100293. [Google Scholar] [CrossRef]
  25. Wang, Y.; Peng, Q.; Jin, C.; Ren, J.; Fu, Y.; Yue, X. Whether the digital economy will successfully encourage the integration of urban and rural development: A case study in China. Chin. J. Popul. Resour. Environ. 2023, 21, 13–25. [Google Scholar] [CrossRef]
  26. Wang, H.; Yan, T.; Huang, R.; Gao, J. Alleviating the rural household energy poverty in China: The role of digital economy. Energy Econ. 2025, 142, 108160. [Google Scholar] [CrossRef]
  27. Wang, Y.; Wang, Z.; Shuai, J.; Shuai, C. Can digitalization alleviate multidimensional energy poverty in rural China? Designing a policy framework for achieving the sustainable development goals. Sustain. Prod. Consum. 2023, 39, 466–479. [Google Scholar] [CrossRef]
  28. Balkrishna, A.; Pathak, R.; Kumar, S.; Arya, V.; Singh, S.K. A comprehensive analysis of the advances in Indian Digital Agricultural architecture. Smart Agric. Technol. 2023, 5, 100318. [Google Scholar] [CrossRef]
  29. Yan, H.; Yi, X.; Jiang, J.; Bai, C. Can information technology construction alleviate household energy poverty? Empirical evidence from the “broadband China” Pilot Policy. Energy Policy 2024, 185, 113966. [Google Scholar] [CrossRef]
  30. Zhong, S.; Zhang, L.; Zheng, B.; Arif, A.; Usman, A. Smart governance and smart urbanization: Digital solutions to alleviate energy poverty in major energy consuming economies. Energy Strategy Rev. 2025, 58, 101659. [Google Scholar] [CrossRef]
  31. Dou, Y.; Zhao, J.; Dong, X.; Dong, K. Quantifying the impacts of energy inequality on carbon emissions in China: A household-level analysis. Energy Econ. 2021, 102, 105502. [Google Scholar] [CrossRef]
  32. Li, N.; Yuan, R.; Zheng, S. Impacts of targeted poverty alleviation on urban-rural residential energy consumption inequality: Evidence from 178 Chinese prefecture-level cities. Urban Clim. 2023, 50, 101583. [Google Scholar] [CrossRef]
  33. Xu, C. Towards balanced low-carbon development: Driver and complex network of urban-rural energy-carbon performance gap in China. Appl. Energy 2023, 333, 120663. [Google Scholar] [CrossRef]
  34. Liu, G.; Zhang, F. China’s carbon inequality of households: Perspectives of the aging society and urban-rural gaps. Resour. Conserv. Recycl. 2022, 185, 106449. [Google Scholar] [CrossRef]
  35. Liu, G.; Yang, Y.; Zhang, F. Reduced urban-rural inequality in household greenhouse gas footprints and rising trade-related inequalities in China. Cities 2025, 163, 106009. [Google Scholar] [CrossRef]
  36. Mamidi, V.; Marisetty, V.B.; Thomas, E.N. Clean energy transition and intertemporal socio-economic development: Evidence from an emerging market. Energy Econ. 2021, 101, 105392. [Google Scholar] [CrossRef]
  37. Majumdar, D.; Koley, M.; Chatterjee, P. Socio-economic factors and clean cooking fuel consumption in India: A household level study. Energy Sustain. Dev. 2023, 76, 101298. [Google Scholar] [CrossRef]
  38. Hao, X.; Li, Y.; Wu, H. Ways to improve the efficiency of clean energy utilization: Does digitalization matter? Energy Strategy Rev. 2023, 50, 101257. [Google Scholar] [CrossRef]
  39. Tian, Y.; Ou, L.; Guo, J.; Chen, Z.-S.; Chen, Z. A configuration of green and low-carbon strategy in clean energy economy: A perspective of supply chain management. Energy 2025, 322, 135642. [Google Scholar] [CrossRef]
  40. Zhang, Y.; Gong, J.; Liu, X. Assessing the effects of digitalization on the amenity of clean energy supply chains: Policy insights from OECD countries. Energy Econ. 2025, 143, 108273. [Google Scholar] [CrossRef]
  41. Su, X.; Tan, J. Regional energy transition path and the role of government support and resource endowment in China. Renew. Sustain. Energy Rev. 2023, 174, 113150. [Google Scholar] [CrossRef]
  42. Otim, J.; Watundu, S.; Mutenyo, J.; Bagire, V. Determinants of carbon dioxide emissions: Role of renewable energy consumption, economic growth, urbanization and governance. SN Bus. Econ. 2025, 5, 23. [Google Scholar] [CrossRef]
  43. Hu, X.; Nie, Z.; Ou, Y.; Qian, Z.; McMillin, S.E.; Aaron, H.E.; Zhou, Y.; Dong, G.; Dong, H. Air quality improvement and cognitive function benefit: Insight from clean air action in China. Environ. Res. 2022, 214, 114200. [Google Scholar] [CrossRef] [PubMed]
  44. Shahzad, K.; Raza, H.A.; Shahbaz, M. Environmental regulations’ impact on clean energy consumption: Under the assistance of governance measures. Renew. Energy 2024, 237, 121766. [Google Scholar] [CrossRef]
  45. He, Z.; Chen, M.; Gu, D. How digital village construction affects to the effectiveness of rural governance?—Research on the NCA and QCA methods. Cities 2025, 156, 105514. [Google Scholar] [CrossRef]
  46. Liu, J.; Li, F. Rural revitalization driven by digital infrastructure: Mechanisms and empirical verification. J. Digit. Econ. 2024, 3, 103–116. [Google Scholar] [CrossRef]
  47. Bai, C.; Guan, W.; Wang, D.; Chen, X. Digital village construction and the quality of life of rural residents. Int. Rev. Econ. Financ. 2024, 96, 103729. [Google Scholar] [CrossRef]
  48. Shi, Z.; Loh, L.; Wu, H.; Han, D. Smarter and cleaner: How does energy digitalization affect carbon productivity? Energy Strategy Rev. 2024, 52, 101347. [Google Scholar] [CrossRef]
  49. Qin, J.; Li, W.; Zhang, J. How can energy poverty affect farmers’ health? Evidence from mountainous areas in China. Energy 2024, 290, 130074. [Google Scholar] [CrossRef]
  50. Zhang, S.; Sang, X.; Yang, W.; Luo, X. Empowering household energy transition: The impact of digital economy on clean energy use in rural China. Energy 2025, 324, 136016. [Google Scholar] [CrossRef]
  51. Ravigné, E.; Ghersi, F.; Nadaud, F. Is a fair energy transition possible? Evidence from the French low-carbon strategy. Ecol. Econ. 2022, 196, 107397. [Google Scholar] [CrossRef]
  52. Kong, J.; Dong, Y.; Zhang, Z.; Yap, P.-S.; Zhou, Y. Advances in smart cities with system integration and energy digitalization technologies: A state-of-the-art review. Sustain. Energy Technol. Assess. 2024, 72, 104012. [Google Scholar] [CrossRef]
  53. Nie, S.; Cao, X.; Li, Z.; Liu, M.; Zhang, Y. Supply chain digitization in the net-zero era: The impact of digital technology, renewable energy, and infrastructure. Energy Econ. 2025, 144, 108403. [Google Scholar] [CrossRef]
  54. Xiao, Y.; Duan, Y.; Zhou, H.; Han, X. Has digital technology innovation improved urban total factor energy efficiency?—Evidence from 282 prefecture-level cities in China. J. Environ. Manag. 2025, 378, 124784. [Google Scholar] [CrossRef] [PubMed]
  55. Yuan, S.; Pan, X. Inherent mechanism of digital technology application empowered corporate green innovation: Based on resource allocation perspective. J. Environ. Manag. 2023, 345, 118841. [Google Scholar] [CrossRef] [PubMed]
  56. Haefner, L.; Sternberg, R. Spatial implications of digitization: State of the field and research agenda. Geogr. Compass 2020, 14, e12544. [Google Scholar] [CrossRef]
  57. Sun, B.; Zhang, Y.; Zhu, K.; Mao, H.; Liang, T. Is faster really better? The impact of digital transformation speed on firm financial distress: Based on the cost-benefit perspective. J. Bus. Res. 2024, 179, 114703. [Google Scholar] [CrossRef]
  58. Peng, H.-R.; Zhang, Y.-J.; Liu, J.-Y. The energy rebound effect of digital development: Evidence from 285 cities in China. Energy 2023, 270, 126837. [Google Scholar] [CrossRef]
  59. Wei, F.; Xie, B.; Chen, M. Digital financial inclusion, e-commerce development and entrepreneurial activity. Int. Rev. Financ. Anal. 2025, 97, 103806. [Google Scholar] [CrossRef]
  60. Yang, X.; Long, J.; Lin, H.; Cai, Z.; Jiang, P. Enhancing efficiency or optimizing industrial structure? A comprehensive assessment of China’s energy consumption rights trading system. Energy Sustain. Dev. 2024, 78, 101380. [Google Scholar] [CrossRef]
  61. Liu, H.; Li, X. How digital technology can improve new quality productive forces? Perspective of total factor agricultural carbon productivity. J. Asian Econ. 2025, 98, 101921. [Google Scholar] [CrossRef]
  62. Goel, R.K.; Yadav, C.S.; Vishnoi, S.; Rastogi, R. Smart agriculture—Urgent need of the day in developing countries. Sustain. Comput. Inform. Syst. 2021, 30, 100512. [Google Scholar] [CrossRef]
  63. Zhu, L.; Sheng, Y.; Liao, H.; Blaschke, M.J. Enhancing clean cooking energy transition through living facility improvements: Experience from China. Energy Econ. 2025, 144, 108331. [Google Scholar] [CrossRef]
  64. Chen, Y.; Li, Y.; Li, C. Electronic agriculture, blockchain and digital agricultural democratization: Origin, theory and application. J. Clean. Prod. 2020, 268, 122071. [Google Scholar] [CrossRef]
  65. Hariyani, D.; Hariyani, P.; Mishra, S. Digital technologies for the Sustainable Development Goals. Green Technol. Sustain. 2025, 3, 100202. [Google Scholar] [CrossRef]
  66. Wang, T.; Wu, G.; Chen, J.; Cui, P.; Chen, Z.; Yan, Y.; Zhang, Y.; Li, M.; Niu, D.; Li, B.; et al. Integration of solar technology to modern greenhouse in China: Current status, challenges and prospect. Renew. Sustain. Energy Rev. 2017, 70, 1178–1188. [Google Scholar] [CrossRef]
  67. Wang, Y.; Li, L. Digital economy, industrial structure upgrading, and residents’ consumption: Empirical evidence from prefecture-level cities in China. Int. Rev. Econ. Financ. 2024, 92, 1045–1058. [Google Scholar] [CrossRef]
  68. Chen, W.; Li, J. Digital finance, rural E-commerce development and consumption upgrading. Int. Rev. Financ. Anal. 2025, 104, 104351. [Google Scholar] [CrossRef]
  69. Bian, Z.; Zhang, Y. Sustainable development in the era of digital trade: A perspective of industrial structure optimization. Sustain. Futures 2025, 9, 100539. [Google Scholar] [CrossRef]
  70. Sun, Y.; Chen, C. Digital rural construction, financial development and regional economic resilience: Mechanism analysis and empirical test. Int. Rev. Econ. Financ. 2025, 101, 104146. [Google Scholar] [CrossRef]
  71. Song, B.-S.; Ma, G.-Z.; Ling, Z.-W.; Liu, R.-F. The ought-to-be logic, practical dilemma and path optimization of digital village empowering the construction of a strong agricultural country. Sci. Manag. Res. 2025, 43, 110–120. [Google Scholar] [CrossRef]
  72. Li, Y.; Ruan, L. The measurement, dynamic evolution and driving factors of digital rural development in China. Stat. Inf. Forum 2025, 40, 106–118. [Google Scholar] [CrossRef]
  73. Yang, X.; Wang, Y.; Wang, J. The effect and mechanism of digital rural development on agricultural carbon emission intensity. Stat. Decis. 2023, 39, 66–71. [Google Scholar] [CrossRef]
  74. Xu, C.; Qian, C.; Sun, F. Can digital rural construction narrow the urban-rural income gap An empirical test based on the intermediary and threshold effects of agricultural science and technology progress. J. Agric. Econ. 2024, 4–24. [Google Scholar] [CrossRef]
  75. Wen, F. Digital rural construction promotes the high-quality development of rural economy: Obstacles and practical paths. J. Shenzhen Univ. (Humanit. Soc. Sci.) 2025, 42, 5–16. [Google Scholar]
  76. GB/T 2589-2020; General Rules for Calculation of the Comprehensive Energy Consumption. National Standarlization Administration: Beijing, China, 2020.
  77. Qin, M.; Duan, K.; Ma, Z.; Li, Z.; Ju, X.; Sun, H. What makes the provincial inequality of natural gas consumption in China? Evidence from Gini-coefficient approach. Energy Convers. Manag. X 2024, 22, 100601. [Google Scholar] [CrossRef]
  78. Sun, C.; Sun, S.; Yue, X. Does the transition to low-carbon energy alleviate urban-rural energy inequality? The case of China. Heliyon 2024, 10, e31355. [Google Scholar] [CrossRef]
  79. Zhang, L.; Pang, J.; Chen, X.; Lu, Z. Carbon emissions, energy consumption and economic growth: Evidence from the agricultural sector of China’s main grain-producing areas. Sci. Total Environ. 2019, 665, 1017–1025. [Google Scholar] [CrossRef]
  80. Dong, Y.; Shao, S.; Zhang, Y. Does FDI have energy-saving spillover effect in China? A perspective of energy-biased technical change. J. Clean. Prod. 2019, 234, 436–450. [Google Scholar] [CrossRef]
  81. Sinha, A.; Balsalobre-Lorente, D.; Zafar, M.W.; Saleem, M.M. Analyzing global inequality in access to energy: Developing policy framework by inequality decomposition. J. Environ. Manag. 2022, 304, 114299. [Google Scholar] [CrossRef]
  82. Zhao, L.; Rao, X.; Ding, S. Can rural digitization promote agricultural carbon emission reduction ? J. Huazhong Agric. Univ. (Soc. Sci. Ed.) 2023, 42–52. [Google Scholar] [CrossRef]
  83. Zhao, X.; Zhang, Y.; Yang, X. Analysis of the characteristics and influencing factors of urban energy transition in China—Based on the empirical evidence of 131 cities in China. Tech. Econ. 2022, 41, 130–140. [Google Scholar]
  84. Tian, Y.; Yin, M.-H. Does technological progress promote agricultural energy carbon emission reduction? Test based on rebound effect and spatial spillover effect. Reform 2021, 12, 45–58. [Google Scholar]
  85. Yang, R.; Guo, D. The development of digital economy and the upgrading of rural industrial structure: A study based on county panel data. Decis. Mak. Sci. 2024, 5, 17–28. [Google Scholar]
  86. Ji, J.; Wei, J. Cluster Development of Industrial Carbon Emissions in the Process of Urban Carbon Decoupling: A Network Perspective Considering Carbon Inequality Between Cities. Syst. Eng.-Theory Pract. 2024, 1–24. Available online: https://d.wanfangdata.com.cn/periodical/xtgcllysj202504008 (accessed on 16 July 2025).
  87. Opoku, E.E.O.; Acheampong, A.O.; Aluko, O.A. Impact of rural-urban energy equality on environmental sustainability and the role of governance. J. Policy Model. 2024, 46, 304–335. [Google Scholar] [CrossRef]
  88. Lind, J.T.; Mehlum, H. With or Without U? The Appropriate Test for a U-Shaped Relationship. Oxf. Bull. Econ. Stat. 2010, 72, 109–118. [Google Scholar] [CrossRef]
  89. Qian, L.; Zhao, T.T.; Fang, Y. Data elements drive new agricultural productivity: Mechanism and empirical test. J. Northeast Agric. Univ. (Soc. Sci. Ed.) 2025, 23, 1–12. [Google Scholar]
  90. Wang, J.; Wang, W.; Liu, Y. Spatial-temporal evolution and driving factors of urban energy transition in China. Inq. Econ. Probl. 2025, 3, 68–85. [Google Scholar]
  91. Cattle, T.P.; Chen, D.Q.; Wang, Q.; Huang, X.T. The influence mechanism of energy transformation on urban-rural energy equity. Resour. Sci. 2024, 46, 1768–1779. [Google Scholar]
  92. Zhao, C.; Xuan, Z.; Yuan, M.; Liu, Z. The window of opportunity: Estimating the role of climate finance on urban-rural electricity inequality. J. Environ. Manag. 2025, 374, 124153. [Google Scholar] [CrossRef]
  93. He, Y.; Zhu, Y.; Zhu, Y.; Han, D. Research on the impact of clean energy demonstration provincial policy on energy poverty: Empirical evidence from China. Energy Strategy Rev. 2025, 59, 101708. [Google Scholar] [CrossRef]
Figure 1. Theoretical framework.
Sustainability 17 06599 g001
Figure 2. The level of digital village construction.
Sustainability 17 06599 g002aSustainability 17 06599 g002b
Figure 3. The three-digit Raman chart of the Theil Index.
Sustainability 17 06599 g003
Figure 4. Inverted U-shaped.
Sustainability 17 06599 g004
Table 1. Evaluation index system for the development level of digital villages.
Primary IndicatorSecondary IndicatorsTertiary IndicatorsDescriptionWeight
The level of digital village constructionRural digital infrastructureThe level of Internet penetrationThe rural Internet has been popularized among rural broadband access users0.172
The penetration rate of rural mobile phonesThe number of mobile phones per 100 households0.026
Information radiation rangeOptical cable line length0.110
The digitalization level of rural economyDigital finance levelInclusive Finance Digital Index0.046
The digitalization level of rural lifeDigital consumption levelPer capita transportation and communication expenditure of rural residents0.070
Digital service levelRural delivery route0.075
Proportion of digital talentsAverage educational attainment in rural areas (years)0.018
The digitalization level of rural industriesDigital transaction levelE-commerce sales volume0.263
The digitalization level of agricultural product informationThe total volume of postal and telecommunications services0.221
Table 2. Definitions of each variable.
VariableNameDiscrimination
Dependent variableCEITheil Index
Independent variableDVEntropy weight—TOPSIS method
Control variableURBTown’s population/Total population
RDInternal expenditure on R&D funds/GDP
FSAExpenditure amount related to agriculture/Local general public budget expenditure
EDUThe average years of education method
PGDPGDP/Total population
FDIFDI inflow/GDP
Mediating variableATPThe degree of mechanization in agricultural cultivation
INDAdded value of the secondary industry/Added value of the tertiary industry
Table 3. Descriptive statistics.
VariableMaxMinMeanP50SD
CEI0.3830.0000.0540.0300.070
DV0.7110.0590.1720.1350.098
URB0.8960.3500.6010.5880.121
RD6.8300.4101.7881.4711.155
FSA20.3844.04011.35511.3943.338
EDU1.5360.7691.2941.2860.076
PGDP19.0311.6416.0805.2863.045
FDI55.9380.0470.8190.2834.170
ATP1.8970.1910.8580.8320.276
IND1.3350.0090.3450.2590.293
Table 4. Baseline regression and stepwise regression.
(1)(2)(3)(4)(5)
CEICEICEICEICEI
DV0.538 ***0.368 ***0.270 **0.454 ***0.479 ***
(4.599)(3.184)(2.393)(3.829)(3.985)
DV2−0.339 **−0.306 **−0.247 *−0.430 ***−0.451 ***
(−2.074)(−1.977)(−1.653)(−2.843)(−2.966)
URB −0.826 ***−0.858 ***−1.089 ***−1.067 ***
(−6.274)(−6.761)(−8.236)(−7.998)
RD 0.0325 ***0.027 **0.050 ***0.049 ***
(3.026)(2.565)(4.497)(4.409)
FSA −0.010 ***−0.010 ***−0.010 ***
(−5.098)(−5.522)(−5.429)
EDU 0.0480.048
(1.142)(1.145)
PGDP −0.014 ***−0.014 ***
(−4.556)(−4.547)
FDI 0.0006
(1.223)
Year fixedYes Yes
Province fixedYes Yes
Cons−0.026 *0.441 ***0.592 ***0.6929 ***0.675 ***
(−1.773)(5.426)(7.080)(6.611)(6.382)
N360360360360360
R20.7010.7360.7550.7720.772
Note: ***, **, * indicate statistical significance at 1%, 5%, and 10% levels, respectively; the value in parentheses represents z-statistics.
Table 5. Inverted U-shaped test result.
Lower BoundUpper Bound
Interval0.0590.711
Slope0.427−0.162
t-value3.554−1.987
p-value0.0000.024
Overall test of presence of an Inverse U shape:
T-value 1.99
p-value0.0239
Extreme point0.532
99% Filler interval for extreme point[0.419; 0.948]
Table 6. Robustness analysis.
(1)(2)(3)
CEICECEI
DV0.466 ***6.582 ***0.553 ***
(4.158)(3.823)(4.217)
DV2−0.409 ***−7.321 ***−0.668 ***
(−2.748)(−3.365)(−4.111)
URB−0.714 ***−15.934 ***−1.810 ***
(−11.944)(−8.348)(−8.773)
RD0.038 ***0.522 ***0.100 ***
(3.676)(3.253)(6.748)
FSA−0.009 ***−0.103 ***−0.006
(−5.178)(−4.002)(−1.584)
EDU0.0540.6390.000
(1.315)(1.058)(0.623)
PGDP −0.008 ***−0.115 ***−0.006 ***
(−3.430)(−2.604)(−3.218)
FDI0.00080.013 *0.028
(1.608)(1.745)(0.632)
Year fixedYesYesYes
Province fixedNoYesYes
Cons0.426 ***10.604 ***0.943 ***
(6.713)(7.006)(7.239)
N360360312
R20.7690.8450.800
Note: ***, * indicate statistical significance at 1%, and 10% levels, respectively; the value in parentheses represents z-statistics.
Table 7. Endogeneity test.
(1)(2)(3)
For L. DVFor L.DV2CEI
L.DV1.145 ***0.310 *
(11.350)(2.301)
L.DV2−0.396 **0.481 ***
(−3.980)(3.520)
DV 0.652 ***
(3.560)
DV2 −0.549 **
(−2.890)
Endogeneity test of endogenous regressors:
regressors:
p = 0.007
p = 0.0071
Kleibergen–Paap rk LM statisticp = 0.081
Cragg–Donald Wald F statistic207.843
Kleibergen–Paap rk Wald F statistic70.644
ControlYesYesYes
Year fixedYesYesYes
Province fixedYesYesYes
N330330330
Note: ***, **, * indicate statistical significance at 1%, 5%, and 10% levels, respectively; the value in parentheses represents z-statistics.
Table 8. Mediating effect.
VerCEIATPCEIINDCEI
(1)(2)(3)(4)(5)
DV0.479 ***−0.567 ***0.405 ***−1.826 ***0.409 ***
(3.985)(−3.181)(3.370)(−5.407)(3.268)
DV2−0.451 ***0.488 **−0.387 **1.805 ***−0.382 **
(−2.966)(2.163)(−2.570)(4.228)(−2.452)
ATP −0.132 ***
(−3.508)
IND −0.038 *
(−1.903)
URB−1.067 ***−0.347 *−1.112 ***−0.231−1.075 ***
(−7.998)(−1.757)(−8.449)(−0.617)(−8.093)
RD0.049 ***0.0040.050 ***−0.095 ***0.046 ***
(4.409)(0.225)(4.533)(−3.025)(4.042)
FSA−0.010 ***0.008 ***−0.009 ***−0.003−0.010 ***
(−5.429)(2.817)(−4.904)(−0.634)(−5.516)
EDU0.048−0.109 *0.0340.288 **0.059
(1.145)(−1.744)(0.815)(2.433)(1.400)
PGDP−0.014 ***0.007−0.013 ***0.059 ***−0.012 ***
(−4.547)(1.406)(−4.335)(6.811)(−3.574)
FDI0.001−0.0010.001−0.0010.001
(1.223)(−1.163)(1.011)(−0.395)(1.185)
Year fixedYesYesYesYesYes
Province fixedYesYesYesYesYes
Cons0.675 ***0.643 ***0.760 ***0.715 **0.702 ***
(6.382)(4.098)(7.123)(2.408)(6.608)
N360360360360360
R20.7720.9710.780.8830.774
Note: ***, **, * indicate statistical significance at 1%, 5%, and 10% levels, respectively; the value in parentheses represents z-statistics.
Table 9. Heterogeneity result.
High UrbanizationLow UrbanizationHigh UndulationsLow UndulationsLow ETHigh ETClean PolicyNot Clean Policy
(1)(2)(3)(4)(5)(6)(7)(8)
DV0.0130.727 **1.183 *0.1680.464 ***1.936 ***−0.0570.500 ***
(0.099)(2.310)(1.941)(1.601)(3.832)(3.622)(−0.0704)(4.662)
DV20.046−1.605 **−2.906 **−0.132−0.417 ***−4.021 ***0.070−0.439 ***
(0.319)(−2.317)(−2.353)(−1.065)(−2.846)(−3.785)(0.049)(−3.369)
URB−0.147−1.610 ***−1.579 **−0.385 ***−0.746 ***−1.009 *−4.714 ***−0.841 ***
(−0.978)(−4.669)(−2.585)(−3.060)(−5.544)(−1.833)(−2.941)(−7.413)
RD0.0020.138 ***0.137 ***0.017 *0.043 ***0.091 **0.270 ***0.034 ***
(0.171)(5.826)(4.275)(1.829)(4.065)(2.330)(4.043)(3.557)
FSA−0.008 ***−0.0030.000−0.010 ***−0.010 ***0.0050.012−0.009 ***
(−3.616)(−1.205)(0.086)(−5.337)(−5.408)(1.139)(1.380)(−5.416)
EDU−0.009−0.040−0.0230.134 **0.010−0.0760.2300.062
(−0.174)(−0.885)(−0.380)(2.589)(0.240)(−0.851)(1.177)(1.624)
PGDP−0.001−0.017 *−0.001−0.004−0.015 ***0.013−0.020−0.013 ***
(−0.536)(−1.897)(−0.035)(−1.419)(−5.160)(1.104)(−0.521)(−5.003)
FDI−0.0000.020 *0.102 *0.0000.0000.0210.1950.001
(−0.3199)(1.667)(1.928)(−0.056)(0.762)(1.303)(1.544)(1.380)
Year fixedYesYesYesYesYesYesYesYes
Province fixedYesYesYesYesYesYesYesYes
Cons0.2210.830 ***0.683 **0.1670.563 ***0.2861.929 **0.520 ***
(1.592)(4.061)(1.989)(1.607)(5.248)(0.839)(2.136)(5.576)
N16119712024024711160300
adj. R20.5560.8820.840.4770.7380.860.770.769
Note: ***, **, * indicate statistical significance at 1%, 5%, and 10% levels, respectively; the value in parentheses represents z-statistics.
Disclaimer/Publisher’s Note: The statements, opinions and data contained in all publications are solely those of the individual author(s) and contributor(s) and not of MDPI and/or the editor(s). MDPI and/or the editor(s) disclaim responsibility for any injury to people or property resulting from any ideas, methods, instructions or products referred to in the content.

