1. Introduction
Urban–rural integration has emerged as a critical policy objective in China’s pursuit of high-quality development and common prosperity. As the country continues to experience rapid urbanization, the longstanding dual structure between urban and rural areas has resulted in unbalanced and insufficient development, reflected in disparities in infrastructure, public services, income levels, and land use efficiency. Bridging this gap requires not only physical and economic linkages but also deep institutional reforms to overcome structural barriers that hinder factor mobility and spatial equity [
1,
2,
3,
4].
The theoretical basis of urban–rural integration is rooted in both classical and contemporary development economics. The dual-sector model proposed by Lewis [
5] highlights the segmented nature of labor markets and capital accumulation in traditional versus modern sectors. In China, this dichotomy has historically been reinforced through institutional arrangements, such as the hukou system, dual land ownership (state-owned urban land vs. collectively owned rural land), and uneven fiscal distribution. Scholars have conceptualized this as a form of “institutional segregation”, in which rural residents are structurally excluded from sharing the dividends of modernization [
6,
7].
In response, integration-oriented reform policies have increasingly emphasized the need to restructure spatial governance and facilitate equitable factor flows, including land, labor, and capital, across rural and urban territories. The OECD defines urban–rural integration as a multilevel process involving coordinated spatial planning, infrastructure investment, and institutional harmonization. Scott and Storper [
8] further argue that regional development in the 21st century must transcend spatial hierarchies and pursue functional linkages grounded in networked economic systems.
From a policy perspective, China’s shift from land-centered industrialization to territorial spatial governance marks a significant transition [
9,
10]. The institutional innovation of homestead land rights confirmation—which formalizes property rights over rural residential land—has been promoted as a key mechanism to unlock land value, increase tenure security, and activate rural construction land [
11,
12]. This reform is grounded in new institutional economics, where clear property rights reduce transaction costs and improve market efficiency [
13,
14].
However, the effectiveness of such reforms depends on how they restructure the broader urban–rural system, which includes intertwined subsystems of population dynamics, economic agglomeration, public service provision, and governance capacity [
15,
16]. Existing empirical research, while abundant, often employs static regression models or case-based methods that fail to capture the feedback mechanisms, nonlinear interactions, and temporal lags inherent in large-scale spatial systems.
Moreover, the interconnections between policy tools, intermediary mechanisms, and outcome variables remain underexplored. There is a pressing need to adopt systems thinking and modeling approaches to identify structural leverage points and simulate the long-term effects of reform policies. To address this gap, this study proposes a hybrid modeling framework that combines interpretative structural modeling (ISM) and system dynamics (SD). The ISM method is used to extract and structure key variables, such as land tenure, labor mobility, institutional capacity, and industry linkages, revealing their causal relationships and hierarchical structure. Building on the ISM results, a dynamic simulation model is constructed to explore the temporal evolution of urban–rural integration under various policy scenarios. Four interrelated subsystems, namely land, population, economy, and governance, are incorporated to reflect the systemic nature of the integration process.
This study contributes to the literature in three ways. First, it provides a theoretical framework that connects land institutional reform with spatial reconfiguration and system transformation. Second, it enriches the methodological tools in urban–rural research by integrating structural analysis and dynamic modeling. Third, it delivers practical policy insights on how differentiated strategies—tailored to regional capacities—can accelerate integration, improve factor allocation efficiency, and support sustainable territorial development.
2. Structural Analysis of the Urban–Rural Integration System
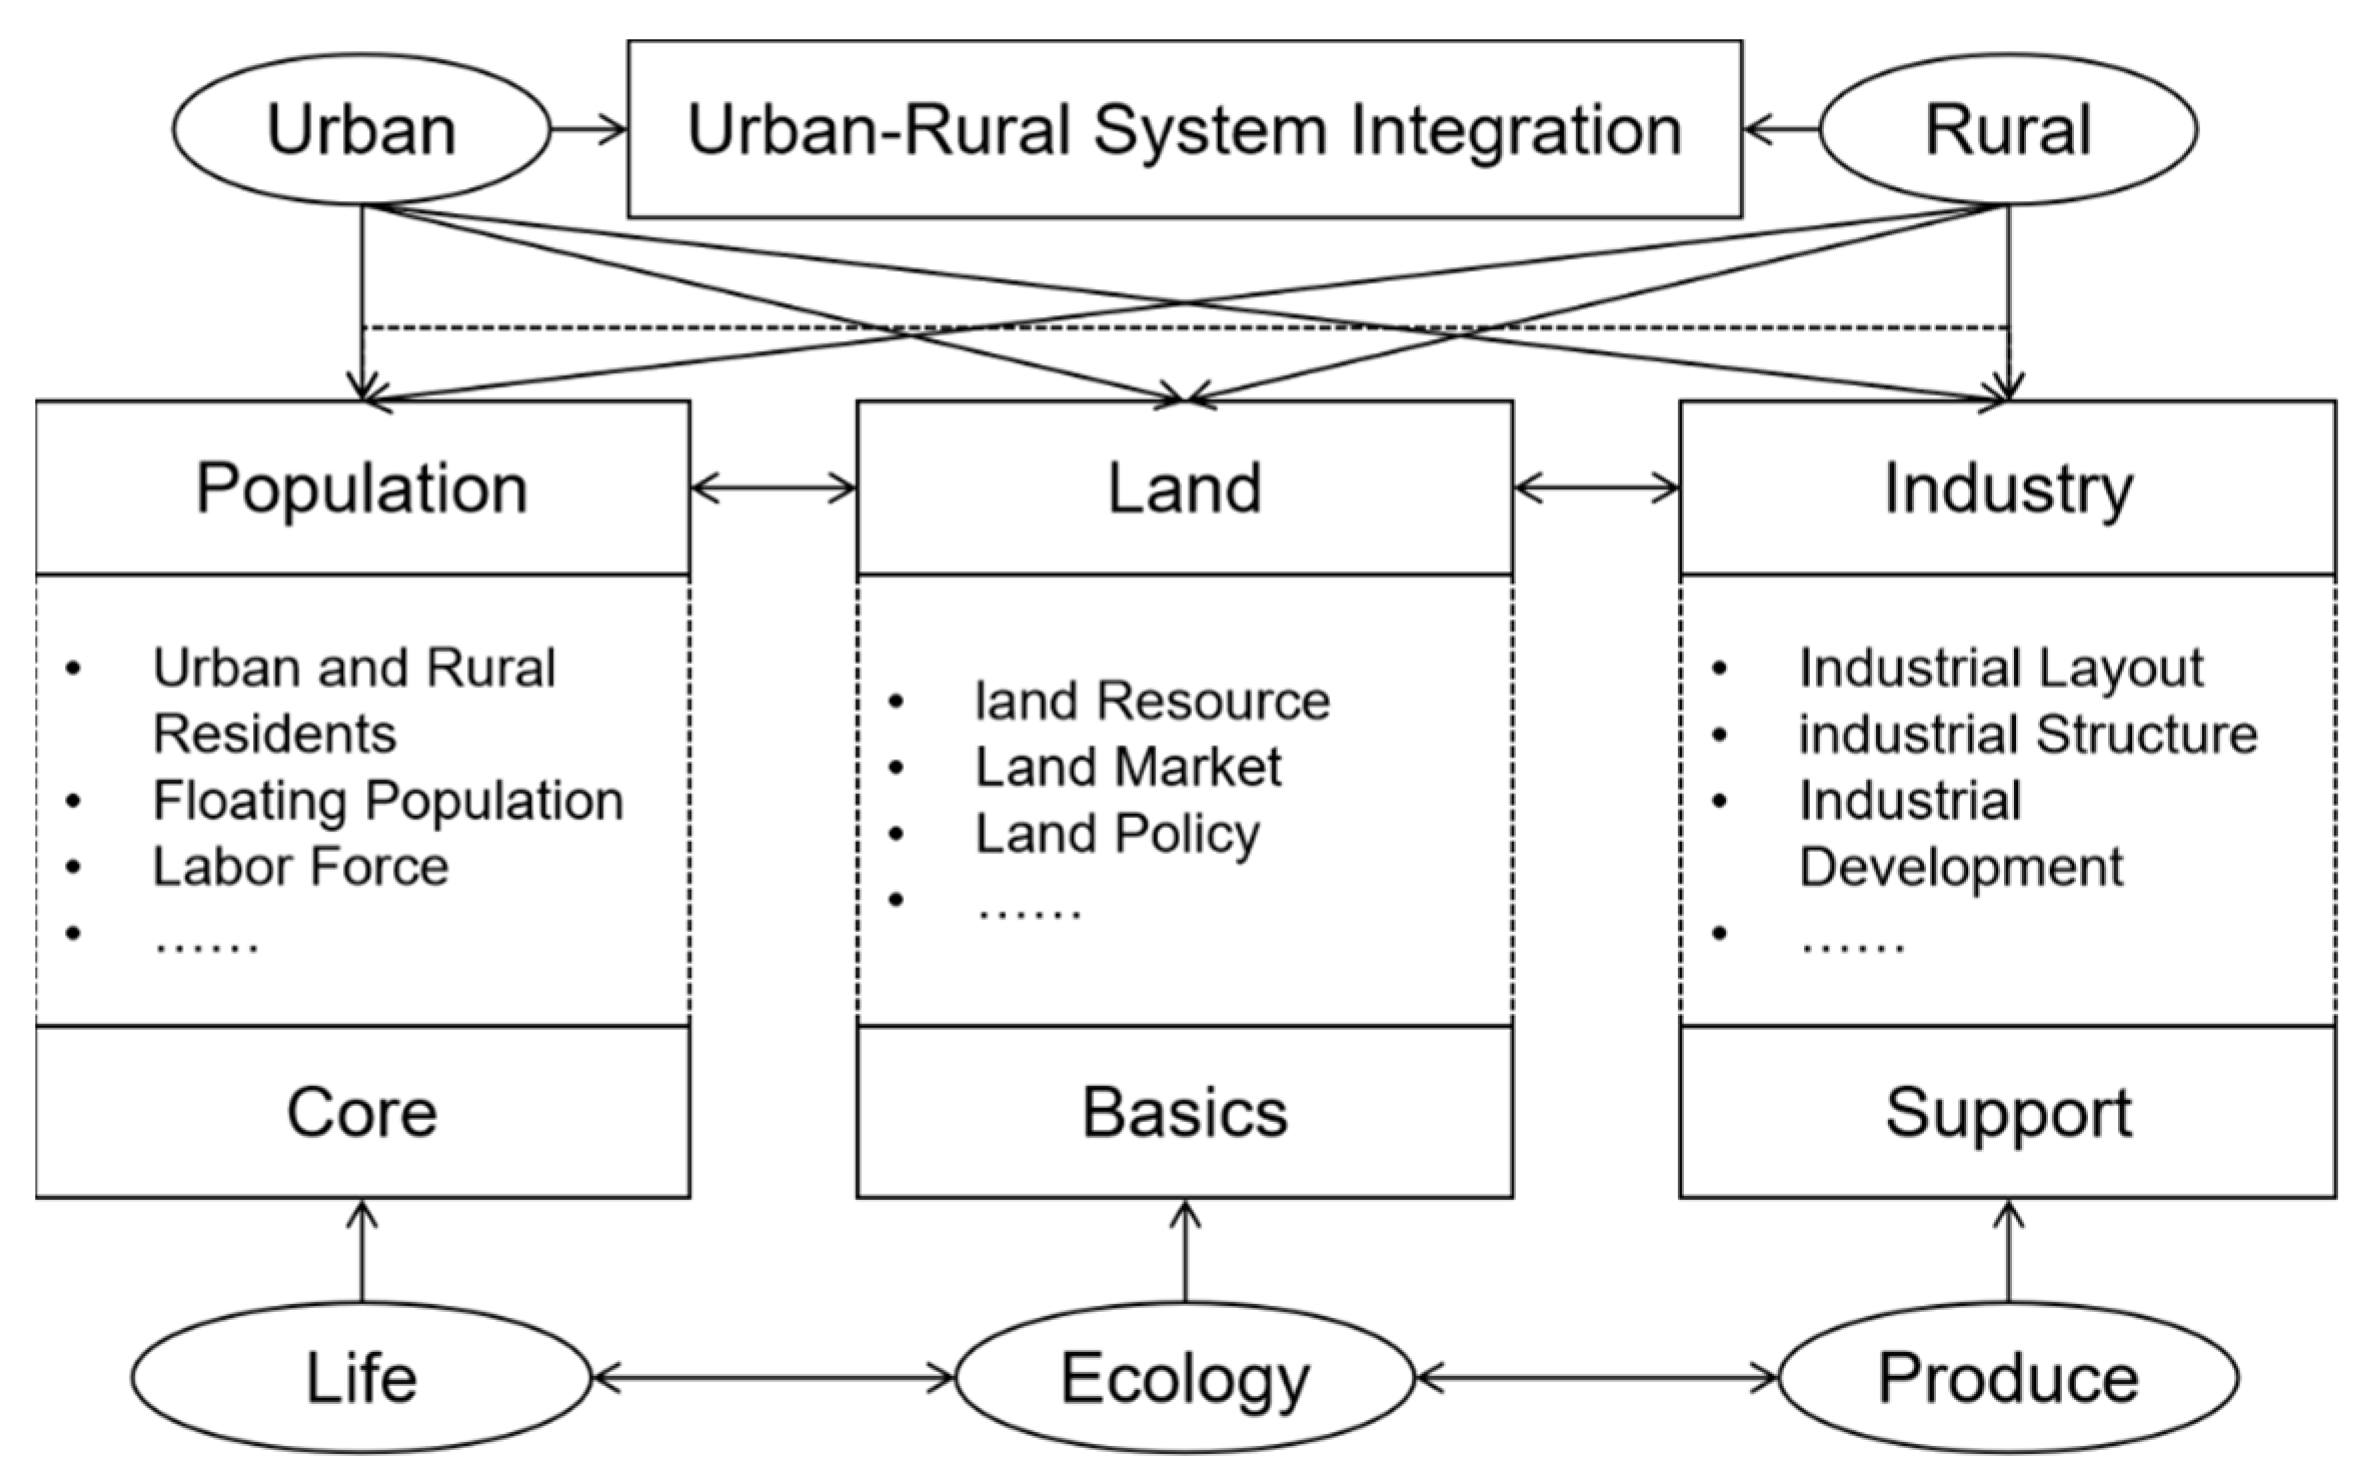
Drawing on the Regional System Theory of Human–Land Relationships, the urban–rural integration system is conceptualized as a structural entity shaped by the exchange of materials, energy, and information between urban and rural subsystems. This system evolves through structural adjustments driven by the circulation of core elements, ultimately leading to functional transformation. Structurally, the system can be disaggregated into two interrelated, yet distinct, subsystems: the urban regional system and the rural regional system. These subsystems operate both independently and interactively, with integration occurring through the reorganization of population, land, and industrial resources—three critical elements that are essential to system performance.
Urban–rural integration can thus be understood as a process of coordination across these elements. Population mobility facilitates the optimal distribution of human resources; industrial development reduces functional disparities, and land use restructures spatial flows and mitigates barriers to interaction. The continuous interplay among these components reconfigures human–land relationships and strengthens the functional and structural interdependence between urban and rural regions.
Guided by both the aforementioned theory and the principles of sustainability, this study conceptualizes the urban–rural integration system as comprising two major subsystems, namely urban and rural, each of which contains population, land, and industry dimensions that interact dynamically.
The population subsystem represents the principal driver of integration, influencing both economic dynamics and social stability. Population mobility between urban and rural areas catalyzes changes in labor distribution, institutional access, and capital flows. As the fundamental agent of transformation, population movement enhances human capital spillovers and learning effects, thereby improving systemic efficiency.
This subsystem encompasses urban and rural residents, migrant populations, and the active labor force. Shifts in population size, structure, and spatial distribution directly affect system resilience, while human capital levels shape the quality of integration outcomes. Consequently, the effective governance of population flows is essential to achieving balanced spatial development and equitable access to public goods.
The land subsystem constitutes the physical foundation of urban–rural integration, serving as the spatial medium through which elements circulate. Central to this subsystem is the optimization of land use patterns and spatial structures to support integration goals.
Land resources, regulatory frameworks, and market mechanisms collectively determine land use efficiency—a key indicator of sustainable system function. Historically, the urban–rural land dichotomy, characterized by institutional and market segmentation, has constrained integration. While land’s physical immobility limits its direct transfer, its use rights can be activated through institutional innovation, including land market liberalization, cross-regional transfer mechanisms, and the consolidation of idle rural residential land. Enhancing land allocation efficiency is, therefore, essential for overcoming entrenched structural barriers.
The industry subsystem provides the economic basis for integration, with its development contingent upon industrial upgrading, spatial optimization, and productivity enhancement. Disparities between urban and rural industrial structures remain a primary obstacle to balanced growth. This subsystem is shaped by both exogenous forces, such as state policy and market dynamics, and endogenous factors, including labor and land resource availability.
Interdependencies with the population and land subsystems are particularly salient: labor migration and land conversion drive industrial restructuring, while policy tools shape factor allocation. Coordinated development across subsystems strengthens industrial competitiveness and fosters a unified urban–rural economic landscape.
The urban–rural integration system functions as a complex and adaptive structure composed of interlinked regional subsystems. The population, land, and industry components are mutually reinforcing, and their interaction underpins systemic stability and responsiveness. A disruption in any one subsystem can trigger cascading adjustments across the entire system.
Three core interrelationships merit emphasis.
Population and Land: Demographic shifts influence land use intensity and configuration. Accelerated rural-to-urban migration, driven by urbanization, increases urban land demand while depopulation leads to the underutilization of rural land. Thus, population dynamics must be managed in tandem with land-use planning to ensure spatial coherence.
Population and Industry: Labor availability—both in quantity and quality—is foundational to industrial productivity. As industrial demand evolves, so too must workforce distribution. Ensuring compatibility between the labor structure and industrial needs is key to maintaining integration momentum.
Land and Industry: Land supports industrial activity through its physical and locational attributes. Sector-specific land needs vary, and industrial upgrading, in turn, reshapes land use demands. Strategic land allocation must, therefore, align with targeted industrial priorities to maximize development outcomes.
In conclusion, the urban–rural integration system is driven by the dynamic interplay of population, land, and industry subsystems (see
Figure 1). Their coordinated optimization is essential for improving overall system functionality and achieving sustainable, inclusive, and balanced regional development.
3. Dynamic Evolution of Homestead Land Rights Confirmation on Urban–Rural Integration Development
3.1. Analysis of Driving Factors in Homestead Land Rights Confirmation’s Impact on Urban–Rural Integration
The interpretative structural modeling (ISM) method, a widely applied systems science approach, is employed to analyze complex socio-technical systems by decomposing objectives, identifying direct binary relationships among internal factors, and elucidating hierarchical structures and interdependencies through Boolean logic operations. This study utilizes the ISM to examine the hierarchical relationships among the driving factors through which homestead land rights confirmation promotes urban–rural integration, laying the foundation for constructing a system dynamics model in subsequent sections.
To ensure the robustness and scientific grounding of the system dynamics model, the identification of the influencing factors (as listed in
Table 1) was based on a systematic review of the recent literature on urban–rural integration (see References [
17,
18,
19,
20,
21,
22,
23,
24,
25]), land system reform, and factor mobility. The selected factors comprehensively reflect critical dimensions such as land system reform (F1), urban–rural resource allocation (F2), regional development level (F3, F5), and institutional and economic structures (F6–F13).
The causal relationships between the system elements listed in
Table 2 were established through structured internal discussions within the research team based on a literature review. The team consisted of five members, including three academic researchers specializing in rural land reform and urban–rural integration, and two teachers with experience in land policy implementation and planning at the local government level.
Prior to the discussion, a set of reference materials was compiled, including the representative literature on land system reform, urban–rural coordination mechanisms, and sustainability frameworks (see References [
26,
27,
28,
29,
30,
31]). Based on these sources, the team conducted a qualitative assessment to determine whether a direct influence relationship was reasonable between each pair of elements.
The process involved two rounds of group discussion. In the first round, the team members freely proposed potential relationships based on theoretical logic or practical observations. In the second round, the proposed relationships were collectively reviewed, and any disagreements were resolved through open dialogue, supported by literature-based reasoning where needed. The goal was to ensure that every confirmed causal link had at least one of the following: (1) theoretical support from prior studies; (2) empirical plausibility grounded in China’s land reform practices; or (3) logical coherence within the human–land–industry system.
This collaborative consensus approach ensured that all causal relationships retained in
Table 2 were jointly agreed upon by all team members and were deemed credible for subsequent ISM modeling.
3.2. Hierarchical Analysis of Homestead Land Rights Confirmation’s Impact
On the basis of
Table 2, an explanatory structural model diagram of urban–rural integration was obtained through the iterative calculation of some column matrices (see
Appendix A Table A1,
Table A2,
Table A3 and
Table A4), as shown in
Figure 2. As illustrated in
Figure 2, homestead land rights confirmation (F1) serves as the foundational factor and primary driver of urban–rural integration, positioned at the core of the system. As a core driving factor, F1 exhibits the most extensive influence, acting as the critical origin of the cascading changes across multiple variables. While F2, F3, and F4 do not directly drive numerous downstream factors, they indirectly affect F6, F7, F8, F9, and F14 through the mediating role of F1. Notably, F5 exclusively influences F12 and F14, underscoring its importance within specific causal pathways.
The mediating factors, namely F6, F7, F8, and F9, propagate F1’s effects toward F14. Similarly, F11 demonstrates dual mediation: it not only receives direct input from F1 but also integrates influences from F8 and F9 to further shape F14, highlighting its pivotal role in information transmission and systemic bridging. Factors F10, F12, and F13 primarily exert indirect effects on F14 through intermediary variables. As the sole terminal node without downstream outputs, F14 (urban–rural integration) encapsulates the cumulative systemic outcomes, reflecting the aggregated impacts of all preceding factors.
The system can be stratified into three hierarchical tiers:
Core Layer (F1): Homestead land rights confirmation, the root driver initiating systemic dynamics.
Mediation Layer (F2–F13): Intermediate factors that transmit, amplify, and integrate core influences.
Effect Layer (F14): The ultimate outcome of urban–rural integration, synthesized from cross-layer interactions.
This hierarchical structure elucidates how localized institutional reforms (F1) permeate multi-scale subsystems to achieve macro-level integration, offering a replicable framework for analyzing policy-driven systemic transitions.
In the interpretive structural modeling (ISM) analysis of homestead rights confirmation and its influence on urban–rural integration, the primary driving forces are identified as twofold: endogenous development dynamics within urban and rural regions and the interactive integration dynamics between them. The allocation and deployment of key production factors, namely land, population, and capital, across urban–rural boundaries are central to shaping the trajectory of integration. As a pivotal institutional reform, homestead rights confirmation facilitates the reallocation of these factors, thereby playing a critical role in advancing systemic integration.
Understanding the mechanisms by which homestead rights confirmation influences integration requires recognition of both its foundational function and its multifaceted impact on inter-element relationships, structural realignment, and functional coordination. Endogenous dynamics refer to the internal capacity of urban and rural areas for economic, industrial, and social development. In contrast, interactive integration dynamics reflect the bidirectional flow of key elements, namely population, land, and industry, driven by socio-economic actors across spatial boundaries. These dynamics operate through several channels, including natural geographic conditions, socio-economic linkages such as informatization and infrastructure parity, and institutional coordination supported by targeted policies and investment.
In essence, homestead rights confirmation catalyzes deeper urban–rural integration by enhancing both endogenous capacities and cross-regional connectivity. It facilitates population urbanization, promotes the modernization of rural industry, and improves land use efficiency through institutional reconfiguration. The insights derived from the ISM analysis provide a robust conceptual basis for the subsequent development of a system dynamics model, grounded in the population–land–industry framework, to quantitatively examine the long-term impacts of land tenure reform on integrated territorial development.
3.3. Construction of the System Dynamics Model for Homestead Rights Confirmation’s Impact on Urban–Rural Integration
3.3.1. System Boundaries and Assumptions
- (1)
System Boundaries
This chapter aims to develop a system dynamics model to analyze the dynamic evolution of urban–rural integration before and after the confirmation of homestead rights. The spatial scope of the system encompasses 30 provinces in China, excluding Hong Kong, Macao, Taiwan, and the Tibet Autonomous Region. The temporal scope spans from 2006 to 2035, with an annual simulation step. The modeling process is divided into two phases:
Model Calibration Phase (2006–2022): Historical data from this period will be utilized to calibrate the model parameters, ensuring the validity and accuracy of the simulations;
Model Projection Phase (2023–2035): This phase forecasts the future trends and evolution paths of urban–rural integration under various parameter scenarios, providing a foundation for subsequent policy recommendations.
- (2)
Fundamental Assumptions
To balance scientific rigor with analytical tractability, the following assumptions are made based on preceding theoretical and empirical analyses:
External factors outside the model’s scope are assumed to have a negligible impact on the system’s development;
During the simulation period, the system and its internal variables are assumed to exhibit stable developmental trends, excluding abrupt shocks such as crises or significant policy shifts;
Reasonable simplifications of urban–rural integration metrics, provided the model and parameters remain valid, will not substantially distort system outcomes.
The confirmation of homestead rights is expected to advance the rural land market, influencing the migration of population, land, and industries between urban and rural areas. This process reshapes rural factor allocation structures and drives urban–rural integration. The integration level is measured by two core dimensions: the urban–rural income gap and the upgrading of the urban–rural industrial structure. Enhanced urban–rural integration improves factor allocation efficiency and accelerates factor flows across regions. Accordingly, urban–rural integration is assumed to exert a positive feedback effect on the migration of various urban–rural factors.
3.3.2. Construction of System Causal Feedback Relationships
Establishing causal relationships forms the logical foundation of system dynamics analysis and constitutes the core of model construction. Urban–rural integration is characterized by the organic linkage of urban and rural structures, directed factor flows, and effective functional convergence, evolving through interactions among key elements such as population, land, and industry. Consequently, this study decomposes the urban–rural integration system into two interdependent but interconnected subsystems, namely urban and rural, with population, land, and industry serving as critical drivers of system operation.
Drawing on interpretive structural modeling of the influence of homestead rights confirmation on integration dynamics and factor relationships, this study employs Vensim PLE 8.1.0 software to construct a causal feedback loop diagram illustrating the impact of homestead rights confirmation on urban–rural integration (see
Figure 3). Arrows indicate the direction of causal influence, while “+” and “−” denote positive and negative feedback relationships, respectively. Specifically:
The rural subsystem focuses on variables such as rural labor employment, rural industrial development, and rural per capita income;
The urban subsystem emphasizes variables including urban population, urban industrial development level, and resident income;
The integration system reflects conditions such as urban–rural economic parity, spatial structural coordination, and income gap dynamics.
3.3.3. Construction of the System Stock-Flow Diagram Model
While the causal feedback diagram visually represents the principal structure and interaction mechanisms within the system dynamics model of homestead rights confirmation’s impact on urban–rural integration, the quantitative analysis requires its translation into a stock-flow diagram to operationalize variables. Building on the established causal feedback framework, this study utilizes Vensim software to develop the stock-flow diagram model (see
Figure 4), which comprises 7 state variables, 7 rate variables, and 37 auxiliary variables. The variable parameters are determined through historical data, insights from the related literature, regression estimation, and table functions, with continuous refinement based on real-world validation to ensure accuracy and reliability.
In the system dynamics model, different types of arrows and symbols are used to represent distinct functions:
Single arrows denote flows, indicating the movement of quantities between stocks.
Double-headed arrows represent the combined influences affecting the rate of change in stocks.
Arrows with valves indicate adjustable flow rates, often reflecting external interventions such as policy measures.
Cloud symbols signify sources (infinite supply) or sinks (infinite consumption), commonly used to represent external variables beyond the model boundaries.
3.3.4. System Dynamics Model Validation
The parameterization of variables within the system dynamics model is primarily informed by longitudinal data spanning the years 2006 to 2022, covering 30 provinces in China, with the exception of Xizang (Tibet), Hong Kong, Macao, and Taiwan. Drawing upon existing empirical studies as foundational references, the parameters are estimated through a combination of regression analysis, tabular functions, and supplementary computational techniques. The final set of equations employed for variable specification within the model is presented in
Appendix A Table A5. All data utilized for parameter estimation are derived from authoritative sources, including the
China Land and Resources Yearbook, the
China Statistical Yearbook, the
China Rural Statistical Yearbook, the
China Rural Management Statistical Yearbook, and the
China Rural Policy and Reform Statistical Yearbook.
Historical validity testing of the model involves comparing simulated values with historical statistical data to assess the model’s effectiveness through the error-fitting degree. If the vast majority of errors are controlled within 10%, the model is considered valid for further simulation and forecasting. Given the complexity of the variables in this system dynamics model, only the level of urban–rural integration development and the three variables closely related to the characteristics of urban–rural integration development, namely the per capita income level of urban residents, the per capita income level of rural residents, and population urbanization, are selected for testing, with the results shown in
Table 3. The results demonstrate a significant fitting performance, with nearly all errors confined within 10%. This indicates that the constructed system dynamics model exhibits high precision, effectively simulating real-world urban–rural integration scenarios and enabling reasonable predictions of how homestead rights confirmation policies will impact integration trends in the future.
To further assess the external validity and generalizability of the system dynamics model constructed in this study, a post-calibration evaluation was conducted using actual data from 2023 and 2024—years not included in the model’s fitting phase (2006–2022). This approach tests whether the model can effectively simulate the evolution of key urban–rural integration indicators beyond its calibration period. Also considering the availability of data, urban and rural per capita disposable income and population urbanization rate core indicators were selected for external validation. The model-predicted values for 2023 and 2024 were extracted under the baseline scenario and compared with actual statistical data published by the National Bureau of Statistics of China (NBS). The comparison results are shown in
Table 4. The results show that the relative errors for all indicators remain within an acceptable range, generally below 5%. This indicates that the system dynamics model exhibits a high level of predictive accuracy for years beyond the calibration range and, therefore, demonstrates strong external validity.
A sensitivity test involves adjusting the relevant variable parameters in the model and observing whether abrupt changes occur in the simulation results. If no significant abrupt changes are detected, the model specification is deemed reasonable and valid, passing the sensitivity test. Specifically, this study re-runs simulations by modifying the model step size and altering key economic fundamentals, then compares the model outputs before and after parameter adjustments to assess sensitivity.
Figure 5 presents the simulation results of the urban–rural integration model under scenarios with adjusted step sizes and economic fundamental parameters. As shown, the simulated levels of urban–rural integration exhibit no significant fluctuations across different settings, indicating that the system model developed in this study has successfully passed the sensitivity test and confirming its validity.
4. Projection Analysis of Homestead Rights Confirmation’s Impact on Urban–Rural Integration
Using the system dynamics model of homestead rights confirmation’s impact on urban–rural integration and specifying equations for relevant variables, this section simulates and forecasts the trends of urban–rural integration levels and key variables within the integration system. Building on the model’s validated effectiveness (
Section 3.3.4), the projection period is set as 2022–2035 (with a 1-year step size), based on historical simulations from 2006 to 2022. The analysis projects the integration levels, related variables, and indicators that reflect the development of urban and rural subsystems.
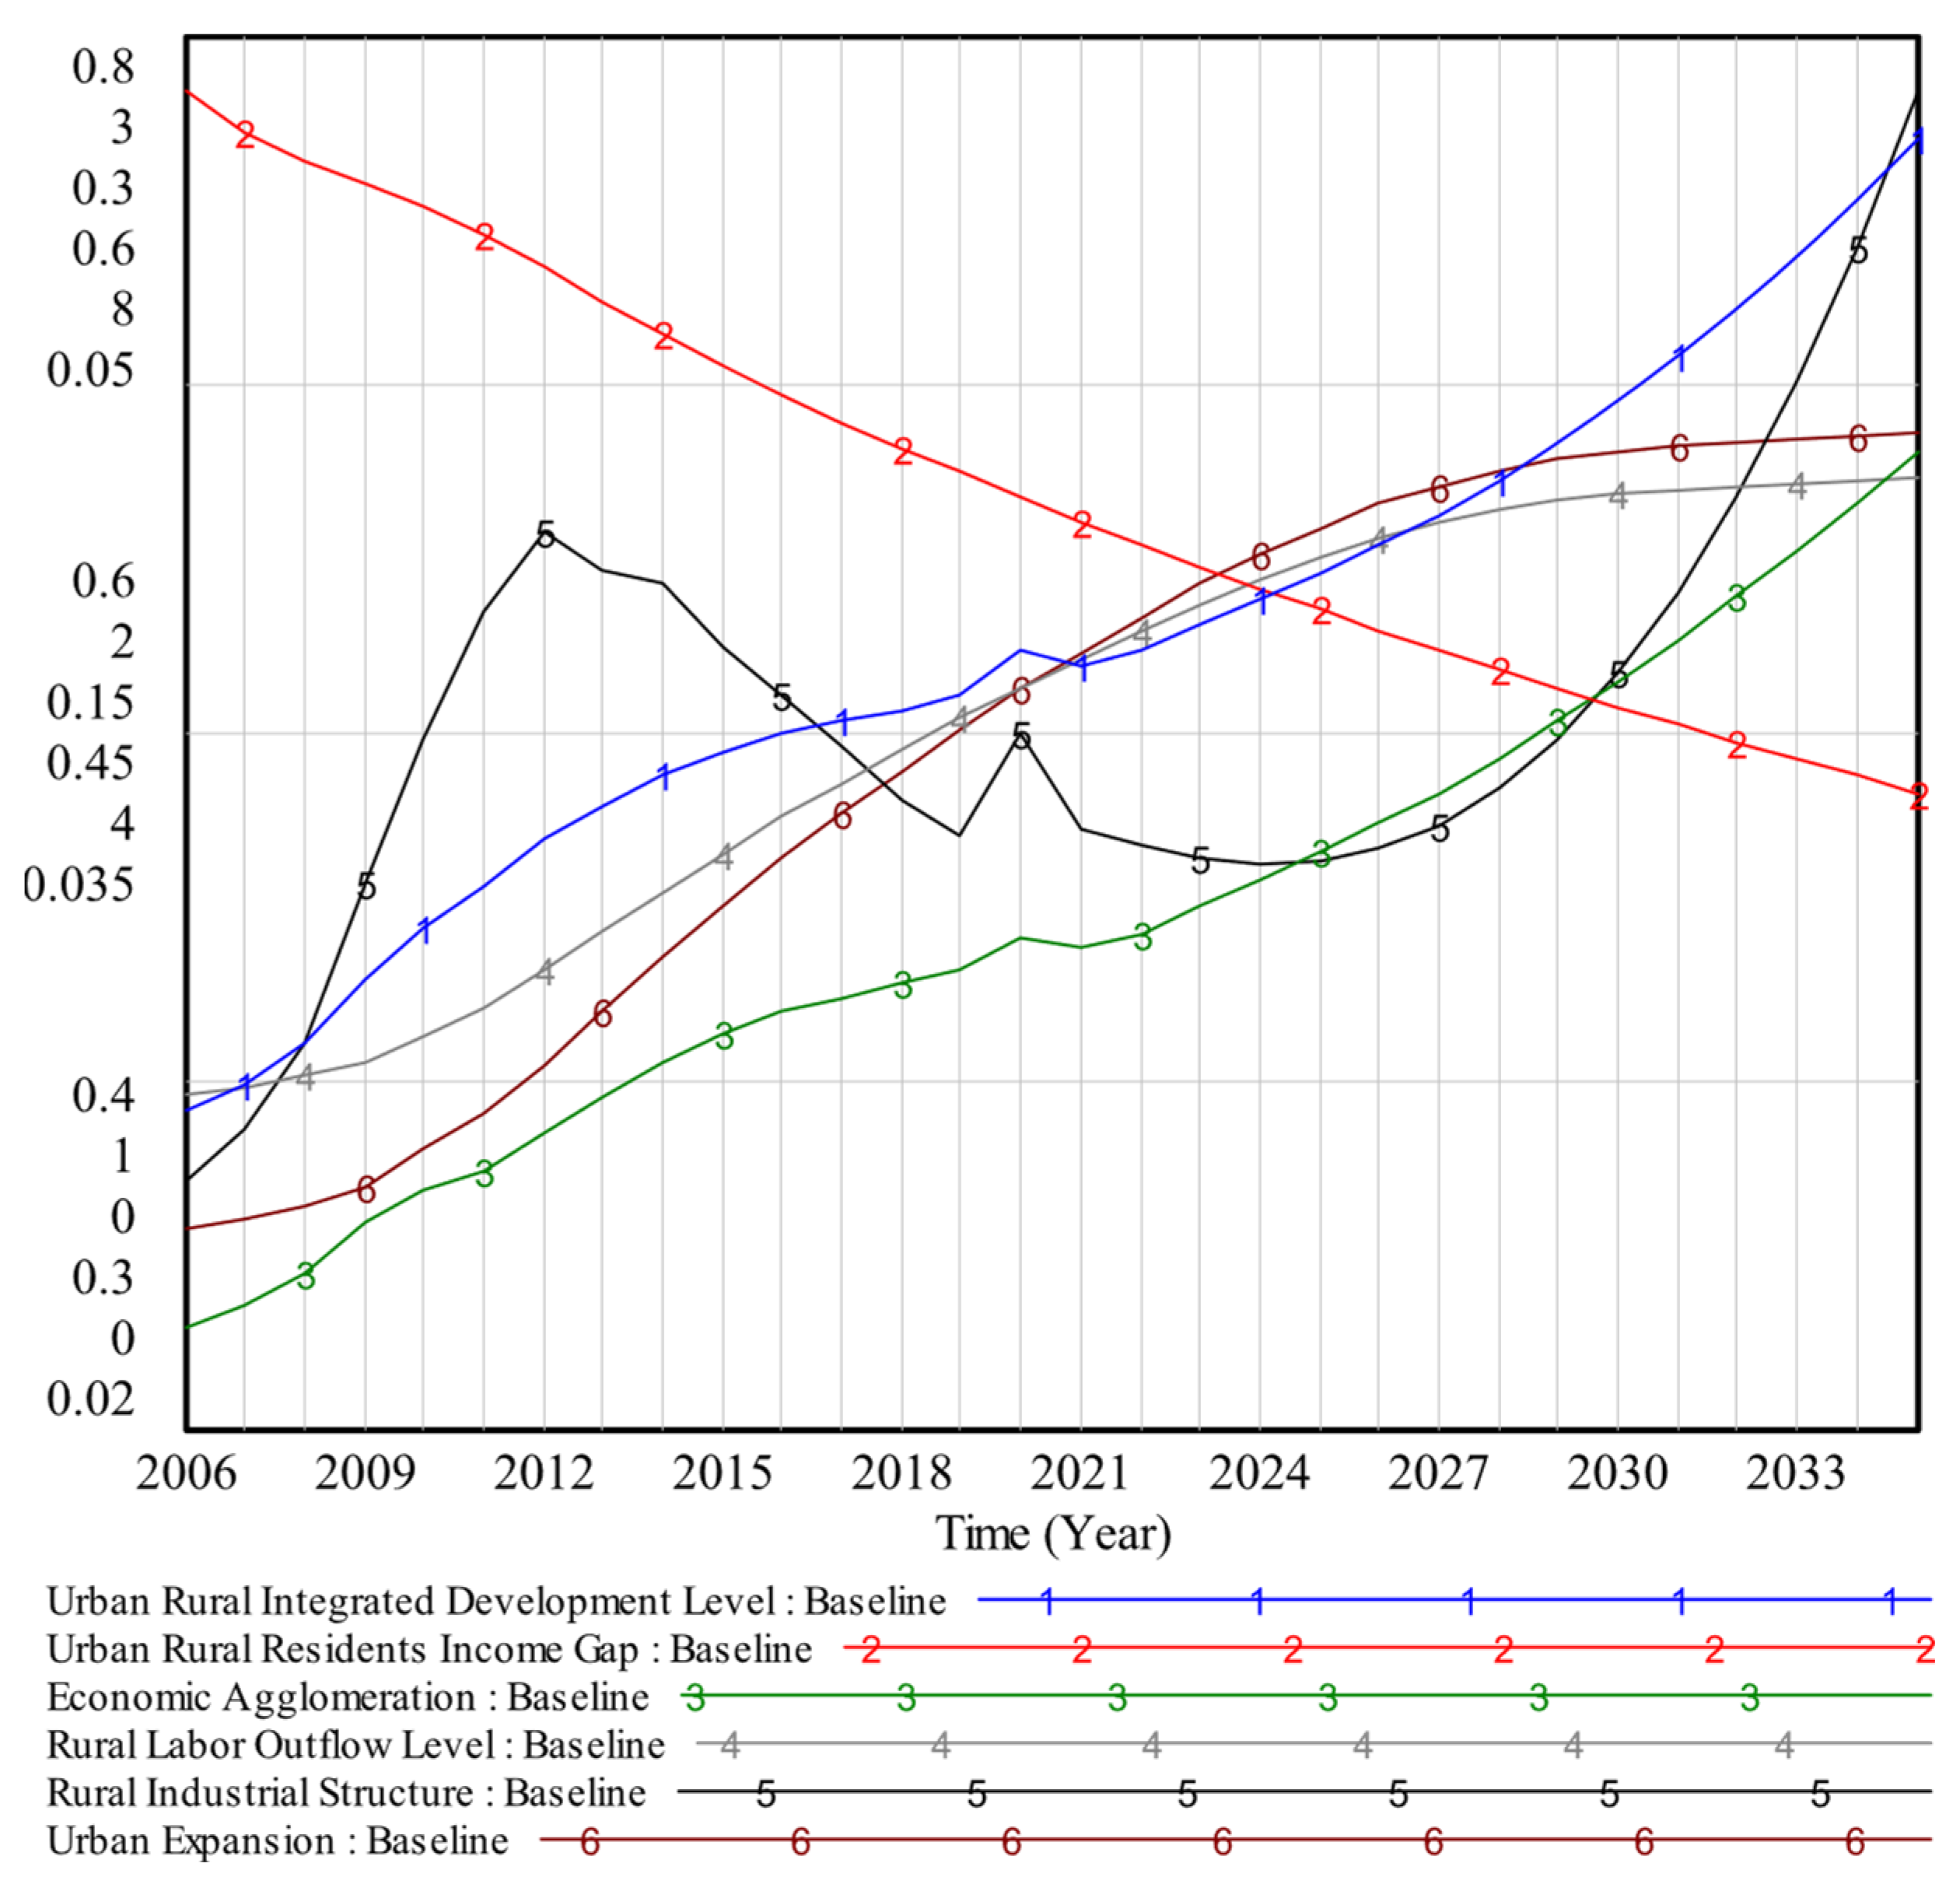
4.1. Baseline Scenario Projections
Figure 6 presents the simulation results for urban–rural integration levels and the influencing variables under the baseline development scenario.
Integration trend: From 2006 to 2022, urban–rural integration grew at a slow pace. Post-2022, the growth rate accelerates significantly: the integration level is projected to exceed 0.7 by 2030 (entering the “moderate coordinated development” stage) and 0.75 by 2035, with a trajectory toward “sound coordinated development” by 2040.
Income gap narrowing: The urban–rural income ratio, which measures income disparity, will continue to shrink steadily after 2022. It is expected to drop to 2.01 by 2031 and 1.908 by 2035—a 34% decline from 2006 and 16% from 2022—reflecting improved income equity.
Economic agglomeration: Non-agricultural industrial agglomeration shows an accelerating upward trend from 2022 to 2035, indicating robust growth in regional non-farm industries. This will drive industrial restructuring, optimize factor allocation between urban and rural areas, and further energize integration.
Rural industrial structure: The rural industrial structure follows an increase–decrease–increase trend from 2006 to 2035: From 2006 to 2012, non-agricultural industries dominated rural development. From 2012 to 2024, agricultural development outpaced non-farm sectors, likely due to the 2013 rural land policy reform promoting large-scale, intensive farming and agricultural modernization. From 2024 to 2033, a shift back to non-agricultural-led growth is projected, driven by urban–rural integration effects—flows of technology and talent from cities enable rural tourism, wellness, and diversified industries, boosting non-farm productivity.
Urban expansion and labor flows: Urban expansion maintains an upward trend through 2035 but slows after 2022, stabilizing post-2030. Meanwhile, rural labor outflow gradually stabilizes after 2022, suggesting a rebalancing of factor resources toward rural areas as policies aim to boost rural vitality and narrow development gaps, aligning with integration goals.
4.2. Projections for Homestead Right Confirmation and Its Impact
Figure 7 presents the projected trends of homestead rights confirmation, population urbanization, land urbanization, and the non-agricultural transfer of rural surplus labor under the baseline scenario. The key findings are as follows:
Homestead rights confirmation registration rate: From 2006 to 2035, the registration rate increases annually, with the steepest growth occurring between 2012 and 2025, primarily driven by the 2013 land system reform, which prioritized rights confirmation and registration as its core task. Post-2025, the growth rate moderates, indirectly indicating that the homestead rights confirmation process will enter its finalization phase by 2025—a projection consistent with actual policy progress.
Factor reallocation dynamics: Following homestead rights confirmation, the redeployment of rural homestead resources drives the reallocation of urban–rural population and land factors. Consequently, the trends in population urbanization, land urbanization, and non-agricultural labor transfer align closely with the trajectory of the homestead registration rate, reflecting the policy’s role in facilitating factor mobility between urban and rural systems.
5. Path Analysis of Homestead Rights Confirmation’s Impact on Urban–Rural Integration
5.1. Scenario Design
Urban–rural integration represents a sustainable development process characterized by inherent uncertainties in the evolution of urban–rural systems. Within this framework, homestead rights confirmation policies constitute a pivotal mechanism influencing integration levels. To investigate the policy pathways that effectively promote integration from the perspective of homestead rights confirmation, this study employs a scenario simulation analysis. Building upon prior research elucidating the mechanisms through which homestead rights confirmation impacts integration, we utilize a system dynamics approach to (1) project integration trajectories under baseline conditions shaped by homestead rights confirmation and (2) examine variations in the integration levels across diverse scenarios, thereby assessing how alterations in homestead rights confirmation may affect system outcomes.
The scenario analysis integrates both qualitative and quantitative methodologies. Guided by existing policy frameworks and development objectives, it delineates the prospective trajectory of homestead rights confirmation, simulates system evolution under varying assumptions, and provides empirical support for informed policy formulation.
Accurate forecasting of future trends through scenario analysis necessitates the identification of the key drivers underlying system evolution. The extant literature highlights the endogenous development levels within urban and rural areas, alongside the intensity of factor interactions between them, as critical determinants of integration progress. Fundamentally, urban–rural integration embodies the organic linkage between “urban-driven rural development” and “rural-driven urban integration,” with rural revitalization and new-type urbanization acting as dual engines propelling this process. To evaluate the relative influence of urban radiation effects versus rural integration effects, and to clarify integration priorities, four distinct development scenarios are delineated based on the current context of China’s urban–rural integration:
In this scenario, urban and rural development trajectories and inter-regional factor interactions adhere to historical trends without deliberate policy interventions. This serves as a benchmark for comparative analysis.
This scenario emphasizes urban economic growth, directing factor agglomeration toward urban centers to strengthen urban development and amplify radiation effects. Key urban indicators, including population size, land use, and industrial expansion, exhibit pronounced growth.
Focused on enhancing rural factor development, this scenario prioritizes resource allocation to rural areas with the objective of narrowing urban–rural disparities. Significant growth is observed in key rural indicators, such as labor force size, land utilization, and rural industrial capacity.
This scenario strives for a balanced approach, harmonizing urban socioeconomic advancement with rural development priorities. It features equitable factor distribution between urban and rural regions, with moderate adjustments in population, land, and industrial metrics, fostering a sustainable development paradigm that integrates both equity and efficiency.
When adjusting the parameters across scenarios, the following principles are observed: Ensure variable changes are consistent with the macro-development background. Clarify the directional adjustment of variables based on their relationship to specific scenarios. The selection of parameter variables, such as population urbanization, land urbanization, homestead rights confirmation rate, non-agricultural transfer of rural surplus labor, and agricultural production investment, is grounded in the core theoretical structure of the urban–rural integration system. These variables correspond to the critical dimensions of population–land–industry identified in both the structural and dynamic analyses. Specifically, population and land urbanization serve as primary indicators of factor mobility and spatial restructuring between urban and rural regions, directly reflecting the extent of demographic and spatial integration.
Adjusting these variables allows the model to simulate how varying intensities of urban expansion, land use transformation, and rural labor shifts influence the trajectory of urban–rural integration. Moreover, these indicators are highly sensitive to policy interventions (e.g., household registration reform and land market liberalization) and represent key levers through which governments can influence systemic transitions. Their inclusion thus ensures that the scenario simulations are both theoretically grounded and practically relevant. Specific parameter settings for these variables are detailed in
Table 5. It is important to clarify that the parameter settings in this study’s scenario analysis are not intended to serve as precise forecasts for future urbanization or investment levels. Rather, the adjustments are designed to construct stylized development trajectories, such as urban-priority, rural-priority, and coordinated-development scenarios, to compare the relative pace and patterns of urban–rural integration under differentiated conditions. The selected adjustment ranges (e.g., ±10%) are based on policy references and empirical studies to ensure conceptual plausibility, but the model emphasizes directional exploration over deterministic prediction.
5.2. Comparative Analysis of Multi-Scenario Simulation Results
Using the system dynamics model of homestead rights confirmation’s impact on urban–rural integration, scenario-specific simulations are conducted by adjusting the relevant parameters. Building on the validated model and historical results from 2006 to 2022, the projection period is set as 2022–2035 (with a 1-year step size) to forecast integration levels and “people-land-industry” indicators within the urban–rural system. To explore how the variable dynamics influence integration, trend graphs of core urban–rural variables and integration levels under the four scenarios are analyzed in depth.
Figure 8 illustrates the trajectories of urban–rural integration levels and income gaps across scenarios. Overall, all four scenarios promote integration and narrow development disparities. A comparative analysis reveals a clear hierarchy in the integration outcomes: rural-priority development > integrated coordinated development > baseline development > urban-priority development.
Baseline and urban-priority scenarios: By 2035, both scenarios transition from “primary coordination” to “moderate coordination” in integration. The baseline scenario shows stronger momentum, with the integration levels rising from 0.623 to 0.754 (a 20.92% increase), approaching “sound coordination.” In contrast, the urban-priority scenario lags, achieving only 0.694 by 2035 (a 15.23% increase), 5.7 percentage points lower than the baseline. This suggests prioritizing urban agglomeration alone yields suboptimal integration gains.
Rural-priority and integrated coordinated scenarios: These scenarios exhibit significantly accelerated integration. Both are projected to achieve comprehensive urban–rural integration by 2035, with the rural-priority scenario advancing faster. Specifically, in the integrated coordinated development scenarios, the urban–rural integration level starts from “moderate coordination” in 2022 and achieves the highest growth rate (41.1% increase by 2035), balancing urban radiation effects and rural revitalization. In rural-priority development scenarios, the urban–rural integration level surpasses other scenarios by reaching “sound coordination” in 2020 and “high-quality coordination” in 2024, demonstrating that rural-focused investments can drive leapfrog integration, even without excessive urban bias.
These findings highlight that rural revitalization should serve as the primary driver of integration, complemented by urban radiation effects, to most effectively narrow urban–rural gaps.
6. Discussion
While this study confirms the positive effects of homestead rights confirmation in promoting urban–rural integration, it is essential to acknowledge the potential challenges that may arise during the actual implementation process, particularly in rapidly developing rural regions. Two major risks merit close attention: environmental pressures and social structural changes.
First, the acceleration of rural industrialization and construction following land rights confirmation may lead to unintended environmental consequences. These include increased land consumption, ecological degradation due to infrastructure expansion, and pollution risks stemming from loosely regulated rural industries. The model assumes an idealized, efficiency-oriented system, but in practice, insufficient environmental oversight and weak local governance may exacerbate ecological imbalances. To address this, future policies should incorporate “green integration” strategies, such as integrating land consolidation with ecological compensation mechanisms, establishing mandatory environmental impact assessments (EIAs) for rural industrial projects, and encouraging sustainable land use through incentive-based land transfer systems.
Second, rapid changes in rural factor allocation and population structure may disrupt traditional social systems. The outflow of young labor, land transfer, and urban–industrial spillovers may weaken rural community cohesion, exacerbate the aging population problem, and even lead to “hollow villages.” These transformations can further intensify social inequality if institutional safeguards are not in place. Coping strategies should include strengthening rural grassroots governance, promoting collective land operation platforms, and enhancing public service extension systems for the rural population, especially for the elderly and left-behind groups.
Overall, while institutional reforms such as homestead rights confirmation offer promising pathways for urban–rural integration, they must be accompanied by multi-dimensional policy safeguards to ensure ecological sustainability and social resilience. Future studies may incorporate ecological carrying capacity constraints and demographic structural dynamics into simulation frameworks to achieve more realistic and forward-looking predictions.
7. Conclusions and Recommendations
7.1. Conclusions
Based on a comprehensive system dynamics simulation of the impact of homestead rights confirmation on urban–rural integration, this study yields the following key conclusions:
Homestead rights confirmation is a foundational driver of urban–rural integration, triggering multi-dimensional effects via labor mobility, land market optimization, and capital flows. It significantly enhances the coordination between urban and rural subsystems.
Urban–rural integration follows a phased trajectory: Under the baseline scenario, the integration level gradually transitions from “primary coordination” to “moderate coordination” by 2030, and further toward “sound coordination” by 2035.
Scenario comparison highlights policy sensitivity: The rural-priority and integrated development scenarios demonstrate significantly better integration outcomes than the urban-priority path. This suggests that rural revitalization, not urban expansion alone, should serve as the primary engine of integration.
The key factors influencing system evolution include population urbanization, land urbanization, rural industrial development, and rural labor non-agriculturalization. These represent critical policy leverage points.
Homestead rights confirmation enhances not only land market efficiency but also indirectly catalyzes industrial restructuring and income equity, forming a policy nexus that links institutional reform with sustainable spatial transformation.
7.2. Recommendations
The simulation results confirm that homestead rights confirmation significantly promotes urban–rural integration, particularly under rural-priority and coordinated development scenarios. To fully leverage this reform, policy action must address regional disparities, institutional constraints, and structural economic imbalances.
First, regionally differentiated strategies are essential. In eastern regions with mature land markets, rights-confirmed homestead land should be allowed to enter regulated exchanges to support rural revitalization through tourism, eldercare, and capital investment. In central areas, where integration is moderate, emphasis should be placed on improving infrastructure and public services to attract population return and support county-centered development. The western regions, where rights confirmation is incomplete, should prioritize institutional capacity building, such as digital land registration and legal awareness, ensuring foundational readiness for reform implementation.
Second, institutional barriers to factor mobility must be removed. The integration of rural and urban labor markets requires harmonized social protection and mobile vocational training. Land market reform should legalize the inclusion of collectively owned rural land in unified markets, enabling homestead land to serve as both a residential and financial asset. Capital access must improve through rural credit scoring based on confirmed land rights, supported by digital finance and inclusive lending mechanisms.
Third, the structural transformation of rural industry is critical. As the model suggests, integration momentum depends on a shift from agriculture to diverse, locally rooted non-agricultural sectors. Governments should facilitate urban-to-rural industrial transfer via collaborative parks, infrastructure co-investment, and digital economy platforms, such as smart farming and e-commerce. Industrial zoning should prioritize high-value rural sectors while safeguarding ecological and spatial integrity.
Finally, integration governance should be adaptive and data-driven. System dynamics modeling can serve as a continuous policy evaluation tool. Performance indicators, such as labor mobility, income parity, and rural industrial growth, should guide the dynamic adjustment of fiscal transfers and regional development priorities.
In sum, achieving sustained and equitable integration requires coordinated reform in land tenure, market systems, industrial structure, and governance. By embedding these components into a unified policy framework, homestead rights confirmation can serve as a transformative lever for territorial sustainability.


