Article

Spatiotemporal Dynamics and Future Climate Change Response of Forest Carbon Sinks in an Ecologically Oriented County

College of Forestry, Central South University of Forestry and Technology, Changsha 410004, China
*
Author to whom correspondence should be addressed.
Sustainability 2025, 17(14), 6552; https://doi.org/10.3390/su17146552
Submission received: 2 July 2025 / Revised: 15 July 2025 / Accepted: 16 July 2025 / Published: 17 July 2025

Abstract

Research on forest carbon sinks is crucial for mitigating global climate change and achieving carbon peaking and neutrality. However, studies at the county level remain relatively limited. This study utilized multi-source remote sensing data and the Carnegie–Ames-Stanford Approach (CASA) and soil respiration models to estimate the forest net ecosystem productivity (NEP) in Taoyuan County from 2000 to 2023. The spatiotemporal differentiation was analyzed using seasonal Mann–Kendall tests, Theil–Sen slope estimation, and standard deviation ellipses. The forest NEP for 2035 was predicted under multiple climate scenarios (SSP1-2.6, SSP2-4.5, SSP5-8.5) by applying a discrete coupling of the Patch-generating Land Use Simulation (PLUS) model, incorporating territorial spatial planning policy, and using the CASA model. The results indicated that the Taoyuan County forest NEP exhibited a fluctuating upward trend from 2000 to 2023, with higher (lower) values in the west/south (east/north). Under future warming and humidification, the overall forest NEP in Taoyuan County was projected to decrease by 2035, with predicted NEP values across scenarios ranking as SSP5-8.5 > SSP1-2.6 > SSP2-4.5. The findings offer practical insights for improving local forest management, optimizing forest configuration, and guiding county-level “dual-carbon” policies under future climate and land use change, thereby contributing to ecological sustainability.

1. Introduction

Forests are vital terrestrial ecosystems that can mitigate climate change by sequestering substantial CO2 in vegetation and soils, thus acting as major terrestrial carbon sinks and reservoirs [1,2]. The quantification of forest carbon sinks typically relies on vegetation productivity indicators. Among these, net ecosystem productivity (NEP), defined as net primary productivity (NPP) minus soil respiration (Rh), is a key metric for assessing carbon sink capacity in terrestrial ecosystems [3,4]. The current methods for measuring forest carbon sinks primarily involve sample plot inventory [5], eddy covariance techniques [6], model simulations [7], and remote sensing-integrated model simulations [8,9,10]. Compared with the limitations in scale, cost, or parameter acquisition associated with the former three methods, model simulations integrated with remote sensing technology offer distinct advantages in forest carbon sink research owing to their capacity for the efficient acquisition of large-scale spatiotemporal data.
Despite significant recent progress in the investigation of spatiotemporal changes in NEP and its drivers [11,12,13,14,15], refined projections of forest NEP under future climate change scenarios, particularly at the county level, a crucial scale for sustainable resource utilization and management [16], remain relatively limited. Existing prediction studies face several challenges, such as (1) spatial resolution limitations, in which commonly used medium- and low-resolution data (e.g., MODIS) often fail to adequately capture local heterogeneity for refined county-level analysis [17] and necessitate higher-resolution data to support county-specific NEP analysis and prediction; (2) model and method limitations, wherein some models require extensive parameters [18] or overlook land cover change impacts on NEP [19], and only a few future scenarios integrate policy factors such as local territorial spatial planning, thereby limiting practical prediction guidance; and (3) prediction format limitations, in which some studies only predict the total NEP values, failing to detail spatial distributions [20], or overly rely on historical trends, hindering the accurate capture of complex future dynamics [21].
To address these limitations, this study aimed to present a refined framework for county-level forest NEP spatiotemporal analysis and prediction that integrates multi-source high-resolution remote sensing data, various models, and territorial spatial planning policy. The core advantage of this framework lies in its integrated approach; it overcomes the resolution limitations of traditional remote sensing data by employing a random forest (RF) classification and an enhanced linear regression-based fusion model (ELRFM) for spatiotemporal data fusion. In addition, it can accurately assess historical NEP dynamics by combining the Carnegie–Ames–Stanford Approach (CASA) model with an empirical Rh model. The framework also enables policy-informed multi-scenario simulations of future NEP through the discrete coupling of the PLUS and CASA models. Compared with previous research [22], this framework significantly improves the refinement and practical relevance of county-level forest NEP predictions.
Taoyuan County, which is characterized by abundant forest resources and an excellent ecological environment, is recognized as a national model for ecological environmental protection management and a national demonstration county for ecological civilization construction [23]. These attributes make it a typical and representative area for county-level forest carbon sink research.
In this context, the main objectives of this study are as follows: (1) to generate high-resolution (30 m) land cover and normalized difference vegetation index (NDVI) datasets for Taoyuan County spanning 2000–2023; (2) to estimate the forest NEP in Taoyuan County from 2000 to 2023 using the CASA model and an empirical Rh model and analyze its spatiotemporal variations; (3) and to predict the 2035 forest NEP under multiple climate scenarios (Shared Socioeconomic Pathway (SSP)1-2.6, SSP2-4.5, SSP5-8.5) by discretely coupling the territorial spatial planning policy-informed PLUS model with the CASA model, then comparing the scenario-based carbon sink differences to inform regional sustainable development paths.

2. Materials and Methods
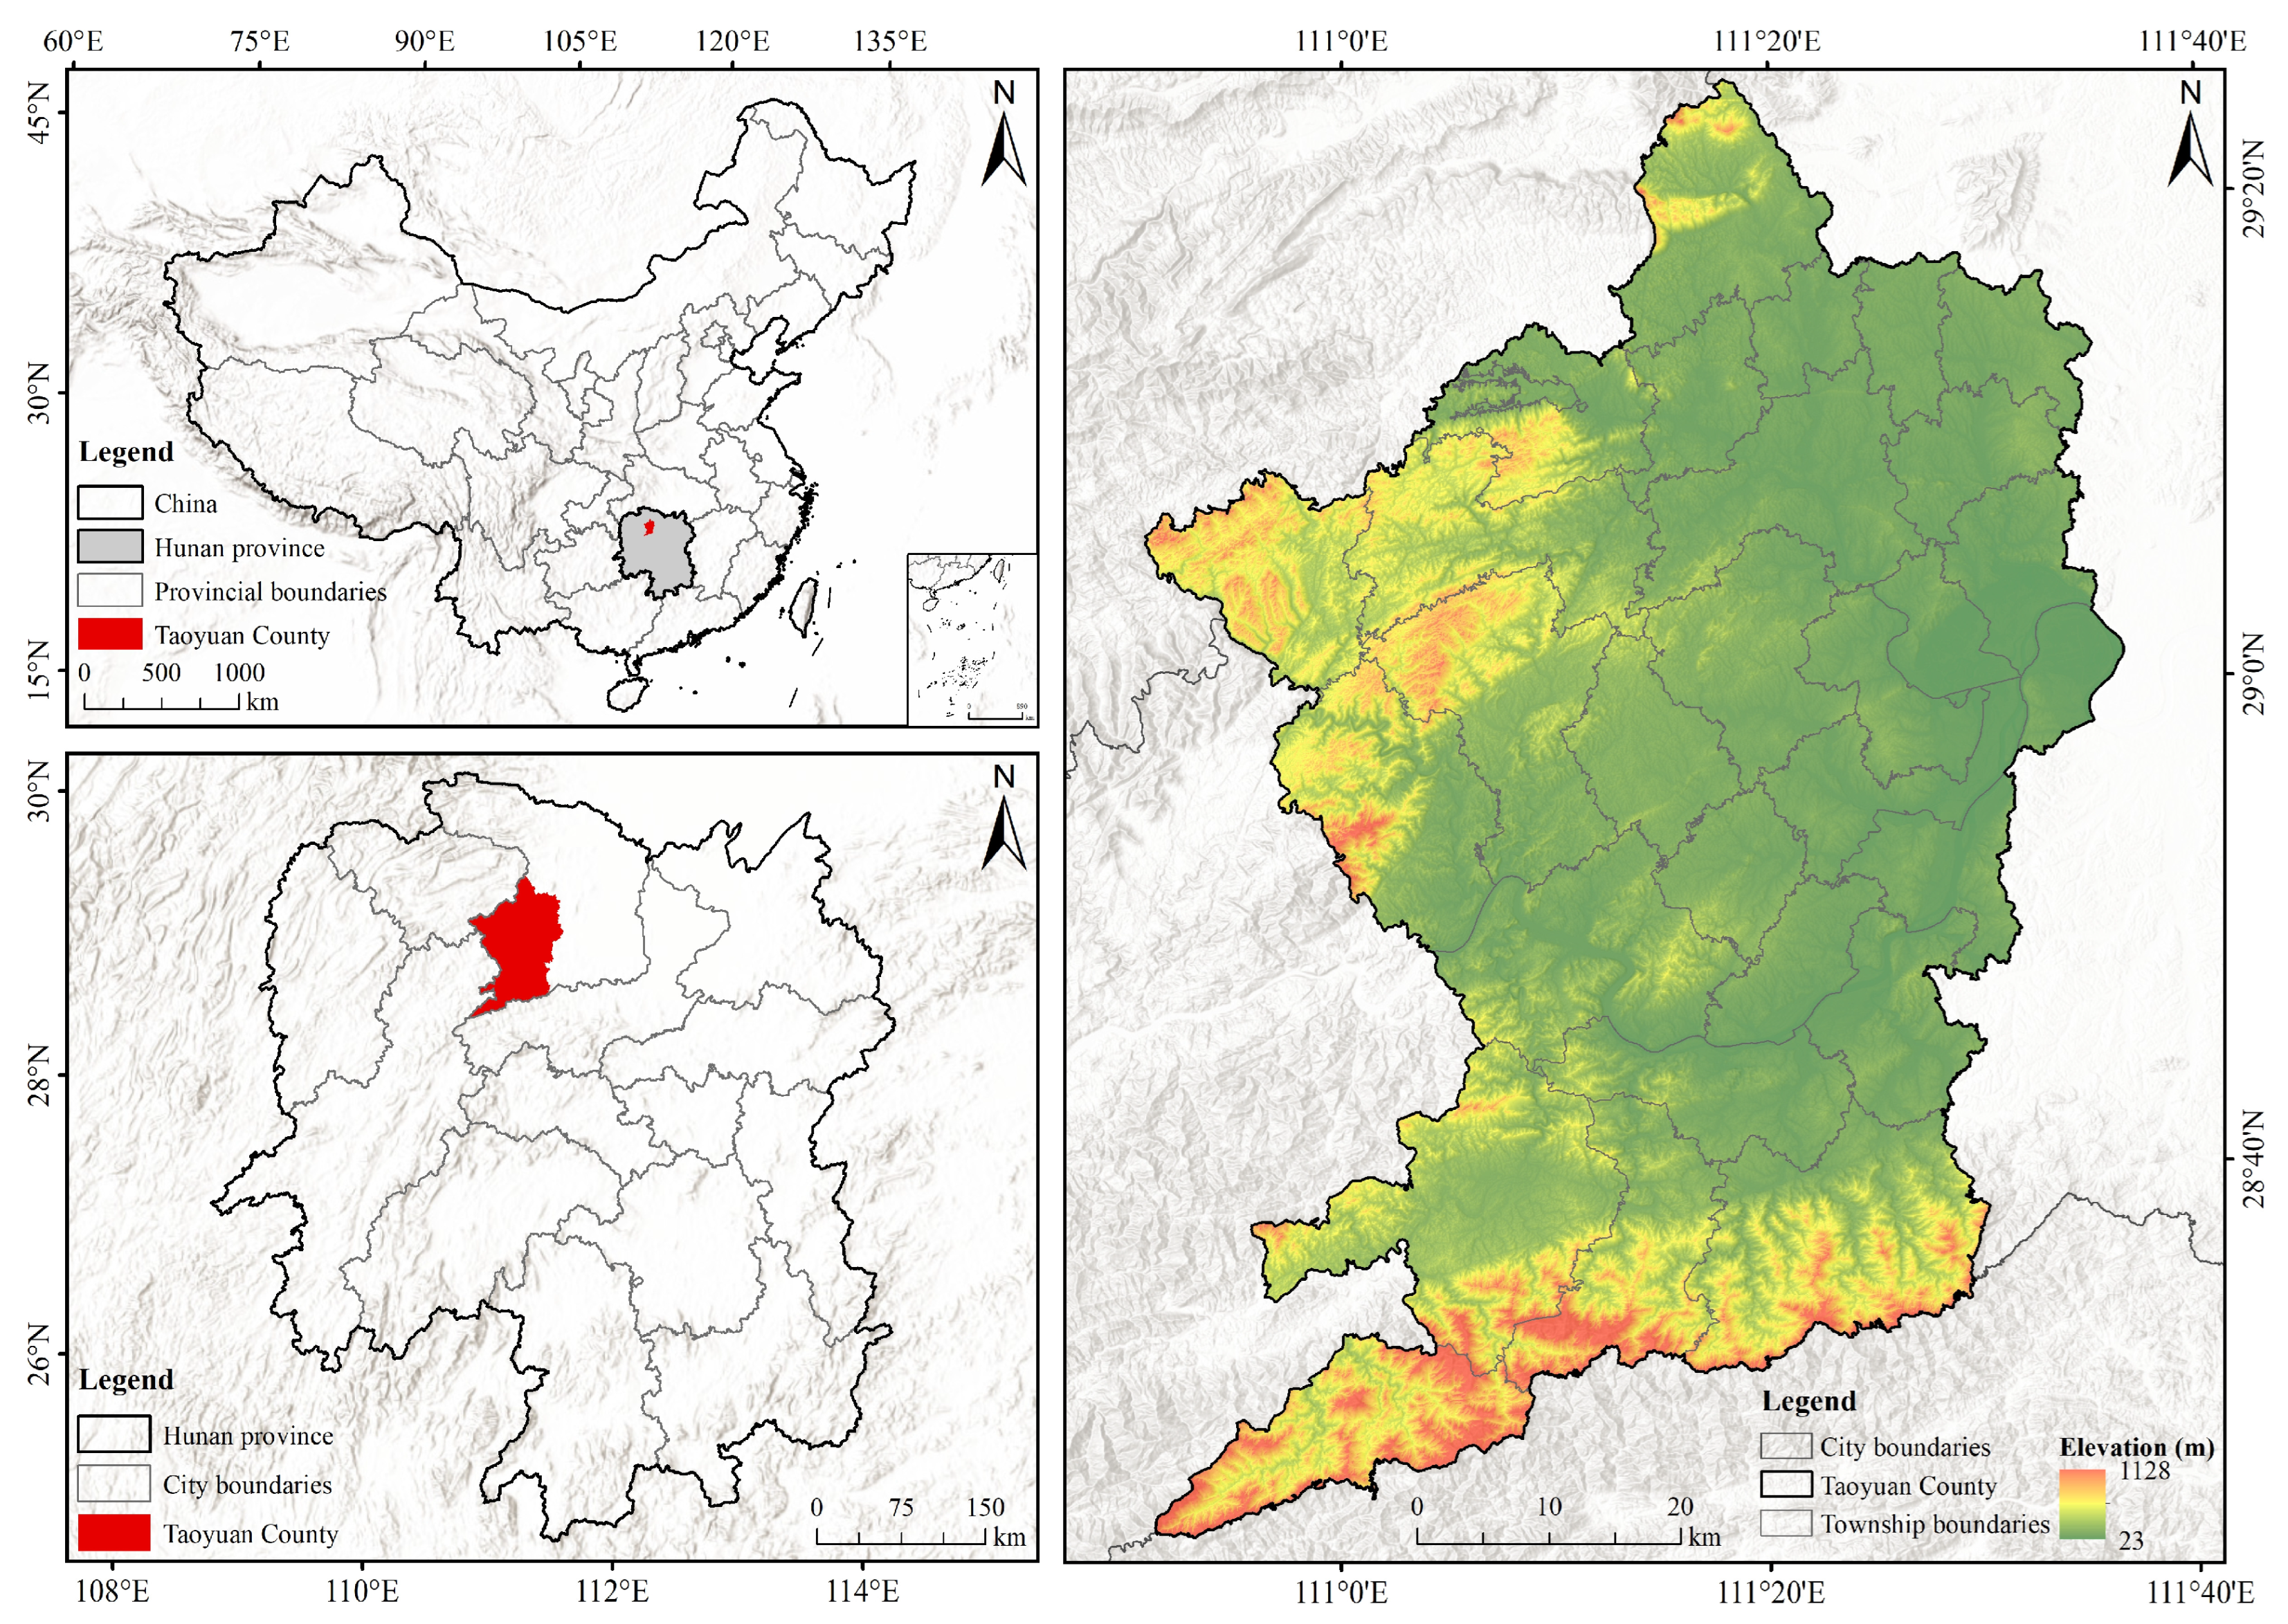
2.1. Study Area

Taoyuan County (Figure 1), located in the northwestern Hunan Province, China (28°24′–29°24′ N, 110°51′–111°36′ E), occupies a transition zone between the western Hunan mountains and the Dongting Lake plain. Positioned between the Xuefeng and Wuling mountain branches, its topography features mountains on three sides. Its mid-subtropical monsoon climate features an average annual temperature of 16.5 °C and precipitation of 1437 mm. These favorable hydrothermal conditions promote forest growth. As a key forestry county in Hunan, it has a strong forestry foundation that offers ideal natural conditions for forest carbon sink research, supporting the national goals for carbon peaking and neutrality.

2.2. Data Sources and Processing
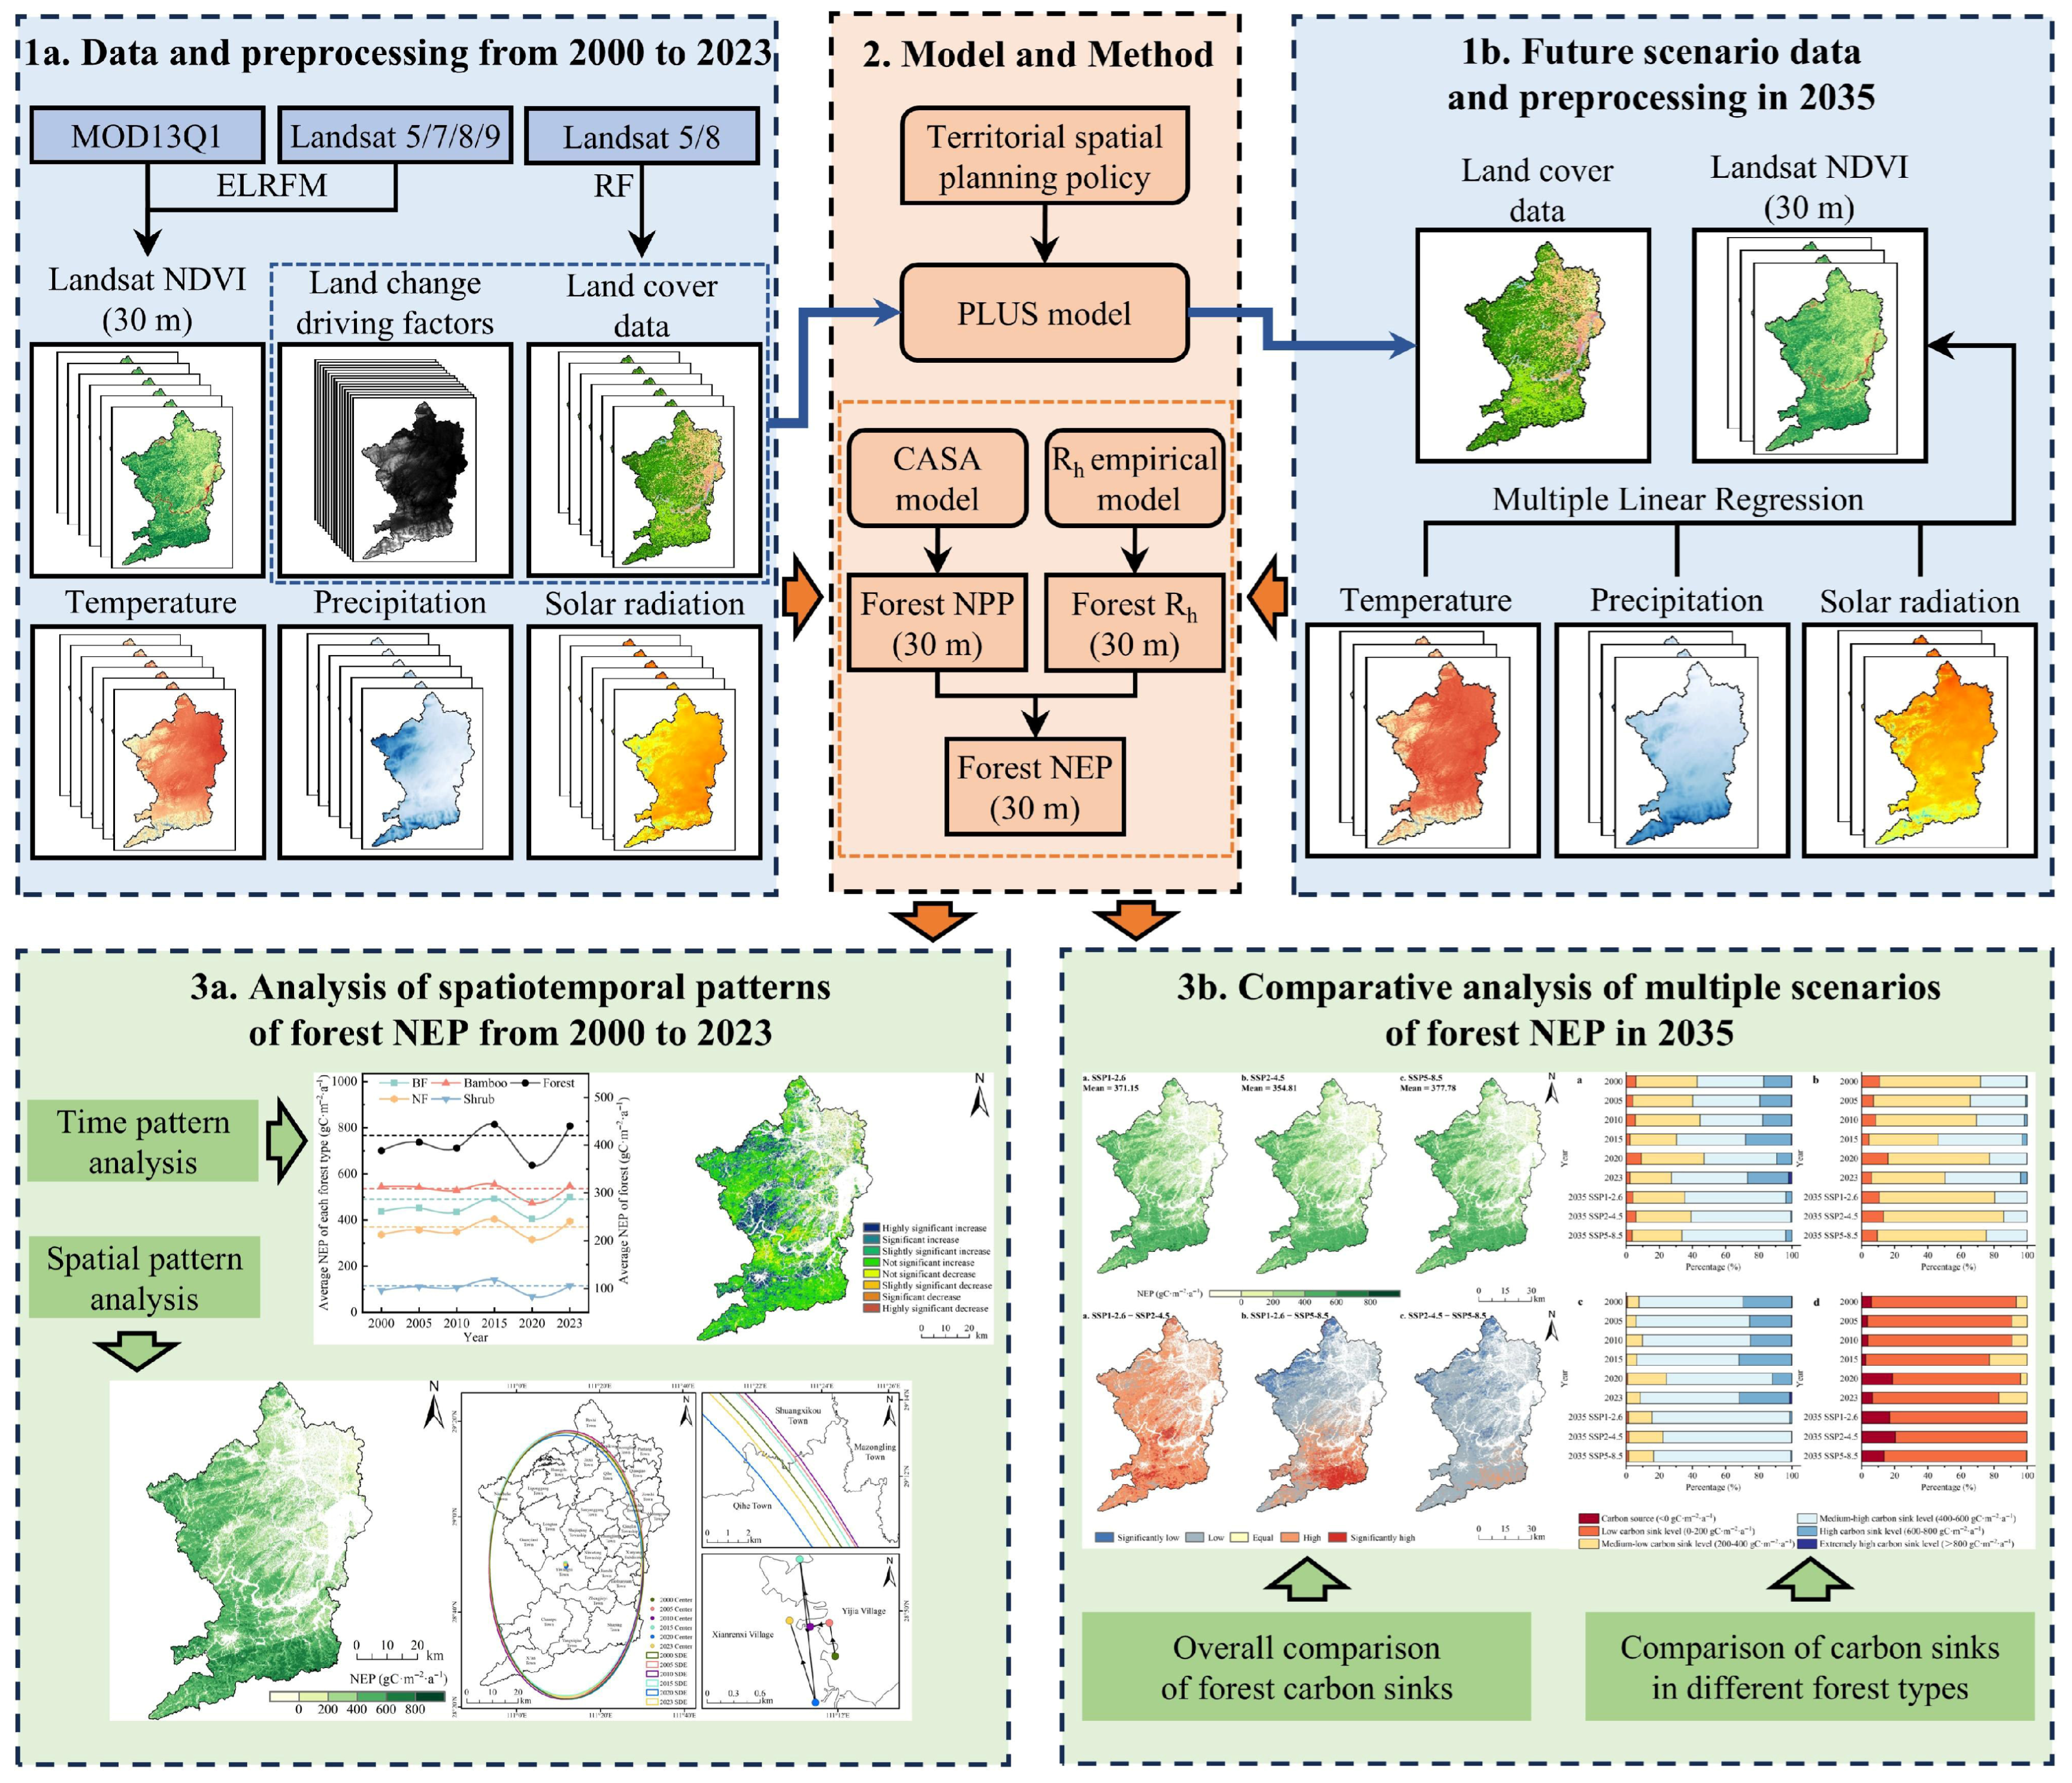
Table 1 presents the main data types utilized in this study, including remote sensing, meteorological, topographical, socio-economic, and auxiliary data.
This study used MOD13Q1 NDVI data and Landsat 5/7/8/9 imagery (2000–2023) from the Google Earth Engine (GEE). The MOD13Q1 NDVI data were Savitzky–Golay filtered on the GEE, and the Landsat 5/7/8/9 NDVI was also GEE-calculated. For land cover classification, Landsat 5/8 images of the study area in April–October for the years 2000, 2005, 2010, 2015, 2020, and 2023 with cloud cover under 30% were selected. These images underwent cloud removal to produce the image dataset.
Meteorological data, including historical and future monthly mean temperature, total monthly precipitation, and total monthly solar radiation, were derived from the Fine Resolution Mapping of Mountain Environment (FRMM) dataset. Historical data were from the ERA5-Land reanalysis. Future data for the three SSP scenarios (SSP1-2.6, SSP2-4.5, and SSP5-8.5) were obtained from publicly available Coupled Model Intercomparison Project Phase 6 datasets generated by the AWI-CM-1-1-MR model.
The Copernicus digital elevation model provided topographical data. Slope and aspect were then calculated from this DEM using ArcMap 10.8. The socio-economic data included population density from Landscan, Gross Domestic Product per capita from the Geo-Remote Sensing Ecological Network, road data (railroads, expressways, national, provincial, and county roads) from the National Geographic Information Resource Inventory Service System, and government office locations from OpenStreetMap. Euclidean distances to the nearest roads and government office locations were also computed.
Auxiliary data included the Taoyuan County administrative boundaries, 2023 comprehensive forest, grassland, and wetland monitoring data, and territorial spatial planning policy data. The hydrographic network was extracted from the 2023 monitoring data, and the Euclidean distances to the nearest water features were then calculated.
All datasets were clipped to the county administrative boundary, projected to WGS_1984_UTM_Zone_49N, and raster data standardized to 30 m resolution.

2.3. Methodology

Figure 2 illustrates the research process, which began with the preparation of historical 2000–2023 and future 2035 data. Future land cover was simulated using the PLUS model that incorporated the territorial spatial planning policy, and future climate data were sourced from AWI-CM-1-1-MR model outputs within publicly available Coupled Model Intercomparison Project Phase 6 datasets. Subsequently, forest NEP was estimated for both historical and future periods. Finally, historical forest NEP spatiotemporal patterns were analyzed, and the multi-scenario future forest NEP was compared.

2.3.1. Land Cover Classification

Landsat 5/8 images from 2000, 2005, 2010, 2015, 2020, and 2023 were classified using the RF algorithm through its ENVI 5.6 plug-in. This process, which incorporated spectral, texture, and topographic features, generated the Taoyuan County land cover data for these six periods. Eight land cover classes were determined: broadleaved forest (BF), needle-leaved forest (NF), bamboo, shrub, farmland, water body, built-up land, and bare land. Table S1 in the Supplementary Materials details the RF input features.

2.3.2. NDVI Spatiotemporal Fusion

On the GEE, the ELRFM algorithm generated a long-term, 30 m resolution NDVI dataset (2000–2023) by spatiotemporally fusing the MOD13Q1 and Landsat NDVI data. This pixel-level linear model improves spatiotemporal fusion accuracy using reflectance–time relationships between high-resolution images and a residual assignment strategy. Bai et al. [24] detail the specific calculations. Data were fused seasonally for spring (March–May), summer (June–August), autumn (September–November), and winter (December–February), and the monthly maximum values were composited. Because MODIS data were unavailable before February 2000, the January 2000 NDVI was derived from Landsat 5/7 imagery by maximum value compositing.

2.3.3. NPP and NEP Estimation

The NPP was calculated using the CASA model, which estimates NPP from the vegetation’s absorbed photosynthetically active radiation and actual light use efficiency ε [25]. The NPP calculation details are in Text S1 and Table S2 in the Supplementary Materials. We used the empirical Rh model of Pei et al. [26], which had been previously applied in Hunan Province by Zhao and Mo [27], to estimate the Taoyuan County Rh. Text S2 in the Supplementary Materials details the NEP and Rh calculations.

2.3.4. Seasonal Mann–Kendall (MK) Test and Theil–Sen Slope Estimation

The seasonal MK test [28] and Theil–Sen slope estimation [29], which derive overall trends by comparing monthly data, are widely applied in water environment research [30,31]. This study employed the pyMannKendall package [32], utilizing its seasonal versions of these tests, to analyze the trends in the 72-month forest NEP time series.

2.3.5. Standard Deviation Ellipse

The standard deviational ellipse is an effective spatial analysis method that is widely applied in the social and economic fields, among others. This method was applied to analyze the spatiotemporal migration trajectory of the Taoyuan County forest NEP. For specific calculation formulas, refer to Wu et al. [33].

2.3.6. PLUS Model

The PLUS model integrates two modules, the Land Expansion Analysis Strategy and Cellular Automata with Multiple Types of Random Patch Seeds [34]. A total of 15 driving factors, including physical geography, socioeconomics, and accessibility, informed the land cover simulation. Land development probabilities were corrected using the Taoyuan County 2023 comprehensive forest, grassland, and wetland monitoring data and its territorial spatial planning policy vector data. The driving factors, restriction matrices, neighborhood weights, and correction rules are detailed in Tables S2 and S3 in the Supplementary Materials.

2.3.7. Multiple Linear Regression Prediction

Multiple linear regression models using meteorological data are widely adopted for NDVI prediction [35,36]. In this study, multiple linear regression was used to predict the monthly NDVI at the pixel scale for each 2035 climate scenario. Equations used NDVI as the dependent variable, with temperature, precipitation, and solar radiation as independent variables (details in Text S3 in the Supplementary Materials).

3. Results

3.1. Factors of Forest NEP Simulation and Prediction

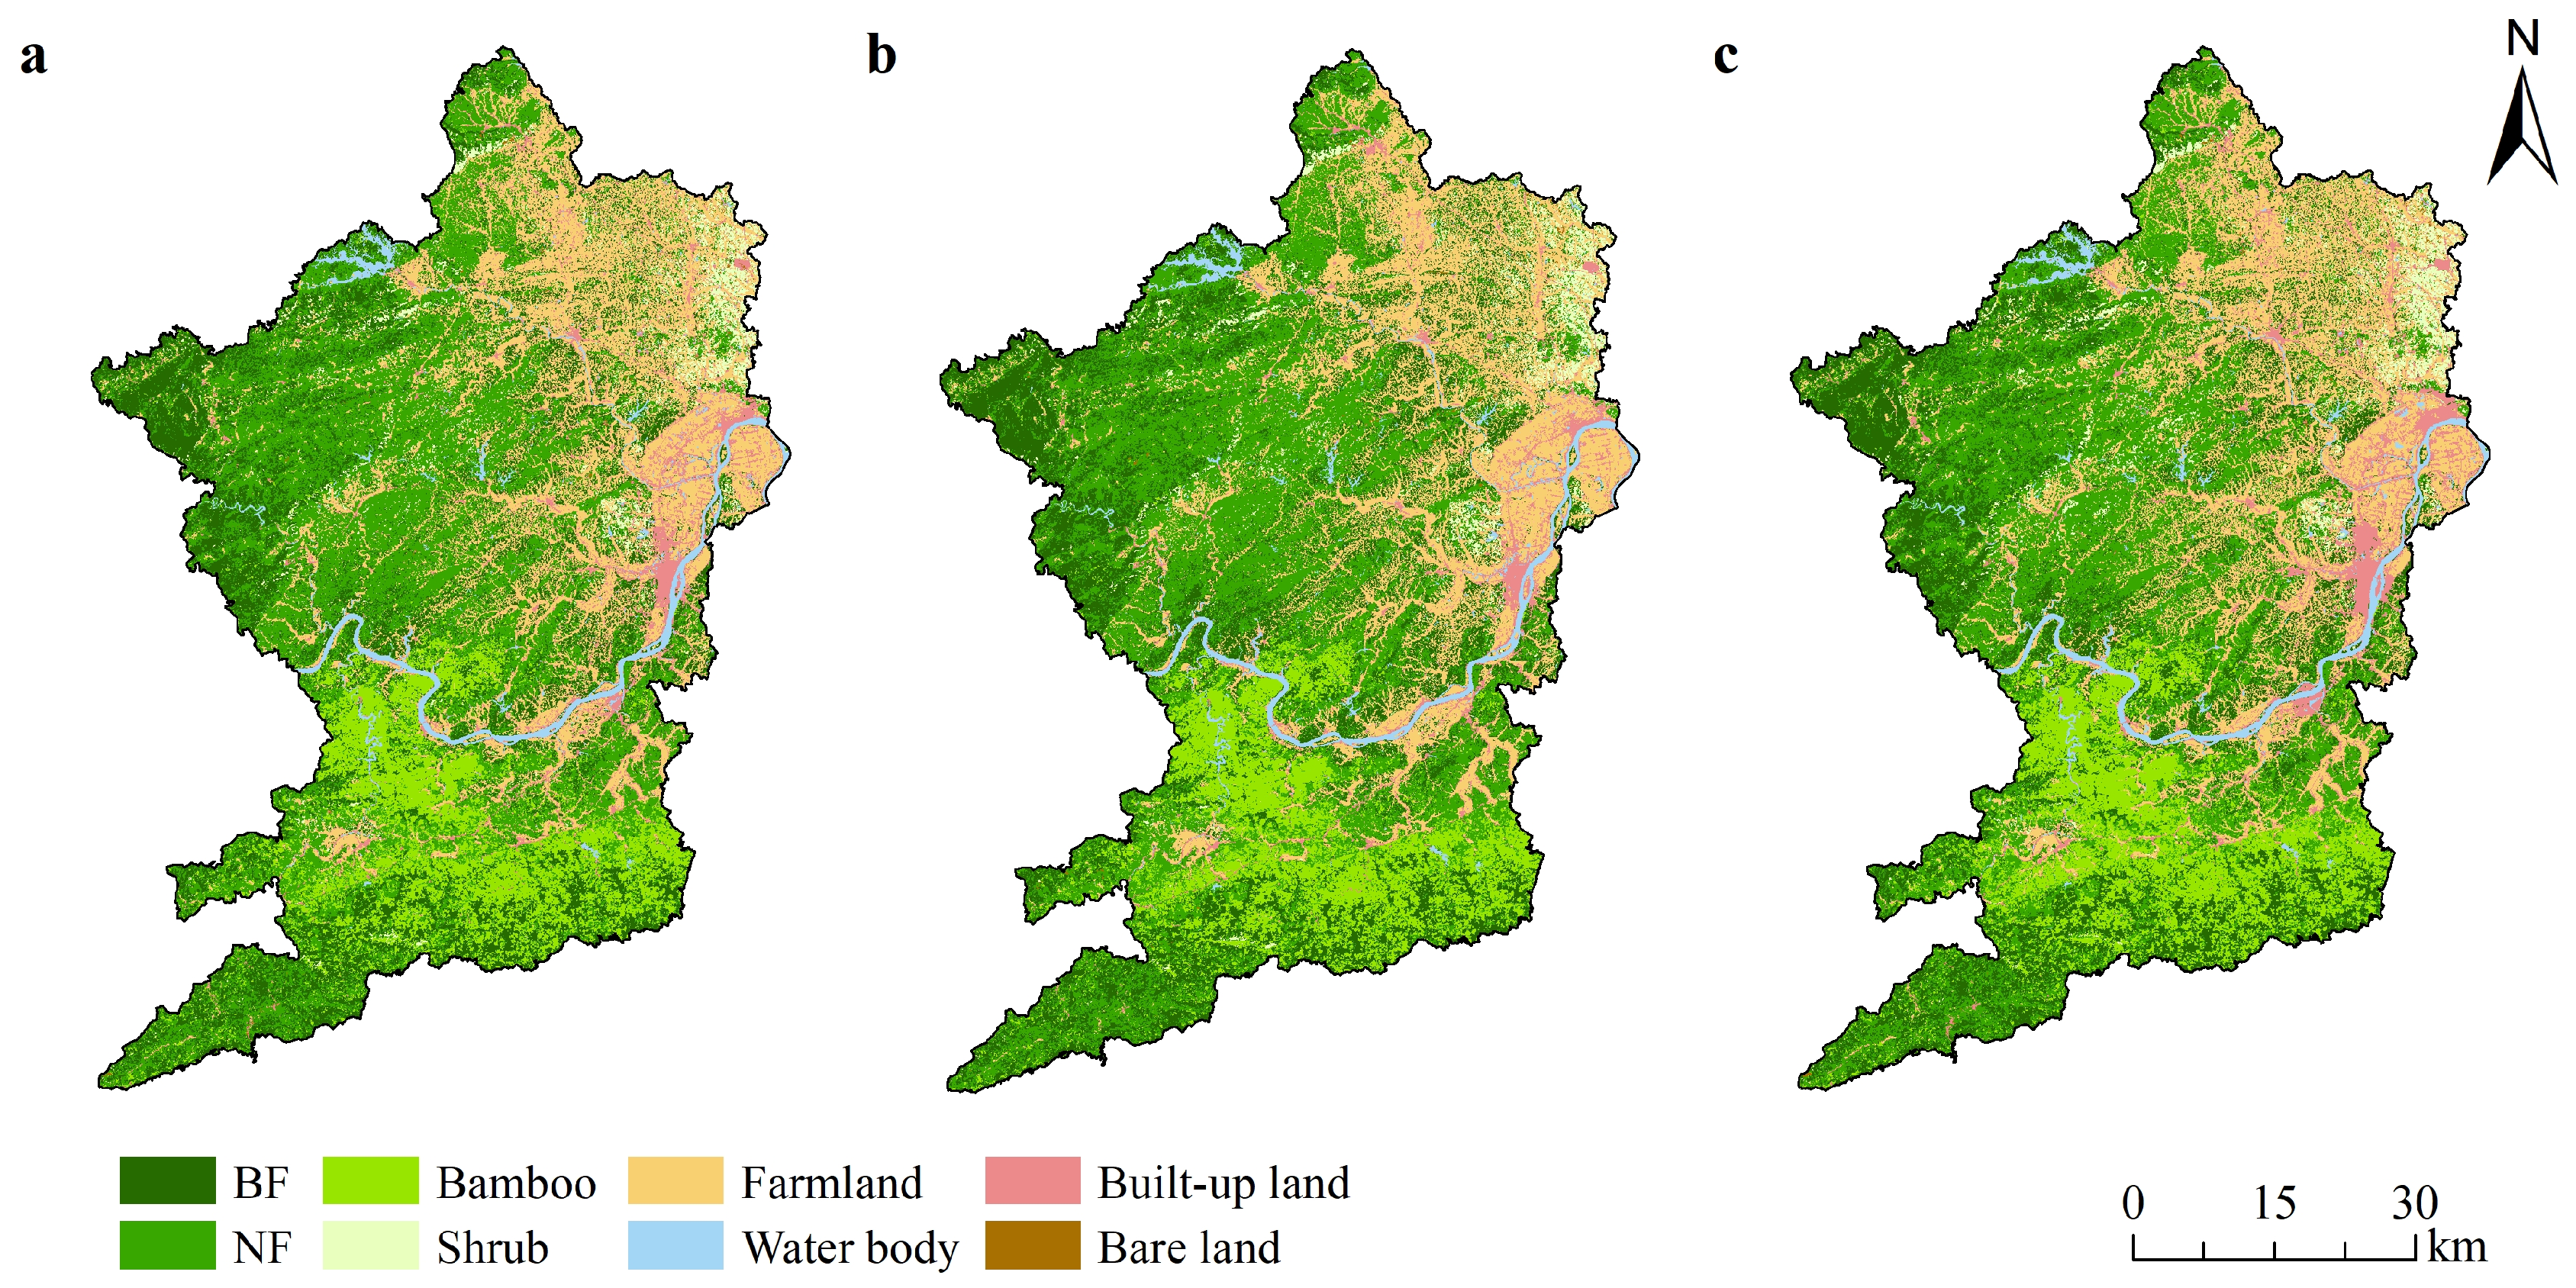
3.1.1. Land Cover Type Variation and Prediction

The total forest area in Taoyuan decreased by 55.69 km2 between 2000 and 2023 (Table 2). The NF area was the sole forest type to shrink, diminishing by 139.92 km2. Conversely, the BF, bamboo, and shrub areas gradually expanded by 19.78, 41.80, and 22.65 km2, respectively. In non-forest areas, built-up land increased substantially by 118.13 km2, mainly through farmland conversion. The farmland area consequently decreased by 61.83 km2. The water body and bare land areas remained relatively stable.
Figure 3 shows actual and simulated 2023 land cover for Taoyuan County alongside the simulated 2035 land cover. The 2035 land cover simulation, via the PLUS model, incorporated the Taoyuan County territorial spatial planning policy. The simulation results projected a continued decrease in the county’s forest area by 2035 relative to 2023.

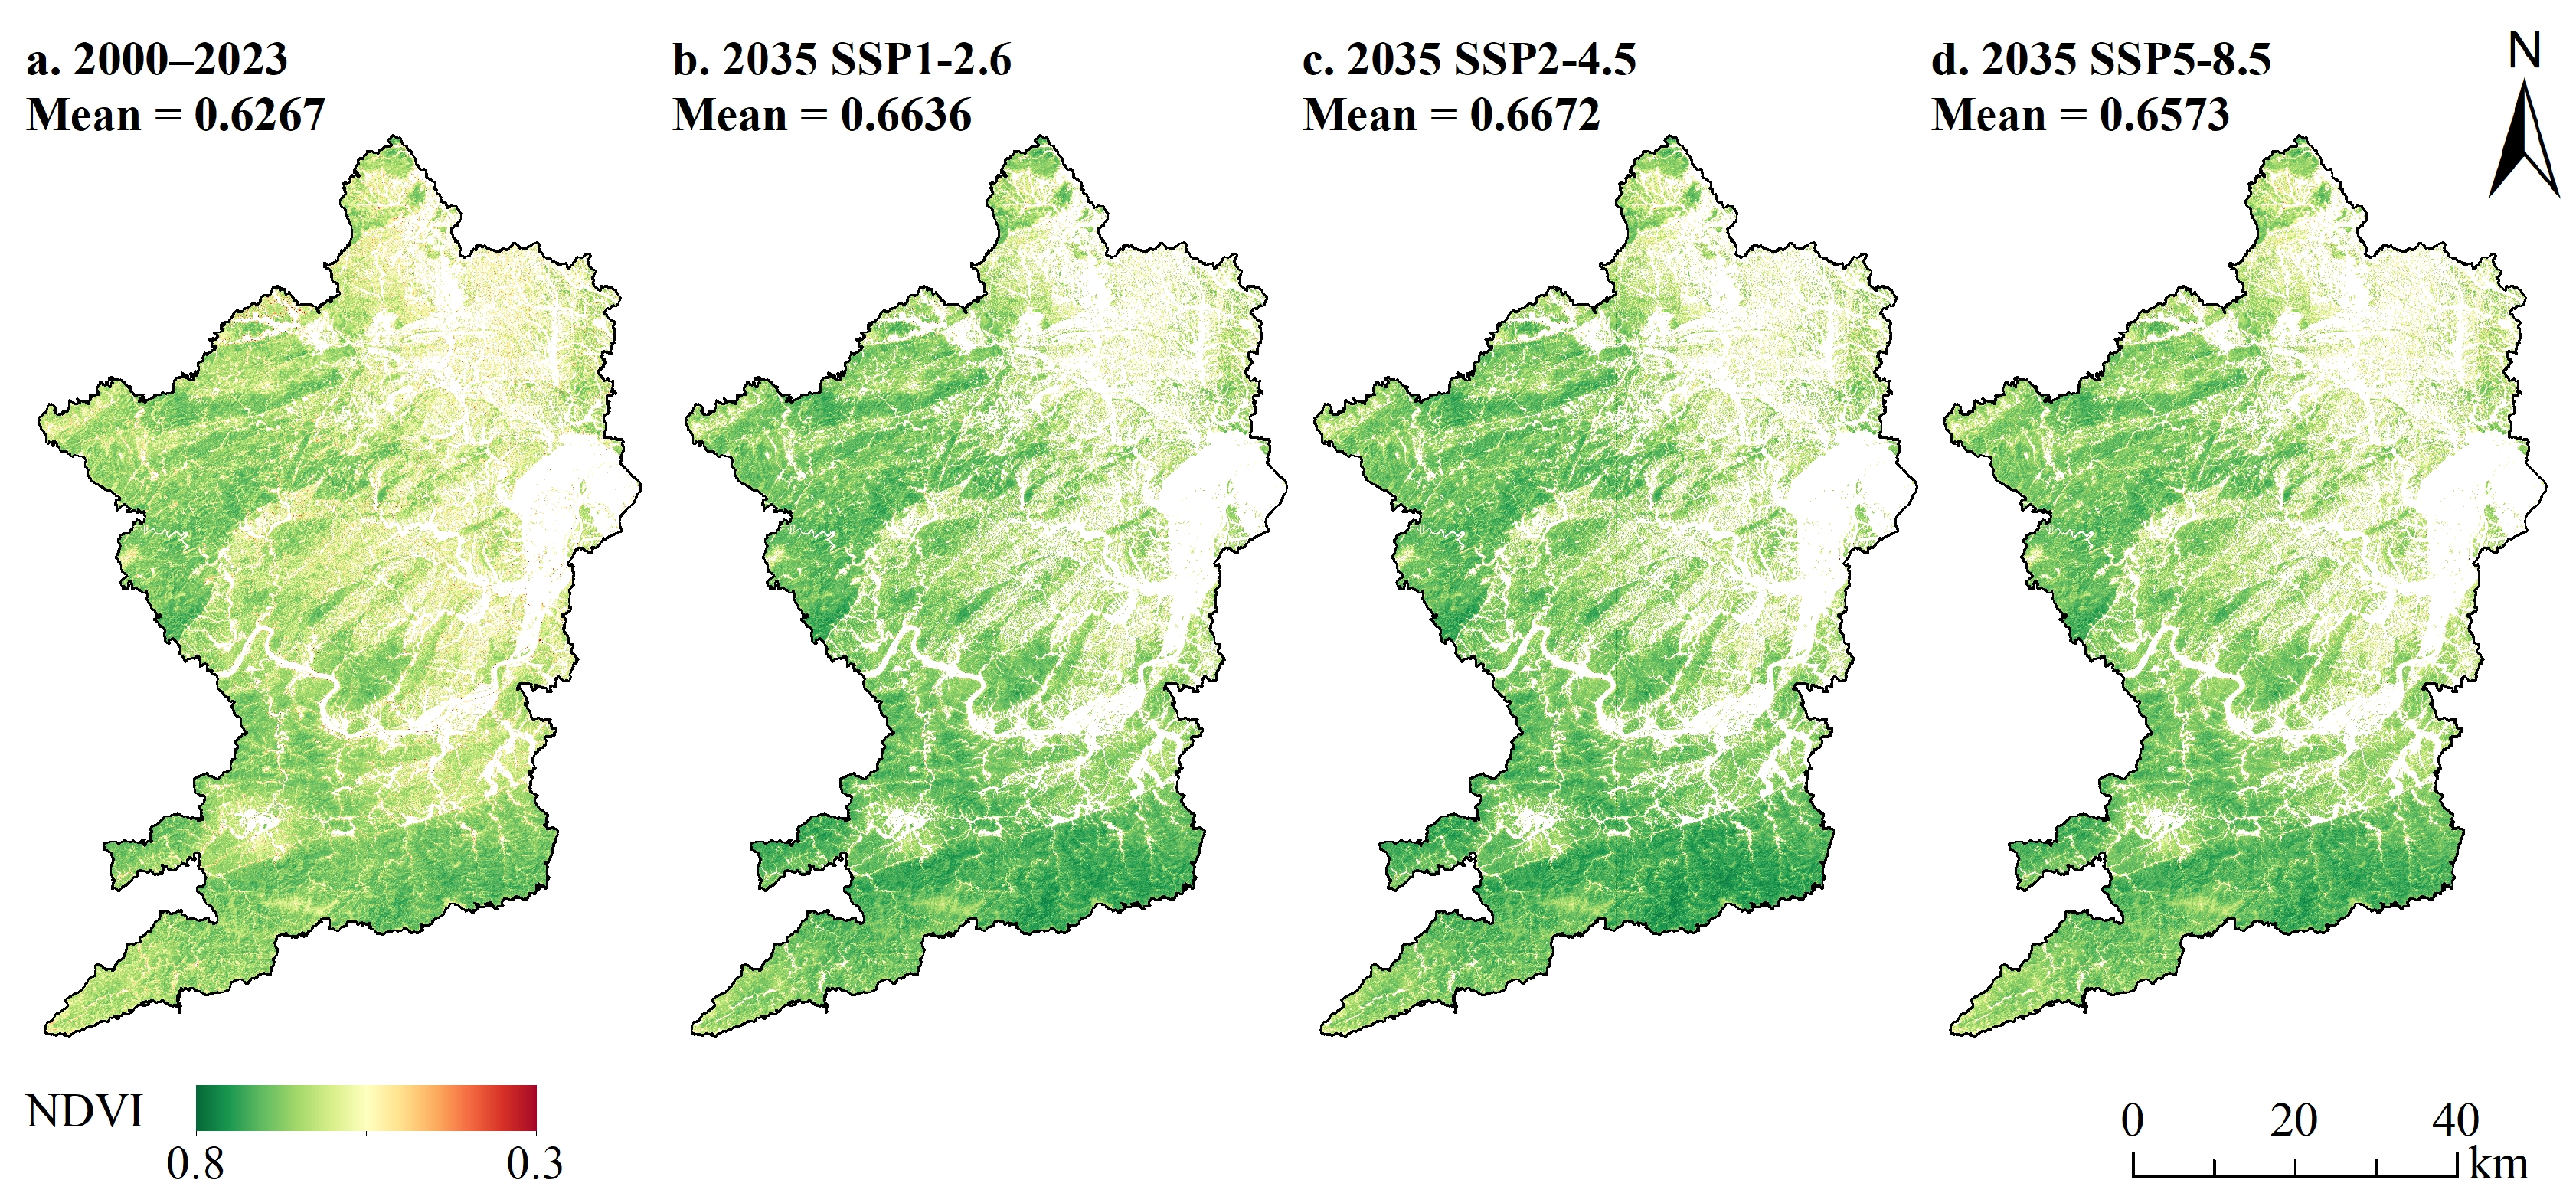
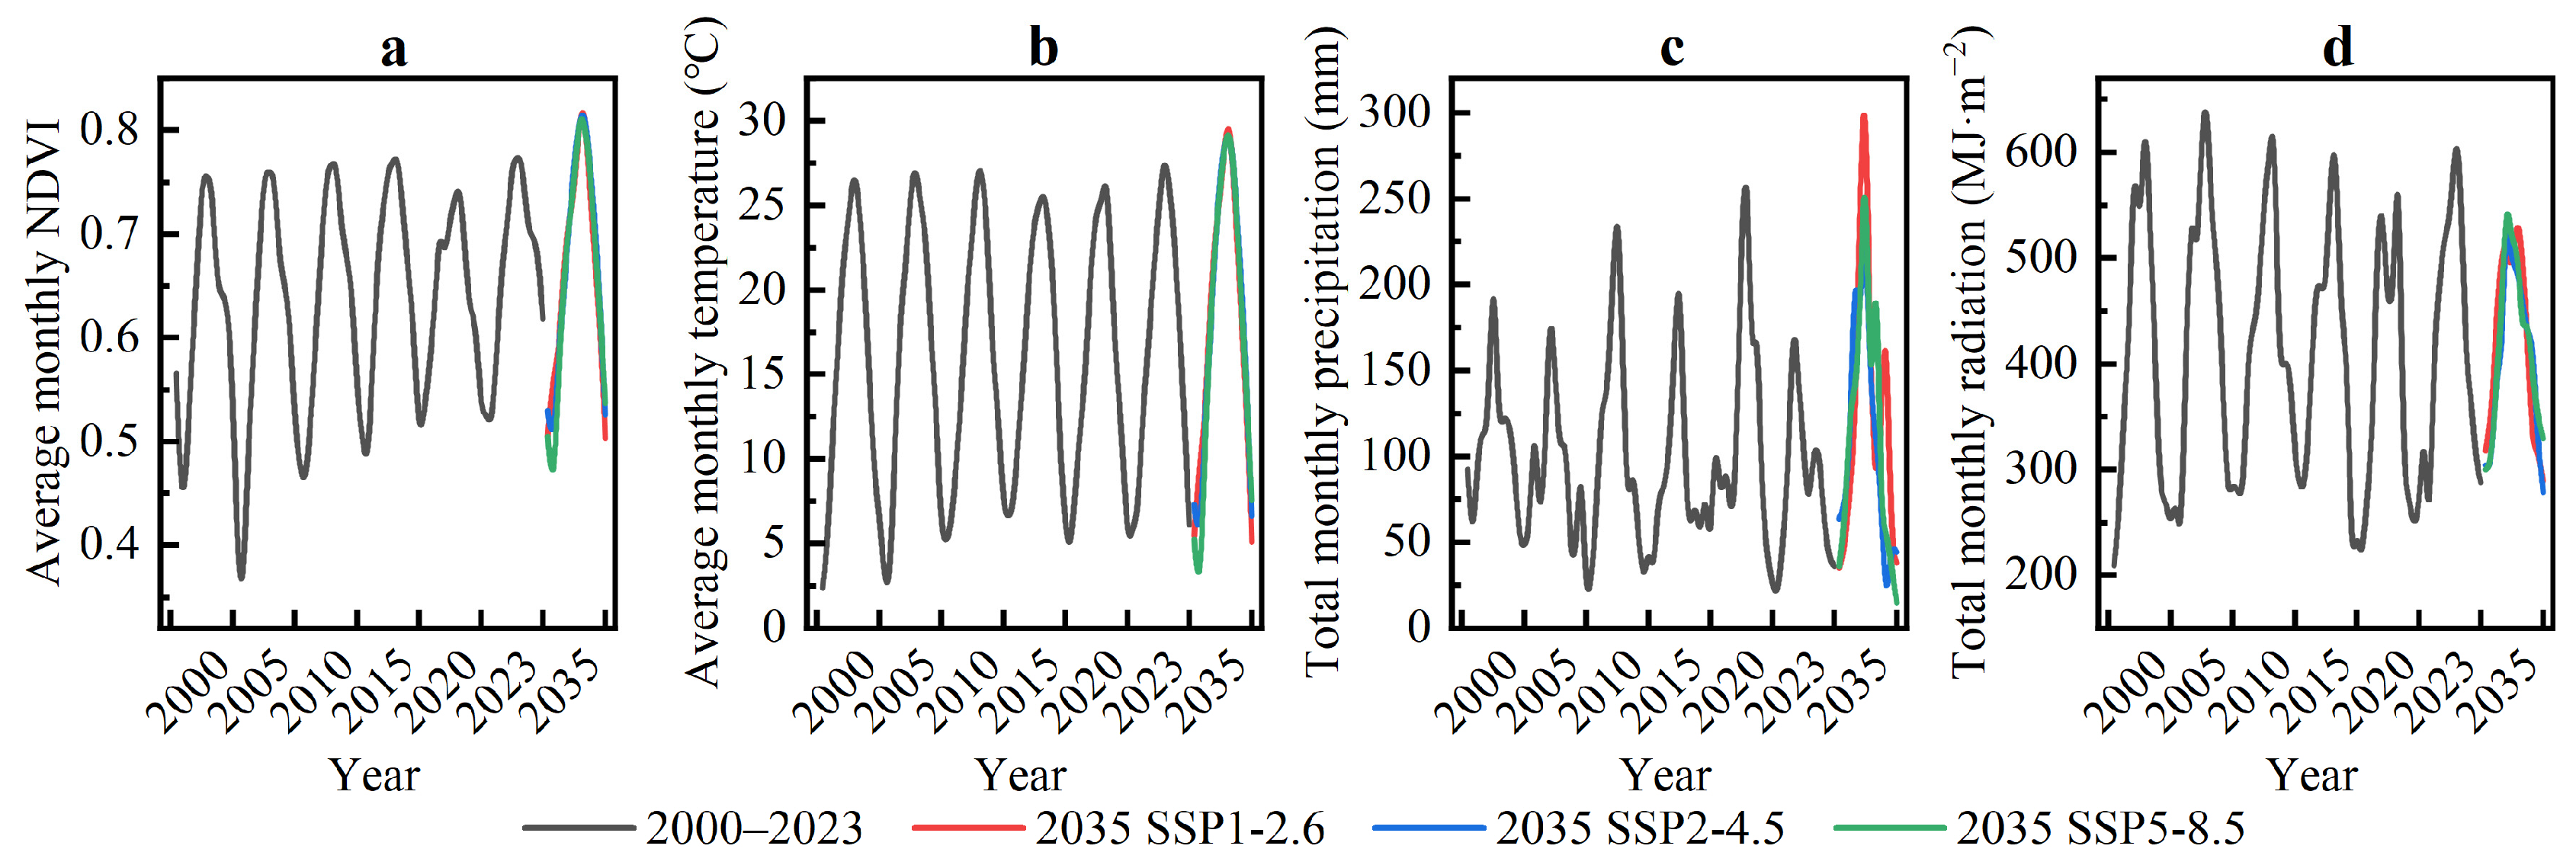
3.1.2. NDVI Variation and Prediction

Figure 4 shows that the Taoyuan County forest NDVI (2000–2023) generally increases from northeast to southwest. This correlates with land cover patterns, which are predominantly farmland and built-up land in the east and north, and forests in the west and south. The predicted 2035 NDVI spatial distributions under the three climate scenarios largely mirrored the historical pattern. Overall, the 2035 forest NDVI under all three scenarios projected winter decreases and summer increases, with more pronounced seasonal differentiation (Figure 5).

3.1.3. Historical and Future Climate Variation

The monthly mean temperature (2000–2023) ranged from 2.21 to 27.96 °C, with regular seasonal variations and a slight upward trend (Figure 5). The 2035 monthly mean temperature trends under the three scenarios resembled those in historical years but with generally higher values. The annual mean temperatures were ranked as follows: SSP2-4.5 (18.11 °C) > SSP1-2.6 (18.08 °C) > SSP5-8.5 (17.53 °C).
The total monthly precipitation (2000–2023) ranged from 11.70 to 288.41 mm, with regular seasonal variations and a slight overall decrease. The rainy season precipitation showed a fluctuating increase, peaking in 2020, whereas the dry season precipitation generally decreased despite a 2020 peak. The 2035 monthly total precipitation trend was more pronounced under the three scenarios compared with the historical trend. The annual total precipitation was ranked as follows: SSP1-2.6 (1494.74 mm) > SSP5-8.5 (1362.41 mm) > SSP2-4.5 (1310.34 mm).
The monthly total solar radiation (2000–2023) ranged from 198.71 to 662.73 MJ·m−2, exhibiting regular seasonality and a slight decrease. It generally peaked during summer, but was anomalously low in summer 2020. The 2035 monthly total solar radiation trend under the three scenarios was more moderate than the historical trend. The annual total solar radiation was ranked as follows: SSP1-2.6 (5012.87 MJ·m−2) > SSP5-8.5 (4976.27 MJ·m−2) > SSP2-4.5 (4858.24 MJ·m−2).

3.2. Spatiotemporal Variation in Forest NEP

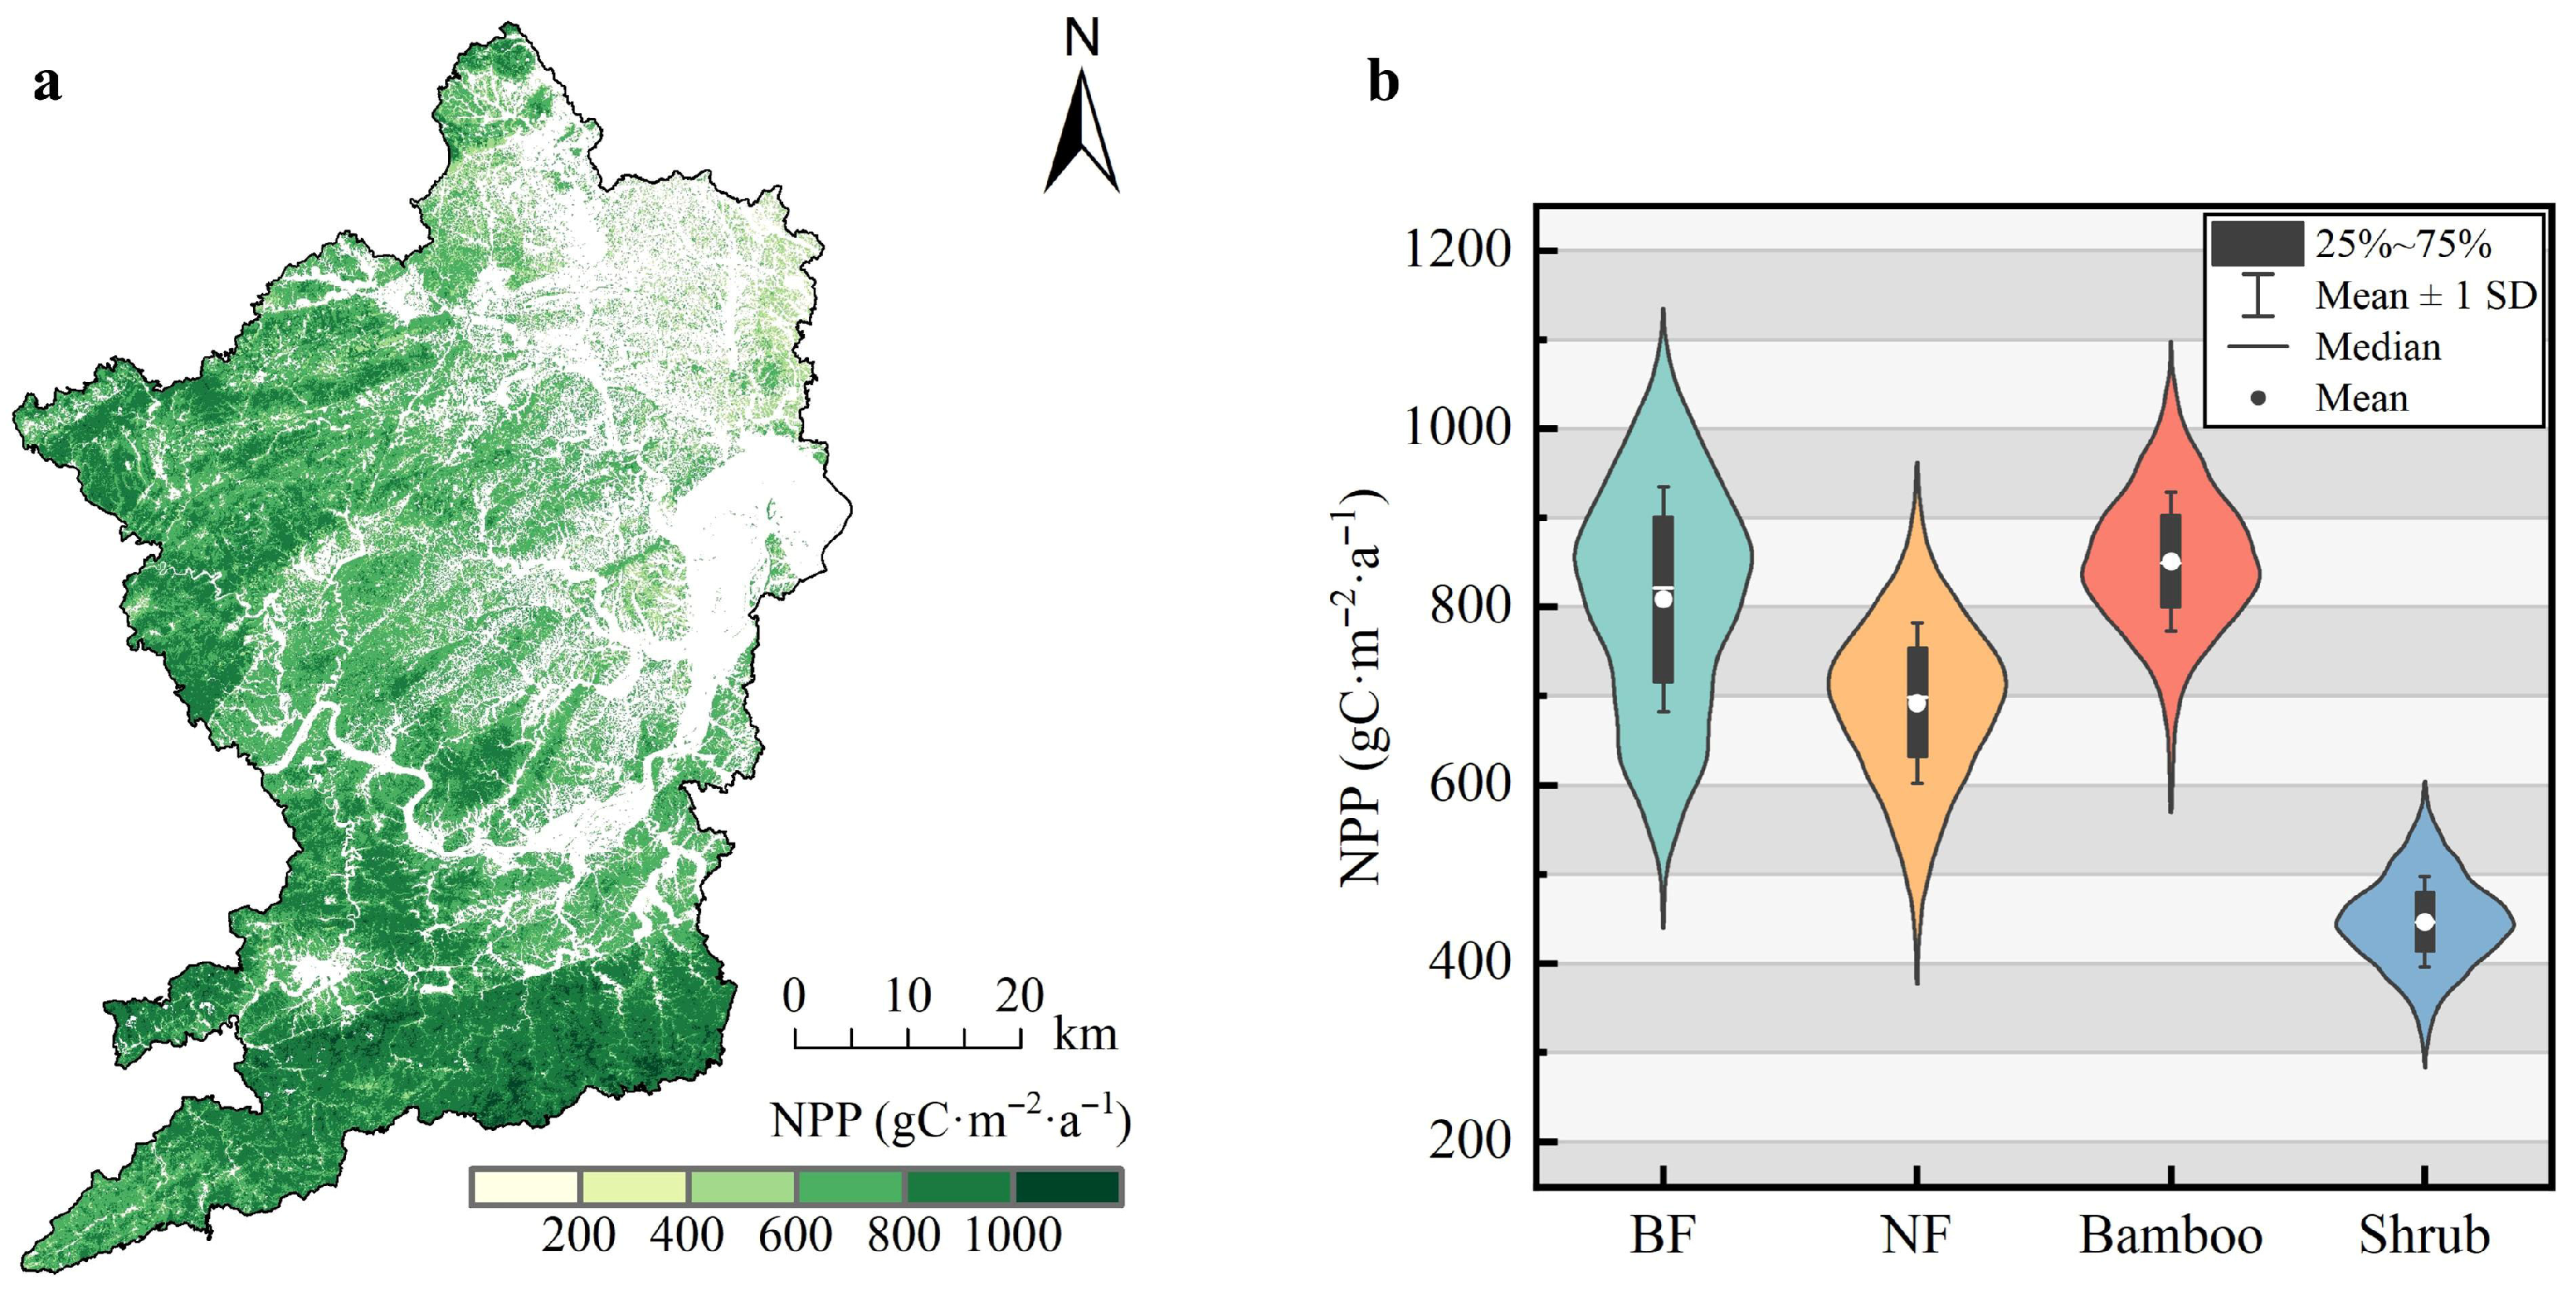
3.2.1. Basic Characteristics of Forest NPP

The multi-year average forest NPP of Taoyuan County (Figure 6) was 740.12 gC·m−2·a−1, with 52.24% of the area having values between 600 and 800 gC·m−2·a−1. The spatial pattern was generally high in the west/south and low in the east/north. Western and southern regions exhibited higher NPP (mostly 600–1000 gC·m−2·a−1), while the northeast had lower NPP (mainly 200–400 gC·m−2·a−1). The central region, a transition zone, showed NPP values primarily between 400 and 600 gC·m−2·a−1.
The multi-year mean NPP ranked by forest type was as follows: bamboo (852.35 gC·m−2·a−1) > BF (806.38 gC·m−2·a−1) > NF (692.54 gC·m−2·a−1) > shrub (446.98 gC·m−2·a−1); these results were consistent with those of Li et al. [37]. Although the BF and bamboo NPP levels were similar, the BF distributions (680–940 gC·m−2·a−1) were more dispersed and had less distinct peaks, indicating greater fluctuations. Meanwhile, the bamboo NPP was more centralized (770–930 gC·m−2·a−1). The NF NPP showed a clear single-peak distribution (600–780 gC·m−2·a−1), while the shrub NPP was significantly lower (400–500 gC·m−2·a−1), its distinct peaks reflecting slower, stable growth.

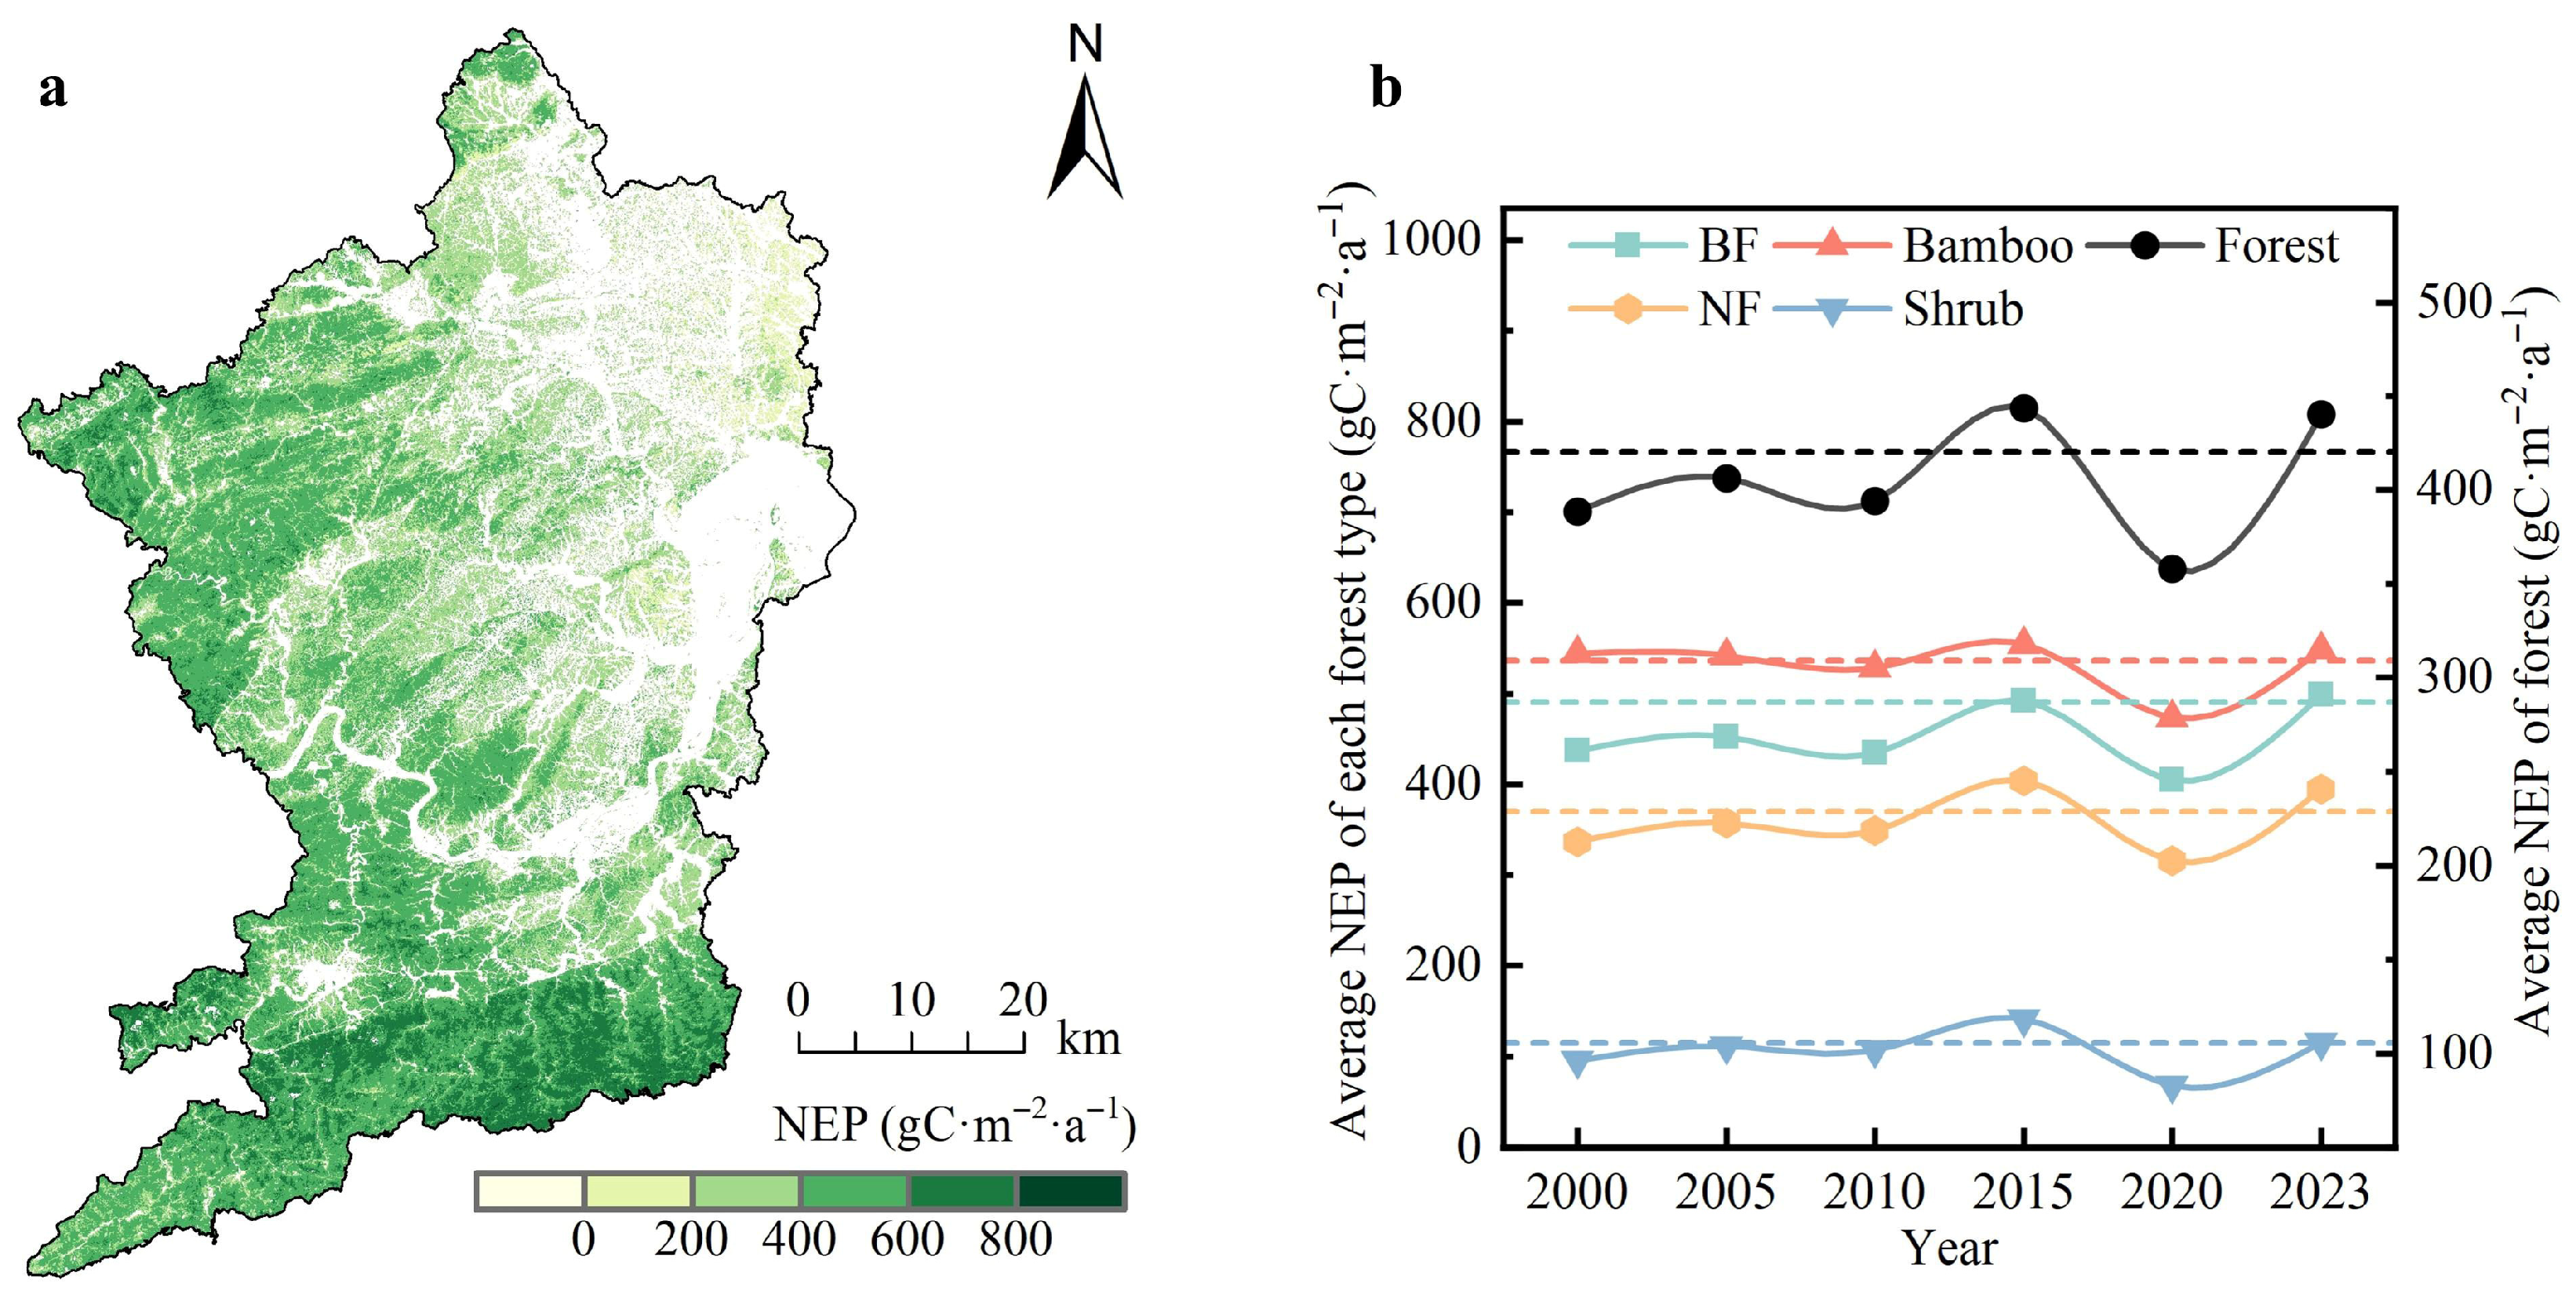
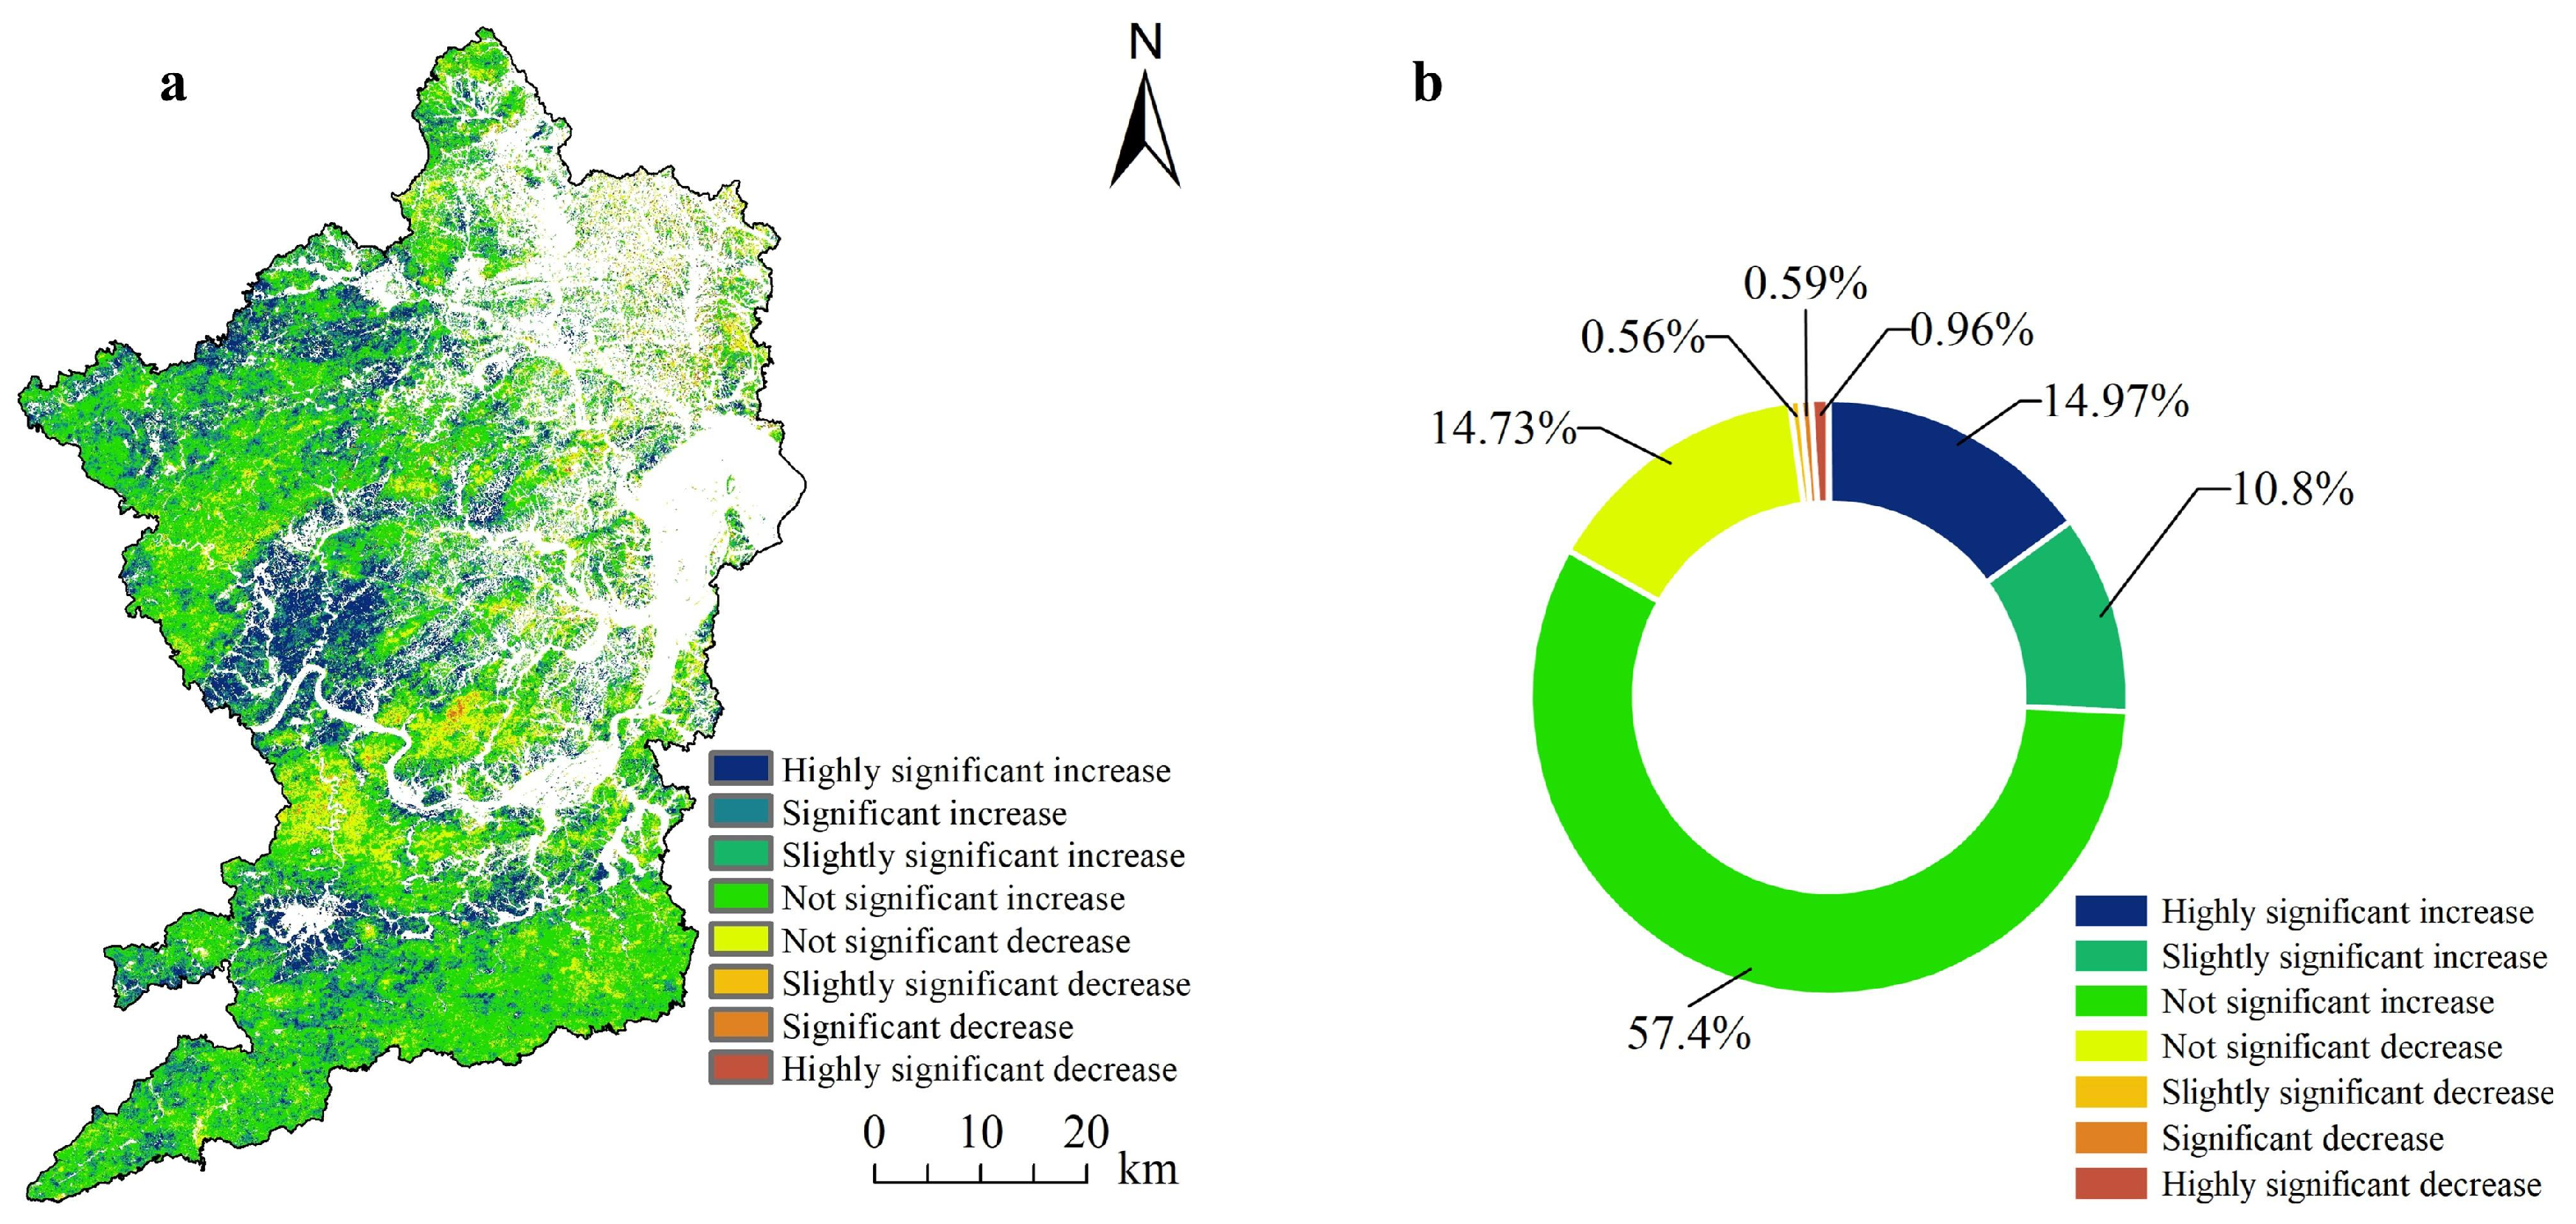
3.2.2. Spatiotemporal Dynamics of Forest NEP

From 2000 to 2023, the Taoyuan County forest NEP exhibited a fluctuating upward trend (Figure 7), with annual means from 357.86 gC·m−2·a−1 (2020, lowest) to 443.74 gC·m−2·a−1 (2015, highest). The forest NEP recovered across all types during 2020–2023. The multi-year average forest NEP was 420.29 gC·m−2·a−1, with values of 400–600 gC·m−2·a−1 covering 45.94% of the area. Similarly to the NPP, the spatial pattern of the NEP was high in the west/south and low in the east/north. This spatial trend may result from a combination of ecological factors—such as forest fragmentation, land use intensity, and vegetation type distribution—which are elaborated in the Discussion section. The carbon source areas (negative NEP) were primarily distributed at the forest/non-forest intersections northeast of the county. The multi-year mean NEP ranked by forest type was as follows: bamboo (536.45 gC·m−2·a−1) > BF (490.83 gC·m−2·a−1) > NF (370.06 gC·m−2·a−1) > shrub (114.52 gC·m−2·a−1); this ranking remained stable throughout the study period.
The seasonal Sen + MK trend analysis of the Taoyuan County forest NEP (2000–2023) revealed an overall upward trend (Figure 8), with 85.48% of the area increasing and 14.52% decreasing. Most increasing trends were not significant; the smallest area proportion exhibited a slightly significant decrease. Spatially, the increasing NEP regions showed clear clustering, whereas the decreasing NEP regions exhibited point-like dispersion and localized clustering. Large contiguous growth zones, forming significant or highly significant high-value areas, occurred in the western region, including the Huangshi, Ligonggang, Niuchehe, Longtan, and Guanyinsi townships, northern Yiwangxi Township, and Cha’anpu Township. Conversely, areas with reduced NEP were scattered pointwise across various townships or locally clustered in central and western Taoyuan County, notably southern Yiwangxi Township, Cha’anpu Township, and the Zhengjiayi–Naiwotan Township junction.
Figure 9 shows the standard deviational ellipse and center of gravity migration trajectory for the Taoyuan County forest NEP from 2000 to 2023. The standard deviational ellipse maintained a similar shape and orientation, indicating a relatively stable NEP spatial distribution pattern. The ellipse’s center of gravity consistently remained within Yiwangxi Town, exhibiting minor village-scale migrations. From 2000 to 2015, the center of gravity shifted gently, initially northwest then southwest, reaching its northernmost point in 2015. The migration intensified from 2015 to 2023, with a southwestward shift to its southernmost point, followed by a northwestward movement.

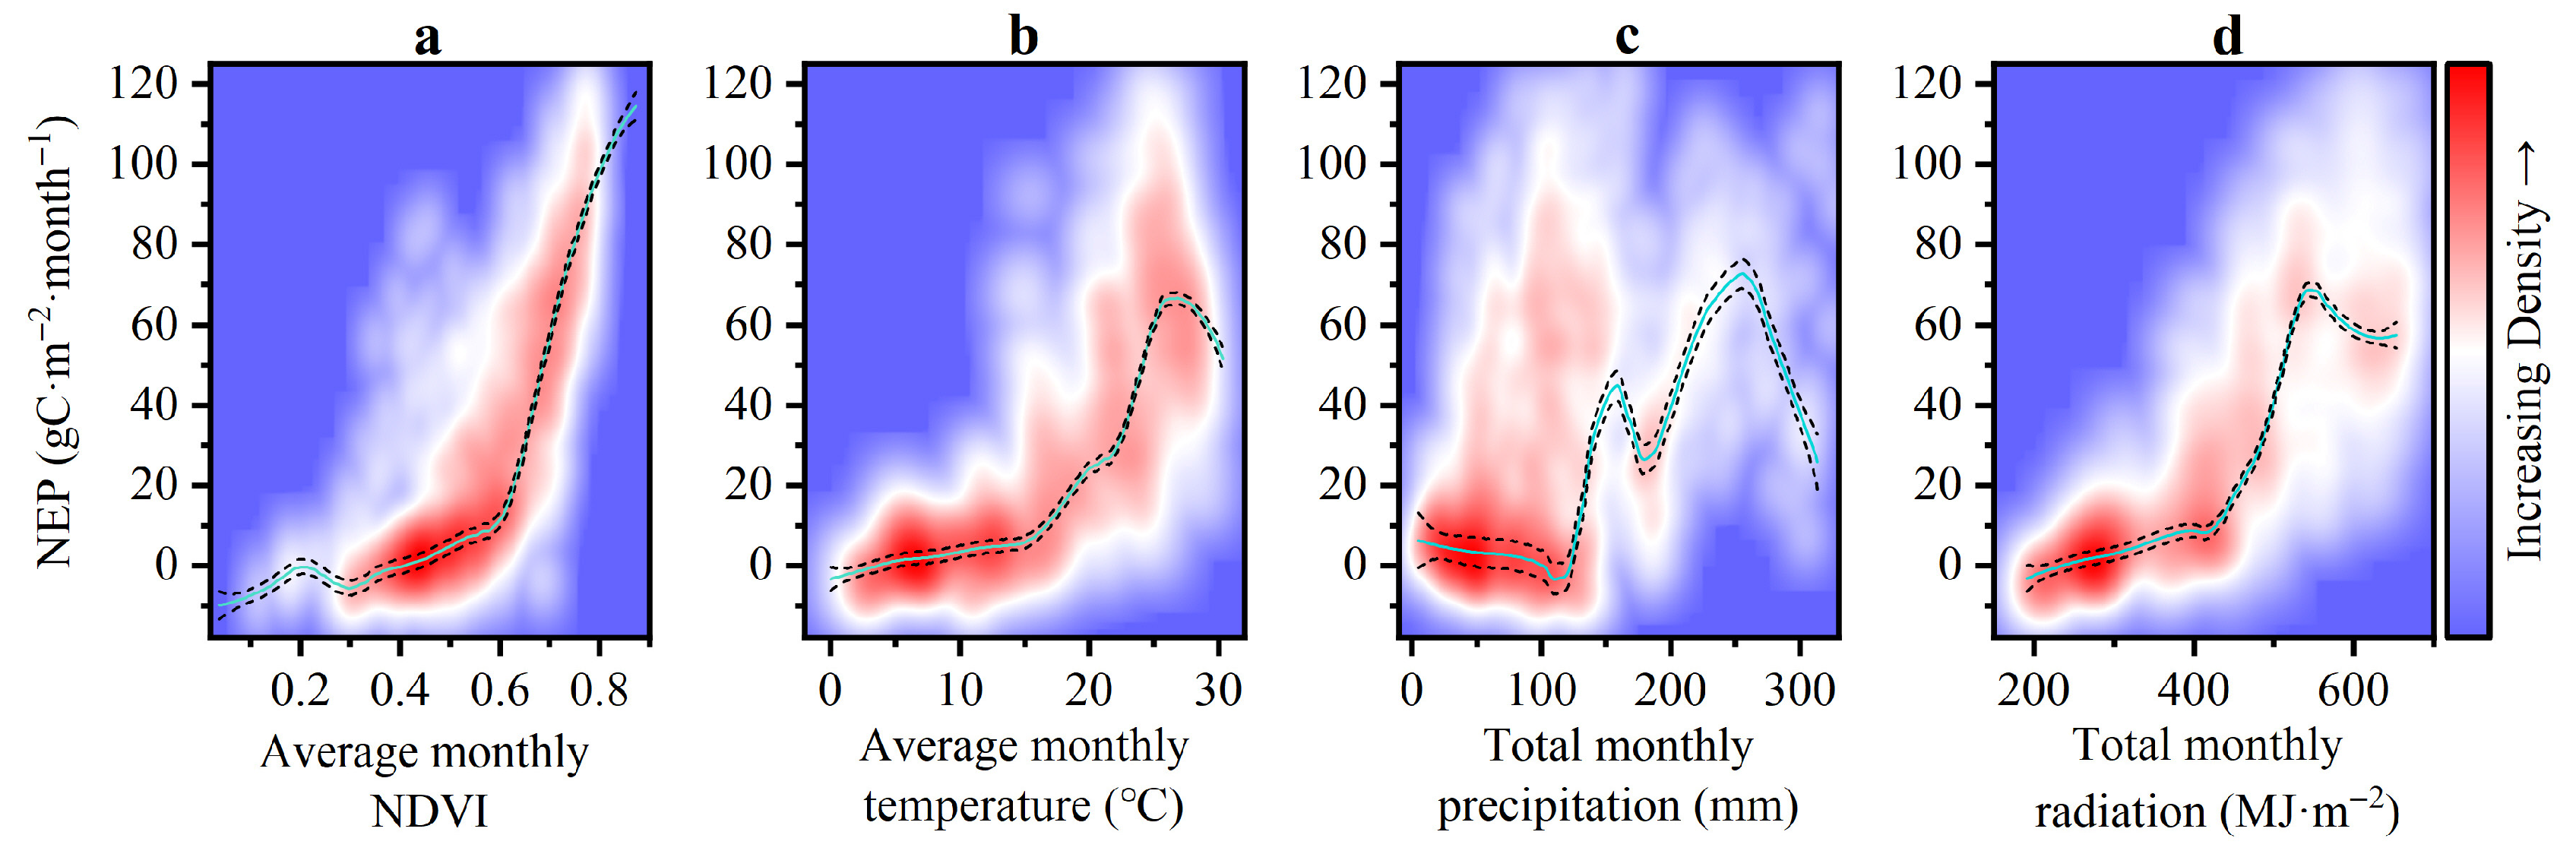
3.2.3. Historical Effects of Factors on Forest NEP

Table 3 shows the changes in the total NEP for each Taoyuan County forest type from 2000 to 2023. Due to area changes, the total NEP of BF increased by 7.21 × 10⁴ tC a−1, with area expansion contributing 0.97 × 10⁴ tC a−1 to this increase. Although the NF area loss reduced its NEP contribution by 5.18 × 10⁴ tC a−1, its final total NEP still increased by 3.81 × 10⁴ tC a−1. The total NEP of bamboo increased by 2.49 × 10⁴ tC a−1, with the area expansion contributing 2.24 × 10⁴ tC a−1. The total NEP of shrub also increased slightly by 0.50 × 10⁴ tC a−1, to which area change contributed 0.26 × 10⁴ tC a−1.
Figure 10 displays scatter density plots of the township-scale forest NEP relationships with NDVI, temperature, precipitation, and solar radiation, revealing clear threshold effects. The NEP was mostly negative for NDVI < 0.4, increasing slowly for NDVI 0.4–0.6, increasing rapidly for NDVI 0.6–0.8, and decelerating slightly for NDVI > 0.8. The NEP increased slowly when the monthly mean temperature was <15 °C (or monthly total solar radiation < 400 MJ·m−2). For monthly total precipitation, the NEP decreased slowly below 100 mm but rose rapidly at 120–160 mm and 180–250 mm. It also increased rapidly with a monthly mean temperature of 15–26 °C (or monthly total precipitation of 180–250 mm, or monthly total solar radiation of 400–550 MJ·m−2). The NEP peaked at a monthly mean temperature of 26 °C (or total precipitation of 250 mm, or total solar radiation of 550 MJ·m−2). Beyond these peaks (e.g., temperature > 26 °C, precipitation > 250 mm, or solar radiation > 550 MJ·m−2), the NEP rapidly declined. Notably, an initial small NEP peak occurred at a 160 mm monthly precipitation, followed by a slight decrease at 160–180 mm.

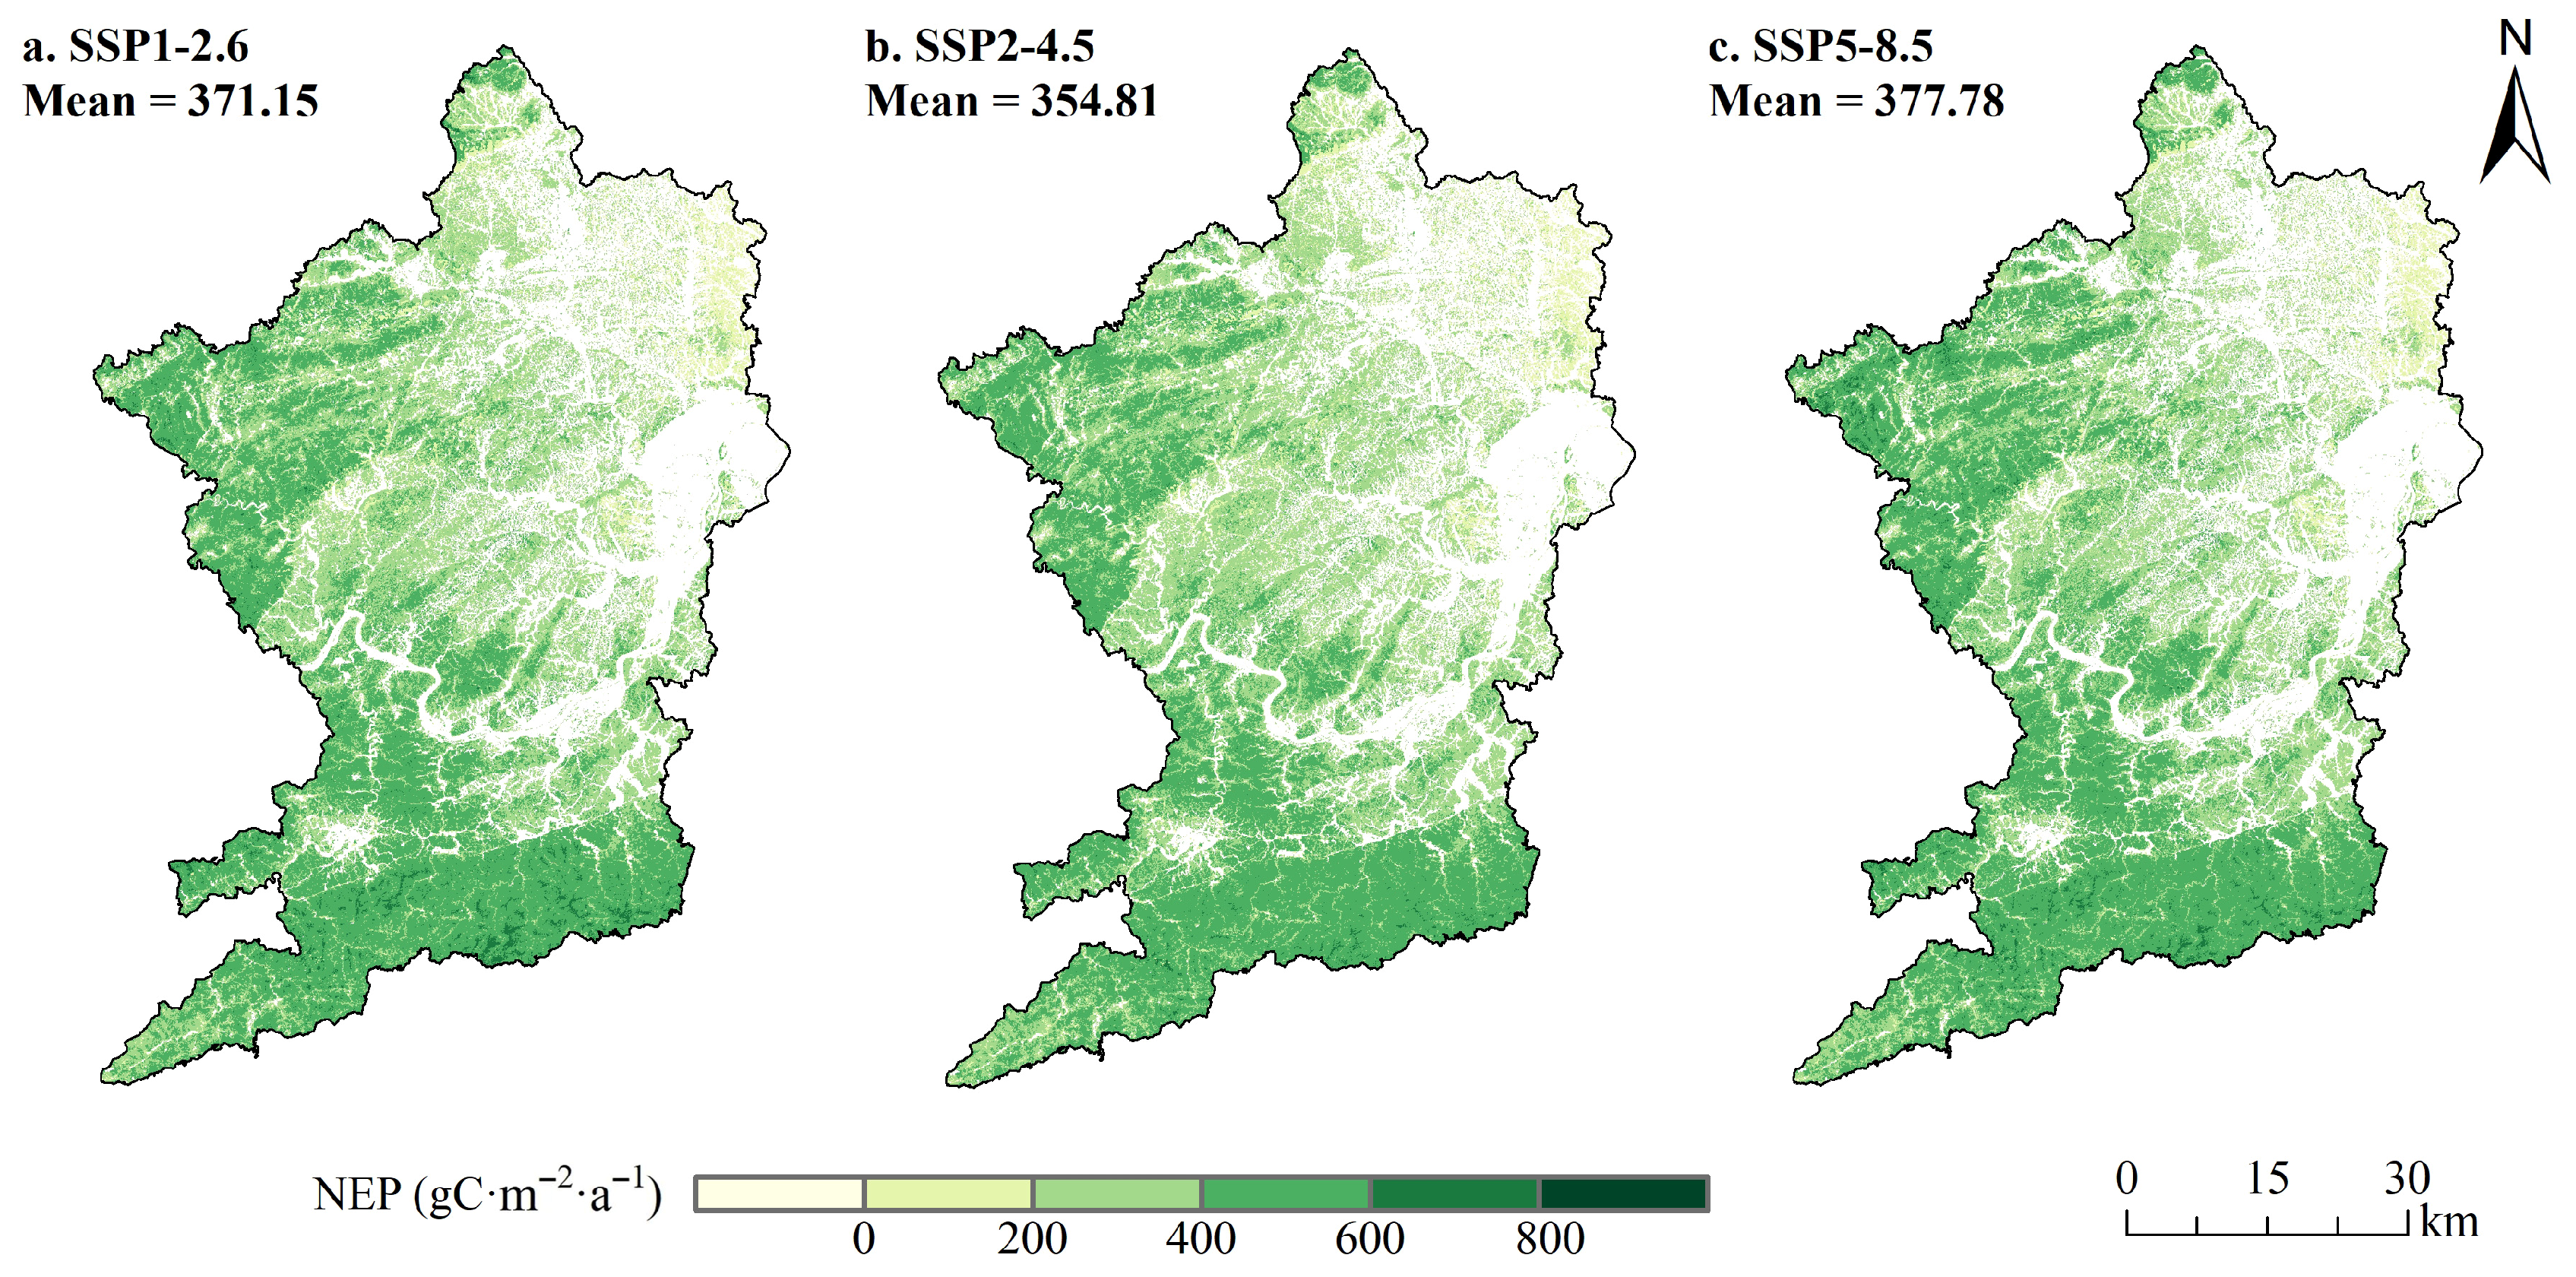
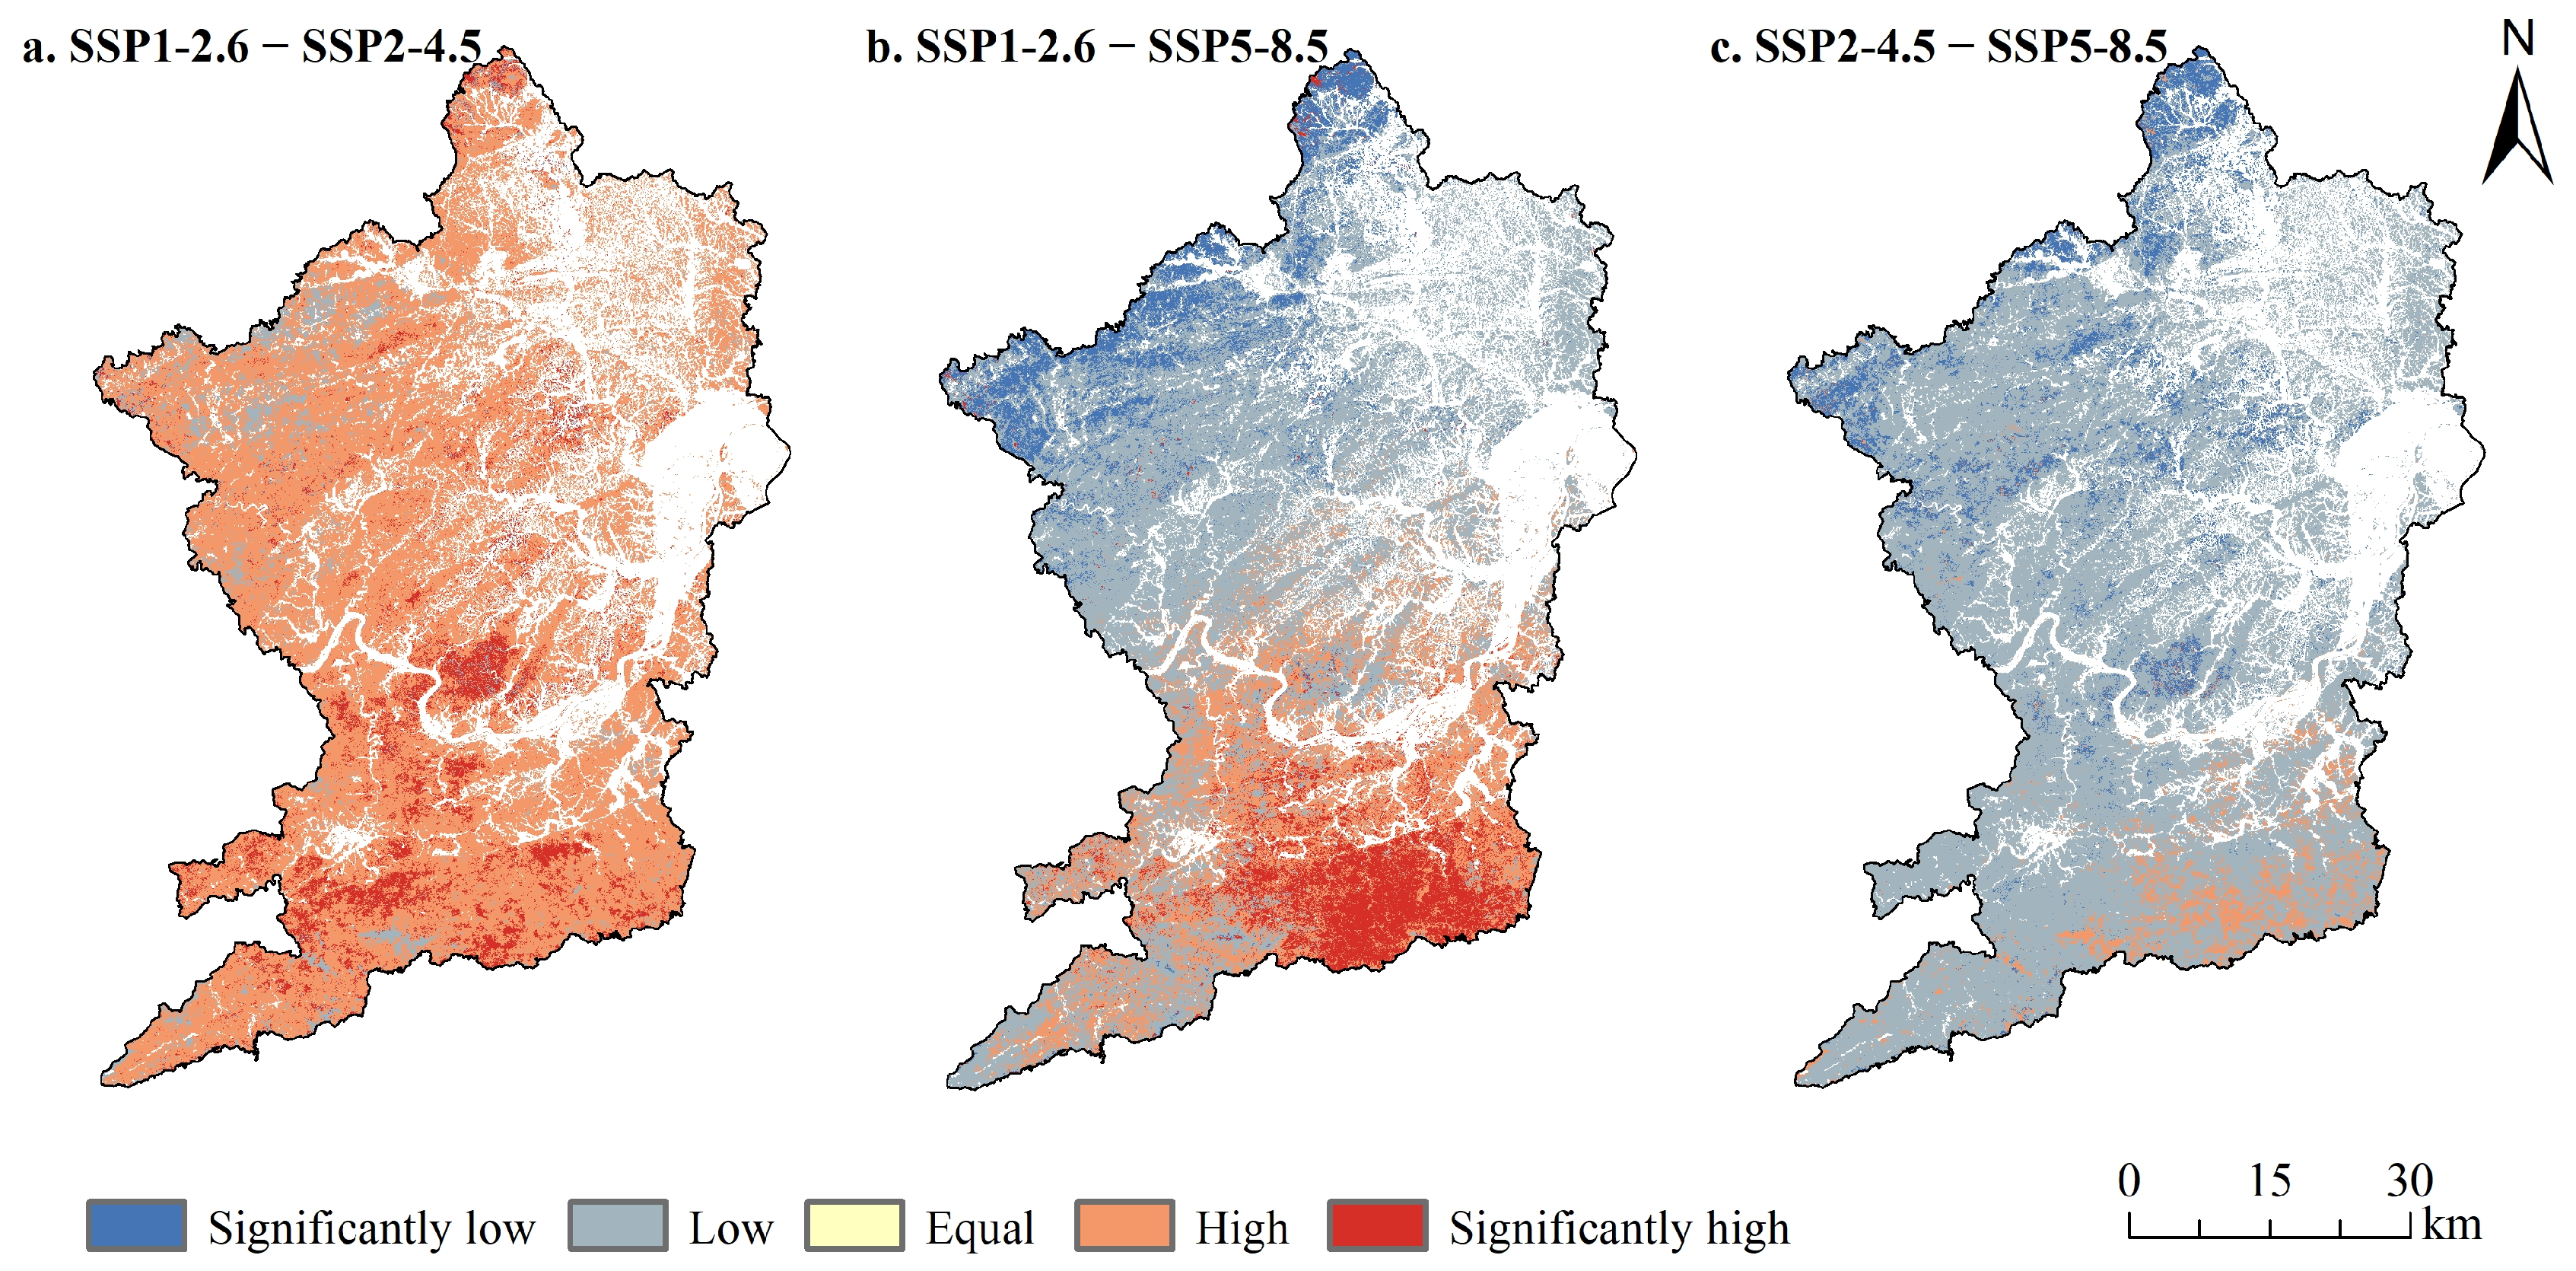
3.3. Prediction of Forest NEP Under 2035 Climate Scenarios

The 2035 forest NEP spatial pattern under the three climate scenarios was generally consistent with those in the historical years (Figure 11). However, an overall decrease in NEP values was projected for all scenarios in 2035 compared with those in 2023.
Figure 12 shows the NEP distribution by forest type for 2000–2023 and the projected distribution for 2035 under the three climate scenarios. Historically, BF was dominated by medium–high carbon sink levels, with high levels peaking in 2015. NF was characterized by medium–low carbon sink levels. Bamboo exhibited the strongest carbon sink capacity, predominantly at medium–high carbon sink levels, whereas shrub had the weakest, mainly at low carbon sink levels. All forest types showed reduced carbon sink capacity in 2020 but recovered to higher levels by 2023. Under all three 2035 scenarios, BF and bamboo were projected to primarily exhibit medium–high carbon sink levels and NF medium–low carbon sink levels. In contrast, the proportion of the shrub area acting as carbon sources is expected to increase.
The difference analysis (Figure 13) compared the spatial distributions of the 2035 forest NEP under the three scenarios. The results showed that over most of Taoyuan County, the NEP values under SSP1-2.6 and SSP5-8.5 were generally higher than those under SSP2-4.5. In northern Taoyuan County, which is dominated by BF and NF, the NEP under SSP5-8.5 was significantly higher than those under SSP1-2.6 and SSP2-4.5. In southern Taoyuan County, where bamboo was dominant, the NEP under SSP1-2.6 was significantly higher than those under SSP2-4.5 and SSP5-8.5. For shrub, the NEP scenario differences were relatively small, although SSP1-2.6 was slightly superior overall.

4. Discussion

4.1. Feasibility Verification

4.1.1. Land Cover Classification and Modeling

The overall accuracy (OA) and Kappa coefficient were used as the accuracy assessment indices for land cover classification and simulation. For all six historical image classifications, OA reached 80%, and Kappa coefficients exceeded 0.77 (Table 4), indicating the effective classification of the RF algorithm and the suitability for subsequent research of the results. The 2023 land cover simulation used development probabilities derived from 2010 to 2023 land cover changes. Validation against actual 2023 land cover data yielded an OA of 80.83% and a Kappa coefficient of 0.75 for this simulation. This confirmed the suitability of the PLUS model for simulating the Taoyuan County 2035 land cover.

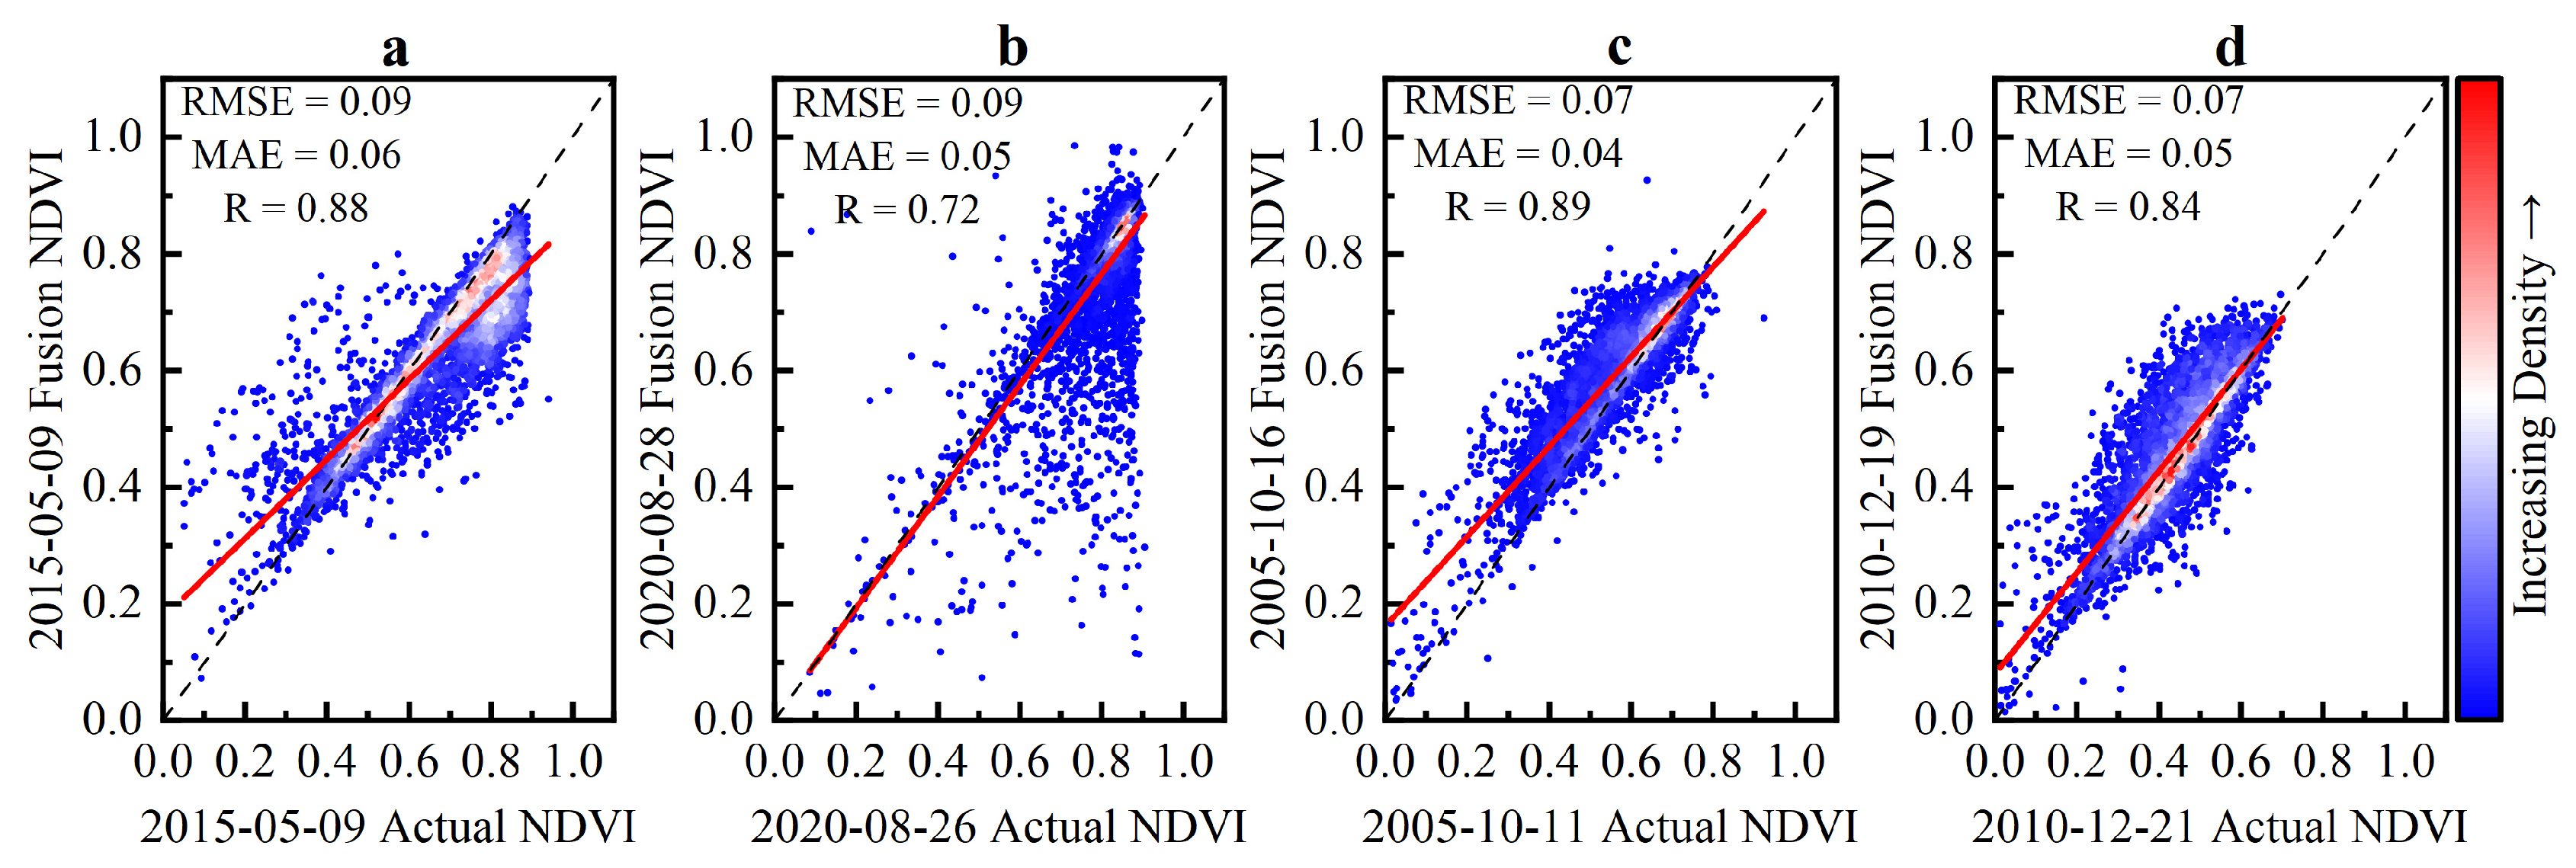
4.1.2. NDVI Fusion and Forecasting

The accuracy metrics for the NDVI spatiotemporal fusion and prediction were the root mean square error (RMSE), mean absolute error (MAE), and Pearson’s correlation coefficient (R). The fused and actual Landsat NDVI images for 2005, 2010, 2015, and 2020 were randomly sampled for scatter plots (Figure 14). The results showed an all-season RMSE < 0.09, MAE < 0.06, and R > 0.8 (except in summer, R = 0.72), indicating fused data consistency with actual Landsat NDVI. The lower summer correlation and instances where fused NDVI was below actual values may relate to rapid summer vegetation changes challenging precise algorithmic capture. Furthermore, comparing the 2023 predicted versus fused monthly NDVI (Table 5) confirmed the reliability of the multiple linear regression model for 2035 NDVI prediction. Overall, the generated time-series NDVI dataset was suitable for subsequent forest NPP estimation.

4.1.3. NPP Simulated by the CASA Model

The actual NPP values were calculated from the Taoyuan County 2023 comprehensive forest, grassland, and wetland monitoring data [38,39,40,41]. The consistency between these actual NPP values and the simulated NPP for 2023 was then verified using RMSE, MAE, and R (Figure 15). The results showed a significant linear relationship (p < 0.01) between the actual and simulated NPP, with RMSE = 92.04, MAE = 66.01, and R = 0.87. Additionally, our results were compared with other simulations at similar temporal and regional scales (Table 6). These findings confirmed the reliability of the CASA model for simulating the Taoyuan County forest NPP, supporting its use for subsequent forest NEP calculation.

4.2. Spatiotemporal Dynamics of 2000–2023 Forest NEP

From 2000 to 2023, the Taoyuan County forest NEP exhibited a fluctuating upward trend. Spatially, it was generally high in the west/south and low in the east/north. The negative NEP areas (carbon sources) occurred mainly in the forest/non-forest transition zones in the county’s northeast. Contiguous growth zones formed in the western county, whereas NEP decline areas were more dispersed. The spatial center of gravity, which was relatively stable initially, showed intensified migration later in the study period. The multi-year mean NEP ranked by forest type was bamboo > BF > NF > shrub, remaining stable throughout the study period.
The spatiotemporal divergence of the Taoyuan County forest NEP reflects the combined effects of climate, topography, forest type, and human activity [48,49,50,51]. Interannual forest NEP variation is closely linked to climatic factors, particularly during extreme weather years. For instance, a 2020 extreme meteorological disaster [52] reduced photosynthetically active radiation, caused excessive soil wetness, and impeded root respiration, significantly decreasing that year’s forest NEP. The western and southern mountainous areas featuring high relief, minimal human interference, and predominantly BF and bamboo cover exhibited higher forest NEP. Conversely, the eastern and northern plains experienced lower NEP due to significant forest fragmentation from human activities, pronounced edge effects, and a dominance of shrub (e.g., oil tea). The negative NEP areas (carbon sources) in forest/non-forest transition zones in the county’s northeast suggest a forest carbon sink edge effect, potentially linked to agricultural nitrogen release, urban heat island effects, and other anthropogenic disturbances. However, human activities also positively impacted NEP. Over the past two decades, the county’s promotion of ecological restoration (e.g., returning farmland to forest, afforestation, natural forest protection, enhanced forest resource management) significantly improved the ecosystem carbon sink function [53]. Thus, human activities were integral to the Taoyuan County forest NEP improvement from 2000 to 2023.
The NEP differences among forest types reflect the intrinsic link between vegetation functional characteristics and carbon sink capacity. Bamboo, with special growth patterns, high biomass accumulation, and photosynthesis similar to BF [54], exhibited high NEP. BF also showed high NEP due to rich canopy layers and stable ecosystem structures [55]. NF reported lower NEP than BF and bamboo owing to its lower light use efficiency; nevertheless, the large area of NF makes it the primary forest carbon sink in Taoyuan County. Shrub NEP was lower owing to its successional stage and biomass accumulation. These results highlight forest type composition as a key factor in the regulation of the regional carbon sink capacity. Dynamic changes reveal complexity in the carbon sink contribution of NF. Despite area reduction, a significant NEP increase per unit area led to a net rise in the total NF NEP, largely offsetting the impact of area loss. Meanwhile, bamboo also significantly contributed to the total NEP increase, driven by its high average NEP and substantial area expansion. This coexistence, the “quality improvement and quantity reduction” of NF, and the “efficient expansion” of bamboo, profoundly impacted the regional carbon sink potential. Bamboo expansion enhances overall regional carbon sequestration capacity [56]. However, potential NF ecosystem service degradation and aging [57], alongside the long-term impacts of bamboo on carbon pool stability (e.g., logging rotation cycles) [58], require cautious assessment.
The spatial variation in the Taoyuan County forest NEP, driven by joint natural and anthropogenic factors, can guide carbon sequestration strategies. The recommended actions include the protection of the southwestern areas with high NEP while improving the northeastern low-NEP forest quality, creation of forest edge buffer zones against external disturbances, and optimization of forest stand structure. This optimization involves leveraging the high productivity of bamboo, restoring NF to appropriate scales, and transforming pure NF to mixed NF/BF to achieve an efficient and stable carbon sink system.

4.3. Prediction of Forest NEP Under 2035 Climate Scenarios

Under all three climate scenarios, the 2035 climate in Taoyuan County projected a warming and humidifying trend with increased temperature and precipitation, but decreased solar radiation when compared with the historical data. Consequently, the forest NEP in Taoyuan County was projected to decrease under all three future scenarios, albeit with inter-scenario differences.
Drawing on the studies by Liao [44], Xie, Chen, and Hu [59] regarding the influence of climatic factors on NPP and Rh, and incorporating the threshold effect analysis of climatic variables, NDVI, and NEP conducted in this study, we attribute the overall decline in NEP across all three climate scenarios in Taoyuan County to several key ecological mechanisms: First, summer temperatures approaching or exceeding 30 °C are likely to surpass the photosynthetic optimum of broadleaf species, thereby suppressing photosynthetic rates and ultimately reducing NPP. Second, winter warming may enhance soil microbial activity, accelerate organic matter decomposition, and thereby increase Rh, weakening the net carbon sink function. Third, although total annual precipitation increases, its seasonal distribution becomes highly uneven—more concentrated in summer and reduced in winter—leading to excessive leaching or water deficit in soils, which lowers water use efficiency and increases the risk of spring drought. Fourth, decreased solar radiation, simulated under multiple scenarios, limits the availability of photosynthetically active radiation, thereby restricting carbon assimilation capacity. Fifth, enhanced evapotranspiration in spring and summer reduces soil moisture availability, causing early-season water stress and limiting vegetative productivity.
Although all three climate scenarios projected a decline in NEP, the magnitude and dominant mechanisms varied: Under the SSP1-2.6 scenario, the most pronounced seasonal precipitation imbalance is observed, with excessive summer rainfall reducing water-use efficiency. Winter warming may extend the growing season, but simultaneously stimulates soil respiration. While solar radiation is relatively high in this scenario, stronger evapotranspiration in spring exacerbates soil dryness and imposes early-season water stress. In the SSP2-4.5 scenario, extreme contrast between spring and autumn precipitation creates sharp intra-seasonal shifts—from early-stage soil saturation to late-stage drought—disrupting growth patterns. Additionally, anomalously high temperatures in January may prematurely break dormancy, interfering with energy allocation in vegetation. This scenario also exhibits the lowest level of solar radiation among the three, directly limiting photosynthetic efficiency. Under the SSP5-8.5 scenario, although the overall temperature increase is relatively moderate, inter-monthly temperature fluctuations are more severe. For example, the sharp temperature drop from January to February may affect early phenological development, while extremely abundant summer rainfall causes inefficient water utilization and oxygen diffusion limitations, both of which suppress root function and photosynthesis. At the same time, solar radiation continues to decline, further constraining carbon input. In summary, climate change affects forest carbon balance through multiple interacting pathways, including temperature, moisture, and radiation dynamics. Even under low-emission scenarios, regional forest carbon sinks may face significant challenges, underscoring the need to recognize and manage nonlinear ecological responses.
Furthermore, land cover modeling in this study incorporated the rigid constraints of territorial spatial planning policy. Consequently, the projected forest NEP under each climate scenario also reflected the fundamental influence of policy-guided land cover patterns on carbon sink changes. For instance, the planned protection of core forest land in key ecological functional zones can allow high NEP level maintenance under climate stress, underscoring policy implementation’s key role in mitigating climate impacts and ensuring ecological security.
China’s carbon emissions are expected to peak by 2030 and steadily decline after 2035 [60,61]. Counties, as basic administrative and economic units, are pivotal for ecosystem governance and achieving the goals for carbon peaking and neutrality [62]. The multi-scenario NEP projections for Taoyuan County in this study revealed the differing impacts of development paths on forest carbon sinks. These findings offer theoretical support for local authorities to assess “dual-carbon” progress and formulate precise carbon-neutral policies.
SSP5-8.5 yielded the optimal 2035 forest NEP in Taoyuan County, but its high emissions conflict with ecological civilization. Meanwhile, SSP1-2.6 offered better NEP than SSP2-4.5, and its sustainable orientation suits regional ecological protection. Therefore, Taoyuan County should adopt the SSP1-2.6 low-carbon path, which means applying the “lucid waters and lush mountains are invaluable assets” concept and optimizing forest management under territorial spatial planning to enhance ecosystem climate adaptability, sustainable carbon sinks, and ecological health.

4.4. Prospects

The CASA model employed in this study did not adequately reflect the spatiotemporal heterogeneity and seasonal dynamics in its maximum light use efficiency ( ε max ) parameterization [63]. In addition, the empirical Rh model did not comprehensively consider the effects of soil temperature, humidity, and organic matter content on soil respiration [64,65,66]. The empirical Rh model was also applied without site-specific calibration, which may introduce additional uncertainty to the NEP estimates. Future studies should therefore optimize the spatiotemporal expression of these parameters and refine the empirical Rh model to more accurately explain the spatiotemporal heterogeneity of NEP.
The scarcity of empirical Rh data meant that the NEP was only indirectly verified via the NPP in this study. Although reasonable [20], this may affect the reliability of the final results. While the fused NDVI product exhibited satisfactory accuracy, the downstream influence of NDVI uncertainty on NEP estimation was not quantified in this study. Future research must strengthen Rh field observations for direct NEP estimation verification and optimization, and should incorporate uncertainty propagation frameworks to assess how NDVI and other inputs affect the robustness of carbon sink projections.
This study did not include forest age structure, which plays a key role in determining carbon sink potential. Young and middle-aged forests typically exhibit higher carbon uptake due to active biomass accumulation, while older forests may stabilize or decline in sequestration capacity. As Taoyuan’s forests are predominantly young to middle-aged, the projected NEP may be underestimated in this study. Future research should integrate forest age dynamics to better assess the temporal sustainability of carbon sinks and support targeted management decisions.

5. Conclusions

This study estimated the Taoyuan County forest NEP and analyzed its spatiotemporal divergence using various remote sensing algorithms (Random Forest, ELRFM), biophysical models (CASA, empirical Rh), and trend analyses (seasonal MK, Theil–Sen, standard deviational ellipse). Subsequently, a policy-informed discrete coupling of the PLUS and CASA models predicted the 2035 forest NEP under three climate scenarios (SSP1-2.6, SSP2-4.5, SSP5-8.5). The results showed that the Taoyuan County forest NEP (2000–2023) exhibited a fluctuating upward trend, averaging 420.29 gC·m−2·a−1 with annual means of 357.86–443.74 gC·m−2·a−1. The spatial pattern was generally high in the west/south and low in the east/north. The multi-year mean NEP ranked by forest type was as follows: bamboo > BF > NF > shrub. For 2035, under a general warming and humidifying trend across all three climate scenarios, the Taoyuan County forest NEP was projected to decline as SSP5-8.5 > SSP1-2.6 > SSP2-4.5. However, considering the environmental risks from high-emission pathways (e.g., uncontrolled resource exploitation, elevated CO2), the SSP1-2.6 development path is recommended. Furthermore, the study achieved good land cover classification/simulation accuracy (OA > 80.83%, Kappa > 0.75) and high NDVI spatiotemporal fusion/prediction precision (R > 0.72). In addition, the forest NPP estimations strongly correlated with the measured data (R = 0.87). These results affirm the feasibility of the synergistic multi-source remote sensing, CASA, and PLUS modeling approach for county-scale, long-term forest NEP exploration. This study not only deepens our understanding of spatiotemporal NEP patterns in county forest ecosystems but also directly supports regional ecological civilization construction and the achievement of sustainable development goals.

Supplementary Materials

The following supporting information can be downloaded at: https://www.mdpi.com/article/10.3390/su17146552/s1, Text S1: Estimation of NPP; Text S2: Estimation of NEP; Text S3: Multiple linear regression equation; Table S1: RF classification input features; Table S2: Maximum light energy use efficiency parameters for each land cover type; Table S3: Land cover modeling drivers; Table S4: Land cover type conversion restriction matrices; Table S5: Neighborhood weights parameters (calculated based on 2010 and 2023 land cover data); Table S6: Land cover type expansion probability correction rules. Reference [67] is cited in the Supplementary Materials.

Author Contributions

Conceptualization, J.L.; methodology, J.L.; software, J.L.; validation, Y.X.; formal analysis, J.L.; investigation, J.L.; resources, J.S. and C.C.; data curation, J.L.; writing—original draft preparation, J.L.; writing—review and editing, J.L.; visualization, J.L.; supervision, J.S. and C.C. All authors have read and agreed to the published version of the manuscript.

Funding

This research was funded by the National Key Research and Development Program topics (2022YFD2200505); the Science and Technology Bureau of Changsha (69199060).

Institutional Review Board Statement

Not applicable.

Informed Consent Statement

Not applicable.

Data Availability Statement

The data presented in this study are available upon request from the corresponding author.

Acknowledgments

The authors would like to thank the research team members for their contributions to this work.

Conflicts of Interest

The authors declare no conflicts of interest.

References

  1. Pan, Y.; Birdsey, R.A.; Fang, J.; Houghton, R.; Kauppi, P.E.; Kurz, W.A.; Phillips, O.L.; Shvidenko, A.; Lewis, S.L.; Canadell, J.G.; et al. A large and persistent carbon sink in the world’s forests. Science 2011, 333, 988–993. [Google Scholar] [CrossRef]
  2. Song, M.; Bae, J.S.; Seol, M.H. Development of the forest carbon sink index on afforestation and reforestation activities. J. Korean Soc. For. Sci. 2014, 103, 137–146. [Google Scholar] [CrossRef]
  3. Wang, Q.; Zheng, H.; Zhu, X.; Yu, G. Primary estimation of Chinese terrestrial carbon sequestration during 2001–2010. Sci. Bull. 2015, 60, 577–590. [Google Scholar] [CrossRef]
  4. Yu, G.; Chen, Z.; Piao, S.; Peng, C.; Ciais, P.; Wang, Q.; Li, X.; Zhu, X. High carbon dioxide uptake by subtropical forest ecosystems in the East Asian monsoon region. Proc. Natl. Acad. Sci. USA 2014, 111, 4910–4915. [Google Scholar] [CrossRef] [PubMed]
  5. Brown, S.; Lugo, A.E. Biomass of tropical forests: A new estimate based on forest volumes. Science 1984, 223, 1290–1293. [Google Scholar] [CrossRef]
  6. Malhi, Y.; Nobre, A.D.; Grace, J.; Kruijt, B.; Pereira, M.G.P.; Culf, A.; Scott, S. Carbon dioxide transfer over a Central Amazonian rain forest. J. Geophys. Res. Atmos. 1998, 103, 31593–31612. [Google Scholar] [CrossRef]
  7. Zhan, X.; Guo, M.; Zhang, T. Joint control of net primary productivity by climate and soil nitrogen in the forests of Eastern China. Forests 2018, 9, 322. [Google Scholar] [CrossRef]
  8. Ji, S.; Ren, S.; Fang, L.; Chen, J.; Wang, G.; Wang, Q. Improved CASA-Based Net Ecosystem Productivity Estimation in China by Incorporating Developmental Factors into Autumn Phenology Model. Remote Sens. 2025, 17, 487. [Google Scholar] [CrossRef]
  9. Li, C.; Sun, H.; Wu, X.; Han, H. Dataset of the net primary production on the Qinghai-Tibetan Plateau using a soil water content improved Biome-BGC model. Data Brief 2019, 27, 104740. [Google Scholar] [CrossRef]
  10. Yuan, F.; Arain, M.A.; Barr, A.G.; Black, T.A.; Bourque, C.P.A.; Coursolle, C.; Margolis, H.A.; McCaughey, J.H.; Wofsy, S.C. Modeling analysis of primary controls on net ecosystem productivity of seven boreal and temperate coniferous forests across a continental transect. Glob. Change Biol. 2008, 14, 1765–1784. [Google Scholar] [CrossRef]
  11. Zhang, H.; He, Z.; Zhang, L.; Cong, R.; Wei, W. Spatial–Temporal Changes and Driving Factor Analysis of Net Ecosystem Productivity in Heilongjiang Province from 2010 to 2020. Land 2024, 13, 1316. [Google Scholar] [CrossRef]
  12. Xu, M.; Guo, B.; Zhang, R. Variations of terrestrial net ecosystem productivity in China driven by climate change and human activity from 2010 to 2020. Forests 2024, 15, 1484. [Google Scholar] [CrossRef]
  13. Yuan, Z.; Jiang, Q.; Yin, J. Impact of climate change and land use change on ecosystem net primary productivity in the Yangtze River and Yellow River Source Region, China. Watershed Ecol. Environ. 2023, 5, 125–133. [Google Scholar] [CrossRef]
  14. Wang, S.; Feng, H.; Zou, B.; Yang, Z.; Wang, S. Vegetation Greening Enhanced the Regional Terrestrial Carbon Uptake in the Dongting Lake Basin of China. Forests 2023, 14, 768. [Google Scholar] [CrossRef]
  15. Qi, S.; Zhang, H.; Zhang, M. Evolutionary characteristics of carbon sources/sinks in Chinese terrestrial ecosystems regarding to temporal effects and geographical partitioning. Ecol. Indic. 2024, 160, 111923. [Google Scholar] [CrossRef]
  16. Tang, L.; Wang, D. Optimization of county-level land resource allocation through the improvement of allocation efficiency from the perspective of sustainable development. Int. J. Environ. Res. Public Health 2018, 15, 2638. [Google Scholar] [CrossRef]
  17. Zhou, S. Spatio-Temporal Distribution of Carbon Source/Sink and Carbon Deficit Prediction in Northeast China. Master’s Thesis, Liaoning Normal University, Dalian, China, 2023. [Google Scholar]
  18. Zhao, M.; Xiang, W.; Deng, X.; Tian, D.; Huang, Z.; Zhou, X.; Yu, G.; He, H.; Peng, C. Application of TRIPLEX model for predicting Cunninghamia lanceolata and Pinus massoniana forest stand production in Hunan Province, southern China. Ecol. Model. 2013, 250, 58–71. [Google Scholar] [CrossRef]
  19. Zheng, J.; Mao, F.; Du, H.; Li, X.; Zhou, G.; Dong, L.; Zhang, M.; Han, N.; Liu, T.; Xing, L. Spatiotemporal simulation of net ecosystem productivity and its response to climate change in subtropical forests. Forests 2019, 10, 708. [Google Scholar] [CrossRef]
  20. Song, S.; Qin, S.; Sun, P.; Fu, X. Estimation and Prediction of Vegetation Carbon Sinks in Fenhe River Basin Based on Multi-source Remote Sensing Data. Ecol. Environ. Sci. 2025, 34, 345. [Google Scholar] [CrossRef]
  21. Li, P.; Wang, X.; Xu, S.; Gao, S.; Xue, Z.; Heng, R. Spatiotemporal pattern of NEP in Aksu River Basin based on PLUS land use simulation. Arid Zone Res. 2024, 41, 1059–1068. [Google Scholar] [CrossRef]
  22. Zhang, J.; Wang, J.; Chen, Y.; Huang, S.; Liang, B. Spatiotemporal variation and prediction of NPP in Beijing-Tianjin-Hebei region by coupling PLUS and CASA models. Ecol. Inform. 2024, 81, 102620. [Google Scholar] [CrossRef]
  23. The People’s Government of Taoyuan County. Overview of Taoyuan County. Available online: https://www.taoyuan.gov.cn/zjty/tygk (accessed on 28 April 2025).
  24. Bai, B.; Tan, Y.; Donchyts, G.; Haag, A.; Weerts, A. A simple spatio–temporal data fusion method based on linear regression coefficient compensation. Remote Sens. 2020, 12, 3900. [Google Scholar] [CrossRef]
  25. Potter, C.S.; Randerson, J.T.; Field, C.B.; Matson, P.A.; Vitousek, P.M.; Mooney, H.A.; Klooster, S.A. Terrestrial ecosystem production: A process model based on global satellite and surface data. Glob. Biogeochem. Cycles 1993, 7, 811–841. [Google Scholar] [CrossRef]
  26. Pei, Z.; Zhou, C.; Ouyang, H.; Yang, W. A carbon budget of alpine steppe area in the Tibetan Plateau. Geogr. Res. 2010, 29, 102–110. [Google Scholar] [CrossRef]
  27. Zhao, H.; Mo, H. Dynamic analysis of vegetation carbon sink and its natural driving factors in Hunan Province. Remote Sens. Nat. Resour. 2024, 36, 831–840. [Google Scholar] [CrossRef]
  28. Hirsch, R.M.; Slack, J.R.; Smith, R.A. Techniques of trend analysis for monthly water quality data. Water Resour. Res. 1982, 18, 107–121. [Google Scholar] [CrossRef]
  29. Hipel, K.W.; McLeod, A.I. Time Series Modelling of Water Resources and Environmental Systems; Elsevier: Amsterdam, The Netherlands, 1994; Volume 45. [Google Scholar]
  30. Anghileri, D.; Pianosi, F.; Soncini-Sessa, R. Trend detection in seasonal data: From hydrology to water resources. J. Hydrol. 2014, 511, 171–179. [Google Scholar] [CrossRef]
  31. He, T.; Lu, Y.; Cui, Y.; Luo, Y.; Wang, M.; Meng, W.; Zhang, K.; Zhao, F. Detecting gradual and abrupt changes in water quality time series in response to regional payment programs for watershed services in an agricultural area. J. Hydrol. 2015, 525, 457–471. [Google Scholar] [CrossRef]
  32. Hussain, M.; Mahmud, I. pyMannKendall: A python package for non parametric Mann Kendall family of trend tests. J. Open Source Softw. 2019, 4, 1556. [Google Scholar] [CrossRef]
  33. Wu, J.; Jia, P.; Feng, T.; Li, H.; Kuang, H.; Zhang, J. Uncovering the spatiotemporal impacts of built environment on traffic carbon emissions using multi-source big data. Land Use Policy 2023, 129, 106621. [Google Scholar] [CrossRef]
  34. Xu, L.; Liu, X.; Tong, D.; Liu, Z.; Yin, L.; Zheng, W. Forecasting urban land use change based on cellular automata and the PLUS model. Land 2022, 11, 652. [Google Scholar] [CrossRef]
  35. Ma, B.; Zeng, W.; Hu, G.; Cao, R.; Cui, D.; Zhang, T. Normalized difference vegetation index prediction based on the delta downscaling method and back-propagation artificial neural network under climate change in the Sanjiangyuan region, China. Ecol. Inform. 2022, 72, 101883. [Google Scholar] [CrossRef]
  36. Wang, J.; Wang, K.; Zhang, M.; Zhang, C. Impacts of climate change and human activities on vegetation cover in hilly southern China. Ecol. Eng. 2015, 81, 451–461. [Google Scholar] [CrossRef]
  37. Li, T.; Li, M.; Qian, C. Combining crown density to estimate forest net primary productivity by using remote sensing data. J. Nanjing For. Univ. (Nat. Sci. Ed.) 2021, 45, 153. [Google Scholar] [CrossRef]
  38. DB43/T 3080.2-2024; Measurement and Monitoring Models of Tree Volume, Biomass and Carbon Coefficients in Hunan Province—Part 2: The Tree Volume and Biomass Models of Chinese Fir. Administration for Market Regulation of Hunan Province: Changsha, China, 2024. Available online: https://std.samr.gov.cn/db/search/stdDBDetailed?id=21AC4109BC64DCDAE06397BE0A0AD859 (accessed on 30 September 2024).
  39. DB43/T 3080.3-2024; Measurement and Monitoring Models of Tree Volume, Biomass and Carbon Coefficients in Hunan Province—Part 3: The Tree Volume and Biomass Models of Masson Pine. Administration for Market Regulation of Hunan Province: Changsha, China, 2024. Available online: https://std.samr.gov.cn/db/search/stdDBDetailed?id=21AC4109BC65DCDAE06397BE0A0AD859 (accessed on 30 September 2024).
  40. DB43/T 3080.6-2024; Measurement and Monitoring Models of Tree Volume, Biomass and Carbon Coefficients in Hunan Province—Part 6: The Tree Volume and Biomass Models of Other Softwood Broadleaved Species. Administration for Market Regulation of Hunan Province: Changsha, China, 2024. Available online: https://std.samr.gov.cn/db/search/stdDBDetailed?id=21AC4109BC68DCDAE06397BE0A0AD859 (accessed on 30 September 2024).
  41. Wang, B.; Liu, M.; Zhang, B. Dynamics of Net Production of Chinese Forest Vegetation Based on Forest Inventory Data. For. Grassl. Resour. 2009, 35–43. [Google Scholar] [CrossRef]
  42. Zhang, M.; Yuan, N.; Lin, H.; Liu, Y.; Zhang, H. Quantitative estimation of the factors impacting spatiotemporal variation in NPP in the Dongting Lake wetlands using Landsat time series data for the last two decades. Ecol. Indic. 2022, 135, 108544. [Google Scholar] [CrossRef]
  43. Zhu, S. Spatial-Temporal Pattern and Driving Factors of Vegetal NPP in the DongTing Lake Basin. Master’s Thesis, Central South University, Changsha, China, 2022. [Google Scholar]
  44. Liao, L. Analysis of Spatial-Temporal Changes Characteristics and Driving Factors of Net Primary Productivity of Chinese Fir (Cunninghamia Lanceolata) in Hunan province. Master’s Thesis, Nanjing Forestry University, Nanjing, China, 2024. [Google Scholar]
  45. Dong, X. Study on Balance and Synergy of Ecosystem Service Function in Wuling Mountain Area of Hunan province. Master’s Thesis, Jishou University, Jishou, China, 2022. [Google Scholar]
  46. Wu, J. Research on Analysis of Spatiotemporal Changes and Driving Factors of Net Primary Productivity of Vegetation in the Yangtze River Basin. Master’s Thesis, Wuhan University, Wuhan, China, 2023. [Google Scholar]
  47. Feng, W. Spatial-Temporal Variation and Prediction of NPP in the Yangtze River Basin Based on CASA Model and CMIP6 Model. Master’s Thesis, Southwest University, Chongqing, China, 2022. [Google Scholar]
  48. Cao, M.; Woodward, F.I. Dynamic responses of terrestrial ecosystem carbon cycling to global climate change. Nature 1998, 393, 249–252. [Google Scholar] [CrossRef]
  49. He, H.; Wang, S.; Zhang, L.; Wang, J.; Ren, X.; Zhou, L.; Piao, S.; Yan, H.; Ju, W.; Gu, F.; et al. Altered trends in carbon uptake in China’s terrestrial ecosystems under the enhanced summer monsoon and warming hiatus. Natl. Sci. Rev. 2019, 6, 505–514. [Google Scholar] [CrossRef]
  50. Fu, W.; Tian, L.; Tao, Y.; Li, M.; Guo, H. Spatiotemporal changes in the boreal forest in Siberia over the period 1985–2015 against the background of climate change. Earth Syst. Dyn. 2022, 14, 223–239. [Google Scholar] [CrossRef]
  51. Lyu, J.; Fu, X.; Lu, C.; Zhang, Y.; Luo, P.; Guo, P.; Huo, A.; Zhou, M. Quantitative assessment of spatiotemporal dynamics in vegetation NPP, NEP and carbon sink capacity in the Weihe River Basin from 2001 to 2020. J. Clean. Prod. 2023, 428, 139384. [Google Scholar] [CrossRef]
  52. Department of Agriculture and Rural Affairs of Hunan Province. Going All Out and Planning Ahead, Taoyuan Flood Prevention and Relief Work Is Solid and Effective. Available online: https://agri.hunan.gov.cn/agri/xxgk/gzdt/snyw/dtyw/202007/t20200710_12724154.html (accessed on 10 July 2020).
  53. Brandt, M. Human management has a crucial role in China’s land carbon balance. Nat. Geosci. 2024, 17, 1077–1078. [Google Scholar] [CrossRef]
  54. Jiang, P.; Meng, C.; Zhou, G.; Xu, Q. Comparative study of carbon storage in different forest stands in subtropical China. Bot. Rev. 2011, 77, 242–251. [Google Scholar] [CrossRef]
  55. Liu, X.; Feng, Y.; Hu, T.; Luo, Y.; Zhao, X.; Wu, J.; Maeda, E.E.; Ju, W.; Liu, L.; Guo, Q.; et al. Enhancing ecosystem productivity and stability with increasing canopy structural complexity in global forests. Sci. Adv. 2024, 10, eadl1947. [Google Scholar] [CrossRef]
  56. Xu, J.; Tan, S.; Wang, H.; Zhang, X.; Hong, Y. Bamboo Forests: Unleashing the Potential for Carbon Abatement and Local Income Improvements. Forests 2024, 15, 1907. [Google Scholar] [CrossRef]
  57. Shang, R.; Chen, J.M.; Xu, M.; Lin, X.; Li, P.; Yu, G.; He, N.; Xu, L.; Gong, P.; Liu, L.; et al. China’s current forest age structure will lead to weakened carbon sinks in the near future. Innovation 2023, 4, 100515. [Google Scholar] [CrossRef]
  58. Kuehl, Y.; Li, Y.; Henley, G. Impacts of selective harvest on the carbon sequestration potential in Moso bamboo (Phyllostachys pubescens) plantations. For. Trees Livelihoods 2013, 22, 1–18. [Google Scholar] [CrossRef]
  59. Xie, W.; Chen, S.-T.; Hu, Z.-H. Factors Influencing the Variability in Soil Heterotrophic Respiration from Terrestrial Ecosystem in China. Environ. Sci. 2014, 35, 334–340. [Google Scholar] [CrossRef]
  60. China State Council. State Council on the Issuance of the Carbon Peak by 2030 Notice of Action Plan. Available online: https://www.gov.cn/zhengce/content/2021-10/26/content_5644984.htm (accessed on 26 October 2021).
  61. Xinhua News Agency. The Outline of the 14th Five-Year Plan for Economic and Social Development and Long-Range Objectives Through the Year 2035 of the People’s Republic of China. Available online: https://www.gov.cn/xinwen/2021-03/13/content_5592681.htm (accessed on 13 March 2021).
  62. Zheng, B.; Wu, S.; Liu, Z.; Wu, H.; Li, Z.; Ye, R.; Zhu, J.; Wan, W. Downscaling estimation of NEP in the ecologically-oriented county based on multi-source remote sensing data. Ecol. Indic. 2024, 160, 111818. [Google Scholar] [CrossRef]
  63. Dong, T.; Liu, J.; Qian, B.; Jing, Q.; Croft, H.; Chen, J.; Wang, J.; Huffman, T.; Shang, J.; Chen, P. Deriving maximum light use efficiency from crop growth model and satellite data to improve crop biomass estimation. IEEE J. Sel. Top. Appl. Earth Obs. Remote Sens. 2016, 10, 104–117. [Google Scholar] [CrossRef]
  64. Irvine, J.; Law, B.E. Contrasting soil respiration in young and old-growth ponderosa pine forests. Glob. Change Biol. 2002, 8, 1183–1194. [Google Scholar] [CrossRef]
  65. Qiu, S.; Liang, L.; Wang, Q.; Geng, D.; Wu, J.; Wang, S.; Chen, B. Estimation of European terrestrial ecosystem NEP based on an improved CASA model. IEEE J. Sel. Top. Appl. Earth Obs. Remote Sens. 2022, 16, 1244–1255. [Google Scholar] [CrossRef]
  66. Yan, Z.; Bond-Lamberty, B.; Todd-Brown, K.E.; Bailey, V.L.; Li, S.; Liu, C.; Liu, C. A moisture function of soil heterotrophic respiration that incorporates microscale processes. Nat. Commun. 2018, 9, 2562. [Google Scholar] [CrossRef]
  67. Zhu, W.; Pan, Y.; He, H.; Yu, D.; Hu, H. Simulation of maximum light use efficiency for some typical vegetation types in China. Chin. Sci. Bull. 2006, 51, 457–463. [Google Scholar] [CrossRef]
Figure 1. Geographical location of the study area.
Sustainability 17 06552 g001
Figure 2. Flowchart of the study process.
Sustainability 17 06552 g002
Figure 3. Land cover types in Taoyuan County: (a) actual types for 2023; (b) modeled types for 2023; and (c) modeled types for 2035.
Sustainability 17 06552 g003
Figure 4. Spatial distribution patterns of the forest NDVI in Taoyuan County from 2000 to 2023 and under the three 2035 climate scenarios.
Sustainability 17 06552 g004
Figure 5. Changes in (a) NDVI, (b) temperature, (c) precipitation, and (d) solar radiation in Taoyuan County for 2000–2023 and the trends under the three 2035 climate scenarios.
Sustainability 17 06552 g005
Figure 6. (a) Spatial distribution characteristics of multi-year average forest NPP and (b) multi-year average NEP of various forest types in Taoyuan County from 2000 to 2023.
Sustainability 17 06552 g006
Figure 7. (a) Spatial distribution of the multi-year mean forest NEP in Taoyuan County and (b) characteristics of the changes in the mean NEP of different forest types from 2000 to 2023.
Sustainability 17 06552 g007
Figure 8. (a) Trends and (b) percentages of forest NEP changes in Taoyuan County from 2000 to 2023.
Sustainability 17 06552 g008
Figure 9. Standard deviation ellipse and center of gravity migration trajectory for the forest NEP in Taoyuan County from 2000 to 2023.
Sustainability 17 06552 g009
Figure 10. Scattered density plot of (a) NDVI, (b) temperature, (c) precipitation, and (d) solar radiation in relation to forest NEP in Taoyuan County from 2000 to 2023.
Sustainability 17 06552 g010
Figure 11. Spatial distribution characteristics of forest NEP in Taoyuan County under three 2035 climate scenarios.
Sustainability 17 06552 g011
Figure 12. Spatial distribution patterns of NEP for (a) BF, (b) NF, (c) bamboo, and (d) shrub in Taoyuan County from 2000 to 2023 and under the three 2035 climate scenarios.
Sustainability 17 06552 g012
Figure 13. Analysis of the spatial differences in forest NEP under the three 2035 climate scenarios.
Sustainability 17 06552 g013
Figure 14. Scatterplots of the fusion and actual NDVI accuracy validation for (a) spring, (b) summer, (c) fall, and (d) winter.
Sustainability 17 06552 g014
Figure 15. Scatterplot of the forest NPP accuracy validation.
Sustainability 17 06552 g015
Table 1. Data sources used in the study.
Data TypeNameResolution (m)Source
Remote sensingMOD13Q1 NDVI250https://earthengine.google.com/
Landsat 5/7/8/930
MeteorologicalAverage monthly temperature30Fine Resolution Mapping of Mountain Environment
Total monthly precipitation30
Total monthly solar radiation30
TopographicDigital elevation model (DEM)30https://earthengine.google.com/
Slope30Derived from DEM
Aspect30
Socio-economicPopulation density1000https://landscan.ornl.gov/
Gross domestic product per capita1000http://gisrs.cn/
Road data (railroads, expressways, national, provincial, and county roads)/https://www.webmap.cn/
Government office locations/https://www.openstreetmap.org/
AuxiliaryTaoyuan County administrative boundary/Taoyuan County Forestry Bureau
Taoyuan County 2023 comprehensive forest, grassland, and wetland monitoring data/
Taoyuan County territorial spatial planning policy data/
Table 2. Land cover transfer matrix from 2000 to 2023 in Taoyuan County (unit: km2).
20002023
BFNFBambooShrubFarmlandWater BodyBuilt-Up LandBare LandTotal
BF768.67115.0828.1615.4161.792.8516.290.631008.86
NF160.251286.2554.2126.0949.962.4220.613.161602.95
Bamboo25.1017.05406.830.440.090.180.490.09450.27
Shrub9.3712.691.2688.096.550.052.490.83121.32
Farmland60.9223.630.7912.15804.435.2199.691.231008.06
Water body1.452.500.270.061.84103.869.320.31119.60
Built-up land1.993.710.460.6319.514.6488.800.50120.24
Bare land0.902.110.091.112.070.030.690.507.49
Total1028.641463.03492.07143.97946.23119.24238.377.254438.79
Table 3. Total NEP by forest type in Taoyuan County from 2000 to 2023 (unit: 104 tC·a−1).
Forest TypeYearDifferenceContribution of Area Changes to Total NEP
20002023
BF44.0851.297.210.97
NF53.9957.803.81−5.18
Bamboo24.5227.012.492.24
Shrub1.161.660.500.26
Note: Contribution of area change to total NEP = area change × multi-year average NEP.
Table 4. Land cover classification and simulation accuracy.
Year2000200520102015202020232035
OA (%)81.6181.5480.9284.2986.4683.8980.83
Kappa0.770.760.760.800.840.790.75
Table 5. Predicted NDVI accuracy assessment results.
Month123456789101112
RMSE0.050.060.040.060.060.050.040.030.050.040.080.11
MAE0.040.050.030.050.050.040.030.030.040.030.070.09
R0.930.880.920.910.860.940.930.950.950.950.960.92
Table 6. Comparison of the forest NPP in this study with other simulations.
Study AreaTime ScaleAverage NPP (gC·m−2·a−1)Bibliography
Taoyuan County2000–2023679–768This study
Dongting Lake Wetland2000–2019789[42]
Dongting Lake Basin2000–2019700[43]
Chinese fir in Hunan Province1999–2014715–764[44]
Wuling Mountain area of Hunan Province2000–2020780–1400[45]
Yangtze River Basin2000–2020552–839[46]
Yangtze River Basin2000–2020594–786[47]
Disclaimer/Publisher’s Note: The statements, opinions and data contained in all publications are solely those of the individual author(s) and contributor(s) and not of MDPI and/or the editor(s). MDPI and/or the editor(s) disclaim responsibility for any injury to people or property resulting from any ideas, methods, instructions or products referred to in the content.

