Article

Physico-Mechanical Properties and Decay Susceptibility of Clay Bricks After the Addition of Volcanic Ash from La Palma (Canary Islands, Spain)

by
María López Gómez
* and
Giuseppe Cultrone
*
Department of Mineralogy and Petrology, Faculty of Sciences, University of Granada, Avda. Fuentenueva, s/n, 18002 Granada, Spain
*
Authors to whom correspondence should be addressed.
Sustainability 2025, 17(14), 6545; https://doi.org/10.3390/su17146545
Submission received: 16 June 2025 / Revised: 14 July 2025 / Accepted: 15 July 2025 / Published: 17 July 2025
(This article belongs to the Special Issue Innovating the Circular Future: Pathways to Sustainable Growth)

Abstract

During a volcanic eruption, a large volume of pyroclastic material can be deposited on the roads and roofs of the urban areas near volcanoes. The use of volcanic ash as an additive for the manufacture of bricks provides a solution to the disposal of part of this natural residue and reduces the depletion of a non-renewable natural resource, clayey soil, which brings some environmental and economic advantages. The pore system, compactness, uniaxial compression strength, thermal conductivity, color and durability of bricks without and with the addition of volcanic ash were evaluated through hydric tests, mercury intrusion porosimetry, ultrasound, uniaxial compression tests, IR thermography, spectrophotometry and salt crystallization tests. The purpose of this research is to determine the feasibility of adding 10, 20 and 30% by weight of volcanic ash from La Palma (Canary Islands, Spain) in two grain sizes to produce bricks fired at 800, 950 and 1100 °C. The novelty of this study is to use two sizes of volcanic ash and fire the samples at 1100 °C, which is close to the liquidus temperature of basaltic magmas and allows a high degree of interaction between the volcanic ash and the brick matrix. The addition of fine volcanic ash was found to decrease the porosity of the bricks, although the use of high percentages of coarse volcanic ash resulted in bricks with almost the same porosity as the control samples. The volcanic ash acted as a filler, reducing the number of small pores in the bricks. The presence of vesicles in the volcanic ash reduced the compressive strength and the compactness of the bricks with additives. This reduction was more evident in bricks manufactured with 30% of coarse volcanic ash and fired at 800 and 950 °C, although they still reached the minimum resistance required for their use in construction. No significant differences in thermal conductivity were noticed between the bricks with and without volcanic ash additives, which is crucial in terms of energy savings and the construction of sustainable buildings. At 1100 °C the volcanic ash changed in color from black to red. As a result, the additive blended in better with the matrix of bricks fired at 1100 °C than in those fired at 800 and 950 °C. The bricks with and without volcanic ash and fired at 1100 °C remained intact after the salt crystallization tests. Less salt crystallized in the bricks with volcanic ash and fired at 800 and 950 °C than in the samples without additives, although their low compressive strength made them susceptible to decay.

1. Introduction

The eruption of Tajogaite volcano in 2021 in La Palma (Canary Islands, Spain) emitted a large volume of lava, gases and pyroclastic material which led to the evacuation of 7000 people and the destruction of 1700 buildings [1]. This eruption caused almost 843 million EUR of damages, with the destruction of roads, crops and buildings being the most significant [2]. The volcanic ash emitted by Tajogaite volcano exceeded 10 million m3 and some recommendations were made to protect human health during its removal, such as the use of FFP2 masks, eye protection and moisturizing the volcanic ash to avoid its resuspension [3].
Clearly, La Palma island is not the only place negatively affected by volcanic emissions, as ashfall is quite common in areas with Strombolian-type activity volcanoes. Hayes et al. [4] determined that cleaning volcanic ash from inhabited areas is an expensive and complex process that involves planning, removal, collection and disposal. They also stated that the cost of the operations depends on planning, the machinery available and the disposal site rather than on the volume of volcanic ash and the ashfall duration.
During the Tajogaite volcanic eruption, some containers were provided to gather the volcanic ash, although most of the material collected was deposited in landfills or thrown into the sea [5]. Nowadays, the volcanic ash from Tajogaite is mainly being used to develop concrete roads and artworks [6], although the volume of material generated during the eruption exceeds that used for these purposes. Some papers raise the possibility of using volcanic ash from La Palma to elaborate mortars and geopolymers. For example, Occhipinti et al. [5] achieved the manufacture of alkali-activated materials out of this volcanic ash using NaOH and Na2SiO3 solutions with the addition of a small percentage of metakaolin. The use of volcanic ash as an additive to produce fired clay bricks could also be another alternative to its disposal in landfills.
Traditional fired bricks are produced from the extraction of clayey earth, which is commonly quarried through open-pit mining. This kind of mining involves the removal of soil, affecting the biodiversity of the area [7]. It also pollutes the atmosphere, releasing dust into the air, and entails landscape modifications that can lead to landslides and the alteration of water filtration and drainage [8]. Moreover, clayey earth is a non-renewable resource that can be depleted by continued extraction. At first glance, the use of additives in the ceramic industry brings two advantages: the reduction in the volume of clayey earth necessary to produce bricks, which reduces its extraction and the release of harmful gases during its firing, and a sustainable disposal of residues, avoiding their accumulation in landfills. When evaluating gas release during brick firing, the type and composition of the additive selected should also be considered, as the incorporation of some materials, such as bottom ash, can increase the amount of CO2 emitted [9]. Besides this, the manufacture of construction materials employing natural waste as an additive is a field of interest to fulfill the 17 Sustainable Development Goals (SDGs) of the 2030 Agenda of the United Nation [10]. The incorporation of additives in the fired bricks would also bring some economic consequences. The price of common clay is around 17 USD/ton according to the U.S. Geological Survey mineral commodity summaries [11], which also states that around 13 million tons of common clay are annually extracted in the United States of America, of which 47% is used to manufacture bricks. Considering these numbers, the addition of 10, 20 and 30% of additives would annually save 10.39, 20.77 and 31.16 million USD, respectively, on common clay expenses.
The use of additives generally modifies some physical–mechanical properties, with many scientific papers devoted to determining the maximum additive percentage that does not constrain the use of the resulting material for construction. In this respect, the thermal decomposition of organic additives leaves pores that usually result in an increase in brick thermal insulation, while inorganic additives commonly modify other properties such as durability or compressive strength. As an example, some inorganic additives have been proven to increase the compressive strength of fired bricks such as workshop steel filings [12] and waste glass [13]. The addition of waste brick powder to bricks has enhanced brick compressive strength and the resistance to sulfate attack [14]. On the other hand, organic materials such as olive stone [15] and sawdust [16] have improved the brick thermal insulation, which is key for energy savings in sustainable buildings.
With regards to the addition of volcanic materials, Gencel [17] added up to 40% pumice to bricks fired at 900 and 1000 °C to obtain materials characterized by a low density, high thermal insulation and high apparent porosity. In terms of porosity, Cultrone [18], when adding volcanic ash from Etna to bricks fired between 800 and 1100 °C, obtained that the increase in additive decreased the porosity of the final products. The difference between the results obtained in the research of Gencel [17] and Cultrone [18] is explained by the fact that most of the vesicles present in pumice are interconnected [19], increasing the porosity of the bricks. Moreover, both papers do not consider the effects of the size of the additive, as only one size was used. In this respect, Belfiore [20] analyses the effects of the addition of two sizes of volcanic ash to ceramic tiles. However, the paper fails to study the effects of a wider temperature range, as the materials were only fired at 980 °C.
This article delves into the physical and mechanical properties and the degree of durability of bricks whose mineralogical and textural characteristics have been described in a previous study [21]. In this respect, several parameters such as the porosity, color, thermal insulation, compressive strength and resistance to salt crystallization of the bricks with and without the addition of volcanic ash from La Palma were compared in order to determine whether this additive brings some advantages to the resulting fired bricks and whether they meet the requirements for their use in construction. The influence of the volcanic ash additive size and percentage (10, 20 and 30% by weight) on these properties will also be evaluated. The absence of organic material in this additive makes it interesting as it should not contribute to the release of CO2.

2. Materials and Methods

Overall, 21 types of bricks were elaborated with calcareous clayey earth from Viznar (Granada, Spain) and 10, 20 and 30% by weight of fine (F, f < 0.6 mm) and coarse (G, 0.6 < f < 2 mm) volcanic ash from La Palma. Bricks without additives were also prepared for their use as control samples. The raw materials were mixed, kneaded with water and placed in wooden molds measuring 16 × 12 × 4 cm3. The bricks were then demolded and cut into smaller cubic samples (4 cm per side) to then be fired at 800, 950 and 1100 °C in a Hobersal JM 22/16 electric oven and in an oxidizing atmosphere. Bricks are usually fired at temperatures around 950 °C. However, the bricks were also fired at 800 and 1100 °C to cover a wider temperature range and better explain the changes in the physical and mechanical properties. The temperature of 1100 °C is of particular interest because it is close to the liquidus temperature of basaltic magmas (1000–1300 °C, [22]). The firing started with heating the bricks at 100 °C for an hour to remove any residual moisture. Then, the temperature was increased by 3 °C/min. Once the desired temperature was reached it was maintained for 3 h before switching off the oven. Table 1 presents the bricks’ acronyms according to the firing temperature and the size and percentage of the volcanic ash added.

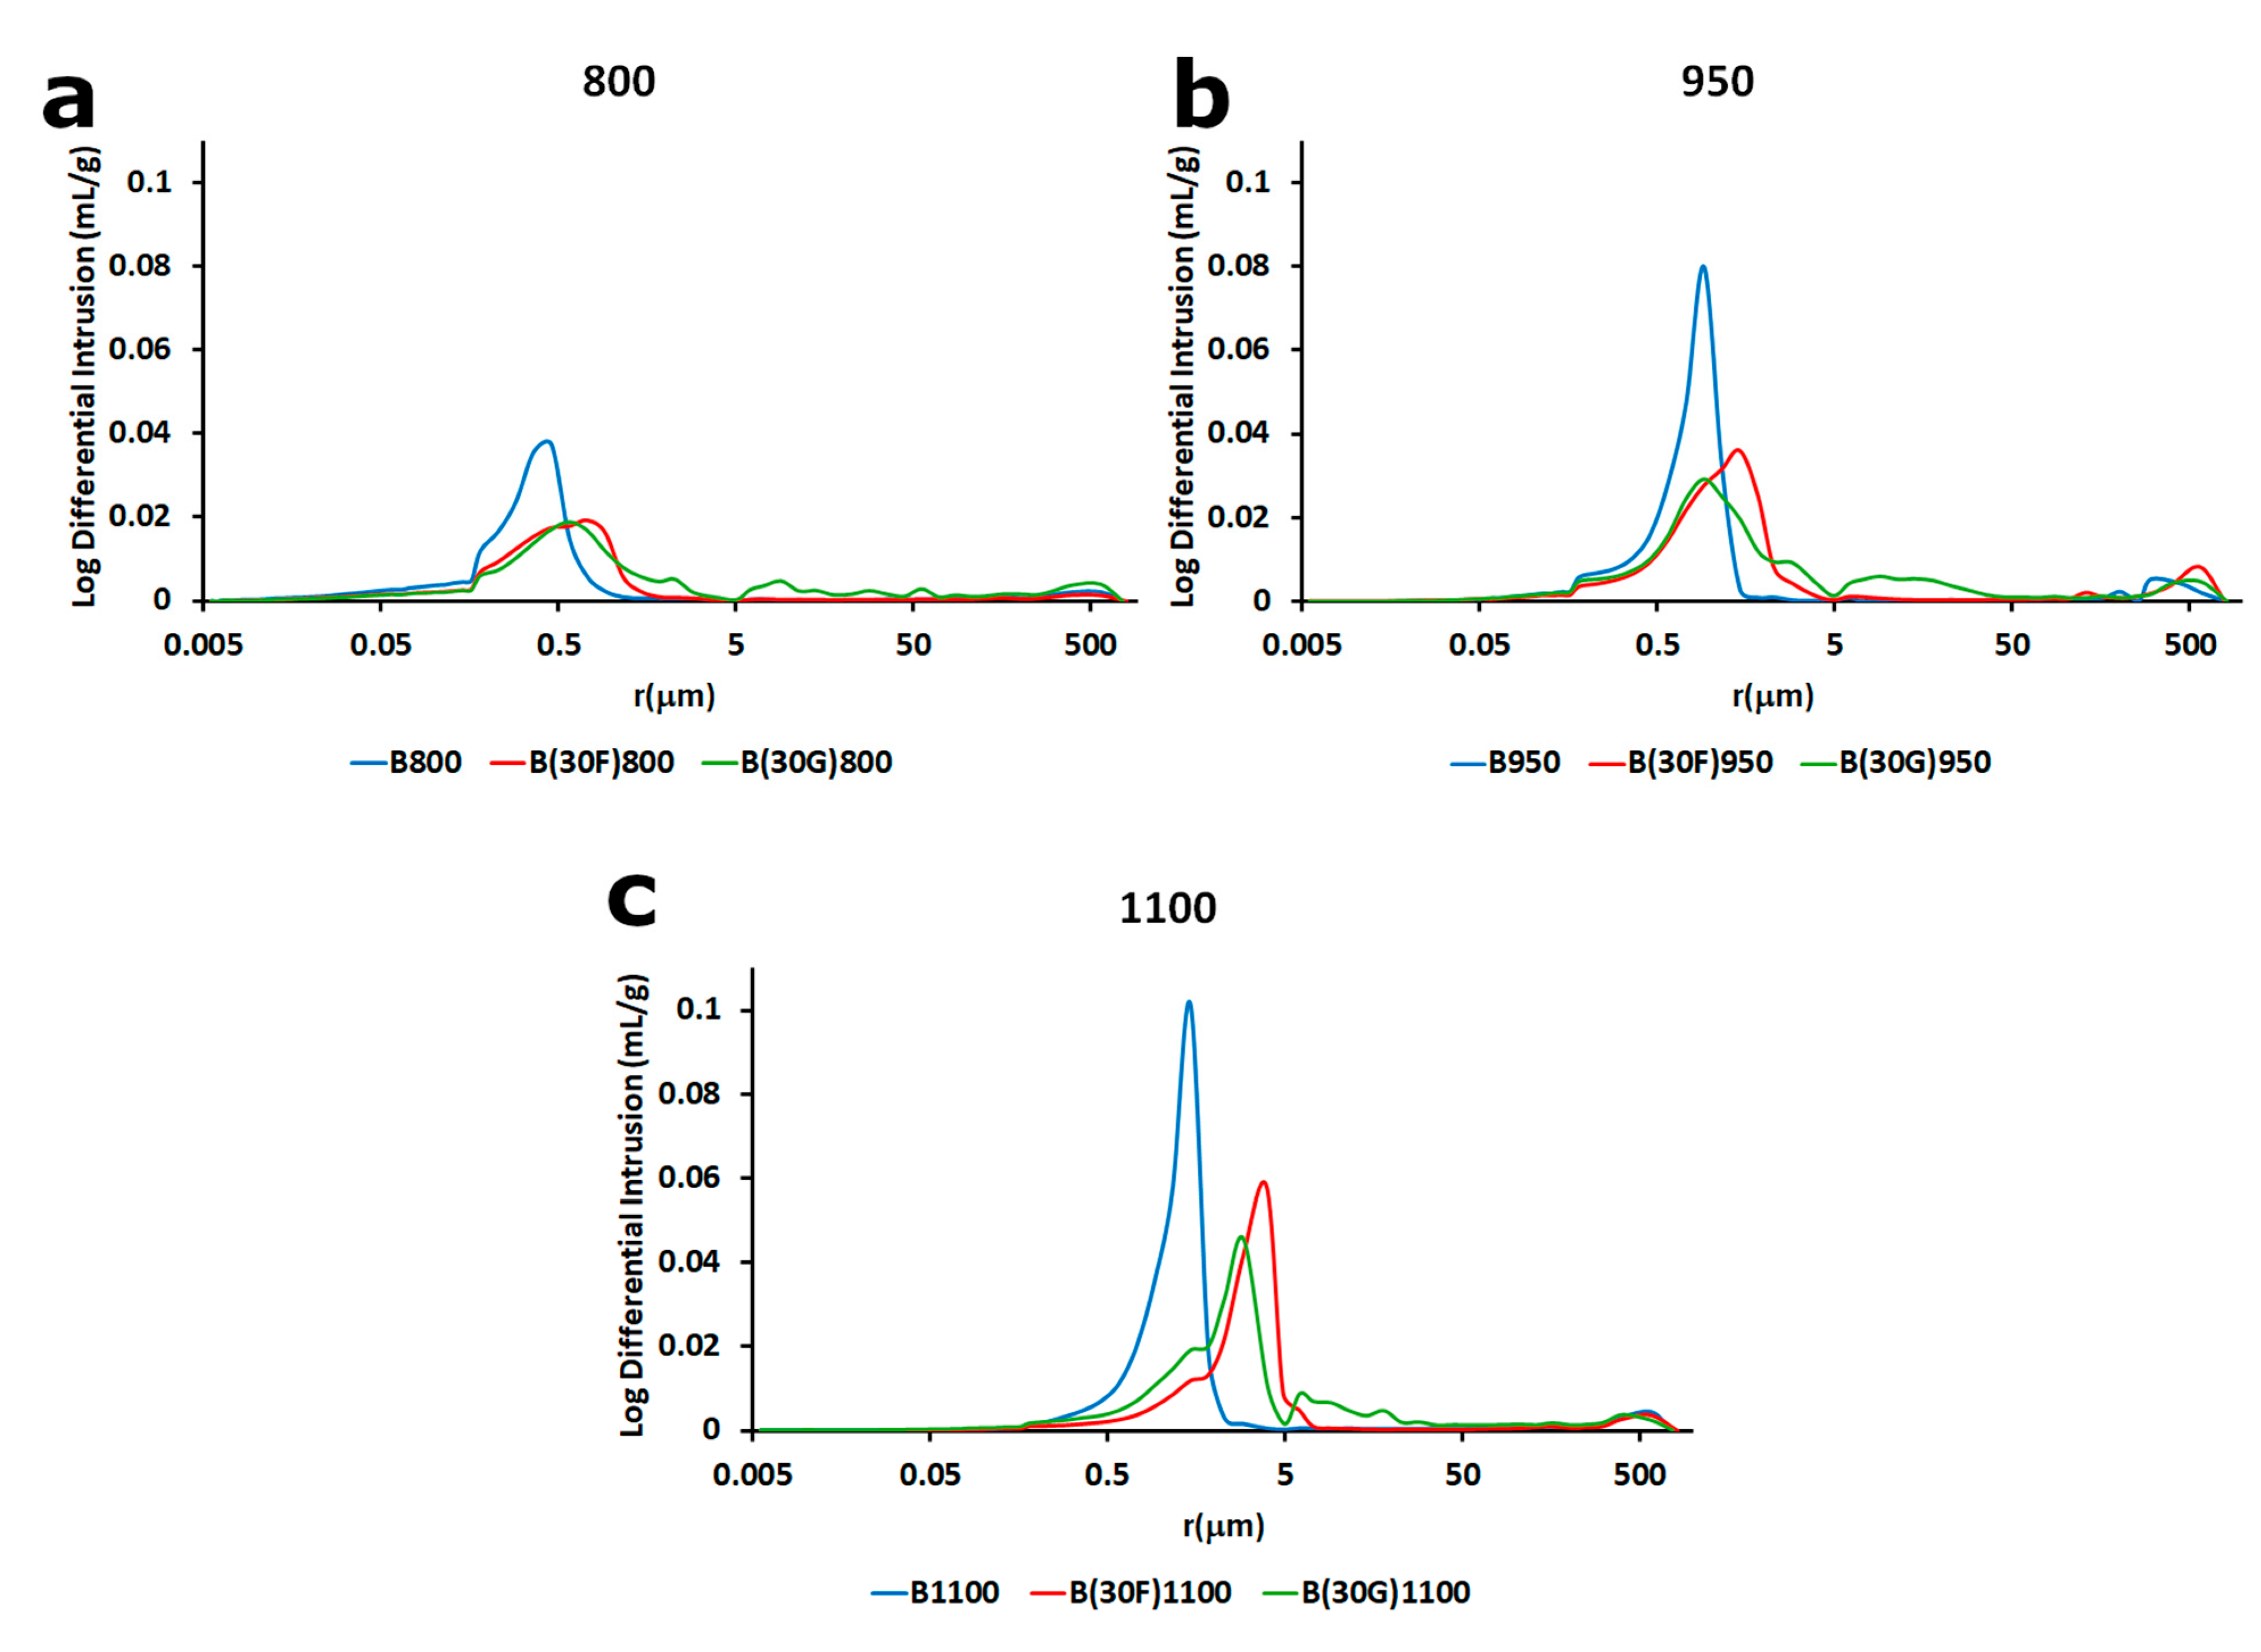
2.1. Study of the Pore System

The fluid circulation in the pore network and the porosity of the bricks were studied using hydric tests and mercury intrusion porosimetry (MIP).
With regard to the hydric tests, free and forced water absorption and drying tests were carried out according to the UNE-EN 13755 [23] and NORMAL 29/88 [24] standards. The results obtained in these tests were used to calculate the drying index (Di), saturation coefficient (S), open porosity (Po), and apparent and real densities (ρa and ρr) according to RILEM [25] and the degree of pore connection (Ax) after Cultrone et al. [26].
For the MIP test, a fragment per sample of about 1 g was analyzed using a Micromeritics Autopore V 9600 porosimeter (Micromeritics Instrument Corporation, Norcross, GA, USA) that provides information about the pore size distribution within the range 0.005–500 μm. The samples were dried in an oven at 60 °C for one week to remove any possible moisture before the analysis. The open porosity (PoMIP), apparent and real densities (ρaMIP and ρrMIP) and the specific surface area (SSA) were also determined.
To better understand the pore system of the bricks, magnified images of the samples were taken by means of a Phenom XL Desktop Scanning Electron microscope (SEM, Thermo Fisher Scientific, Waltham, MA, USA). For this purpose, polished thin sections of the bricks were prepared and carbon coated prior to their observation under the microscope.

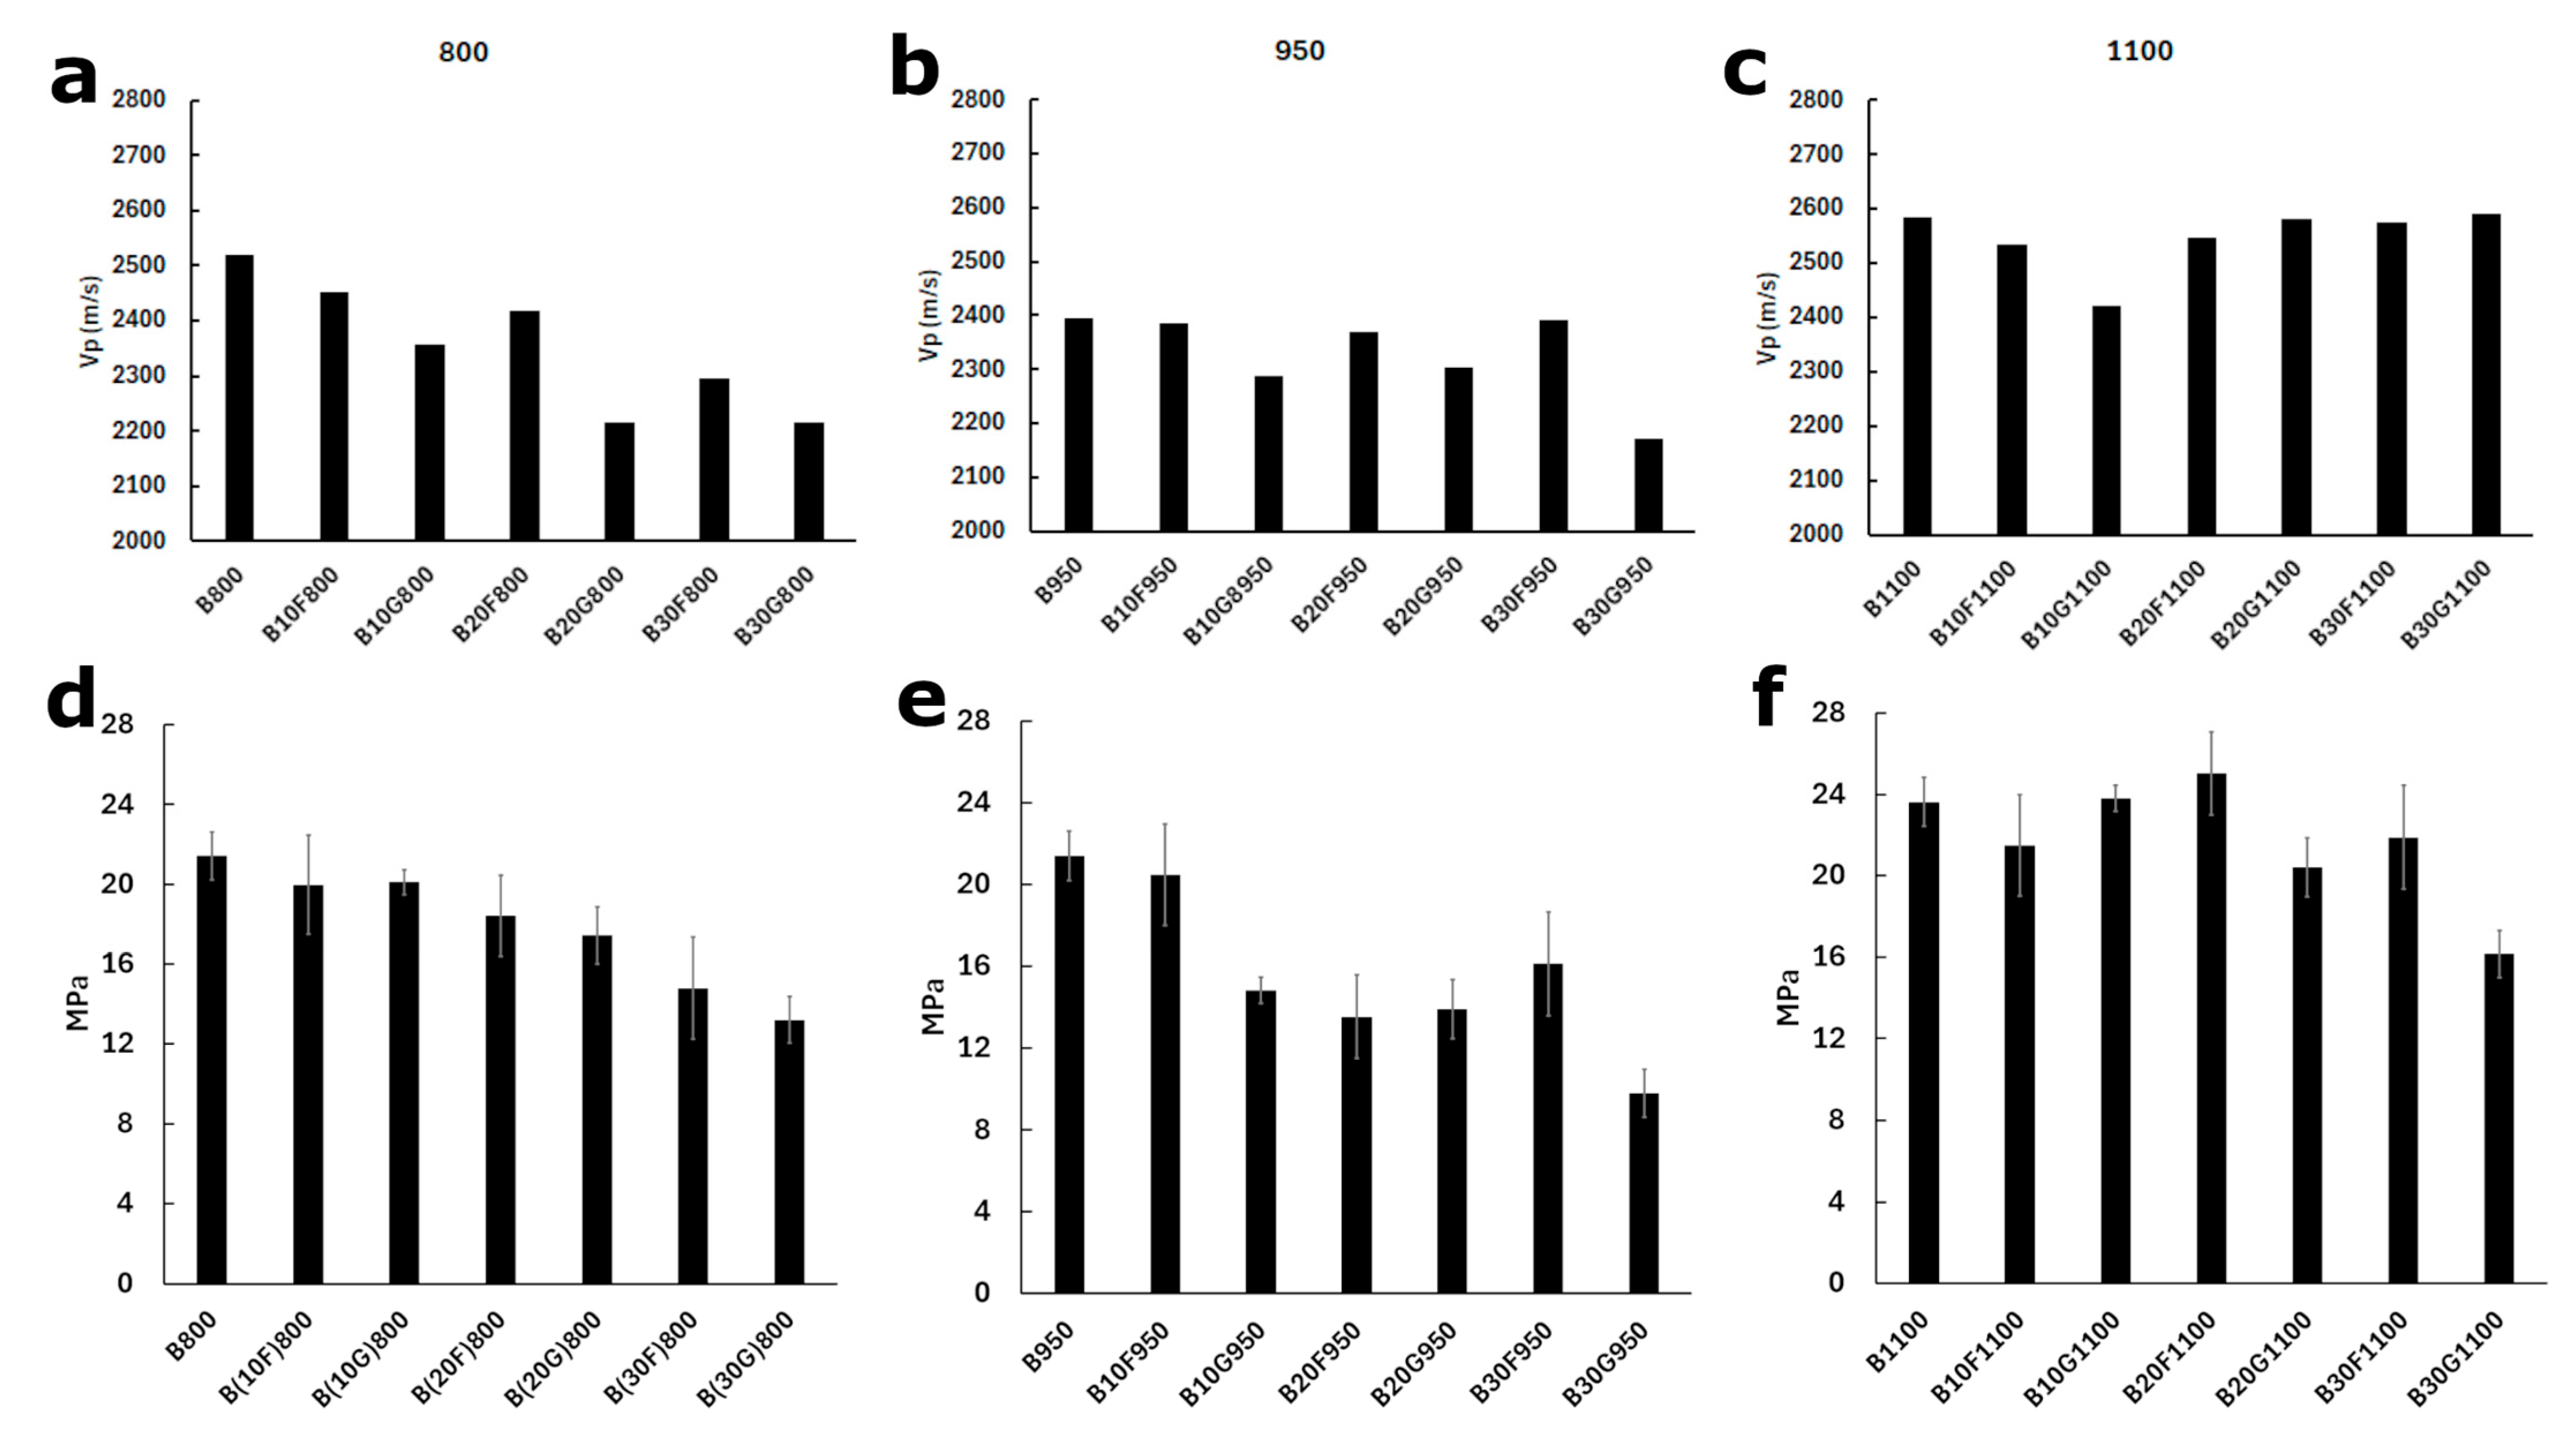
2.2. Compactness, Compressive Strength and Thermal Conductivity

The velocity of ultrasonic waves was used to determine the compactness of the bricks. P-wave velocity (Vp) through cubic bricks with a side length of 4 cm was determined using a Panametrics Model 5058PR pulser–receiver (Panametrics, Billerica, MA, USA) apparatus coupled with a Tektronix TDS3012B oscilloscope (Tektronix, Beaverton, OR, USA) and 1 MHz transducers.
Uniaxial compression tests were performed by means of an Instron 3345 press (Instron, Norwood, MA, USA) in order to determine the compressive strength of the bricks with and without volcanic ash additives. The bricks were cut into cubes with a side length of 1 cm and were subjected to a loading rate of 3 mm/min until failure. Six cubes per sample were analyzed.
To qualitatively study the thermal conductivity of the bricks, all samples were observed with a thermographic camera Flir T440 (FLIR Systems, Wilsonville, OR, USA) to obtain images of their infrared radiation over time. The bricks were placed on a thermal plate at 50 °C for 30 min and IR photographs were taken every 30 s. A particular emphasis was placed on the evolution of the height of the isotherm of 45 °C, as it indicates the difference in thermal conductivity between the bricks.

2.3. Color of the Bricks

A Konica–Minolta CM-700d spectrophotometer (Konica Minolta, Tokyo, Japan) was used to measure the color of the bricks using the illuminant D65. The results were obtained for the CIE L*a*b* system, where L* is the lightness and has a value between 0 and 100, while a* is the chromatic axis that represents red (positive values) and green (negative values) and b* represents yellow (positive values) and blue color (negative values), with the values of both parameters being between −60 and 60. The chroma and hue angle (C* and h°, respectively) were also determined. The color of the bricks with the volcanic ash additive were compared with the ones without the additive and fired at the same temperature through the following equation [27]:
E * = L 2 + a 2 + b 2
where ∆E represents the color difference and is calculated through the variance of lightness (∆L) and chromatic values (∆a and ∆b).

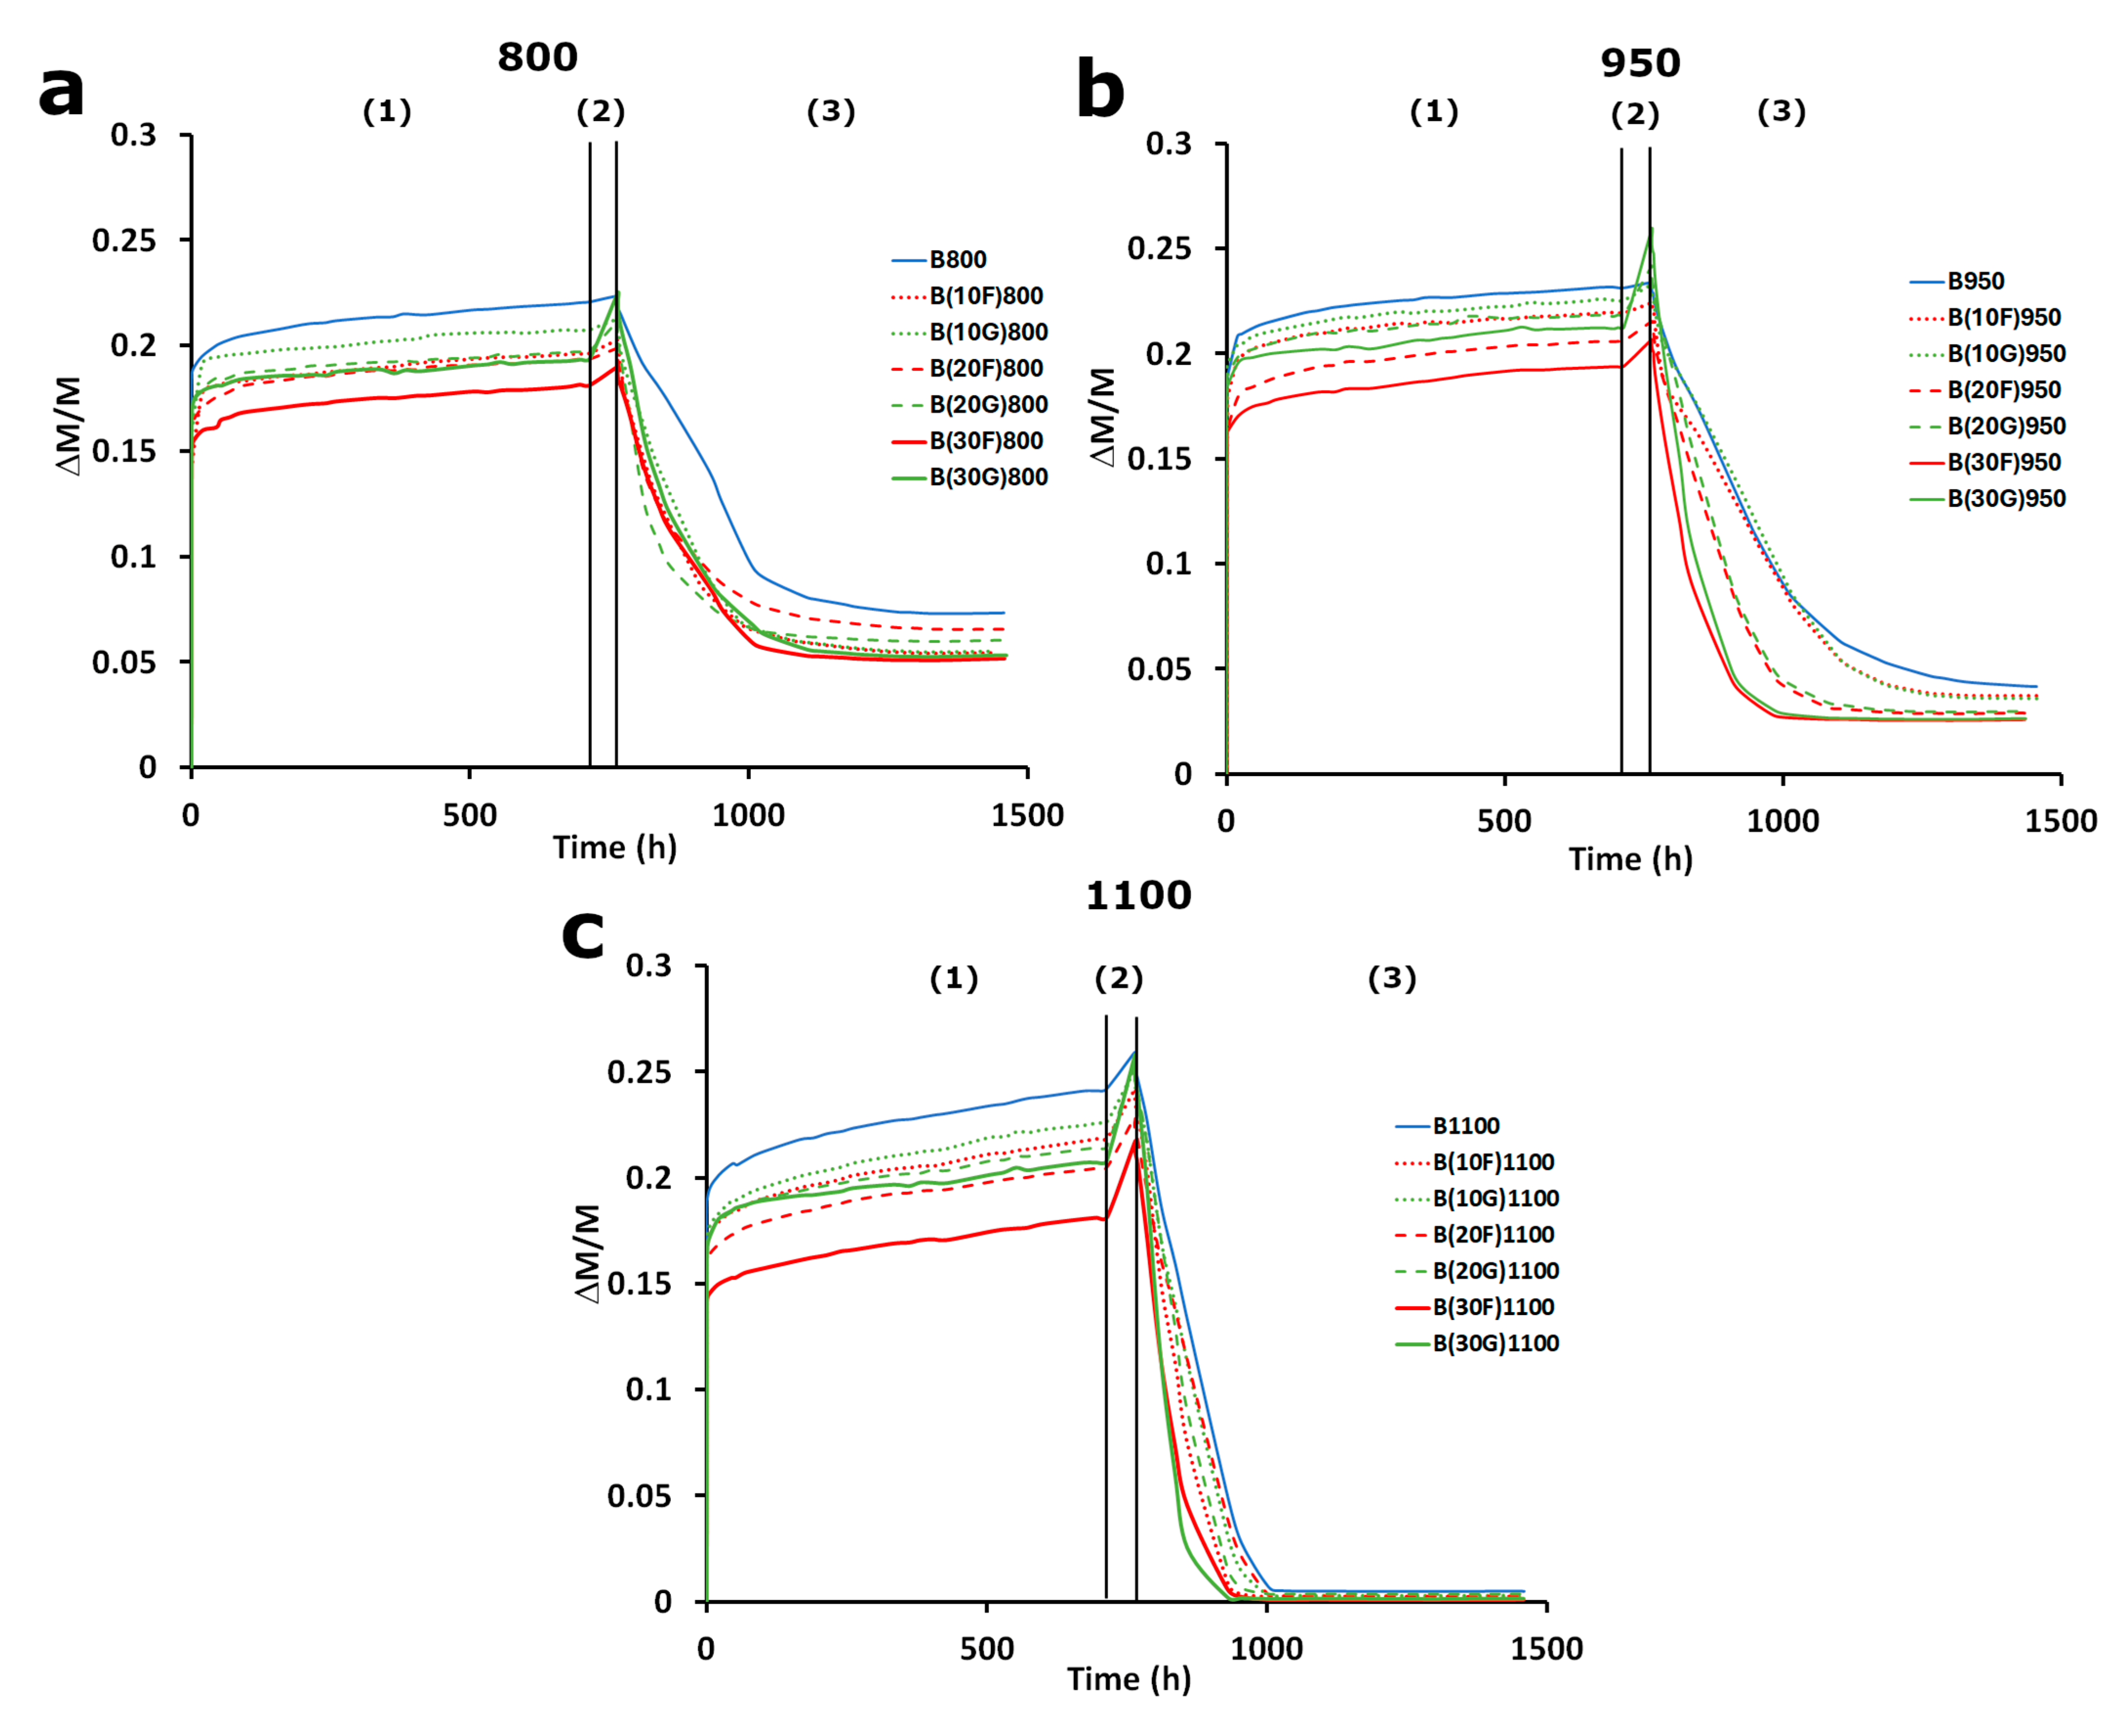
2.4. Durability by Salt Crystallization

The durability of the bricks was determined through salt crystallization cycles, performed according to the UNE-EN 12370 [28] standard. A 14% Na2SO4 × 10H2O solution was prepared and the bricks went through 15 crystallization cycles. The edges of the bricks were marked before testing in order to visually control their deterioration. The decay was recorded daily by weighing the samples.

3. Results and Discussion

3.1. Study of the Pore System

Fired bricks are mainly composed of quartz. Firing at 950 °C leads to the formation of gehlenite, while diopside appears in samples fired at 1100 °C. The interaction between the volcanic ash additive and the brick matrix does not trigger the formation of new phases. In fact, the addition of volcanic ash to the fired bricks only entails the identification of augite, which was originally present in the volcanic ash. More details on the mineralogy of the raw materials and the fired bricks can be found in López Gómez & Cultrone [21].
Table 2 shows the results of the hydric test and mercury intrusion porosimetry (MIP) of the brick with and without volcanic ash and Figure 1 plots the temporal evolution of the bricks’ weight during the hydric test. If we consider the bricks without additives (control samples), the hydric tests reveal that the free and forced water absorption (Ab and Af, Table 2) increase with the firing temperature. Additionally, Figure 1 shows that the bricks fired at 1100 °C absorb water more gradually than the bricks fired at 800 and 950 °C, where the water absorption is more abrupt (sector 1 of the curves in Figure 1a–c). The degree of pore interconnection is lower (higher Ax, Table 2) for the bricks fired at 1100 °C (over 6%) than for the bricks fired at 800 and 950 °C (up to 1.2%). Therefore, at 1100 °C it is more difficult for water to circulate between the pores and capillaries of the bricks, possibly due to the high degree of vitrification of the clay matrix reached at this temperature. This is in line with the steeper slope of the curve observed for sample B1100 (sector 2, Figure 1c). This behavior is confirmed by the saturation coefficient (S, Table 2), whose trend is opposite to Ax’s. The more tortuous the pore system (high Ax), the lower the saturation of the bricks (low S). The drying index of the bricks (Di, Table 2) is very similar, being slightly lower for the bricks fired at 1100 °C.
Finally, the porosity of the control bricks fired at 800 and 950 °C is similar (around 36%) and lower when compared with the bricks fired at 1100 °C (40%). The increase in porosity with the firing temperature may be explained by the total decomposition of carbonates leaving voids where these grains were present [29]. Regarding the density, the most porous bricks are logically those with the lowest bulk density (ρa, Table 2). The real density (ρr, Table 2) varies between 2.50 and 2.60 g/cm3, in line with the mineralogy of these bricks [21].
The addition of volcanic ash reduces the water absorption capacity. In fact, the Ab values of the bricks with the volcanic ash additive are always lower than those of the control samples (Table 2). This trend is maintained after the forced absorption test (Af, Table 2), although sometimes the values of the bricks with the coarse volcanic ash additive are equal to or slightly higher than those of the control samples. This results in an increase in Ax values and a decrease in S, indicating some difficulty for water circulation within the bricks with added volcanic ash. If we compare the samples according to the grain size of the volcanic ash additive, we can see that the bricks made with the addition of fine volcanic ash additive absorb less water and those with the coarse volcanic ash additive have the worst degree of pore interconnection (higher Ax). The range for drying index (Di) is practically the same as the control bricks and is still influenced by the firing temperature rather than by the additive content. The use of the coarse volcanic ash additive always results in a higher porosity compared with the fine one, reaching the highest value at B(30G)1100 (41.7%, Table 2). The density values, especially real density (ρr, Table 2), are somewhat higher than that of the control samples due to the presence of iron-rich phases such as titanomagnetite [30] in the volcanic glass. The standard deviation for free water absorption (Ab), forced water absorption (Af) and for open porosity (Po) is slightly higher for the bricks with the volcanic ash additive than for the control samples (Table 2). This is due to the addition of a material (the volcanic ash) that has a totally different pore system than that of the brick matrix, as will be seen later in the SEM images.
The MIP curves (Figure 2) reveal that all the control samples have a unimodal pore size distribution with the maximum peak moving to the right of the graph (i.e., towards higher radius sizes) from 0.46 μm at 800 °C to 1.46 μm at 1100 °C and increasing in intensity with increasing temperature. The addition of volcanic ash decreases the intensity of the maximum peak relative to that of the control sample and shifts it towards higher radius sizes, especially with the addition of fine particles (Figure 2). It is also important to note that the curves of the bricks with coarse ash grains lose their unimodality and one or more pore families appear around 10 μm and 500 μm. The appearance of these new pore families is most likely responsible for the change in the degree of interconnection between the pores. With respect to the porosity and apparent density (PoMIP and ρaMIP, Table 2) there is a slight difference between the results obtained through the hydric test and MIP, but the trend is maintained as a function of temperature and brick composition. PoMIP increases with temperature and is lower when volcanic ash is added, and the densities (ρaMIP and ρrMIP) increase when this volcanic ash additive is present. The reduction in the porosity in the bricks with volcanic ash is not particularly new since it was already described by Cultrone [18]. The SSA values (Table 2) are always higher for the bricks without additive than for the bricks with volcanic ash, which indicates that volcanic ash acts as a filler, reducing the proportion of micropores. Moreover, the reduction in the SSA values is more noticeable for the bricks with fine volcanic ash than for the bricks with the coarse volcanic ash additive. SSA diminishes as the firing temperature increases, which indicates a reduction in smaller pores.
Figure 3 presents detailed images of the bricks with the highest percentage of volcanic ash (30% by weight) fired at 800 (Figure 3a) and 1100 °C (Figure 3b). Those bricks were selected to highlight the possible textural changes at the two extreme temperatures. As can be seen, the clay matrix of the sample fired at 800 °C (Figure 3a) shows small and irregular-shaped pores and the bond with the volcanic ash is limited. On the contrary, the matrix of the sample fired at 1100 °C is totally vitrified (Figure 3b), leading to bigger and rounder pores and a better link between the matrix and the ash fragments can be noticed. These observations correlate with the results of the hydric tests and mercury intrusion porosimetry. In fact, the higher vitrification of the brick matrix observed under SEM at 1100 °C hinders water circulation through the sample and leads to higher Ax values. Additionally, the vitrification of the sample results in larger pores for bricks fired at 1100 °C than for bricks fired at 800 °C, as can be seen in the pore size distribution curves (Figure 2). The addition of volcanic ash does not entail an increase in the porosity of the bricks, as the pores present in this additive are badly connected.

3.2. Compactness, Compressive Strength and Thermal Conductivity

Figure 4 shows the results of the P-wave velocity (Vp) and the resistance to the uniaxial compression test of the bricks. Both parameters are related to each other, as the presence of pores and fissures in the bricks decrease the P-wave velocity through the bricks [31] and reduces their uniaxial compressive strength [32].
The bricks without additives and fired at 800 (Figure 4a) and 950 °C (Figure 4b) present a lower P-wave velocity (2521.12 and 2395.10 m/s, respectively) than the bricks fired at 1100 °C (2585 m/s, Figure 4c). Also, samples B800 (Figure 4d) and B950 (Figure 4e) present almost the same compressive strength (21.42 and 21.39 MPa, respectively), while sample B1100 presents a higher resistance (23.62 MPa, Figure 4f). This stems from the melting of the matrix in the bricks fired at 1100 °C, which results in a more compact and mechanically resistant structure.
The addition of volcanic ash to bricks fired at 800 °C entails a progressive decrease in the P-wave velocity (Figure 4a) and compressive strength (Figure 4d). The higher the volcanic ash additive percentage, the higher the decrease. Moreover, this decrease is more noticeable for bricks manufactured with the coarse volcanic ash additive than for those with fine volcanic ash. This trend is maintained in the bricks fired at 950 °C (Figure 4b,e) and can be explained by the vesicular structure of volcanic ash, which increases the close porosity of the bulk sample. As previously said, the increase in the sample porosity leads to the decrease in the compressive strength and the compactness of the bricks. This vesicular structure of the volcanic ash was indeed observed in the SEM image of the sample with 30% volcanic ash and fired at 800 °C (Figure 3a). Fine volcanic ash presents less vesicles than coarse volcanic ash, due to its size, which explains the difference in the compressive strength between the bricks manufactured with both volcanic ash additives. Belfiore et al. [20] also observed poorer physical and mechanical behavior in tiles manufactured with coarse volcanic ash than in those manufactured with a fine volcanic ash additive. They attributed these results to the fragile structure of the volcanic ash and its poor bond with the clay matrix.
This trend changes for the bricks fired at 1100 °C, where the P-wave speed (Figure 4c) and the uniaxial compressive strength (Figure 4f) do not decrease drastically after the incorporation of volcanic ash. A highly vitrified matrix and a better bond between the ash particles and the clayey matrix (Figure 3b) have contributed to maintaining the strength and the compactness of the bricks, especially for the bricks manufactured with the fine volcanic ash additive. The bricks manufactured with the coarse volcanic ash additive are still influenced by the presence of vesicles, as the compressive strength of the bricks with 20 and 30% coarse volcanic ash additive slightly decreases with respect to the bricks without additives.
Except for sample B(30G)950, the compressive strength of all the bricks stands above 10 MPa, which is the minimum value required for a brick to be used in construction according to the RL-88 [33] standard. With regards to sample B(30G)950, its resistance (9.79 MPa) almost reaches this value and stands above 5 MPa, which is the minimum resistance required for a lightweight ceramic. Therefore, all the bricks tested are allowed to be used for construction.
Figure 5 represents the thermographic images of the bricks taken after 30 min of heating. In general, the difference in thermal conductivity registered between the bricks is not enough to draw decisive conclusions, as the isotherms in the bricks reach almost the same height, regardless of the additive size (Figure 5a) and the presence or absence of the additive (Figure 5b,c). As a result, the addition of volcanic ash does not adversely affect the thermal insulation of bricks used for construction. According to Bhattacharjee & Krishnamoorthy [34], thermal conductivity depends on the porosity of the bricks. It can be argued that the addition of volcanic ash acts as a temper that decreases the presence of micropores in the brick matrix, which would decrease thermal insulation. Conversely, volcanic ash also presents vesicles that increase the presence of closed pores in the bricks, and this would increase the thermal insulation of the resulting bricks. Although the addition of volcanic ash entails an increase in the close porosity of the bricks, and so the thermal insulation of the bricks, the percentage selected may have not been enough to compensate for the decrease in micropores in the matrix. As a result, the differences between the bricks with and without volcanic ash additives are negligible through this technique.

3.3. Color of the Bricks

Table 3 presents the colorimetry results, as well as the color difference between the control samples and those with added volcanic ash. In general, an increase in the firing temperature of the bricks increases their lightness. This is probably due to the gradual vitrification of the bricks which leads to smoother and more reflective surfaces [35].
According to the chromatic coordinates, the bricks can be divided into two groups (Figure 6): bricks fired at 800 and 950 °C, which present higher values of a* (from 12 to 17, they are redder), and bricks fired at 1100 °C, where a* values are lower (between 8 and 9). The red color of bricks is linked to the formation of hematite [36]. At 1100 °C, the iron present in the calcareous clayey matrix is trapped by newly formed Ca-silicate phases, which reduces the formation of hematite and leads to less reddish colors in these bricks [37]. Fe ions can also enter in the lattice of other silicates such as mullite [38], although its presence is more abundant in non-calcareous bricks [39]. In fact, mullite is not present in these bricks [21]. Therefore, Fe is possibly incorporated into the structure of other silicates such as gehlenite [40]. The bricks with and without volcanic ash and fired at 1100 °C are less scattered than the bricks fired at 800 and 950 °C, that are dispersed following a linear trend. The unheated volcanic ash is black, but when it is fired at 1100 °C it turns red, blending better with the brick matrix and leading to less disperse colorimetric values. Regarding the color difference (ΔE*) between the bricks with and without volcanic ash additives, ΔE* increased with the addition of volcanic ash. However, the ΔE* is almost always below 3, except for some bricks fired at 950 °C, which means that the difference in color is imperceptible to the human eye [41]. In the case of bricks with ΔE* > 5 the two colors can be defined as totally different. In general, the color difference is more evident in the bricks with the fine grain size than in those with the coarse grain size.

3.4. Durability of Bricks by Salt Crystallization

Figure 7 collects the results obtained after the salt crystallization tests. During this test, bricks initially increase their weight due to the crystallization of sodium sulfate in the pores of the bricks. This increase is related to the free water absorption measured during the hydric tests, as the easier the water entry is, the higher the salt penetration is in the sample. The crystallization of sodium sulfate inside the bricks exerts pressure on the pores and fractures of the bricks which leads to their deterioration and loss of weight. According to Benavente et al. [42], samples with a lower compressive strength should be more susceptible to salt crystallization tests, as they are less resistant to the stress produced by the crystallization of salts in their pores. Therefore, the results of the crystallization test rely on the percentage of salt that enters the bricks (related to the free water absorption) and the bricks’ strength (related to the uniaxial compression strength).
As can be seen, the bricks without volcanic ash additive undergo the highest weight increase. Among these samples, the bricks fired at 800 and 950 °C present a higher weight increase than the bricks fired at 1100 °C. This occurs because water absorption in samples B800 and B950 is more abrupt than for sample B1100 where free water absorption was slower (see Figure 1, Section 3.1). Moreover, at 1100 °C the bricks are highly vitrified and better resist the crystallization of salt within the pores and fissures.
Regarding the effects of the incorporation of volcanic ash, the addition of this material reduces the absorption of saline solution. In fact, the higher the percentage of volcanic ash, the lower the weight increase during the salt crystallization test. This can also be justified by the higher water absorption measured for bricks without the volcanic ash additive.
Considering only water absorption, the bricks without volcanic ash additives and fired at 800 and 950 °C should show the highest deterioration signs after the aging test. However, the bricks with volcanic ash also show decay symptoms such as powdering and the appearance of fractures after the test. The decay of these bricks is explained by both the water absorption and the compressive strength. The addition of volcanic ash reduces water absorption, which also reduces the percentage of salt that crystallizes inside the pores of the bricks. The greater the percentage of volcanic ash added, the lower the free water absorption and, consequently, the crystallization of salt inside the bricks. However, the addition of volcanic ash also reduces the compressive strength of the bricks. This reduction is greater with the higher percentage of volcanic ash and for bricks manufactured with the coarse volcanic ash additive. As a result, the bricks with the volcanic ash additive and fired at 800 and 950 °C are also vulnerable to salt crystallization in pores and fissures.
On the contrary, bricks with and without the volcanic ash additive and fired at 1100 °C appear to be intact after the salt crystallization test. These bricks register a lower weight increase (i.e., the crystallization of less salts in their pores) and the vitrification of their matrix improves their compressive strength, making them more resistant also to the mechanical pressure exerted by the crystallization of these salts in their pores. As a result, they are more resistant to decay tests.
This test shows that bricks manufactured with the fine volcanic ash additive generally show greater durability than bricks fired at the same temperature and manufactured with the coarse volcanic ash additive. The bricks fired at 1100 °C were unaltered after the test, regardless of the volcanic ash additive percentage and size.

4. Conclusions

This research evaluates the physico-mechanical behavior and the durability of samples manufactured with 10, 20 and 30% of two sizes of volcanic ash from La Palma added to calcareous clayey earth from Viznar. Samples were fired at 800, 950 and 1100 °C. This research offers novelty in terms of the selection of two sizes of additive and the use of a wide temperature range, which includes temperatures close to that of the liquidus of basaltic materials. The main results obtained during this study are as follows:
  • The porosity of the bricks decreases with the addition of fine volcanic ash. The use of coarse volcanic ash decreases the brick porosity at low percentages, but its use in high percentages results in bricks with almost the same porosity as bricks without volcanic ash additives.
  • Volcanic ash acts as a filler that decreases the microporosity of the bricks. This can be seen through the SSA values, as the addition of volcanic ash decreases the SSA, and so the microporosity of the bricks.
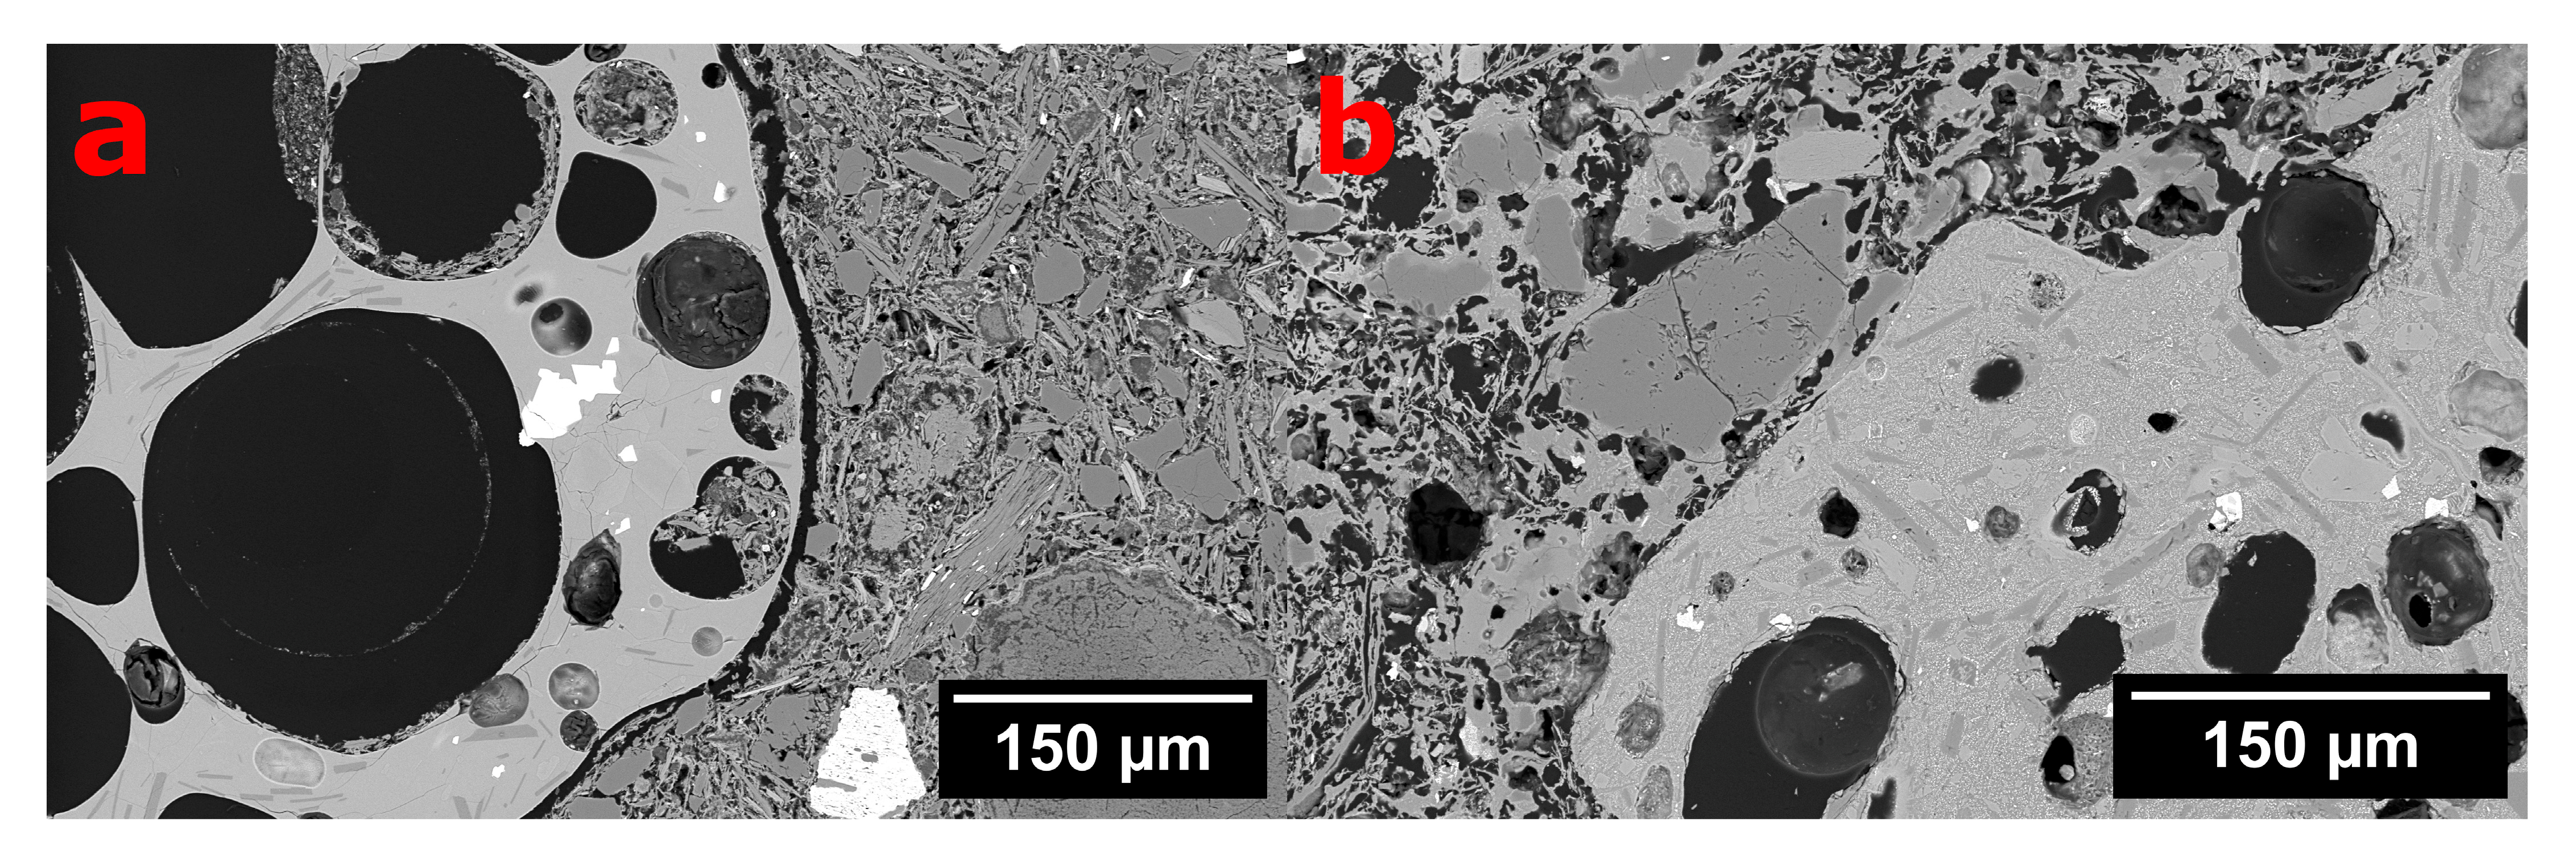
  • Under SEM, the bricks fired at 800 °C present smaller and more irregular pores than the bricks fired at 1100 °C, due to the vitrification of the latter. Moreover, a better bond between the brick matrix and the volcanic ash additive was observed in the bricks fired at 1100 °C than in the bricks fired at 800 °C.
  • The addition of volcanic ash at 800 and 950 °C decreases the compactness and the uniaxial compression strength of the bricks. This decrease is more noticeable when the coarse volcanic ash additive is used, due to the higher presence of vesicles that affect the compressive resistance of the bulk sample, and the poor bond between the brick matrix and the volcanic ash additive. The addition of coarse volcanic ash also decreases the compressive strength of bricks fired at 1100 °C, although this reduction is less significant than at the rest of the temperatures, due to the better bond between the volcanic ash and the melted matrix. The resistance of all bricks stands over or almost in reach (in the case of the sample with 30% of coarse volcanic ash and fired at 950 °C) of the values required to be used in construction (10 MPa) and all achieve the minimum resistance necessary for lightweight bricks (5 MPa), which means that they can be used for construction.
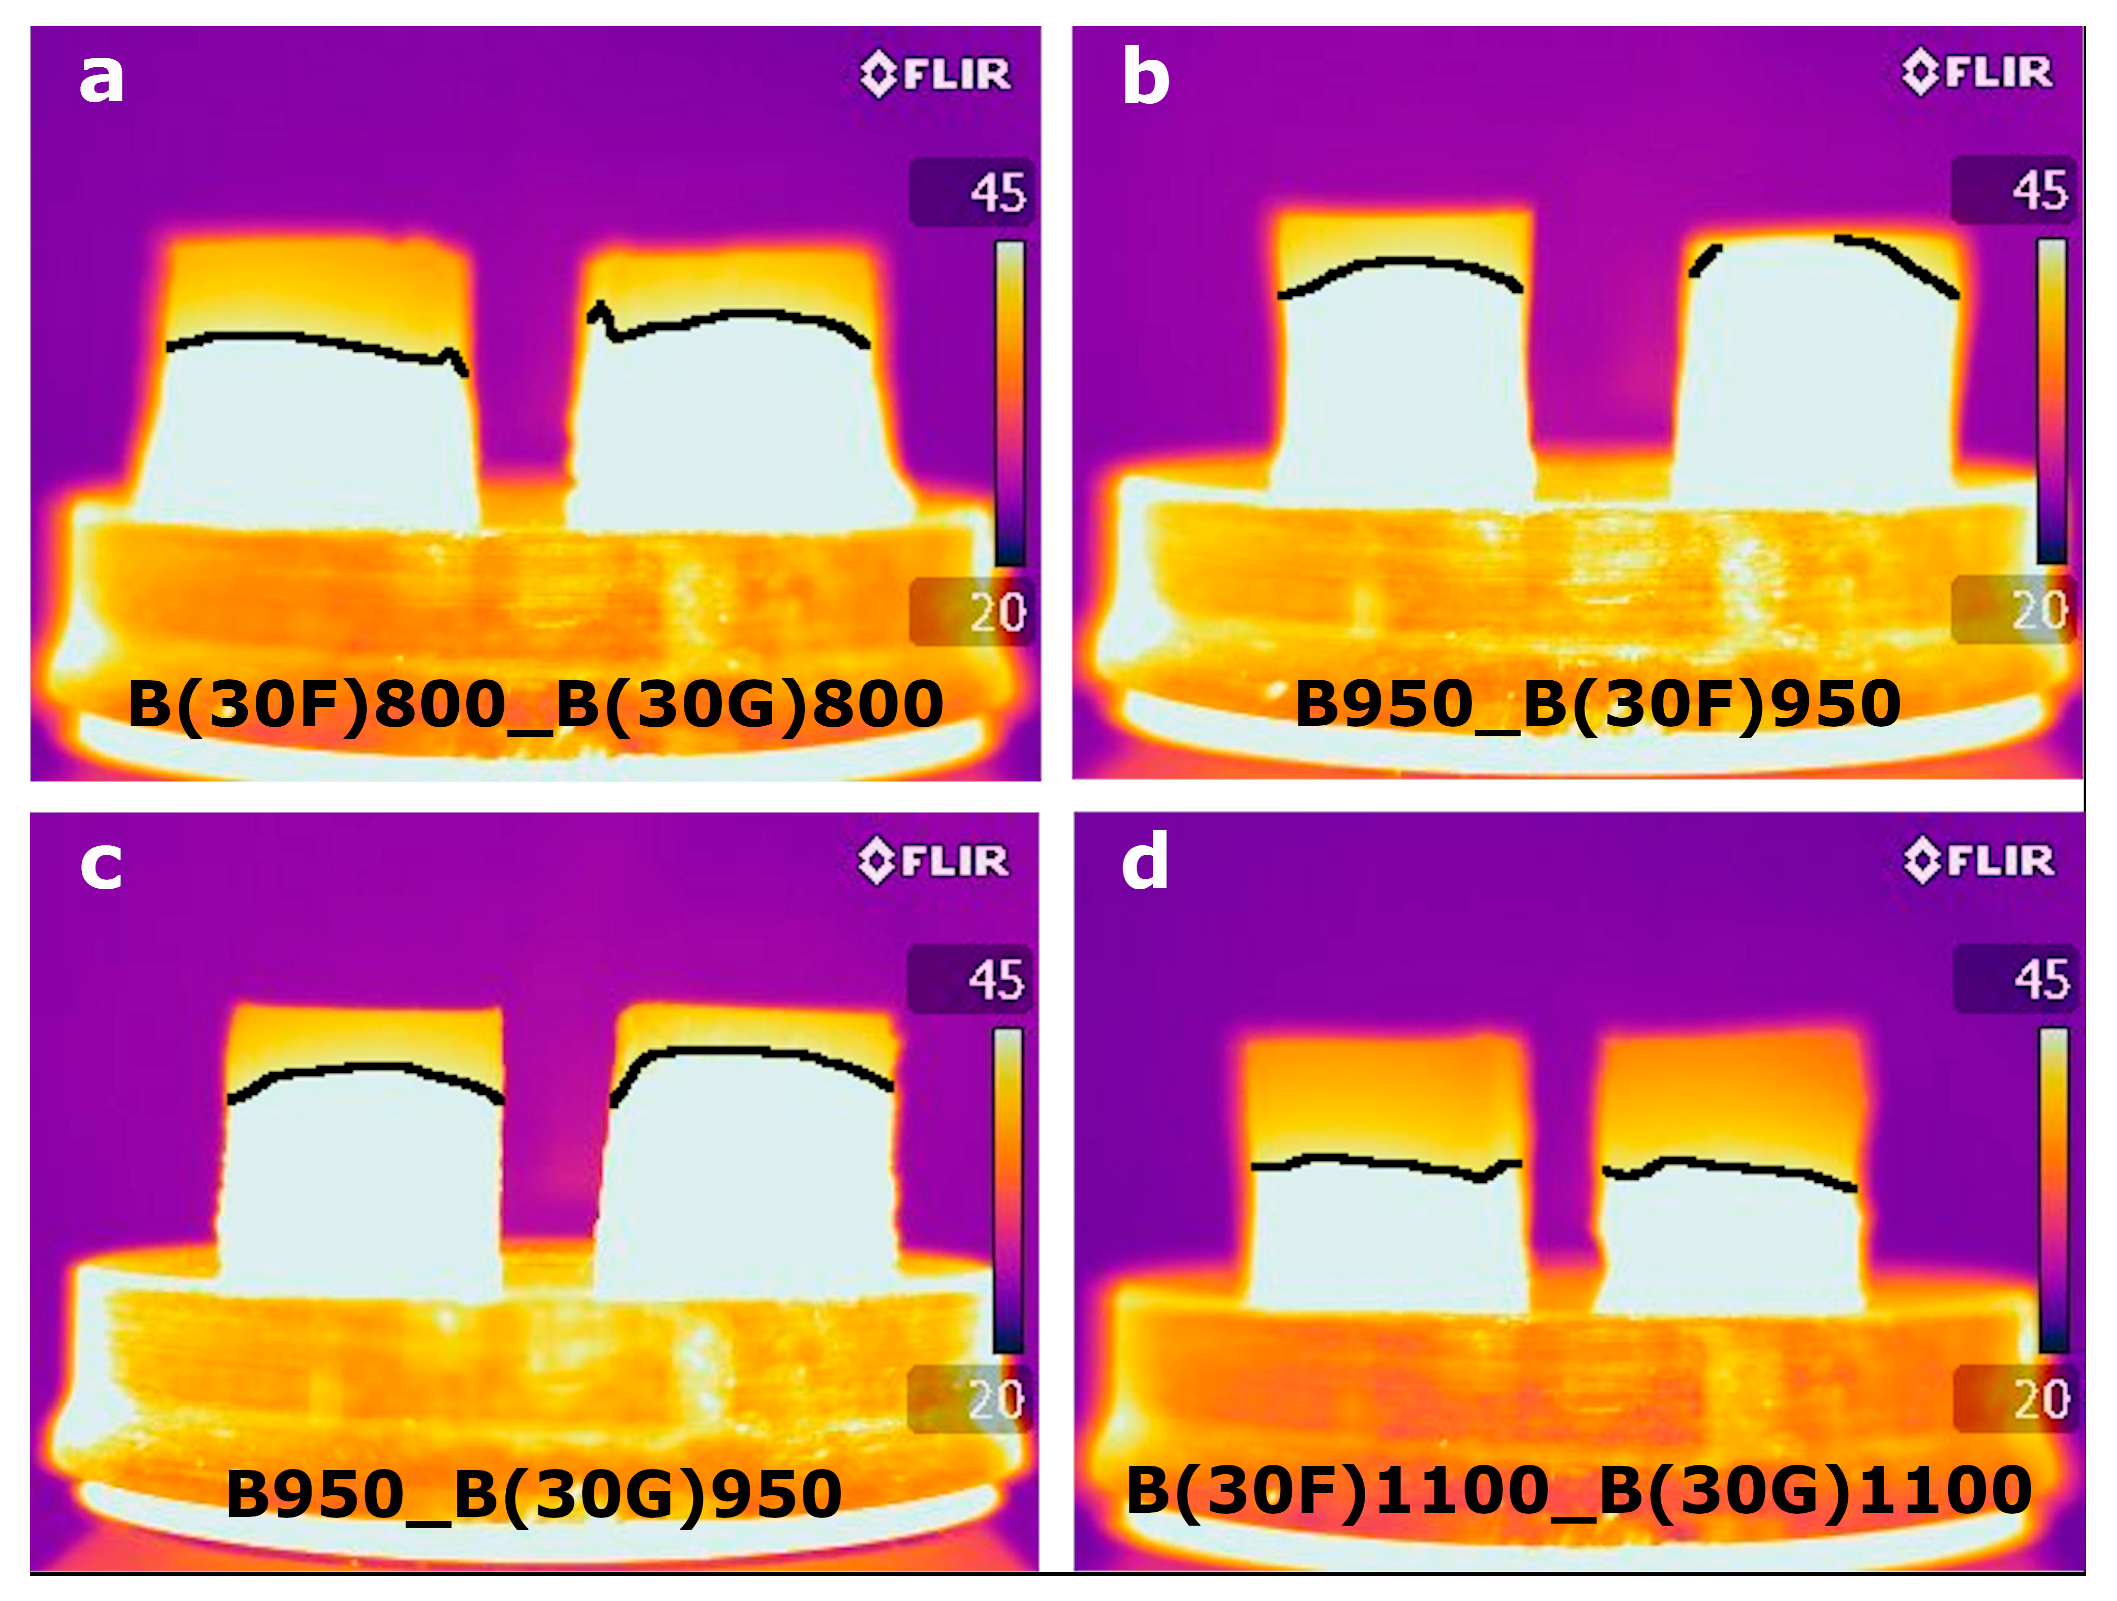
  • No significant differences in the qualitative heat conductivity were detected between the bricks.
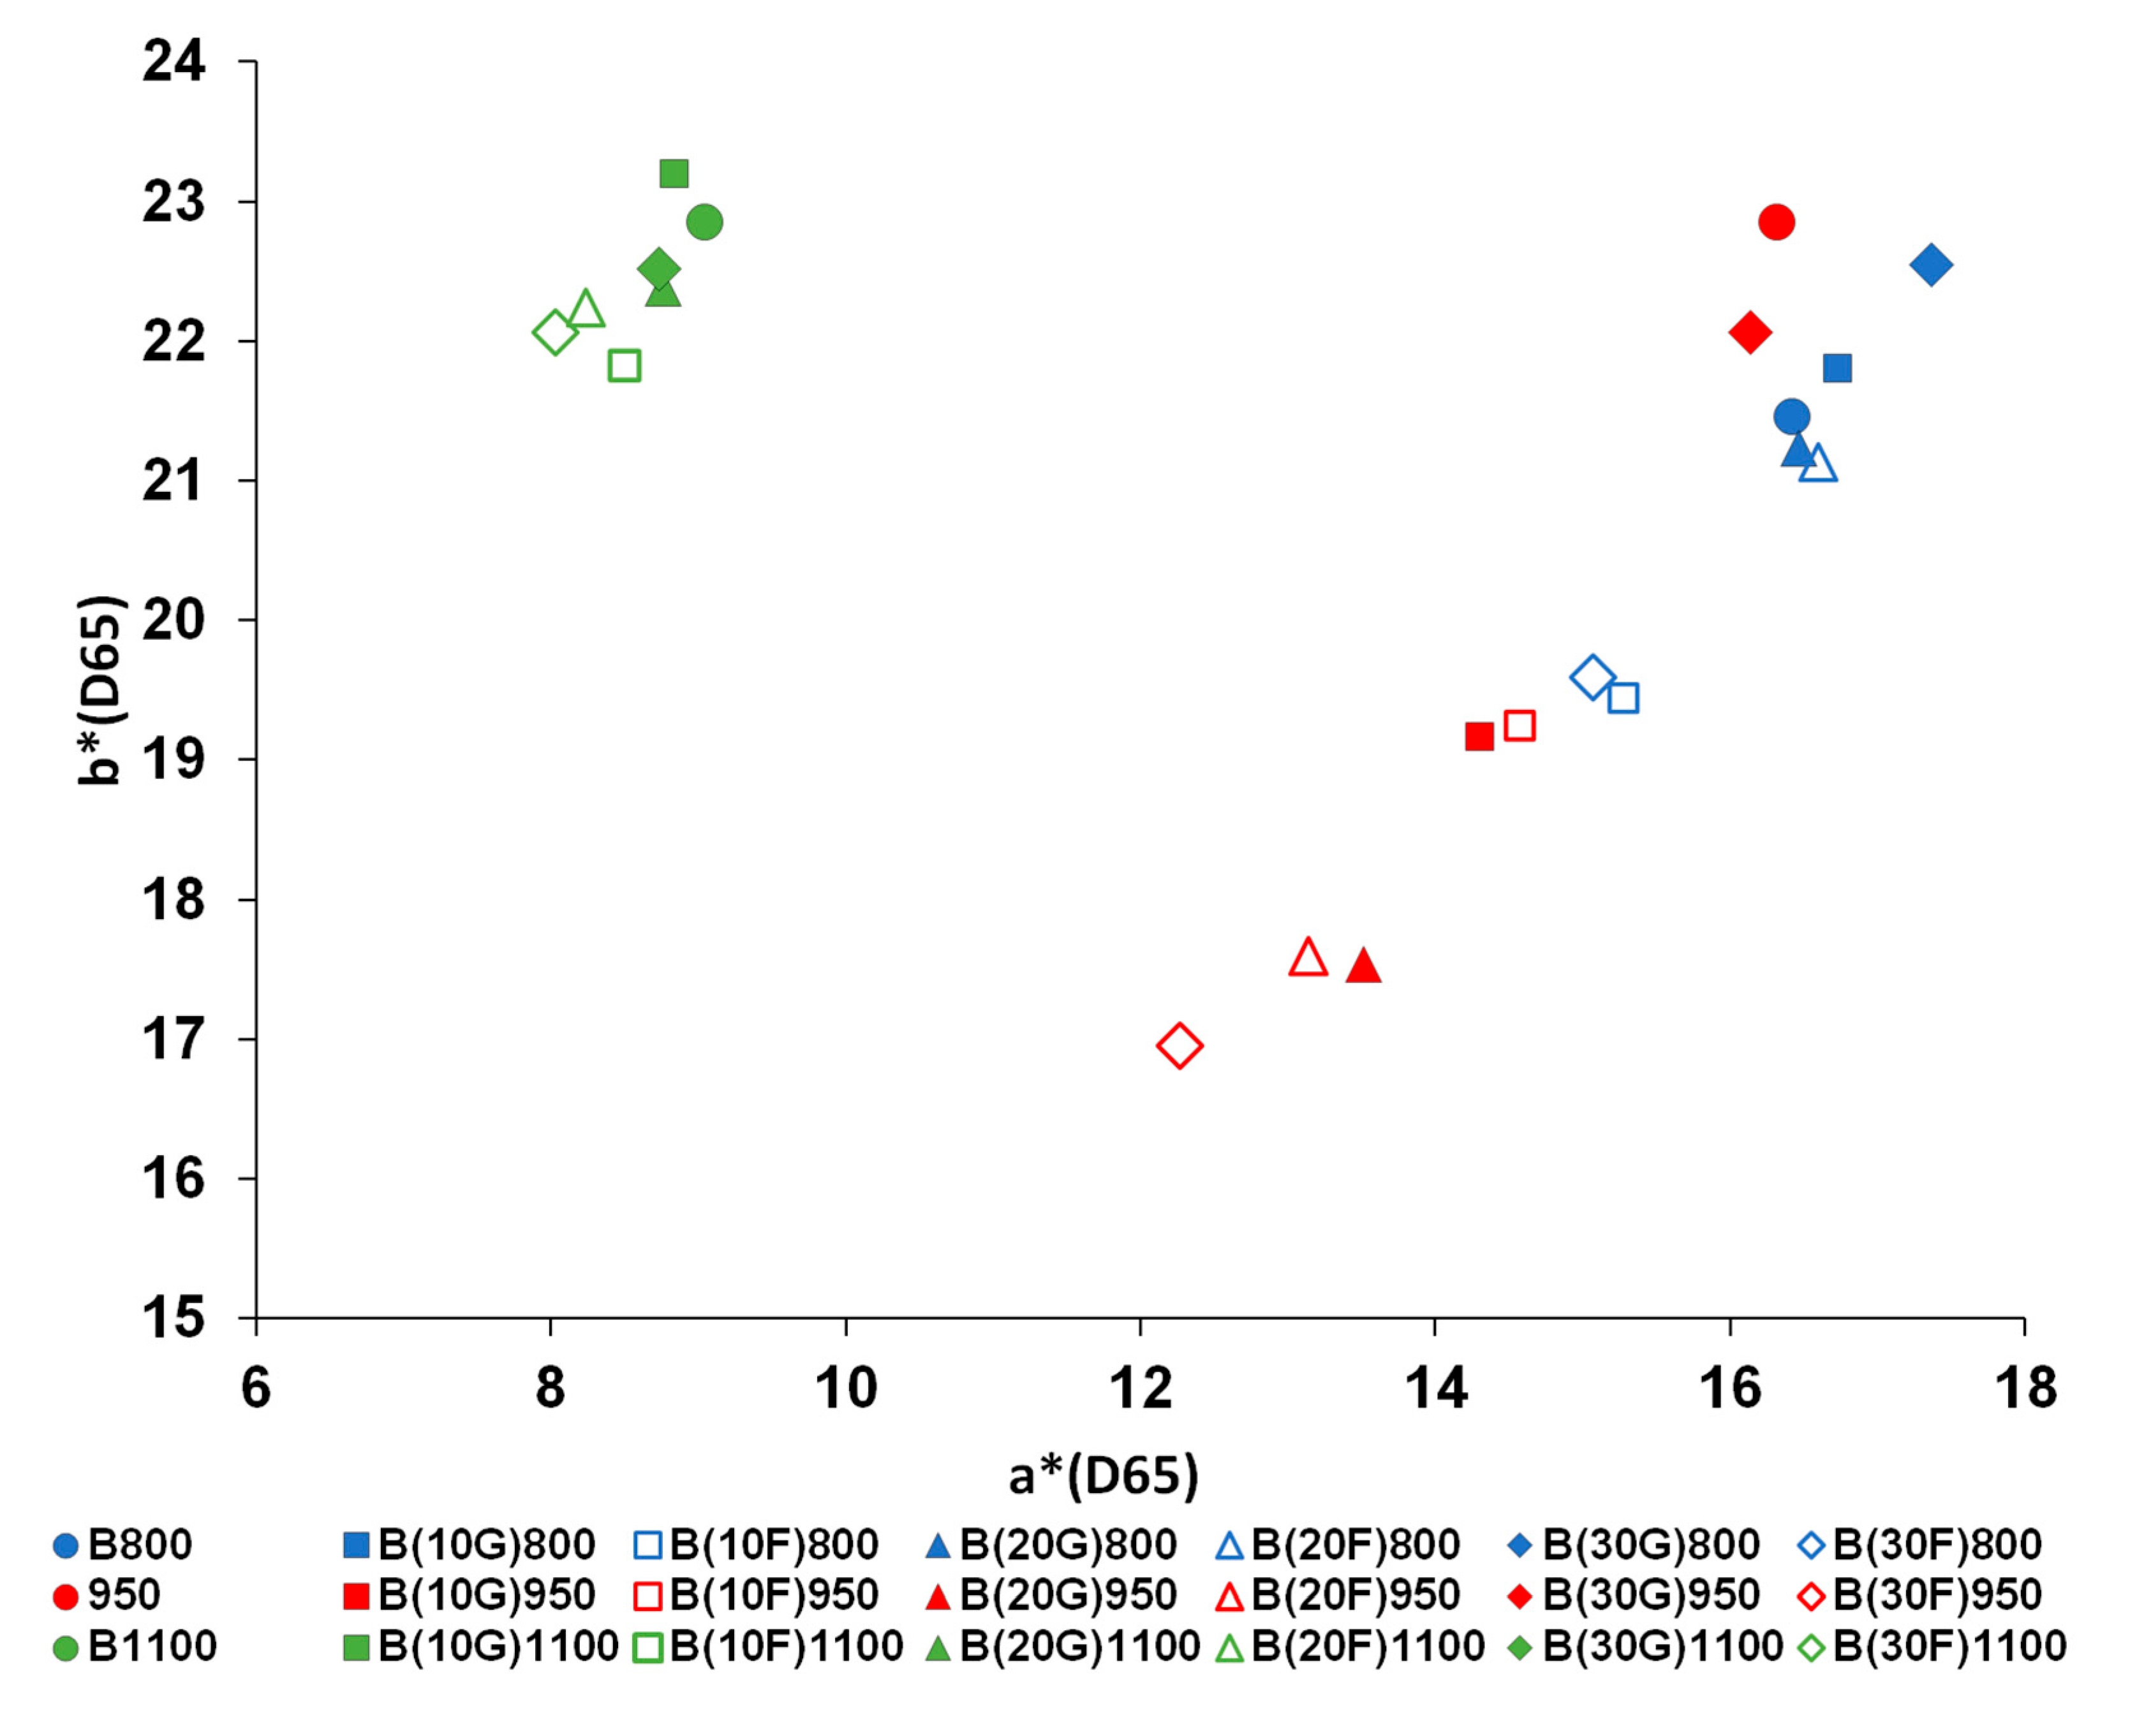
  • The addition of volcanic ash causes dispersed a* and b* values in bricks fired at 800 and 950 °C because at these temperatures the volcanic ash maintains its black color. At 1100 °C, the a* and b* values between bricks with and without volcanic ash are more homogeneous because the volcanic ash changes its color from black to red, blending in better with the color of the brick matrix.
  • Bricks with and without volcanic ash additives and fired at 800 and 950 °C show higher decay signs than those fired at 1100 °C, which is explained by a lesser crystallization of salt in the pores of bricks fired at 1100 °C and their better resistance to the salt crystallization pressure. The bricks with volcanic ash and fired at 800 and 950 °C also present decay signs after the test, which are explained by the lower compressive strength of bricks with volcanic ash compared with the control samples.
Taken together, the results from this study show the feasibility of using volcanic ash as an additive for the manufacture of fired clay bricks, especially for bricks fired at 1100 °C. This is interesting as the use of this additive reduces the depletion of clayey earth, which can considerably decrease annual manufacturing costs (e.g., up to 31.16 million USD in the USA), and offers a solution for the disposal of volcanic ash after an eruption. The measurement of quantitative heat conductivity, which may shed light on the thermal insulation of the bricks and allow the development of models to predict energy performance, should be considered in future research to better determine the performance of bricks with volcanic ash. Finally, it would be interesting to compare the behavior of the volcanic ash with other volcanic materials such as pumice, as their different pore system and composition can bring some physico-mechanical differences to the resulting bricks.

Author Contributions

Conceptualization, M.L.G. and G.C.; Data curation, M.L.G.; Formal analysis, M.L.G. and G.C.; Funding acquisition, G.C.; Investigation, M.L.G.; Methodology, M.L.G.; Project administration, G.C.; Resources, G.C.; Supervision, G.C.; Validation, G.C.; Visualization, M.L.G.; Writing—original draft, M.L.G.; Writing—review and editing, G.C. All authors have read and agreed to the published version of the manuscript.

Funding

This research was funded by the Junta de Andalucia Research Group RNM179.

Institutional Review Board Statement

Not applicable.

Informed Consent Statement

Not applicable.

Data Availability Statement

Data will be made available on request.

Acknowledgments

We would like to thank the Faculty of Dentistry (UGR) for letting us use the uniaxial compressive press.

Conflicts of Interest

The authors declare no conflicts of interest.

References

  1. Rodríguez-Losada, J.A.; Hernández-Gutiérrez, L.E.; Miranda-Hardisson, A.; González de Vallejo, L.I.; Cervigón-Tomico, G.; de los Ríos Díaz, H.; de Villepreux, E.; Álvarez-Hernández, A.; Afonso-Falcón, D. Evaluation of the Slopes Stability in the Lava Field of the 2021 Tajogaite Eruption (La Palma, Canary Islands) in Order to Recover the Territory for the Development of New Infrastructures. In Proceedings of the EGU General Assembly 2023, Vienna, Austria, 23–28 April 2023. EGU-13809. [Google Scholar] [CrossRef]
  2. Leoni, V.; Boto-García, D. The Effect of Natural Disasters on Hotel Demand, Supply and Labour Markets: Evidence from the La Palma Volcano Eruption. Environ. Resour. Econ. 2023, 86, 755–780. [Google Scholar] [CrossRef]
  3. PEVOLCA. Informe de Comité Científico: Actualización de La Actividad Volcánica En Cumbre Vieja (La Palma) 20/11/2021. 2021. Available online: https://www3.gobiernodecanarias.org/noticias/wp-content/uploads/2021/11/201121-INFORME-Comit%C3%A9-Cient%C3%ADfico-PEVOLCA1.pdf (accessed on 4 September 2024).
  4. Hayes, J.L.; Wilson, T.M.; Magill, C. Tephra Fall Clean-up in Urban Environments. J. Volcanol. Geotherm. Res. 2015, 304, 359–377. [Google Scholar] [CrossRef]
  5. Occhipinti, R.; Portale, S.; Lanzafame, G.; Gimeno, D.; Prašek, M.K.; Mazzoleni, P.; Barone, G. Alkali Activated Materials from Tajogaite Volcanic Ash (La Palma, Spain): A Green Recovery after the 2021 Eruption. Volcanica 2024, 7, 717–731. [Google Scholar] [CrossRef]
  6. RTVC. Tajogaite, el Volcán que Cambió a La Palma. Radio Televisión Canaria. 24 May 2024. Available online: https://rtvc.es/tajogaite-el-volcan-que-cambio-a-la-palma/ (accessed on 26 July 2024).
  7. Turrión, D.; Morcillo, L.; Alloza, J.A.; Vilagrosa, A. Innovative Techniques for Landscape Recovery after Clay Mining under Mediterranean Conditions. Sustainability 2021, 13, 3439. [Google Scholar] [CrossRef]
  8. Koščová, M.; Hellmer, M.; Anyona, S.; Gvozdkova, T. Geo-Environmental Problems of Open Pit Mining: Classification and Solutions. E3S Web Conf. 2018, 41, 01034. [Google Scholar] [CrossRef]
  9. Muñoz, P.; Letelier, V.; Muñoz, L.; Gencel, O.; Sutcu, M.; Vasic, M. Assessing Technological Properties and Environmental Impact of Fired Bricks Made by Partially Adding Bottom Ash from an Industrial Approach. Constr. Build. Mater. 2023, 396, 132338. [Google Scholar] [CrossRef]
  10. UN. Transforming Our World: The 2030 Agenda for Sustainable Development; UN: New York, NY, USA, 2015. [Google Scholar]
  11. USGS. Mineral Commodity Summaries 2025; U.S. Geological Survey: Reston, VA, USA, 2025. [CrossRef]
  12. Shaqour, E.N.; Abo Alela, A.H.; Rsheed, A.A. Improved Fired Clay Brick Compressive Strength by Recycling Wastes of Blacksmiths’ Workshops. J. Eng. Appl. Sci. 2021, 68, 5. [Google Scholar] [CrossRef]
  13. Abdeen, H.; Shihada, S. Properties of Fired Clay Bricks Mixed with Waste Glass. J. Sci. Res. Rep. 2017, 13, 1–9. [Google Scholar] [CrossRef]
  14. Riaz, M.H.; Khitab, A.; Ahmad, S.; Anwar, W.; Arshad, M.T. Use of Ceramic Waste Powder for Manufacturing Durable and Eco-Friendly Bricks. Asian J. Civ. Eng. 2020, 21, 243–252. [Google Scholar] [CrossRef]
  15. Arezki, S.; Chelouah, N.; Tahakourt, A. The Effect of the Addition of Ground Olive Stones on the Physical and Mechanical Properties of Clay Bricks. Mater. Constr. 2016, 66, e082. [Google Scholar] [CrossRef]
  16. Aramide, F.O. Production and Characterization of Porous Insulating Fired Bricks from Ifon Clay with Varied Sawdust Admixture. J. Miner. Mater. Charact. Eng. 2012, 11, 970–975. [Google Scholar] [CrossRef]
  17. Gencel, O. Characteristics of Fired Clay Bricks with Pumice Additive. Energy Build. 2015, 102, 217–224. [Google Scholar] [CrossRef]
  18. Cultrone, G. The Use of Mount Etna Volcanic Ash in the Production of Bricks with Good Physical-Mechanical Performance: Converting a Problematic Waste Product into a Resource for the Construction Industry. Ceram. Int. 2022, 48, 5724–5736. [Google Scholar] [CrossRef]
  19. Whitham, A.G.; Sparks, R.S.J. Pumice. Bull. Volcanol. 1986, 48, 209–223. [Google Scholar] [CrossRef]
  20. Belfiore, C.M.; Parisi, S.; Menta, S.; Mazzoleni, P. Use of Volcanic Ash and Chamotte as Substitute Temper in the Production of Ceramic Tiles. Appl. Clay Sci. 2024, 262, 107603. [Google Scholar] [CrossRef]
  21. López Gómez, M.; Cultrone, G. Study of the Mineralogical and Textural Properties of Bricks with Volcanic Ash Temper. Appl. Clay Sci. 2025, 266, 107690. [Google Scholar] [CrossRef]
  22. Lesher, C.E.; Spera, F.J. Chapter 5—Thermodynamic and Transport Properties of Silicate Melts and Magma. In The Encyclopedia of Volcanoes, 2nd ed.; Sigurdsson, H., Ed.; Academic Press: Amsterdam, The Netherlands, 2015; pp. 113–141. [Google Scholar] [CrossRef]
  23. UNE-EN 13755; Métodos de Ensayo Para Piedra Natural. Determinación de La Absorción de Agua a Presión Atmosférica. AENOR: Madrid, Spain, 2008.
  24. Misura Dell’indice Di Asciugamento (Drying Index); NORMAL 29/88; ICR-CNR: Roma, Italy, 1988.
  25. RILEM. Recommended Test to Measure the Deterioration of Stone and to Assess the Differences of Treatment Methods. Mater Struct 1980, 13, 175–253. [Google Scholar]
  26. Cultrone, G.; Sebastián, E.; Elert, K.; de la Torre, M.J.; Cazalla, O.; Rodriguez–Navarro, C. Influence of Mineralogy and Firing Temperature on the Porosity of Bricks. J. Eur. Ceram. Soc. 2004, 24, 547–564. [Google Scholar] [CrossRef]
  27. UNE-EN 12878; Pigmentos Para la Coloración de Materiales de Construcción Fabricados a Partir de Cemento y/o Cal. Especificaciones y Métodos de Ensayo. AENOR: Madrid, Spain, 2014.
  28. UNE-EN 12370; Métodos de Ensayo Para Piedra Natural. Determinación de La Resistencia a La Cristalización de Las Sales. AENOR: Madrid, Spain, 2020.
  29. Lopez-Arce, P.; Garcia-Guinea, J. Weathering Traces in Ancient Bricks from Historic Buildings. Build. Environ. 2005, 40, 929–941. [Google Scholar] [CrossRef]
  30. Pankhurst, M.J.; Scarrow, J.H.; Barbee, O.A.; Hickey, J.; Coldwell, B.C.; Rollinson, G.K.; Rodríguez-Losada, J.A.; Lorenzo, A.M.; Rodríguez, F.; Hernández, W.; et al. Rapid Response Petrology for the Opening Eruptive Phase of the 2021 Cumbre Vieja Eruption, La Palma, Canary Islands. Volcanica 2022, 5, 1–10. [Google Scholar] [CrossRef]
  31. Lafhaj, Z.; Goueygou, M.; Djerbi, A.; Kaczmarek, M. Correlation between Porosity, Permeability and Ultrasonic Parameters of Mortar with Variable Water/Cement Ratio and Water Content. Cem. Concr. Res. 2006, 36, 625–633. [Google Scholar] [CrossRef]
  32. Li, D.; Li, Z.; Lv, C.; Zhang, G.; Yin, Y. A Predictive Model of the Effective Tensile and Compressive Strengths of Concrete Considering Porosity and Pore Size. Constr. Build. Mater. 2018, 170, 520–526. [Google Scholar] [CrossRef]
  33. Pliego General de Condiciones Para La Recepción de Los Ladrillos Cerámicos En Las Obras de Construcción; RL-88; Minist. Obras Públicas Transp. Medio Ambiente: Madrid, Spain, 1988.
  34. Bhattacharjee, B.; Krishnamoorthy, S. Permeable Porosity and Thermal Conductivity of Construction Materials. J. Mater. Civ. Eng. 2004, 16, 322–330. [Google Scholar] [CrossRef]
  35. Cultrone, G.; Aurrekoetxea, I.; Casado, C.; Arizzi, A. Sawdust Recycling in the Production of Lightweight Bricks: How the Amount of Additive and the Firing Temperature Influence the Physical Properties of the Bricks. Constr. Build. Mater. 2020, 235, 117436. [Google Scholar] [CrossRef]
  36. Nodari, L.; Marcuz, E.; Maritan, L.; Mazzoli, C.; Russo, U. Hematite Nucleation and Growth in the Firing of Carbonate-Rich Clay for Pottery Production. J. Eur. Ceram. Soc. 2007, 27, 4665–4673. [Google Scholar] [CrossRef]
  37. Kreimeyer, R. Some Notes on the Firing Colour of Clay Bricks. Appl. Clay Sci. 1987, 2, 175–183. [Google Scholar] [CrossRef]
  38. Vasić, M.V.; Radovanović, L.; Pezo, L.; Radojević, Z. Raw Kaolinitic–Illitic Clays as High-Mechanical-Performance Hydraulically Pressed Refractories. J. Therm. Anal. Calorim. 2023, 148, 1783–1803. [Google Scholar] [CrossRef]
  39. Sousa, S.J.G.; Holanda, J.N.F. Characterization of Non-Calcareous “Thin” Red Clay from South-Eastern Brazil: Applicability in Wall Tile Manufacture. Cerâmica 2012, 58, 29–35. [Google Scholar] [CrossRef]
  40. Maniatis, Y.; Simopoulos, A.; Kostikas, A. Moessbauer Study of the Effect of Calcium Content on Iron Oxide Transformations in Fired Clays. J. Am. Ceram. Soc. 1981, 64, 263–269. [Google Scholar] [CrossRef]
  41. Mokrzycki, W.S.; Talot, M. Colour Difference ΔE. A Survey. Mach Graph Vis. 2021, 20, 383–411. [Google Scholar]
  42. Benavente, D.; Linares-Fernández, L.; Cultrone, G.; Sebastián, E. Influence of Microstructure on The Resistance to Salt Crystallisation Damage in Brick. Mater. Struct. 2006, 39, 105–113. [Google Scholar] [CrossRef]
Figure 1. Free water absorption (1), forced water absorption (2) and drying (3) of bricks manufactured without additive (blue) and with the addition of 10 (dotted line), 20 (dashed line) and 30% (line) of fine (red) and coarse (green) volcanic ash and fired at 800 (a), 950 (b) and 1100 °C (c). Sectors 1, 2 and 3 are separated from each other by a black line.
Sustainability 17 06545 g001
Figure 2. Pore size distribution curves of the control samples (blue), bricks with coarse volcanic ash (green) and fine volcanic ash (red) of the bricks fired at 800 (a), 950 (b) and 1100 °C (c).
Sustainability 17 06545 g002
Figure 3. Secondary electron microscopic images of the samples. (a): Separation between the brick matrix (right) and a volcanic ash fragment (left) in a sample fired at 800 °C (B(30G)800). (b): Link between the brick matrix (left) and the volcanic ash (right) in a brick fired at 1100 °C (B(30G)1100).
Sustainability 17 06545 g003
Figure 4. Results of the P-wave velocity (Vp, in m/s) tests of bricks fired at 800 (a), 950 (b) and 1100 (c) and the uniaxial compression test (in MPa) of the bricks fired at 800 (d), 950 (e) and 1100 °C (f).
Sustainability 17 06545 g004
Figure 5. Thermographic images of the bricks taken after 30 min of heating. (a): Bricks fired at 800 °C with 30% fine (left) and coarse (right) volcanic ash. (b): Comparison between the control sample (left) and the bricks with 30% fine volcanic ash (right), both fired at 950 °C. (c): Comparison between the control sample (left) and the bricks with 30% coarse volcanic ash (right), both fired at 950 °C. (d): Bricks fired at 1100 °C with 30% fine (left) and coarse (right) volcanic ash. The black line indicates the isotherm of 45 °C.
Sustainability 17 06545 g005
Figure 6. Chromatic coordinates (a* and b*) of the bricks with and without volcanic ash and fired at 800 (blue), 950 (red) and 1100 °C (green).
Sustainability 17 06545 g006
Figure 7. Salt crystallization tests where the weight variation through the cycles (left) and the final decay of the samples (right) are shown.
Sustainability 17 06545 g007
Table 1. Bricks’ acronyms according to their firing temperature and the volcanic ash additive size and percentage.
Temperature (°C)Control SamplesBricks with Volcanic Ash
%FineCoarse
800B80010B(10F)800B(10G)800
20B(20F)800B(20G)800
30B(30F)800B(30G)800
950B95010B(10F)950B(10G)950
20B(20F)950B(20G)950
30B(30F)950B(30G)950
1100B110010B(10F)1100B(10G)1100
20B(20F)1100B(20G)1100
30B(30F)1100B(30G)1100
Table 2. Results from the hydric tests and the MIP test. Ab—free water absorption (%); Af—forced water absorption (%); Ax—interconnection between pores (%); Di—drying index (%); S—saturation coefficient (%); Po—open porosity (%); ρa—apparent density (g/cm3); ρr—real density (g/cm3); PoMIP—open porosity obtained through MIP (%); ρaMIP—apparent density obtained through MIP (g/cm3); ρrMIP—real density obtained through MIP (g/cm3); SSA—specific surface area (m2/g). The bold numbers indicate the values obtained after the test, while the non-bold numbers indicate the standard deviation.
SampleAbAfAxDiSPoρaρrPoMIPρaMIPρrMIPSSA
B80022.0722.341.230.92087.2336.041.612.5236.511.612.536.84
0.340.330.090.0011.770.520.000.02
B(10F)80019.6120.243.090.91090.2633.851.672.5335.751.662.594.67
0.280.381.660.0062.700.510.010.01
B(10G)80020.7321.222.320.90892.1234.671.632.5037.001.632.596.78
0.150.080.680.0061.410.130.000.01
B(20F)80019.3119.892.900.91785.9433.931.712.5835.911.692.634.59
0.250.320.590.0030.660.430.010.01
B(20G)80019.7321.126.580.90585.2535.141.662.5635.441.652.566.09
0.120.200.330.0050.460.220.010.00
B(30F)80018.1018.974.610.91684.2233.151.752.6132.151.832.694.23
0.140.140.720.0021.110.290.010.02
B(30G)80019.3822.4913.820.90379.5337.321.662.6535.351.662.574.22
0.150.411.010.0050.920.620.000.02
B95023.1523.411.100.91090.5136.781.572.4942.531.532.662.19
0.100.090.770.0031.410.130.000.01
B(10F)95021.9322.402.110.91090.1135.961.612.5140.811.602.711.75
0.130.240.830.0040.530.310.010.01
B(10G)95022.5423.263.140.90989.2436.801.582.5041.401.562.672.03
0.140.150.220.0000.430.280.000.02
B(20F)95020.6321.564.300.89786.9635.901.662.6039.471.622.681.75
0.210.090.550.0031.190.030.010.01
B(20G)95021.8524.149.500.88984.5838.471.592.5940.281.582.641.71
0.160.140.230.0000.560.190.000.01
B(30F)95019.4120.686.160.89184.3335.351.712.6441.271.752.971.51
0.260.280.950.0011.920.270.010.01
B(30G)95021.2525.9218.010.87477.0441.611.612.7540.951.572.661.92
0.110.210.690.0010.770.210.000.00
B110024.1725.896.650.87677.7440.211.552.6043.991.532.731.05
0.060.040.150.0060.100.170.010.02
B(10F)110021.8524.169.570.87474.3538.901.612.6342.151.572.710.79
0.050.100.550.0030.200.120.000.00
B(10G)110022.6425.099.760.87573.2239.801.592.6441.281.602.720.85
0.010.210.770.0040.480.260.010.01
B(20F)110020.4922.8710.370.88573.5637.951.662.6740.051.632.720.68
0.120.140.290.0030.040.070.010.01
B(20G)110021.4625.3615.390.87370.8240.651.602.7039.971.592.650.82
0.390.171.210.0011.560.260.000.01
B(30F)110018.1721.7416.410.87968.9437.441.722.7535.261.672.580.59
0.250.362.340.0062.280.440.010.01
B(30G)110020.8125.7719.240.86170.0741.701.622.7838.931.612.640.8
0.540.421.210.0021.250.390.010.01
Table 3. Lightness (L*), chromatic values (a* and b*), chroma (C*), hue angle (h°) and color difference (ΔE*) between control samples and those with volcanic ash additives. The bold numbers indicate the values obtained after the test, while the non-bold numbers indicate the standard deviation.
L*a*b*C*ΔE* L*a*b*C*ΔE* L*a*b*C*ΔE*
B80061.2016.4221.4627.0252.58-95062.2716.3222.8628.0854.48-B110066.569.0422.8524.5868.43-
0.420.260.240.340.170.800.710.761.030.280.150.130.100.070.34
B(10F)
800
60.7815.2919.4324.7351.762.36B(10F)
950
63.5114.5919.2324.1452.824.21B(10F)
1100
66.198.5121.8223.4268.701.22
1.581.332.232.580.750.800.470.690.820.380.950.361.011.060.37
B(10G)
800
60.7716.7421.8027.4952.480.64B(10G)
950
63.1514.3119.1523.9153.224.30B(10G)
1100
66.008.8523.1924.8269.110.68
0.540.410.590.720.191.560.621.171.300.630.790.370.170.120.89
B(20F)
800
59.3416.5921.1326.8751.871.90B(20F)
950
65.0613.1417.6021.9753.256.75B(20F)
1100
65.108.2322.2423.7269.681.78
1.210.961.071.430.390.680.250.480.510.530.930.190.350.330.55
B(20G)
800
60.7316.4621.2326.8752.180.52B(20G)
950
63.9813.5217.5322.1452.376.26B(20G)
1100
66.008.7622.3824.0468.630.78
0.730.921.641.860.600.730.150.290.290.371.430.360.270.260.88
B(30F)
800
60.2615.0719.5924.7252.452.49B(30F)
950
64.7512.2716.9520.9254.107.58B(30F)
1100
63.598.0322.0623.4869.993.24
0.490.620.600.860.340.900.430.540.690.150.960.180.110.070.47
B(30G)
800
58.7217.3622.5528.4652.402.87B(30G)
950
61.5716.1422.0727.3453.821.07B(30G)
1100
63.518.7422.5224.1668.803.08
1.071.021.531.830.260.210.020.100.080.151.030.110.110.070.33
Disclaimer/Publisher’s Note: The statements, opinions and data contained in all publications are solely those of the individual author(s) and contributor(s) and not of MDPI and/or the editor(s). MDPI and/or the editor(s) disclaim responsibility for any injury to people or property resulting from any ideas, methods, instructions or products referred to in the content.

