Article

Advanced Municipal Wastewater Treatment and Bioproduct Generation via Optimized Autotrophic and Mixotrophic Microalgal Cultivation

by
Juan Nápoles-Armenta
1,
Itzel Celeste Romero-Soto
2,
Luis Samaniego-Moreno
3,
Lourdes Mariana Díaz-Tenorio
4,
Luis Alonso Leyva Soto
4,5,
Celia De La Mora-Orozco
6,
Rafael González Pérez
7,8,
Edgardo Martínez-Orozco
8,
Celestino García-Gómez
9,* and
Laura Izascum Pérez-Valencia
8,*
1
Unidad Benito Juárez, Universidad Estatal de Sonora, Fraternidad S/N, Centro, Villa Juárez C.P. 85294, Sonora, Mexico
2
Departamento de Fundamentos del conocimiento, División de Ciencia y Tecnología, Centro Universitario del Norte, Universidad de Guadalajara, Carretera Federal México 23 Km 191, Colotlán C.P. 46200, Jalisco, Mexico
3
Department of Irrigation and Drainage, Engineering Division, Antonio Narro Autonomous Agrarian University, Calzada Antonio Narro #1923 Buenavista, Saltillo C.P. 25315, Coahuila, Mexico
4
Departamento de Biotecnología y Ciencias Alimentarias, Instituto Tecnológico de Sonora, 5 de Febrero 818 sur, Centro, Obregón C.D. 85000, Sonora, Mexico
5
Programa IxM, Insurgentes Sur 1582, Ciudad de México C.P. 03940, Mexico
6
Departament of Integral Watershed Management, National Institute of Forestry, Agricultural and Livestock Research, Tepatitlán de Morelos C.P. 47600, Jalisco, Mexico
7
Centro Universitario de Tonalá, Universidad de Guadalajara, Tonalá 45425, Jalisco, Mexico
8
Unidad Académica Arandas, Instituto Tecnológico José Mario Molina Pasquel y Henríquez, Tecnológico Nacional de México, Arandas C.P. 47180, Jalisco, Mexico
9
Faculty of Agronomy, Autonomous University of Nuevo León, Francisco I. Madero S/N, Ex Hacienda el Canada, General Escobedo C.P. 66050, Nuevo León, Mexico
*
Authors to whom correspondence should be addressed.
Sustainability 2025, 17(14), 6539; https://doi.org/10.3390/su17146539
Submission received: 17 June 2025 / Revised: 12 July 2025 / Accepted: 15 July 2025 / Published: 17 July 2025

Abstract

In this paper, the production of biomass, pigments, lipids, and carbohydrates and the elimination of ammonium and orthophosphate by the microalgae Chlorella vulgaris, grown in synthetic wastewater (SWW), were studied under different light intensities (3000–10,000 lux), pH (7.5–9.5) and daily illumination time (8–16 h). The best conditions for the autotrophic culture of microalgae were predicted using response surface methodology (RSM). The results showed that the adaptation of the microalgae for this nutrient source was effective. The best conditions for the cultivation of Chlorella vulgaris in SWW were 8.44 pH and a light intensity of 8433 lux in the daily illumination time of 16 h. Under optimal conditions, the production of microalgal biomass, chlorophyll-a, chlorophyll-b, carotenoids, lipids and carbohydrates was 0.534 g/L, 7.46 mg/mL, 3.53 mg/mL, 2.01 mg/mL, 21.40% and 28.46%, respectively. The removal efficiencies of ammonium and orthophosphate from SWW were 97.66% and 58.78% in autotrophic cultures. This investigation introduces a new aspect by verifying the optimized cultivation conditions with real municipal wastewater, indicating that the procedure could be utilized for sustainable production of bioproducts and efficient treatment of municipal wastewater.

1. Introduction

Nowadays, the cultivation of microalgae (photosynthetic microorganisms) has increased and has been accepted as a technology to produce a wide range of value-added products. Microalgae can produce biofuels and high-value commercial products, such as animal feed and aquaculture, proteins, pigments, carbohydrates, lipids, fatty acids, vitamins, enzymes, additives and bioplastics [1]. Furthermore, microalgae have been recognized for their ability to remove nutrients and pollutants from wastewater, offering a sustainable approach to wastewater treatment and resource recovery [2]. However, a culture of microalgae requires a considerable amount of water and nutrient supply, which makes its production development on a commercial scale become an economically limited process [3]. Therefore, more studies have been conducted to study cost-effective and sustainable ways to improve biomass production and nutrient removal in wastewater treatment. One of the most effective ways is the optimization of nutrients and removal from wastewater [4]. Carbon (C), nitrogen (N) and phosphorus (P) are considered the main nutritional requirements for the growth of microalgae, which are present in wastewater stimulating the phenomenon of eutrophication. This process leads to the deterioration of water bodies, highlighting the necessity of efficient, environmentally friendly and low-cost treatment technologies [5]. In this line, microalgae have been considered as promising agents for nutrients removal from wastewater. An important parameter in this study is the use of wastewater as a culture medium, an affordable alternative to synthetic media, which reduces the cost of microalgae culture significantly. Although synthetic carbon sources create a controlled environment, municipal wastewater is an attractive alternative with regard to sustainability through circular-economy principles. In this sense the bioaccumulation of carbohydrates and lipids in biomass is environmentally critical, since these molecules are valuable feedstock for both biorefinery concepts and the conversion of waste streams into bioproducts [6]. The amount of C, N and P in wastewater is contributed by human feces and urine, food, detergents, pharmaceuticals, pesticides, industrial compounds and agricultural drainage [7]. In recent studies, various wastewater, which includes municipal, industrial and agricultural, have been used to investigate the elimination of macronutrients by microalgae [8]. Microalgae-based wastewater treatment not only addresses environmental concerns but also contributes to a circular economy by recovering valuable resources from waste streams [9]. Novel systems that exploit the use of microalgae–bacteria communities continue to emerge as a sustainable, environmentally friendly technological alternative, strengthening the importance of said communities for the valorization of wastewater through nutrient and water sustainability initiatives and resource recovery, and for the valorization of algal biomass in value-added products, within the framework of circular economy [10].
Microalgae-based wastewater treatment offers a dual advantage: the removal of pollutants and the production of valuable biomass [11]. This approach aligns with the principles of a circular economy, where waste is viewed as a resource rather than a liability [3]. Particularly, municipal or urban wastewater is in greater proportion a domestic influent with a smaller amount of industrial waste. Among the main constituents of municipal wastewater are organic materials, biodegradable chemical oxygen demand (COD), nutrients (N and P), metals, inorganic compounds and pathogenic microorganisms [12]. Municipal wastewater is often rich in nutrients such as ammonium (NH4+), orthophosphate (PO4) and other essential nutrients that are easily assimilated by microalgae for growth [13]. Mixotrophic microalgal production is increasingly considered for wastewater treatment in which organic or inorganic carbon, various nitrogen sources and phosphorus are supplied for growth. This method is a key step for improving the removal of N, P, and COD in the wastewater treatment. Microalgae have high-N and -P compounds removal efficiency of wastewater, successfully removing pollutants and turning them into high-value products [14]. Also, the performance of a microalgae culture can be influenced by various factors, which must be controlled during the process, these include both biotics (pathogens and other microalgae), abiotic (light, pH, temperature, salinity, load and type of nutrients, oxygen concentration and presence of toxic compounds) and operational conditions (hydraulic residence time and agitation) [15]. Microalgae, existing ubiquitously in diverse aquatic habitats, possess an inherent capacity to assimilate and metabolize a wide spectrum of inorganic and organic compounds present in their surroundings, including key nutrients like nitrogen and phosphorus, which are often abundant in wastewater streams. All these components affect the growth and composition of microalgal biomass and the absorption of nutrients, so that the optimal conditions for the cultivation of microalgae can vary under different types of wastewaters [14]
The objective of this research is to determine the optimal autotrophic cultivation conditions for Chlorella vulgaris using response surface methodology (RSM) and to compare autotrophic and mixotrophic cultivation strategies in terms of biomass yield, nutrient removal, and bioproduct accumulation, including validation with real municipal wastewater. In the present work, an innovative combination of autotrophic and mixotrophic cultures of Chlorella vulgaris for nutrient removal and bioproduct formation was developed and optimized with RSM and verified in actual real municipal wastewaters. Our methodological approach is based on optimization methods, since the operation of the bioreactors (and their design and setup) greatly affect the performance of the treatment, the parameters that are controlled such as light supply and temperature being related to the growth of microalgae and the removal of contaminants [16]. The best conditions for the autotrophic cultivation of the microalga Chlorella vulgaris were investigated employing the central composite design (CCD) method in combination with RSM. The effects of pH, light intensity and daily duration of Illumination were studied according to the growth of the microalgae, the biochemical properties and the efficiency in nutrient removal. Furthermore, growth of biomass and removal of nutrients were assessed under optimal conditions and in a mixotrophic culture supplemented with glucose as carbon source and real municipal wastewater. The issue is that when microalgae are introduced in wastewater treatment unit operations, a sustainable and economical solution for nutrient removal can be achieved, with additional benefit of a valuable biomass source that may be subsequently converted into biofuels, animal feed, or other products.

2. Materials and Methods

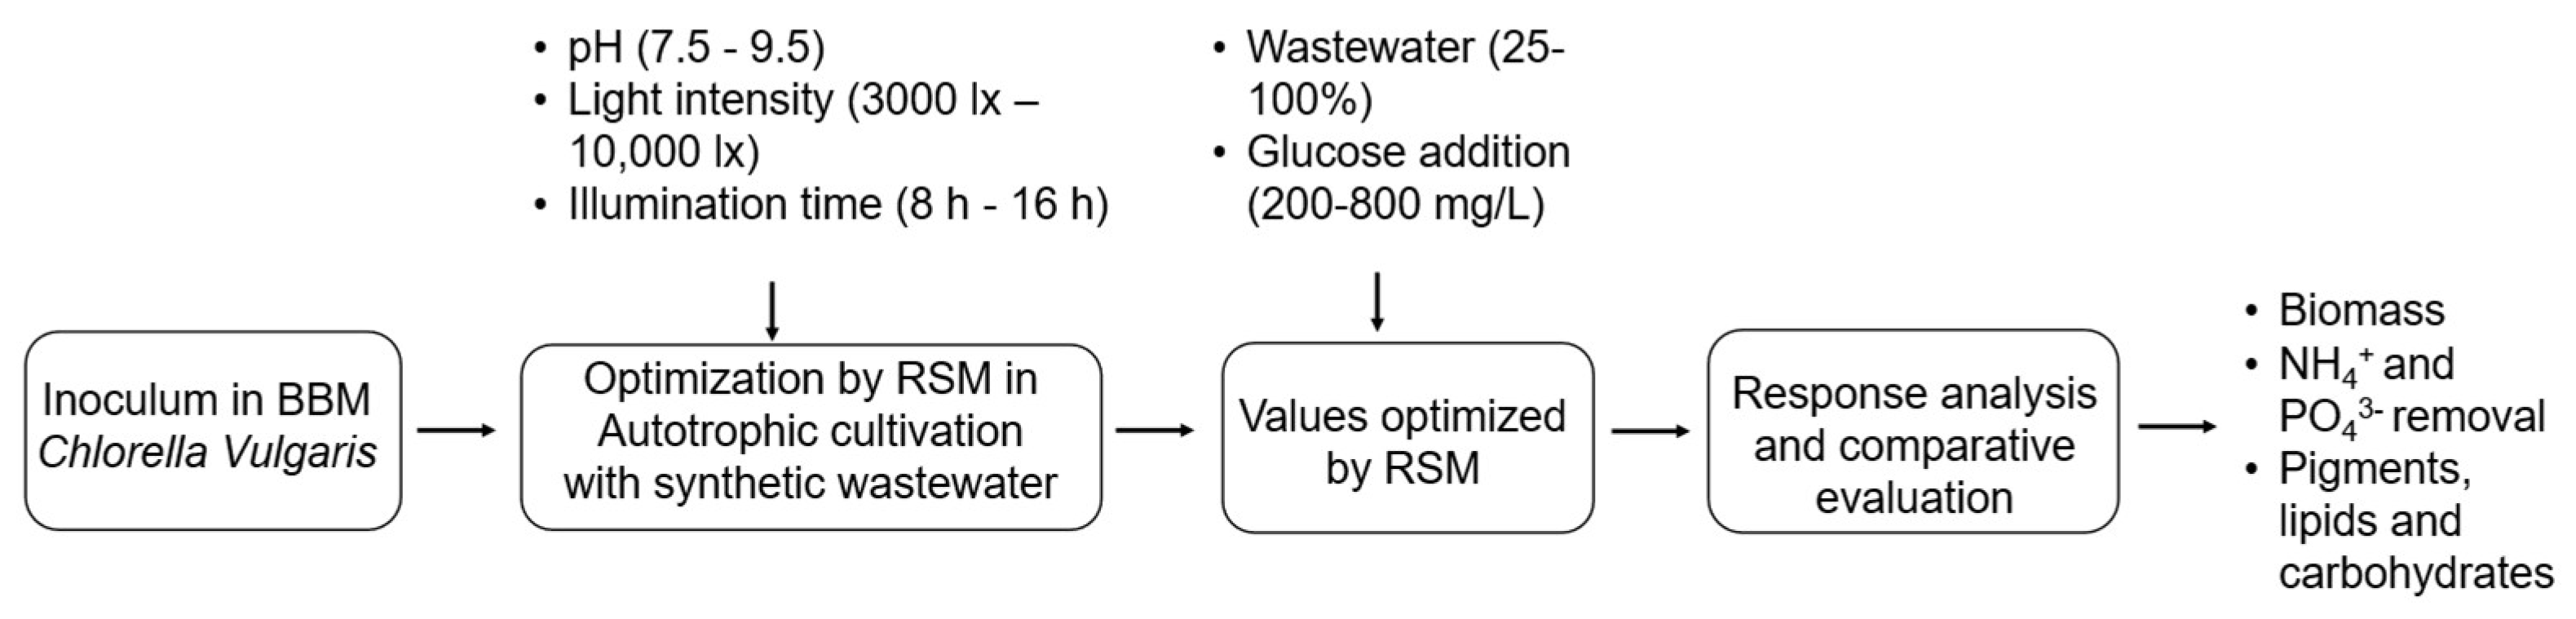
2.1. Microalgae Strain, Mediums and Cultivation

The microalgae strain that was used in this study has been isolated from wastewater in northern of Mexico. The strain was identified by morphological and molecular methods as Chlorella vulgaris and was stored in the laboratory of Environmental remediation and water, soil and plant analysis from the Autonomous University of Nuevo León, in scaled tubes with a Bold Basal Medium at 4 °C for further experiments. The BBM medium was prepared with the following composition (mg/L): NaNO3 (750), CaCl2•2H2O (12.5), MgSO4•7H2O (150), FeSO4 (6.27), K2HPO4 (62.4), KH2PO4 (225), NaCl (0.341), H3BO3 (5), MnSO4 (0.72), ZnSO4•7H2O (17.64), KOH (15.5), NaCl (12.5), CuSO4•7H2O (1.06), NaMoO3 (0.6), and CoCl2 (0.2). The strain was maintained in sterile liquid culture, at 25 ± 2 °C, under continuous aeration and intermittent illumination of 12 h light with 10,000 lux. Once the stationary phase was reached, the strain was used for experimentation; subsequently, a diluted 50 mL aliquot of microalgae cells were suspended in bottles (1 L) containing 600 mL of autoclaved synthetic municipal wastewater at 121 °C for 20 min, to provide an initial concentration of microalgae inoculum of approximately 0.15 g dry weight/L, resulting in a final volume of 650 mL. The growth of microalgae is affected by the type of bioreactor systems designed as well as their configuration and light and temperature regimes, which have a strong influence on the effective removal of contaminants from wastewater and are the paramount requirement to enhance the treatment performance [16].
The composition of synthetic wastewater simulated the composition of a typical municipal water, which consisted of (M): NH4Cl (0.080), NaNO3 (0.025), K2HPO4 (0.015), MgSO4•7H2O (0.075), NaHCO3 (0.3), Na2-EDTA (0.75), FeCl3•6H2O (0.1), MnCl2•4H2O (0.04), CuSO4•5H2O (0.05), ZnCl2•6H2O (0.05), CoCl2•6H2O (0.002) and Na2MoO4•2H2O (0.004). Real wastewater shows variations in the composition of discharges to receiving bodies, so to maintain a stable culture and obtain reliable results, a synthetic wastewater using only inorganic carbon was applied as an autotrophic medium for the optimization of microalgae growth. Subsequently, it was compared with a mixotrophic cultivation, to analyze the effect of organic carbon on the growth of microalgae and the removal of nutrients from wastewater. In mixotrophic cultivation, both inorganic and organic carbon were added as a carbon source. The effect of the source of organic carbon was investigated by adding a specific amount of glucose (200, 400 and 800 mg/L) to synthetic wastewater under optimal autotrophic culture conditions. Finally, municipal wastewater was obtained from a wastewater treatment plant located in General Escobedo, Nuevo León, Mexico (25°47′56.6 ″N, 100°17′27.4″ W). The wastewater samples were collected from the effluent of a primary clarifier, immediately preserved with 1% H2SO4 and kept at 4 °C until they were used in the experiments. It should be emphasized that the characterization was essentially based on the traditional measures. The municipal wastewater sample was collected from a uniform source in the same sampling period utilized in this work. We did not profile multiple samples in its composition for seasonal or diurnal variation. The analysis of the heavy metals and emerging pollutants was out of scope of this work. A more detailed characterization should be useful for the future full-scaled wastewater treatment performances evaluation. In the experiments, autoclaved wastewater was used at proportions of 25%, 50% and 100%, the agitation of the culture was provided with filtered air at the bottom by means of an air pump at 0.5 vvm and regulated by rotameter, also were performed studies at a temperature of 25 °C (±2 °C). Autoclaved municipal wastewater was used in these experiments to enable specific control of the Chlorella vulgaris microalgal population and to limit interferences by unknown endogenous microorganisms during this preliminary optimization stage. The culture bottles were exposed to fluorescent lamps as a light source. The effects of pH, light intensity and daily illumination time on the biomass yield of microalgae, pigment content, carbohydrates, total lipids and elimination of ammonium and orthophosphates were investigated by microalgae culture both in autotrophic medium and mixotrophic. The optimal conditions were predicted by RSM and validated by additional experiments in quadruplicate. A detailed diagrammatic sketch of the experimental setup used for both autotrophic and mixotrophic cultivation is provided in Figure 1.

2.2. Experimental Analysis by RSM

Different conditions of pH, light intensity and daily illumination time were evaluated in autotrophic cultures with microalgae using synthetic wastewater. The intensity of the light was controlled by varying the distance between the flasks and the fluorescent lamps by quantifying by means of a digital Luxmeter. The ranges of the independent variables between the upper and lower limits were established as: pH (7.5–9.5); light intensity (3000 lux–10,000 lux); daily illumination time (8 h–16 h). A CCD through the Design Expert software (Version 9.0) was used to investigate the effects of the above mentioned parameters and to predict the optimal conditions. The experiments were designed and established under different conditions, resulting in 20 experimental runs with an experimental time of 10 days, which was established by preliminary experiments when stationary phase was observed from that time. An experimental control was performed without addition of inoculum at the central point of the CCD (pH: 8.5, light intensity: 6500 lux and illumination time: 12 h). To fit a second-order polynomial equation the results were analyzed with the statistical software package. The number of experiments (N) required for the central composite design was determined using the equation N = 2k + 2k + n0, where k represents the number of independent variables and n0 represents the number of central points. The general equation for the mathematical model is as follows:
Y = β0 + ΣβiXi + ΣβiiXi2 + ΣΣβijXiXj
where Y is the predicted response variable, β0 is the intercept, βi is the linear coefficient, βii is the quadratic coefficient, βij is the interaction coefficient, and Xi and Xj are the coded independent variables. The statistical significance of the model was determined by analysis of variance. The quality of the fit of the polynomial model equation was expressed by the coefficient of determination R2 and adjusted R2, as well as p value, the regression coefficients were used to make statistical calculations.

2.3. Analytical Methods

2.3.1. Biomass Growth

The biomass concentration was analyzed daily and determined through the correlation between optical density (OD) and dry weight (DW) of algae. The OD was measured at 680 nm by spectrophotometry (Thermo Scientific, Genesys 10-Vis, Waltham, MA, USA). For the dry weight determination, 10 mL of the microalgae culture were filtered through a pre-weighted Whatman GF/C filter paper with a pore size of 1.2 μm, then the filter was dried at 105 °C until constant weight, the weight difference was used to determine the concentration of biomass in g/L.
The ratio obtained between the dry weight of algae (DW, g/L) and OD680 for Chlorella vulgaris, it was:
DW (g/L) = 0.2695OD680 + 0.0428, R2 = 0.993
The specific growth rate (u) was calculated using the following equation:
u (1/day) = (ln X2 − ln X1)/(t2 − t1)
Biomass productivity was obtained with the following relationship:
P (g/L/day) = (X2 − X1)/(t2 − t1)
where X2 and X1 are the concentrations at time t2 and t1, respectively.

2.3.2. Determination of Pigments, Carbohydrates and Lipids

The concentration of chlorophyll a, b and carotenoids was determined through a 10 mL sample, which was centrifuged at 10,000 rpm for 10 min. The sediments were resuspended in a solution of 10 mL of acetone at 4 °C for 24 h in the dark, then centrifuged at 4000 rpm and 4 °C for 15 min. The supernatant was analyzed using the Lorenzen method (Lorenzen 1965 [17]) at three optical densities (OD): 662 nm, 645 nm and 470 nm by spectrophotometry and acetone as blank, according to the following equations:
Chlorophylla (mg/mL) = 11.75OD662 − 2.35OD645
Chlorophyllb (mg/mL) = 18.61OD645 − 3.96OD662
Carotenoids (mg/mL) = 1000OD470 − 2.27 (Chlorophylla) − 81.4 (Chlorophylla)/227
Total carbohydrates were measured by the anthrone–sulfuric acid method (Yemm and Willis 1954 [18]). One milliliter of microalgae solution was mixed with 4 mL of 0.2% (w/v) concentrated anthrone–sulfuric acid solution. The samples will be heated at 100 °C for 10 min. The absorbance was determined under the wavelength of 620 nm.
Lipids were extracted from dry biomass after 100 °C with a mixture of chloroform: methanol (2:1, v/v) and sonified for 30 min. The suspension was centrifuged at 4000 rpm for 15 min to obtain a clear supernatant. The solvent solution was evaporated for 24 h and the extracted lipid was determined by gravimetry. Lipid productivity (Plipid) was calculated according to the following equation:
Plipid (mg/L/day) = WB × LC/V × T
where WB is the weight of dry biomass, LC is the lipid content, V is the volume of the system (l), and T is the time (day).
The lipid content (LC) was calculated with the following equation:
LC = [lipid production (g/L)/dry microalgal biomass weight (g/L)] × 100

2.3.3. Nutrient Analysis and COD

Samples taken from the bottles were centrifuged at 10,000 rpm for 10 min, and the supernatant was filtered by glass microfiber membrane (0.45 um, pore size) and kept at 4 °C for analysis. Ammonium (NH4-N), orthophosphate (PO4-P) and chemical oxygen demand (COD) were quantified according to standard methods (APHA, 1998) [19]. The analysis was carried out in triplicate and the removal of the compounds was calculated by:
Removal (%) = (CiCf) × 100
where Ci and Cf are the concentrations of nutrients and COD before and after the experiments, respectively.
The nutrient absorption rate was calculated by Maltsev et al. 2023 [15]
µuptake = (ln S2 − ln S1)/(t2 − t1)

3. Results and Discussion

3.1. Optimization of Operational Parameters in Autotrophic Conditions

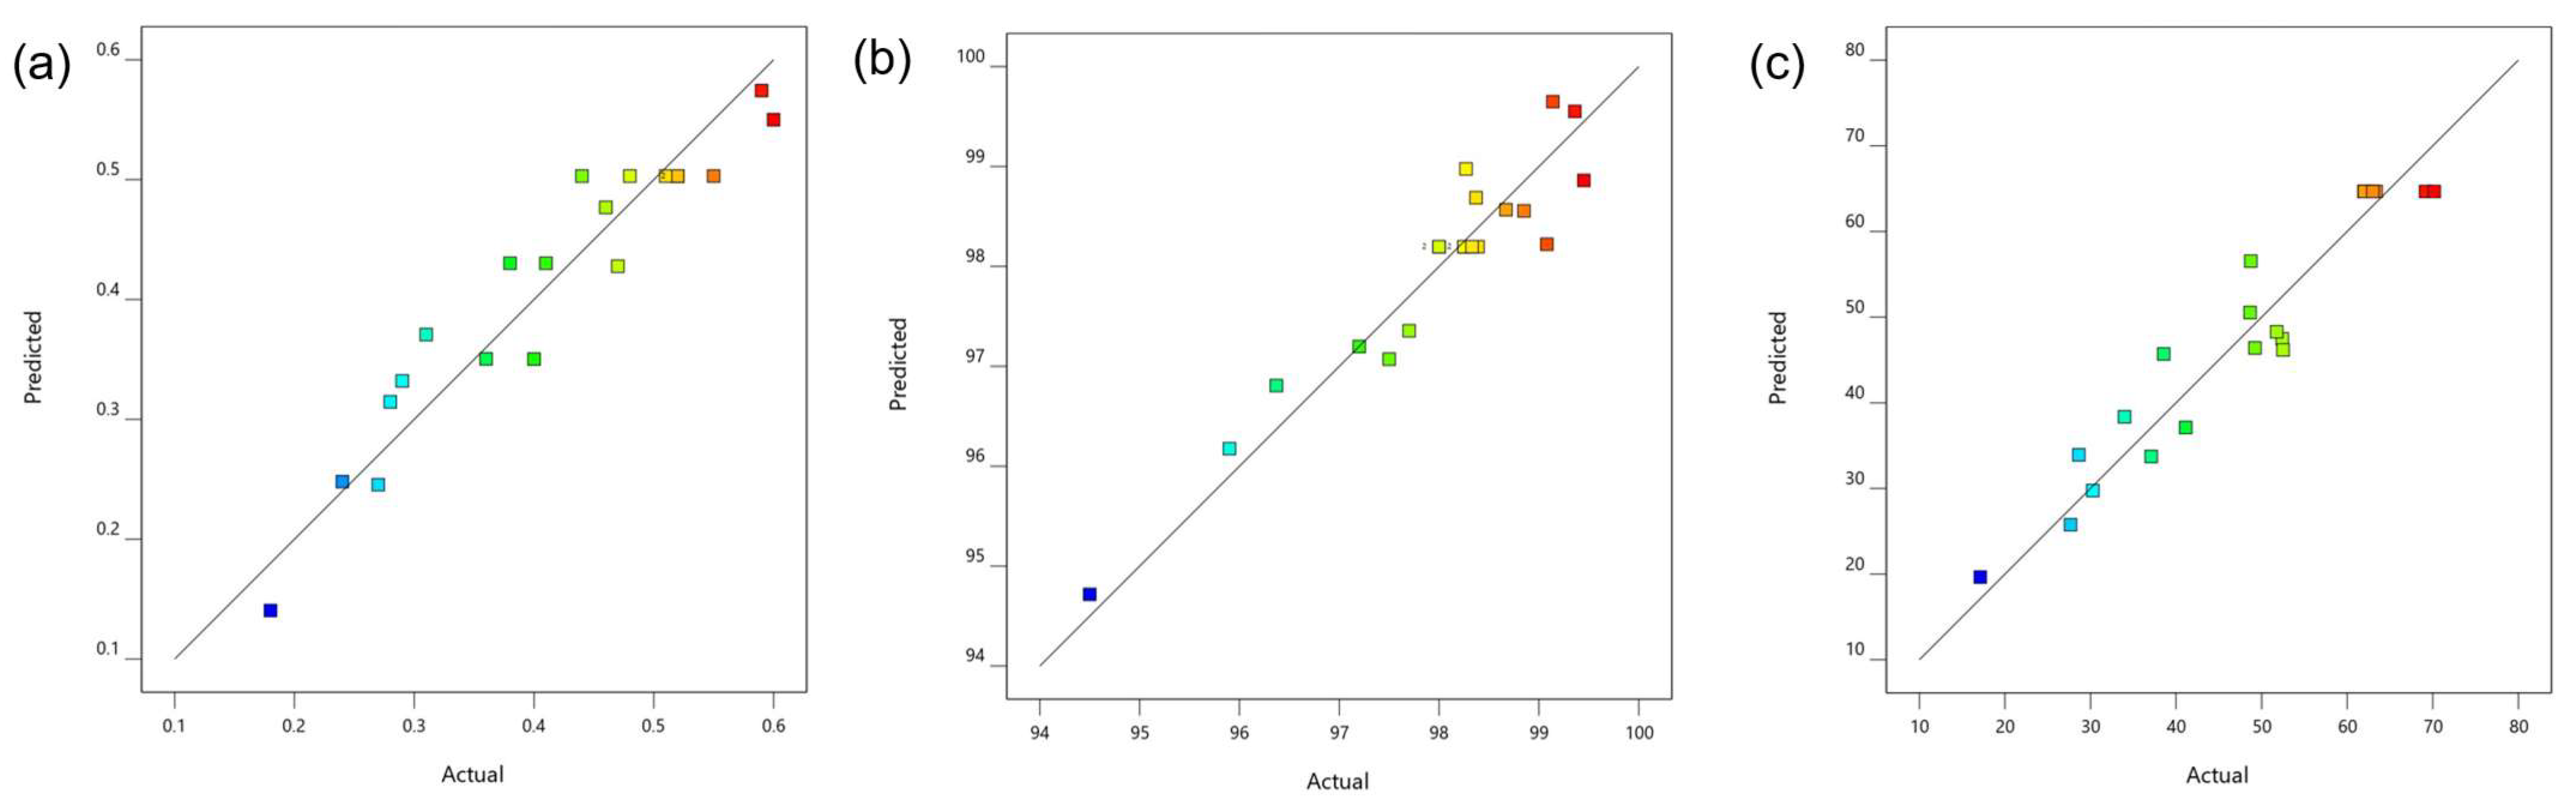
3.1.1. Statistical Analysis

The growth of the microalgae Chlorella vulgaris was gradually increased over time in all experimental conditions, but stationary or decay phases were not observed. Runs 2, 5, 6, 10, 17 and 20 (Table 1) represent the central points of the CCD, and the behavior of the growth curve, the concentration of final biomass and nutrient removal were similar for the six trials. This shows that there is reproducibility of the experiments performed. The highest biomass growth concentrations were obtained in runs 1 (pH: 8.5, 6500 lux and 18.73 h of illumination time) and 14 (pH: 9.5, 10,000 lux and 16 h of illumination time), with 0.6 g/L and 0.59 g/L, respectively. The highest percentage of ammonium removal was also found in experiments 1 and 14 with 99.14% and 99.45%, respectively, while the central points (pH: 8.5, 6500 lux and 12 h of illumination time) showed the highest orthophosphate removal with 64.94%.
Response surface methodology was used to optimize the operating conditions for nutrient removal and biomass production by Chlorella vulgaris. The independent variables for the process were pH 7.5–9.5 (X1), a light intensity of 3000 lx–10,000 lux (X2) and a daily illumination time of 8 h–16 h (X3). Their values varied in the ranges shown in Table 1 and were coded in three levels of −1, 0 and +1. Experimental results were reflected in the response variables, such as biomass (g/L; Y1), ammonium removal percentage (%; Y2) and orthophosphate removal percentage (%; Y3) using the experimental design of three CCD factors (Table 1). The conditions at the central point were pH 8.5, a light intensity of 6500 lx and a daily Illumination time of 12 h. The answers Y1, Y2 and Y3 using second-order polynomial equations (12–14), respectively, were:
Y1 = 0.5 + 0.023X1 + 0.086X2 + 0.052X3 + 0.019X1X2 + 0.00335X1X3 + 0.017X2X3 − 0.037X12 − 0.076X22 − 0.012X32
Y2 = 98.2 − 0.035X1 + 0.74X2 + 0.32X3 + 0.34X1X2 − 0.65X1X3 + 0.27X2X3 + 0.15X12 − 0.79X22 + 0.32X32
Y3 = 64.67 − 1.32X1 + 7.75X2 − 1.78X3 + 0.52X1X2 − 0.15X1X3 + 2.04X2X3 − 10.09X12 − 11.31X22 − 3.94X32
The models’ light intensity (X2) and daily lighting time (X3) have the most significant effect on response variables.
Analysis of variance (ANOVA) is presented in Table 2, Table 3 and Table 4. The factors X2, X3, X12 and X22 showed significant influences on the biomass response variable (p = 0.0001, p = 0.0034, p = 0.0149 and p = 0.0002, respectively). X2, X3, X1X3, X22 and X32 were the most significant parameters for ammonium removal (p = 0.0004, p = 0.0476, p = 0.0062, p = 0.0002 and p = 0.0454, respectively) and X2, X12, X22 and X32 represented the greatest significance for phosphorus removal (p = 0.0007, p ≤ 0.0001, p ≤ 0.0001 and p = 0.0309, respectively) for a 95% confidence level.
The p-values of the models for biomass, ammonium removal and phosphorus removal were less than 0.05, which indicates that the models are considered statistically significant. The regression models demonstrated a high degree of explanatory power, as evidenced by the coefficients of determination (R2) of 0.9053, 0.9006, and 0.9185 for biomass production, ammonium removal and phosphate removal, respectively. These coefficients of determination indicate a strong correlation between the predicted and experimental values, signifying that the models effectively capture a substantial proportion of the variability observed in biomass production (90.53%), ammonium removal (90.06%), and phosphate removal (91.85%), thereby highlighting their potential as valuable tools for process optimization and prediction under similar operational conditions. The high F-values (10.63 for biomass, 10.07 for ammonium removal, and 12.52 for phosphate removal) further support the significance of the regression models, suggesting that the variance explained by the models is significantly greater than the unexplained variance. Adequate precision is a metric used to evaluate the signal-to-noise ratio, and a ratio greater than 4 is desirable. The adequate precision values for biomass, ammonium removal and phosphorus removal were 11.91, 13.11 and 10.69, respectively. This indicates an adequate signal and that the model can be used to navigate the design space. The coefficient of variation is a measure of the reproducibility of the model. In general, a high coefficient of variation (CV > 20%) indicates that the model cannot be reproduced. The results for the coefficient of variation were 12.47%, 0.54% and 12.57% for biomass, ammonium removal and phosphorus removal, respectively, indicating that the model can be reproduced.
To examine an adequate approximation of the selected models to the real system, diagnostic graphs such as the representation of predicted values against real values are used. The normal distribution of the data is necessary for the integral analysis of the experimental data. As it shows in the graph of the actual values against the predicted values (Figure 2), the experimental data approximate to a straight line and, therefore, suggest an adequate distribution of the data for the three response variables. According to the graph, it can be concluded that the proposed correlations are valid.

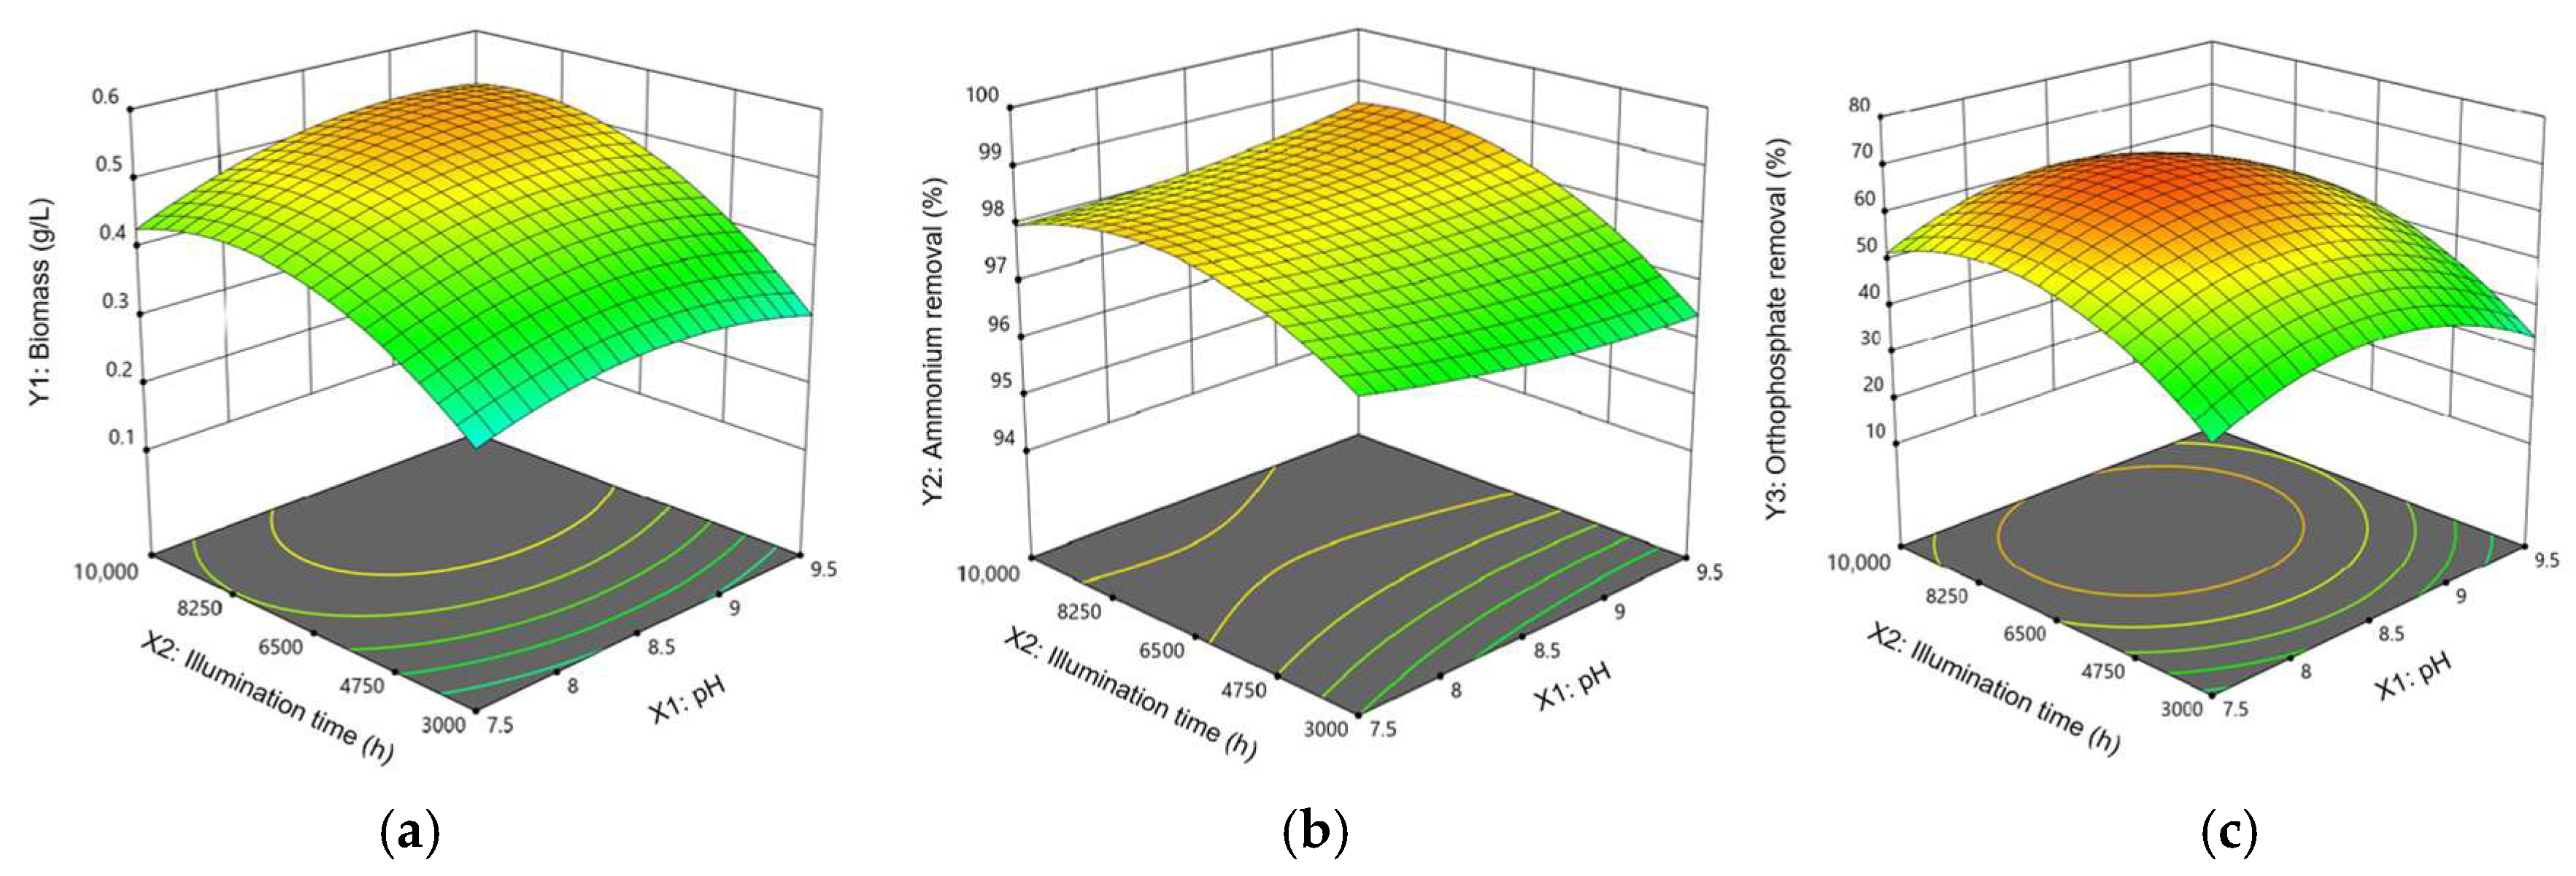
3.1.2. Variable Interaction

The interactions between the variables were studied using 3D surface plots, keeping one variable constant at the central point and changing the other two. The combined effect of light intensity and illumination time on biomass production is shown in the contour graph of Figure 3a with the experimental range evaluated, it is observed that biomass production was maximum with the increase in illumination time and decreased with the reduction in light intensity, with values between 12 and 16 h and 6500 and 10,000 lux, respectively.
Similarly, Figure 3b represents a contour graph showing the combined effect of light intensity and illumination time on ammonium removal, this response variable increased with an increase in light intensity and illumination time, where clearly a illumination time of 16 h was the area with the highest percentage of removal, while in Figure 3c a maximum elimination of orthophosphates is observed with the increase in the intensity of the light to a certain point of between 8000 and 9000 lux, but without relevant effect with the illumination time. These results showed that the growth of the microalgae and the nutrient removal rate could be improved by increasing the light intensity to the point of saturation of the light, for which the photosynthetic activity could reach its maximum. However, photo inhibition occurs in light over-saturation (Maltsev et al., 2023) [15]. On the other hand, the daily illumination time also seems to be an important factor that affects the photosynthetic efficiency in microalgae cultures, as indicated by the daily illumination time evaluated on the growth of microalgae and the elimination of nutrients [20]. Based on the analysis, the maximum biomass production and nutrient removal can be achieved by appropriately adjusting the light intensity and illumination time.
The combined effect of light intensity and pH on biomass production is shown in the contour graph of Figure 4a. With the experimental range evaluated, it is observed that the biomass production was maximum with the increase in light intensity (>6500 lux) and decreased with the reduction in pH (<8.5). Figure 4b represents a contour diagram showing the combined effect of light intensity and pH on the removal of ammonium. This response variable increased with an increase in light intensity and pH, while in Figure 3c, a maximum elimination of orthophosphates is observed with the increase in light intensity but a decrease with the increase in pH. In Figure 4a–c, the intensity of the light has a greater influence on the response variables compared to the variation in pH.

3.1.3. Numerical Optimization

To maximize the response variables, numerical optimization was used. As a standard, the objectives for each independent variable were selected “in the range”, while the desired objectives in terms of microalgal biomass and nutrients removal were defined as “maximize.” From the results, a microalgae biomass of 0.571 g/L, an ammonium removal of 99.18% and an orthophosphate removal of 60.93% can be predicted with a convenience of 0.9 with the next optimal conditions: 8.44 for pH, and a light intensity of 8433 lx in the daily illumination time of 16 h. The results suggest that the system developed demonstrates promising potential as an attractive alternative solution for the treatment of wastewater by the microalgae system.

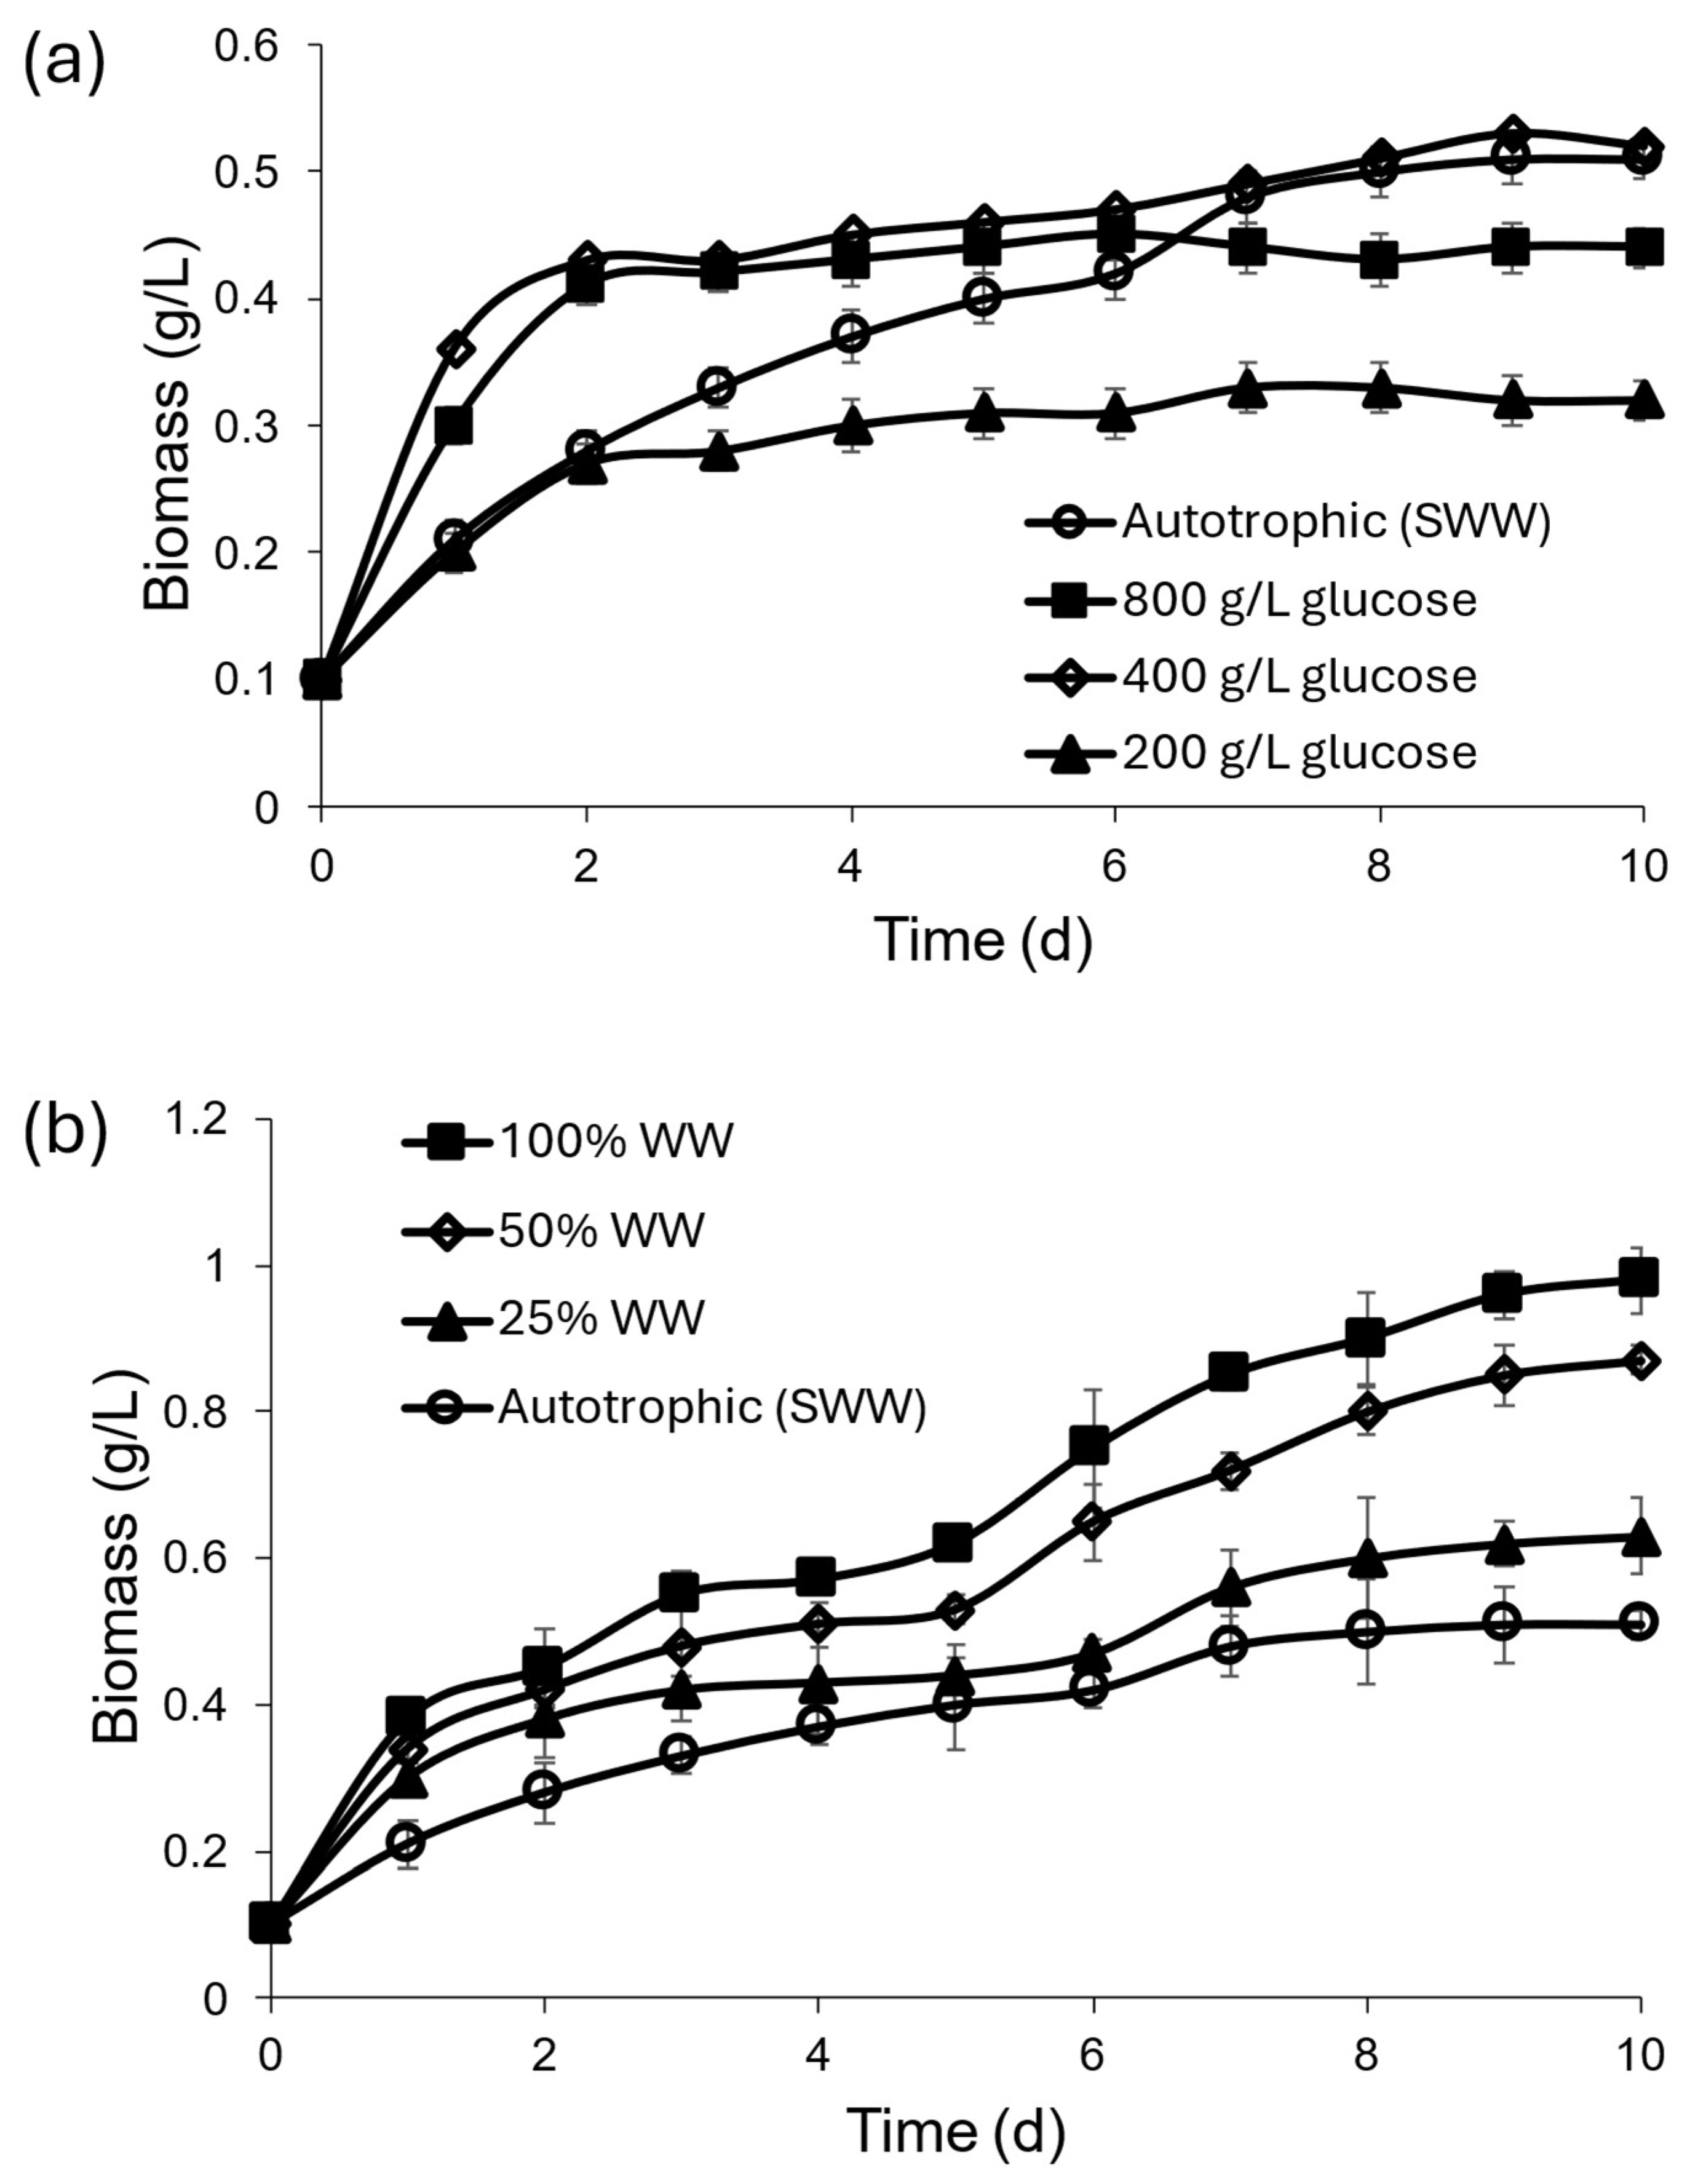
3.2. Mixotrophic Cultivation Under Optimal Conditions

To evaluate the efficacy of the optimization process and the reliability of the predicted optimal conditions, a validation experiment was conducted to ascertain whether the predicted optimal conditions would yield the anticipated improvements in microalgal biomass production and ammonium and orthophosphate removal. Under the optimized conditions (pH 8.44, a light intensity of 8433 lux, and a daily illumination time of 16 h), Chlorella vulgaris was cultivated in both synthetic and municipal wastewater to assess its performance and practical applicability in real-world wastewater treatment scenarios. The selection of municipal wastewater aimed to simulate actual operational conditions, thereby providing a more realistic assessment of the microalgae’s potential for wastewater treatment and resource recovery.
The microalgae growth profile was evaluated by the addition of different glucose concentrations with SWW under optimal conditions. Mixotrophic cultivation may have advantages in cellular metabolism reflected in an increase in productivity and biomass growth rate [21]. Under these conditions, energy could be produced continuously by catabolizing organic compounds through respiration and converting light energy into chemical energy through photosynthesis [22], which could improve the transport and adsorption of nutrients in the cell, resulting in an increase in the elimination rate in a SWW compared to an autotrophic culture. In our results, the biomass production yield (Figure 5a) and the specific growth rate (µ) (Table 5) improved with an increase in glucose concentration, mainly in the first 6 days, this was due to the simultaneous uptake of organic compounds, glucose as a carbon source and SWW nutrients that favored cell synthesis when used as an energy source [23]. The addition of 400 mg/L of glucose resulted in an increase after 6 days of 52.9 mg/L, compared to that which did not contain glucose (autotrophic). When glucose was increased to 800 mg/L, biomass production decreased 30 mg/L in the 6-day cultivation period. A decrease of 117 mg/L in biomass production was observed by adding 200 mg/L of glucose compared to the autotrophic system. At the end of a 10-day period, the addition of 400 mg/L of glucose had a similar yield compared to autotrophic culture. The specific growth rate in the mixotrophic culture with 400 mg/L glucose increased approximately 1.1 times than in the autotrophic culture. The variations in carbohydrate and lipid content at different glucose concentrations were insignificant, ranging from 22.46–26.25% to 19.35–22.27%, for carbohydrates and lipids, respectively, while the concentration of pigments was lower with the addition of glucose (Table 5) compared to the autotrophic system. We have looked in detail at how heterotrophic metabolism contributes to the partial reduction in photosynthetic pigment (i.e., chlorophylls and carotenoids) content compared to pure autotrophic cultivation. This argumentation is essential in the context of the final application of the biomass, since the pigment content is important for inherent health properties such as nutraceuticals and feed. The mixotrophic culture with glucose showed a slight decrease in ammonium, with 92.22% when 800 mg/L of glucose was used compared to 97.66% under autotrophic conditions. On the other hand, orthophosphate removal was improved with the increase in glucose, specifically 75.46% when 400 mg/L glucose was used, it was the uptake rate of this nutrient with µuptake = 0.147/day. Given the results of the increase in biomass production and nutrient removal, a concentration of 400 mg/L of glucose can be considered the ideal option for the cultivation of this microalga, indicating that when enough glucose is added to the environment the response variables they increase to some extent, this due to the competition between carbon and nutrients. In addition, we observe that the time of biomass production could be reduced by adding the appropriate amount of glucose to the SWW by promoting an improvement in the efficiencies of the response variables analyzed. The results of mixotrophic cultures suggest that the synergistic effect of photoautotrophy and heterotrophy enhances microalgal growth [24]. Maximum biomass productivity and lipid productivity have been observed in mixotrophic cultivation with glucose addition [19]. A novel mechanism has been proposed for the synergistic effects in mixotrophic cultivation, in which glucose is more efficiently utilized for biomass production by the possible coordination of energy and carbon metabolism [25]. In heterotrophic and mixotrophic cultures, microalgae can utilize organic carbon sources, such as glucose, to enhance their growth and lipid accumulation [26]. It has been shown that the microalgae Chlorella protothecoides achieves a high yield when cultivated using a mixed mode photosynthetic-heterotrophic cultivation process [27]. In general, under mixotrophic conditions, the addition of organic carbon sources such as glucose can significantly enhance microalgal growth and lipid accumulation [28]. Furthermore, the cultivation of microalgae under mixotrophic conditions involves the simultaneous assimilation of CO2 and organic carbons, leading to the operation of both respiratory and photosynthetic metabolism concurrently [23]. While mixotrophy can lead to higher biomass yields, this characteristic is highly dependent on the specific microalgal strain used and the cultivation conditions (e.g., organic substrate concentration, light intensity, nutrient availability) [11]. The optimization of nutrient environment and growth conditions are important to fully utilize the advantages and potentials of the microalgae culture model [29]. To enhance the commercial production of microalgae biodiesel, xylose utilization was assessed using Scenedesmus quadricauda FACHB-1297, demonstrating its capacity for mixotrophic and heterotrophic growth, as well as lipid production on xylose-rich waste streams from the pulp and paper industry, leading to substantial increases in lipid productivities compared to photoautotrophic lipid yields [30]. These findings highlight the significance of selecting appropriate organic carbon sources to maximize microalgal growth rates during the green stage [31]. Lipid composing and chlorophyll production are fundamental considerations in mixotrophic cultures. It has been reported that a high lipid amount at the end of a batch could be associated with nutritional stress suffered for this species over the feeding schedule. In fact, the algal biomass typically contains source of carbohydrates, proteins, and lipids when applied in bioreactors and the concentration of these metabolites can be different from one type of microalgae species to another and from one growth condition to another (e.g., nutrient concentration, cultivation time, light intensity, temperature, pH, and salinity). Microalgae strains can also be grown using a number of methods, such as autotrophically, heterotrophically, or mixotrophically [10]. Chlorella vulgaris mixotrophic cultivation has been established as an efficient for nutrient removal (N, P) and plays an essential role in the improving of wastewater treatment to achieve the decrease in N, P, and COD. As indicated by some studies, microalgae particularly are capable of a high removal of N and P compounds from wastewater, being highly effective for pollutant removal [14]. Figure 5b shows the effect of original WW on the microalgae culture of Chlorella sp. at different dilutions (25%, 50% and 100%). The original wastewater was characterized by its physical-chemical properties, which consisted of the following compositions: pH (7.18 ± 0.02), alkalinity (432.4 ± 4.21 mg/L), total solids (TS) (446 ± 23.24 mg/L), COD (856 ± 27.45 mg O2/L) and concentration of nutrients such as ammonium (38.48 ± 2.14 mg/L) and orthophosphates (11.13 ± 0.95 mg/L). For the tests, only the soluble and sterile fraction was used, constituting the following composition: pH (7.35 ± 0.03), alkalinity (404.7 ±3.68), TS (415 ± 18.54 mg/L), COD (811 ± 18.97 mg O2/L), ammonia (34.87 ± 3.01 mg/L) and orthophosphates (9.83 ± 1.06 mg/L). Although we have shown that Chlorella vulgaris was effective in removing nutrients and COD in real domestic wastewater in the present study, we should also consider the limitation to discuss the overall behavior of such wastewater. The primary investigation was focused on general indices without identifying heavy metals (Cu2+, Zn2+) and new pollutants (antibiotics). Thus, the total effectiveness of real wastewater treatment with respect to total pollutant removal could not be evaluated in this study. Priorities for further work include a more comprehensive chemical characterization of municipal wastewater and the extent to which the system can meet the demands of complex wastewaters. The characterization of seasonal/diurnal variability in the composition of the municipal wastewater sample was not achieved, and the representativeness value of the municipal wastewater was for the sample period only. The characteristics of the wastewater can vary and have an impact over time on system operation. This is indicated as a critical research direction.
Biomass growth profiles increased with increasing WW concentration, obtaining biomass concentrations of 0.66 g/L, 0.88 g/L and 0.98 g/L when using dilutions of 25%, 50% and 100%, respectively. A stationary phase is observed during the 3rd and 5th day of cultivation (Figure 5b). The specific growth rate (u) in the mixotrophic culture with 100% WW was increased approximately 1.4 times than in the autotrophic culture, which was higher than when using glucose as an energy source. In the carbohydrate and lipid content of the biomass grown in different WW dilutions, an increase was observed, going up from 22.67% to 29.14% and from 19.46% to 25.20% when the WW concentration was increased from 25% to 100%, respectively (Table 5). Although our main interest was in nutrient removal and lipid and carbohydrate accumulation, the protein content is an important parameter that should also be considered in evaluating microalgal biomass for feed and biorefinery applications. The overall potential of biomass as a multifunctional bioproduct will be comprehensively examined, including the measurement of protein content in upcoming research. On the other hand, greater nutrient removal was observed when using a 50% dilution (50:50 WW diluted with water), obtaining a removal rate of 97.25% and 71.14% for ammonium and orthophosphate, respectively. Given these results, an increase in the concentration of carbon and nutrients by the WW generated an increase in biomass production, so using the centered WW can be considered a viable alternative for the cultivation of this microalgae. Although it is easier to grow these species autotrophically, the mixotrophic mode is frequently met with considerable benefits in both terms of biomass productivity and nutrient pickup rates. This results in enhanced economical, energetic efficiency and as a consequence also lower operating costs per unit of treated effluent and biomass production, despite the requirement of an organic carbon source.
In mixotrophic growth, two cellular processes coexist in microalgae cells, photosynthesis and aerobic respiration, influenced by light intensity and carbon concentration, respectively. With a fixed light intensity, the level of organic carbon concentration influences its oxidative metabolism and, therefore, affected cell growth [32], as observed in these results. Meanwhile, it was shown that a carbon contribution in a mixotrophic microalgae culture exceeds the advantage of an autotrophic culture. While this study clearly demonstrates that growing microalgae in both autotrophic and mixotrophic ways can effectively treat wastewater and produce useful products, we acknowledge that we did not investigate the costs of cultivation, like glucose and light energy, in this first phase of the research. Thus, the total economic underpinning for the research topic of ‘sustainability’ as constructed only from the markers of biomass and of removal rates, is restricted. Nevertheless, the use of municipal wastewater as a cost-effective nutrient and carbon source is the crux of the economic feasibility and ecological soundness of this method. This early data give you a rough benchmark. A more comprehensive techno-economic analysis and Life Cycle Assessment (LCA) are essential for fully validating the sustainability and scalability of the process, and these analyses will be the focus of our future work.

3.3. Advancements in Microalgal Carbon Utilization and Municipal Wastewater Treatment

Recent literature highlights the versatile application of microalgae, especially Chlorella species, in biotechnology, focusing on optimizing growth using various carbon sources and their role in municipal wastewater remediation. Studies, as summarized in Table 6, demonstrate the efficacy of organic and inorganic carbon sources like methanol, glycerol, xylose, sweet sorghum bagasse hydrolysate, and sodium bicarbonate to enhance biomass and lipid production in Chlorella vulgaris and other microalgae. Concurrently, Table 7 showcases the significant potential of microalgae in treating both real and synthetic municipal wastewater, effectively removing pollutants such as nitrogen, phosphorus, COD, and emerging contaminants, with Chlorella vulgaris consistently exhibiting high removal efficiencies, often enhanced by strategies like cell immobilization. This collective body of research underscores microalgae’s dual benefits in generating valuable bioproducts and contributing to sustainable wastewater management. In the present study, we further advanced the best parameters found for mixotrophic cultivation of microalgae in wastewater through detailed comparison and mechanistic analysis based on these developments. Table 6 and Table 7 show different methods and past results, and here, we explore more about the biological and chemical processes that explain why we see better growth of biomass and removal of nutrients when mixotrophic conditions are improved. We also compare our best conditions for light intensity, pH, and illumination time with those found in other studies, showing that in our improved system, the combined action of photoautotrophic and heterotrophic metabolisms is key for better efficiency. This expanded mechanistic framework situates our data within a broader context, highlighting both the innovative aspects and the unique characteristics of our optimized system in comparison to conventional protocols.
Apart from microalgae-based systems, the manufacturing of novel materials and new schemes for various wastewater problems has achieved remarkable progress. For example, some new types of composite coagulants, like polyferric magnesium-silicate-sulfate, can effectively remove impurities from various waters and wastewaters, especially in reducing turbidity and color [47]. Concurrently with iron-based materials, amorphous-like cobalt-based catalysts are also investigated for PMS activation in AOPs, providing excellent dye removal and a broad range of application possibilities in complex wastewater treatment at different pH values, amounts of pollutants, and inorganic anions [48]. Another remarkable development has been the upcycling of industrial waste into superior adsorbents, represented by the production of functionalized activated carbon prepared from waste amidoxime resin with enhanced Cr(VI) adsorption, which follows the ‘treating waste with waste’ strategy [49]. Conversely, a comprehensive review article indicated that the development of multifunctional materials with adjustable superwettability has consistently progressed, and these materials are crucial for addressing challenging issues such as wastewater treatment and separating oil from water or other industrial effluent pollutants [50]. We have also enhanced the discussion to have more effectively emphasized contribution to principles of circular economy in this study. We have stressed the example value of using a waste stream such as wastewater for biomass and bioproduct production as an obvious form of valorization and waste minimization. Moreover, the compatibility of this microalgae technology with current wastewater treatment plants (WWTPs) has also been studied, offering coexistential relations where microalgae could act as complement or even upgrade the treatment process traditional.
Microalgae-bacteria consortia have been considered as a promising, sustainable and cost-effective option in industrial wastewater treatment. This techno-model encourages resource recovery and valorization with potential for nutrient removal and biomass production [51]. This is corroborated by investigations at the lab and pilot scales that show successful cultivation of Chlorella vulgaris using wastewaters in municipal WWTPs. Especially for COD, TN, TP and CO2, treatment performance in these systems have obtained great improvement than conventional activated sludge single systems. The results present the possibilities for implementations of such systems at the full-scale and offer operational recommendations for realizing carbon neutrality in a WWTP [52].

3.4. Study Limitations and Future Perspectives

This study offers useful information on how to grow Chlorella vulgaris effectively for treating wastewater, but some limitations in the way the experiments were setup, which should be discussed and will help shape future research. The natural differences in real municipal wastewater, which can change a lot in terms of its chemical makeup, pollution levels, and types of microbes based on where and when it is collected, were not fully examined for how they might affect the results in this study. Furthermore, using autoclaved wastewater in some experimental phases effectively excluded potential microbial competition (e.g., native bacteria in the wastewater) while ensuring control over the target micro-algal strain. While our results obtained in a controlled environment provide a strong foundational understanding, recognizing the complexity of real-world systems is crucial. The differences in real wastewater makeup and the chance of microbial interactions in an unclean environment will require more research on a larger scale to completely confirm how strong and useful the system is over time. Also, the discussion has been extended to consider difficulties on the scale-up of the system, in particular related to the real heterogeneity of the wastewater and the dynamics of microbial competition. Methods to handle these problems going forward into further development have been suggested, including pre-treatment wastewater systems and ongoing analysis of the microbial community in larger bioreactors.

4. Conclusions

In the present study, the optimal conditions for the autotrophic culture of Chlorella sp. in SWW were predicted using response surface methodology. There were no significant differences between the predicted values and the experimental values determined by validation experiments, confirming the availability and accuracy of the models obtained. Under optimal conditions, the microalgae biomass yield, ammonium removal, and orthophosphate elimination were 0.53 g/L, 99%, and 59%, respectively, in autotrophic culture. The addition of 400 mg/L glucose simultaneously improved microalgae production and orthophosphate elimination. Furthermore, using municipal wastewater increased the microalgae biomass yield; therefore, a mixotrophic culture was an effective means to enhance microalgae growth and nutrient removal under optimal conditions. These optimized procedures have promising potential in the efficient recovery of nutrients in nutrient-specific wastewaters for valuable microalgae culturing.

Author Contributions

Conceptualization, J.N.-A. and C.G.-G.; methodology, I.C.R.-S.; software, L.S.-M.; validation, L.M.D.-T., L.A.L.S. and C.G.-G.; formal analysis, L.A.L.S.; investigation, C.D.L.M.-O.; resources, C.G.-G.; data curation, R.G.P.; writing—original draft preparation, C.G.-G.; writing—review and editing, J.N.-A.; visualization, E.M.-O.; supervision, L.I.P.-V.; project administration, L.I.P.-V.; funding acquisition, C.G.-G. All authors have read and agreed to the published version of the manuscript.

Funding

This research received no external funding.

Institutional Review Board Statement

Not applicable.

Informed Consent Statement

Not applicable.

Data Availability Statement

The data presented in this study are available upon request from the corresponding author. The data are not publicly available due to not having a public repository at the moment of this publication.

Acknowledgments

The authors gratefully acknowledge the National Council for Humanities, Sciences and Technologies (CONAHCYT) of the Mexican Government, as well as the support granted through the National System of Researchers (SNI). They also extend their sincere thanks to the Decentralized Public Institute “Servicios de Agua y Drenaje de Monterrey (SADM)” for kindly providing the wastewater used in this study.

Conflicts of Interest

The authors declare no conflicts of interest.

References

  1. Kratzer, R.; Murkovic, M. Food ingredients and nutraceuticals from microalgae: Main product classes and biotechnological production. Foods 2021, 10, 1626. [Google Scholar] [CrossRef] [PubMed]
  2. Li, H.; Zhang, Y.; Liu, J.; Shen, Z.; Li, A.; Ma, T.; Feng, Q.; Sun, Y. Treatment of high-nitrate wastewater mixtures from MnO2 industry by Chlorella vulgaris. Bioresour. Technol. 2019, 291, 121836. [Google Scholar] [CrossRef] [PubMed]
  3. Alazaiza, M.Y.D.; He, S.; Su, D.; Abu Amr, S.S.; Toh, P.Y.; Bashir, M.J.K. Bashir. Sewage Water Treatment Using Chlorella Vulgaris Microalgae for Simultaneous Nutrient Separation and Biomass Production. Separations 2023, 10, 229. [Google Scholar] [CrossRef]
  4. Sravan, J.S.; Matsakas, L.; Sarkar, O. Advances in Biological Wastewater Treatment Processes: Focus on Low-Carbon Energy and Resource Recovery in Biorefinery Context. Bioengineering 2024, 11, 281. [Google Scholar] [CrossRef] [PubMed]
  5. Salbitani, G.; Carfagna, S. Ammonium utilization in microalgae: A sustainable method for wastewater treatment. Sustainability 2021, 13, 956. [Google Scholar] [CrossRef]
  6. Pérez-Mora, L.S.; Mejia-Da-Silva, L.d.C.; Cezare-Gomes, E.d.A.; Santo, É.D.E.; Gohara-Beirigo, A.K.; Matsudo, M.C.; Nardin, B.M.; Sant’anna, C.L.; de Carvalho, J.C.M. Phycoremediation Processes for Secondary Effluent from Sewage Treatment Plants Using Photosynthetic Microorganisms: A Review. Appl. Microbiol. 2023, 3, 400–416. [Google Scholar] [CrossRef]
  7. Mai, C.; Mojiri, A.; Palanisami, S.; Altaee, A.; Huang, Y.; Zhou, J.L. Wastewater Hydroponics for Pollutant Removal and Food Production: Principles, Progress and Future Outlook. Water 2023, 15, 2614. [Google Scholar] [CrossRef]
  8. Ramírez Mérida, L.G.; Rodríguez Padrón, R.A. Application of microalgae in wastewater: Opportunity for sustainable development. Front. Environ. Sci. 2023, 11, 1238640. [Google Scholar] [CrossRef]
  9. Goh, P.S.; Ahmad, N.A.; Lim, J.W.; Liang, Y.Y.; Kang, H.S.; Ismail, A.F.; Arthanareeswaran, G. Microalgae-Enabled Wastewater Remediation and Nutrient Recovery through Membrane Photobioreactors: Recent Achievements and Future Perspective. Membranes 2022, 12, 1094. [Google Scholar] [CrossRef] [PubMed]
  10. Satiro, J.; Gomes, A.; Florencio, L.; Simões, R.; Albuquerque, A. Effect of microalgae and bacteria inoculation on the startup of bioreactors for paper pulp wastewater and biofuel production. J. Environ. Manag. 2024, 362, 121305. [Google Scholar] [CrossRef] [PubMed]
  11. Bhuyar, P.; Trejo, M.; Dussadee, N.; Unpaprom, Y.; Ramaraj, R.; Whangchai, K. Microalgae cultivation in wastewater effluent from tilapia culture pond for enhanced bioethanol production. Water Sci. Technol. 2021, 84, 2686–2694. [Google Scholar] [CrossRef] [PubMed]
  12. Varsani, V.; Vyas, S.J.; Dudhagara, D.R. Development of bio-based material from the Moringa oleifera and its bio-coagulation kinetic modeling–A sustainable approach to treat the wastewater. Heliyon 2022, 8, e10447. [Google Scholar] [CrossRef] [PubMed]
  13. Shahraki, A.A. Clean Water Production from Urban Sewage by Algae-Based Treatment Techniques, a Reflection of Case Studies. Sustainability 2025, 17, 3107. [Google Scholar] [CrossRef]
  14. Popa, M.D.; Simionov, I.-A.; Petrea, S.M.; Georgescu, P.L.; Ifrim, G.A.; Iticescu, C. Efficiency of Microalgae Employment in Nutrient Removal (Nitrogen and Phosphorous) from Municipal Wastewater. Water 2025, 17, 260. [Google Scholar] [CrossRef]
  15. Maltsev, Y.; Kulikovskiy, M.; Maltseva, S. Nitrogen and phosphorus stress as a tool to induce lipid production in microalgae. Microb. Cell Factories 2023, 22, 239. [Google Scholar] [CrossRef] [PubMed]
  16. Mohsenpour, S.F.; Hennige, S.; Willoughby, N.; Adeloye, A.; Gutierrez, T. Integrating micro-algae into wastewater treatment: A review. Sci. Total Environ. 2021, 752, 142168. [Google Scholar] [CrossRef] [PubMed]
  17. Lorenzen, C.J. A note on the chlorophyll and phaeophytin content of the chlorophyll maximum. Limnol. Oceanog. 1965, 10, 482–483. [Google Scholar] [CrossRef]
  18. Yemm, E.W.; Willis, A.J. The estimation of carbohydrates in plant extracts by anthrone. Biochem. J. 1954, 57, 508–514. [Google Scholar] [CrossRef] [PubMed]
  19. APHA. Standard Methods for the Examination of Water and Wastewater, 20th ed.; American Public Health Association: Washington DC, USA, 1998. [Google Scholar]
  20. Gao, Y.; Bernard, O.; Fanesi, A.; Perré, P.; Lopes, F. The impact of light/dark regimes on structure and physiology of Chlorella vulgaris biofilms. Front. Microbiol. 2023, 14, 1250866. [Google Scholar] [CrossRef] [PubMed]
  21. Yun, H.S.; Kim, Y.S.; Yoon, H.S. Effect of Different Cultivation Modes (Photoautotrophic, Mixotrophic, and Heterotrophic) on the Growth of Chlorella sp. and Biocompositions. Front. Bioeng. Biotechnol. 2021, 9, 774143. [Google Scholar] [CrossRef] [PubMed]
  22. Arora, N.K.; Mishra, I. Progress of sustainable development goal 7: Clean and green energy for all as the biggest challenge to combat climate crisis. Environ. Sustain. 2022, 5, 395–399. [Google Scholar] [CrossRef] [PubMed]
  23. Goswami, R.K.; Mehariya, S.; Karthikeyan, O.P.; Verma, P. Influence of Carbon Sources on Biomass and Biomolecule Accumulation in Picochlorum sp. Cultured under the Mixotrophic Condition. Int. J. Environ. Res. Public Health 2022, 19, 3674. [Google Scholar] [CrossRef] [PubMed]
  24. Yan, X.; Shan, S.; Li, X.; Xu, Q.; Yan, X.; Ruan, R.; Cheng, P. Carbon and energy metabolism for the mixotrophic culture of Chlorella vulgaris using sodium acetate as a carbon source. Front. Microbiol. 2024, 15, 1436264. [Google Scholar] [CrossRef] [PubMed]
  25. Zhang, Z.; Sun, D.; Cheng, K.W.; Chen, F. Investigation of carbon and energy metabolic mechanism of mixotrophy in Chromochloris zofingiensis. Biotechnol. Biofuels 2021, 14, 36. [Google Scholar] [CrossRef] [PubMed]
  26. Nair, A.; Chakraborty, S. Synergistic effects between autotrophy and heterotrophy in optimization of mixotrophic cultivation of Chlorella sorokiniana in bubble-column photobioreactors. Algal Res. 2020, 46, 101799. [Google Scholar] [CrossRef]
  27. Ward, V.C.A.; Rehmann, L. Fast media optimization for mixotrophic cultivation of Chlorella vulgaris. Sci. Rep. 2019, 9, 19262. [Google Scholar] [CrossRef] [PubMed]
  28. Long, X.; Zhang, C.; Yang, Q.; Zhang, X.; Chen, W.; Zhu, X.; Xu, Q.; Tan, Q. Photoheterotroph improved the growth and nutrient levels of Chlorella vulgaris and the related molecular mechanism. Appl. Microbiol. Biotechnol. 2024, 108, 269. [Google Scholar] [CrossRef] [PubMed]
  29. Ye, Y.; Huang, Y.; Xia, A.; Fu, Q.; Liao, Q.; Zeng, W.; Zheng, Y.; Zhu, X. Optimizing culture conditions for heterotrophic-assisted photoautotrophic biofilm growth of Chlorella vulgaris to simultaneously improve microalgae biomass and lipid productivity. Bioresour. Technol. 2018, 270, 80–87. [Google Scholar] [CrossRef] [PubMed]
  30. Song, M.; Pei, H. The growth and lipid accumulation of Scenedesmus quadricauda during batch mixotrophic/heterotrophic cultivation using xylose as a carbon source. Bioresour. Technol. 2018, 263, 525–531. [Google Scholar] [CrossRef] [PubMed]
  31. Gaur, S.; Kaur, M.; Kalra, R.; Rene, E.R.; Goel, M. Application of microbial resources in biorefineries: Current trend and future prospects. Heliyon 2024, 10, e28615. [Google Scholar] [CrossRef] [PubMed]
  32. Aditi; Bhardwaj, R.; Yadav, A.; Swapnil, P.; Meena, M. Characterization of microalgal β-carotene and astaxanthin: Exploring their health-promoting properties under the effect of salinity and light intensity. Biotechnol. Biofuels Bioprod. 2025, 18, 18. [Google Scholar] [CrossRef] [PubMed]
  33. Plöhn, M.; Scherer, K.; Stagge, S.; Jönsson, L.J.; Funk, C. Utilization of Different Carbon Sources by Nordic Microalgae Grown Under Mixotrophic Conditions. Front. Mar. Sci. 2022, 9, 830800. [Google Scholar] [CrossRef]
  34. Arora, N.; Philippidis, G.P. Insights into the physiology of Chlorella vulgaris cultivated in sweet sorghum bagasse hydrolysate for sustainable algal biomass and lipid production. Sci. Rep. 2021, 11, 6779. [Google Scholar] [CrossRef] [PubMed]
  35. Cordoba-Perez, M.; de Lasa, H. CO2-derived carbon capture using microalgae and sodium bicarbonate in a photobioCREC unit: Kinetic modeling. Processes 2021, 9, 1296. [Google Scholar] [CrossRef]
  36. Ratomski, P.; Hawrot-Paw, M.; Koniuszy, A. Utilisation of co2 from sodium bicarbonate to produce chlorella vulgaris biomass in tubular photobioreactors for biofuel purposes. Sustainability 2021, 13, 9118. [Google Scholar] [CrossRef]
  37. Yu, H.C.; Lay, C.H.; Abdul, P.M.; Wu, J.Y. Enhancing Lipid Production of Chlorella sp. by Mixotrophic Cultivation Optimization. Processes 2023, 11, 1892. [Google Scholar] [CrossRef]
  38. Kong, W.; Yang, S.; Wang, H.; Huo, H.; Guo, B.; Liu, N.; Zhang, A.; Niu, S. Regulation of biomass, pigments, and lipid production by Chlorella vulgaris 31 through controlling trophic modes and carbon sources. J. Appl. Phycol. 2020, 32, 1569–1579. [Google Scholar] [CrossRef]
  39. Whangchai, K.; Mathimani, T.; Sekar, M.; Shanmugam, S.; Brindhadevi, K.; Van Hung, T.; Chinnathambi, A.; Alharbi, S.A.; Pugazhendhi, A. Synergistic supplementation of organic carbon substrates for upgrading neutral lipids and fatty acids contents in microalga. J. Environ. Chem. Eng. 2021, 9, 105482. [Google Scholar] [CrossRef]
  40. Mohammadi, F.S.; Arabian, D. Optimization of Chlorella vulgaris cultivation grown in waste molasses syrup using mixture design. J. Am. Oil Chem. Soc. 2022, 100, 45–56. [Google Scholar] [CrossRef]
  41. Trinh-Dang, M.; Kim, O.T.T. Effects of Some Nutritional Factors on the Growth of Chlorella vulgaris in a Mixotrophic Cultivation. J. Adv. Biol. Biotechnol. 2023, 26, 1–8. [Google Scholar] [CrossRef]
  42. Dewi, R.N.; Mahreni; Nur, M.M.A.; Siahaan, A.A.; Ardhi, A.C. Enhancing the biomass production of microalgae by mixotrophic cultivation using virgin coconut oil mill effluent. Environ. Eng. Res. 2022, 28, 220059. [Google Scholar] [CrossRef]
  43. Tan, Y.H.; Chai, M.K.; Ooi, Y.K.; Wong, L.S. Assessment of Domestic Wastewaters as Potential Growth Media for Chlorella vulgaris and Haematococcus pluvialis. Pertanika J. Sci. Technol. 2022, 30, 565–580. [Google Scholar] [CrossRef]
  44. Seyhaneyıldız Can, Ş.; Can, E.; Yılmaz, K. Lipid content and wastewater treatment potential of Chlorella vulgaris and Scenedesmus obliquus isolated from Uzuncayır Dam Lake. Oceanol. Hydrobiol. Stud. 2024, 53, 310–320. [Google Scholar] [CrossRef]
  45. Salgueiro, J.L.; Perez-Rial, L.; Maceiras, R.; Sanchez, A.; Cancela, A. Transforming Wastewater into Biofuel: Nutrient Removal and Biomass Generation with Chlorella vulgaris. Energies 2024, 17, 4911. [Google Scholar] [CrossRef]
  46. Mojiri, A.; Ozaki, N.; Kazeroon, R.A.; Rezania, S.; Baharlooeian, M.; Vakili, M.; Farraji, H.; Ohashi, A.; Kindaichi, T.; Zhou, J.L. Contaminant Removal from Wastewater by Microalgal Photobioreactors and Modeling by Artificial Neural Network. Water 2022, 14, 4046. [Google Scholar] [CrossRef]
  47. Huo, X.; Chai, R.; Gou, L.; Zhang, M.; Guo, M. Facile synthesis of composite polyferric magnesium–silicate–sulfate coagulant with enhanced performance in water and wastewater. Int. J. Miner. Met. Mater. 2024, 31, 574–584. [Google Scholar] [CrossRef]
  48. Zhou, X.C.; Chen, S.Q.; Zhou, M.J.; Li, M.; Lan, S.; Feng, T. Highly efficient cobalt-based amorphous catalyst for peroxymonosulfate activation toward wastewater remediation. Rare Met. 2023, 42, 1160–1174. [Google Scholar] [CrossRef]
  49. He, C.; Liu, Y.; Qi, M.; Liu, Z.; Wei, Y.; Fujita, T.; Wang, G.; Ma, S.; Yang, W. A functionalized activated carbon adsorbent prepared from waste amidoxime resin by modifying with H3PO4 and ZnCl2 and its excellent Cr(VI) adsorption. Int. J. Miner. Met. Mater. 2024, 31, 585–598. [Google Scholar] [CrossRef]
  50. Wang, Y.; Wang, W. Multifunctional materials with controllable superwettability for oil–water separation and removal of pollutants: Design, emerging applications, and challenges. Carbon Neutralization 2023, 2, 378–412. [Google Scholar] [CrossRef]
  51. Sátiro, J.; Cunha, A.; Gomes, A.P.; Simões, R.; Albuquerque, A. Optimization of Microalgae–Bacteria Consortium in the Treatment of Paper Pulp Wastewater. Appl. Sci. 2022, 12, 579. [Google Scholar] [CrossRef]
  52. Galang, M.G.K.; Chen, J.; Cobb, K.; Zarra, T.; Ruan, R. Reduction of biogenic CO2 emissions, COD and nutrients in municipal wastewater via mixotrophic co-cultivation of Chlorella vulgaris–aerobic-activated sludge consortium. Environ. Technol. 2025, 46, 3348–3362. [Google Scholar] [CrossRef] [PubMed]
Figure 1. Overview of the autotrophic and mixotrophic microalgal cultivation system for wastewater treatment.
Sustainability 17 06539 g001
Figure 2. Predicted vs. actual values for (a) microalgal biomass (g/L), (b) ammonium removal (%), and (c) orthophosphate removal (%). The color variations in the data points represent different experimental runs within the Central Composite Design, indicating the range of conditions evaluated.
Sustainability 17 06539 g002
Figure 3. The effects of light intensity (lux) value and illumination time (h) on the performance of the microalgae cultivation: (a) biomass (g/L), (b) ammonium removal (%), and (c) orthophosphate removal (%) under pH of 8.5. The color gradient on the surface plots indicates the magnitude of the response variable, with cooler colors (e.g., blue/green) representing lower values and warmer colors (e.g., yellow/red) representing higher values.
Sustainability 17 06539 g003
Figure 4. The effects of light intensity (lux) value and pH on the performance of the microalgae cultivation: (a) microalgal biomass (g/L), (b) ammonium removal (%), and (c) orthophosphate removal (%) under daily illumination time for 12 h. The color gradient on the surface plots indicates the magnitude of the response variable, with cooler colors (e.g., blue/green) representing lower values and warmer colors (e.g., yellow/red) representing higher values.
Sustainability 17 06539 g004
Figure 5. Growth profile of microalgal culture under optimal conditions: (a) effect of glucose, and (b) effect of municipal wastewater.
Sustainability 17 06539 g005
Table 1. Experimental design with experimental responses.
Run.X1: pHX2: Light IntensityX3: Illumination Time (h)Y1: Biomass
(g/L)
Y2: Ammonium
Removal (%)
Y3: Orthophosphate
Removal (%)
(lux) Exp.Pred.Exp.Pred.Exp.Pred.
18.50650018.730.600.5599.1499.6448.6550.53
28.506500120.480.5098.3398.2061.9564.67
38.5065005.270.310.3898.8598.5748.7456.52
49.5010,00080.470.4398.2797.6952.5046.17
58.506500120.520.5098.2598.2069.1764.67
68.506500120.550.5098.3998.2070.1764.67
77.50300080.240.2596.3796.8241.1337.09
87.503000160.280.3299.0896.9230.2729.75
99.50300080.270.2597.7097.3737.1033.71
108.506500120.440.5098.2598.2063.3864.67
117.5010,000160.460.4899.3699.5651.7648.29
128.50614120.180.1494.5094.7217.1219.64
138.5012,386120.380.4397.2097.2138.5645.71
149.5010,000160.590.5899.4598.8749.2246.39
157.5010,00080.400.3597.5098.3852.4147.47
169.503000160.290.3395.9097.4727.6725.77
178.506500120.510.5098.0098.2063.0064.67
1810.186500120.410.4398.6798.5728.6433.90
196.826500120.360.3698.3798.6833.9738.34
208.506500120.520.5098.0098.2062.0064.67
Table 2. Analysis of variance for the variable response biomass.
SourceSum of SquaresdfMean SquareF-ValueProb > F
Model0.2590.02810.630.00065
X 1 0.007710.00772.90.1195
X 2 0.101310.101338.20.0001
X 3 0.038810.038814.620.0034
X 1 X 2 0.003210.00321.210.2978
X 1 X 3 0.000210.00020.07540.7892
X 2 X 3 0.001810.00180.67850.4293
X 1 2 0.022910.02298.610.0149
X 2 2 0.085210.085332.160.0002
X 3 2 0.003310.00331.230.2926
Residual0.0265100.0027
Lack of Fit0.01950.00382.620.1572
Pure Error0.007350.0015
Cor Total0.280219
Table 3. Analysis of variance for the variable response ammonium (NH+4).
SourceSum of SquaresdfMean SquareF-ValueProb > F
Model25.6492.8510.070.0006
X 1 0.017310.01730.0610.8099
X 2 7.4317.4326.250.0004
X 3 1.4411.445.10.0476
X 1 X 2 0.91810.91803.240.1018
X 1 X 3 3.3713.3711.90.0062
X 2 X 3 0.567110.56712.000.1872
X 1 2 0.333710.33371.180.3029
X 2 2 9.0419.0431.930.0002
X 3 2 1.4811.485.220.0454
Residual2.83100.2829
Lack of Fit2.6950.538319.510.0027
Pure Error0.137950.0276
Cor Total28.4719
Table 4. Analysis of variance for the variable response orthophosphate (PO43−).
SourceSum of SquaresdfMean SquareF-ValueProb > F
Model3993.899443.7712.520.0002
X 1 23.84123.840.67290.4312
X 2 819.291819.2923.120.0007
X 3 43.49143.491.230.2938
X 1 X 2 2.1812.180.06160.8089
X 1 X 3 0.1810.180.00510.9446
X 2 X 3 33.46133.460.94430.3541
X 1 2 1465.7611465.7641.37<0.0001
X 2 2 1843.4811843.4852.03<0.0001
X 3 2 223.351223.356.30.0309
Residual354.311035.43
Lack of Fit285.28557.064.130.0728
Pure Error69.03513.81
Cor Total4348.219
Table 5. Response values, biochemical characteristics and kinetic parameters of Chlorella vulgaris cultivation under optimal conditions in SWW and WW.
Parameter Conditions
Optimal conditions
pH
8.44
Light intensity (lux)8433
Illumination time (h)16
SWWSWW + 200 g/L glucoseSWW + 400 g/L glucoseSWW + 800 g/L glucoseWW 25%WW 50%WW 100%
Response variables
Biomass (g/L) pred.0.542
Biomass (g/L) exp.0.534 ± 0.030.32 ± 0.010.51 ± 0.030.46 ± 0.040.66 ± 0.030.88 ± 0.020.98 ± 0.06
Ammonium removal (%) pred.98.87
Ammonium removal (%) exp.97.66 ± 1.6997.83 ± 0.4593.32 ± 2.3293.32 ± 3.6591.23 ± 4.0697.25 ± 2.7394.90 ± 0.57
Orthophosphate removal (%) pred.60.01
Orthophosphate removal (%) exp.58.78 ± 2.7253.79 ± 0.5075.46 ± 2.2463.47 ± 0.8854.80 ± 3.5171.14 ± 2.2264.92 ± 3.26
Biochemical profile
Total carbohydrate (%)28.46 ± 1.5225.81 ± 2.0126.25 ± 0.8924.21 ± 2.3522.67 ± 0.9729.57 ± 1.7827.14 ± 3.04
Total lipid (%)21.40 ± 0.9421.90 ± 0.3719.35 ± 1.0322.27 ± 0.8319.46 ± 0.8622.31 ± 1.5125.20 ± 1.39
Chlorophyll-a (mg/mL)7.46 ± 0.893.80 ± 0.553.98 ± 0.283.99 ± 0.401.73 ± 0.494.27 ± 0.718.50 ± 0.88
Chlorophyll-b (mg/mL)3.53 ± 0.181.65 ± 0.141.18 ± 0.151.44 ± 0.180.79 ± 0.201.48 ± 0.293.10 ± 0.51
Carotenoids (mg/mL)2.01 ± 0.061.02 ± 0.131.38 ± 0.111.19 ± 0.120.84 ± 0.271.50 ± 0.262.81 ± 0.33
Kinetic parameters
Biomass productivity (mg/L/day)41.45 ± 2.8721.27 ± 0.2641.20 ± 2.7634.97 ± 4.0857.40 ± 2.5577.40 ± 0.5086.41 ± 5.34
Specific growth rate (1/day)0.149 ± 0.0180.105 ± 0.0300.162 ± 0.0260.147 ± 0.0280.197 ± 0.0030.209 ± 0.0130.211 ± 0.016
Lipid productivity (mg/L/day)329.32 ± 45.30337.01 ± 36.53307.69 ± 1.53342.56 ± 19.07299.48 ± 13.98343.07 ± 34.64312.30 ± 23.78
µuptake ammonium (1/day)0.602 ± 0.020.665 ± 0.010.581 ± 0.010.543 ± 0.010.463 ± 0.010.523 ± 0.020.565 ± 0.01
µuptake orthophosphate(1/day)0.085 ± 0.010.077 ± 0.010.147 ± 0.010.129 ± 0.010.079 ± 0.010.217 ± 0.020.104 ± 0.01
Table 6. Overview of prior research on carbon source optimization for chlorella cultivation.
StrainReferenceCarbon SourceFindings
Chlorella vulgaris, Coelastrella sp., Desmodesmus sp., Chlorococcum sp., and Scotiellopsis reticulata[33]Methanol, glycerol, and xyloseXylose at 6 g/L and methanol at 3% for Chlorococcum sp. and Scotiellopsis reticulata, while Chlorococcum sp. with glycerol at 20 g/L
Chlorella vulgaris[34]Weet sorghum bagasse hydrolysateOptimal biomass production (3.44 g/L) and lipid productivity (120 mg/L/d) when cultivated mixotrophically with 25% v/v sweet sorghum bagasse hydrolysate
Chlorella vulgaris[35]NaHCO3A selectivity of up to 33.0%, achieving a maximum organic carbon formation rate of 1.18 mmol/L/day at 28 mM NaHCO3
Chlorella vulgaris[36]NaHCO32 g/L sodium bicarbonate increased biomass productivity (7.0 ± 1.0 mg/L/d and lipid content (26 ± 4%
Chlorella sp. [37]Peptone, urea, yeast extract, NH4Cl, (NH4)2SO4, NH4NO3, NaNO3, and KNO31 g/L glucose and 0.2 g/L (NH4)2SO4 at pH 10 for the highest total FAMEs content (59%)
Chlorella vulgaris[38]Glucose, maltose, sodium acetate, sucrose, glycerol and xyloseEnhanced growth with glucose, maltose, and sodium acetate at concentrations of 2 and 10 g/L, which also significantly increased lipid production while decreasing chlorophyll and carotenoid biosynthesis under mixotrophic and heterotrophic conditions
Chlorella vulgaris[39]Acetate, dextrose and bicarbonate2.7 g/L biomass yield and 20.8% lipid content with 0.4% acetate, further enhanced to 27% total lipid content and 69% neutral lipid content with the combined supplementation of 0.4% acetate and 0.6% dextrose
Chlorella vulgaris[40]Molasses, NaNO3, and K2HPO4Lipid productivity of 115 mg/L/d with 9.5 g/L molasses, 5 g/L NaNO3, and 0.15 g/L K2HPO4
Chlorella vulgaris[41]Glucose, sodium acetate, and sucroseglucose supplementation at a C:N ratio of 18:1 (52.92 mmol/L carbon and 2.94 mmol/L nitrogen), yielding a maximum growth rate of 0.58/day
Chlorella vulgaris and Botryococcus braunii[42]Virgin coconut oil mill effluent with glucose and glycerolChlorella vulgaris showed optimal biomass production at 5.34 g/L in 20% virgin coconut oil mill effluent, while Botryococcus braunii achieved its best biomass yield of 5.60 g/L under mixotrophic conditions with an 80:20 glucose to glycerol ratio
Table 7. Overview of Chlorella studies utilizing real and synthetic municipal wastewater.
StrainReferenceStrategy Findings
Chlorella vulgaris and Haematococcus pluvialis[43]Real municipal wastewater at 10%, 20%, 50%, and 80%Chlorella vulgaris exhibited a biomass concentration of 0.227 g/L and over 88% removal efficiency for total nitrogen, total phosphorus, and total ammonia nitrogen in 50% domestic wastewater, while Haematococcus pluvialis achieved over 80% total ammonia nitrogen removal in 50% and 80% wastewater
Chlorella vulgaris[3]Real municipal wastewater at 50%, 60%, 70%, 80%, and 90%Maximum removals of 84% COD, 95% NH3-N, and 97% phosphorus, and peak biomass production typically occurring by day 12, extending to day 14 at an 80% wastewater mixing ratio
Chlorella vulgaris and Scenedesmus obliquus[44]Real municipal wastewater at 0.25%, 50%, and 75%Both strains demonstrated optimal biomass and lipid content increases, along with effective nutrient removal, when cultured in wastewater diluted to 0.25%, 50%, and 75% concentrations over a 20-day period
Chlorella vulgaris[45]Synthetic wastewater varying nitrate, nitrite and COD97% nitrate, 90% nitrite, and 90.6% COD was removed, yielding biomass with a 20% fatty acid extraction rate
Chlorella vulgaris[46]Synthetic wastewater with high concentrations (>10 mg/L) of total ammonia nitrogen, COD, caffeine and N,N-diethyl-m-toluamideRemoval rates of 82.3% total ammonia nitrogen, 67.7% COD, 85.7% caffeine, and 73.3% N,N-diethyl-m-toluamide
Disclaimer/Publisher’s Note: The statements, opinions and data contained in all publications are solely those of the individual author(s) and contributor(s) and not of MDPI and/or the editor(s). MDPI and/or the editor(s) disclaim responsibility for any injury to people or property resulting from any ideas, methods, instructions or products referred to in the content.

