Article

Toward a Sustainable Livestock Sector in China: Evolution Characteristics and Driving Factors of Carbon Emissions from a Life Cycle Perspective

by
Xiao Wang
1,
Xuezhen Xiong
2 and
Xiangfei Xin
1,*
1
Institute of Agricultural Economics and Development, Chinese Academy of Agricultural Sciences, Beijing 100081, China
2
School of Government, Beijing Normal University, Beijing 100081, China
*
Author to whom correspondence should be addressed.
Sustainability 2025, 17(14), 6537; https://doi.org/10.3390/su17146537
Submission received: 29 April 2025 / Revised: 11 July 2025 / Accepted: 14 July 2025 / Published: 17 July 2025

Abstract

Addressing the sustainability challenges posed by the expanding livestock sector is crucial for China’s green transition. With the transformation of national dietary structure and increasing demand for livestock products, the associated resource consumption and environmental impacts, particularly carbon emissions have intensified. Reducing carbon emissions from livestock is vital for mitigating global warming, enhancing resource utilization efficiency, improving ecosystems and biodiversity, and ultimately achieving sustainable development of the livestock industry. Against this backdrop, this study measures the carbon emissions from livestock sector employing the Life Cycle Assessment (LCA) method, and applies the Generalized Divisia Index Method (GDIM) to analyze the factors affecting the changes in carbon emissions, aiming to quantify and analyze the carbon footprint of China’s livestock sector to inform sustainable practices. The findings reveal that China’s total carbon emissions from the livestock sector fluctuated between 645.15 million tons and 812.99 million tons from 2000 to 2023. Since 2020, emissions have entered a new phase of continuous growth, with a 5.40% increase in 2023 compared to 2020. Significantly, a positive trend toward sustainability is observed in the substantial decline of carbon emission intensity over the study period, with notable reductions in emission intensity across provinces and a gradual convergence in inter-provincial disparities. Understanding the drivers is key for effective mitigation. The output level and total mechanical power consumption level emerged as primary positive drivers of carbon emissions, while output carbon intensity and mechanical power consumption carbon intensity served as major negative drivers. Moving forward, to foster a sustainable and low-carbon livestock sector, China’s livestock sector development should prioritize coordinated carbon reduction across the entire industrial chain, adjust the industrial structure, and enhance the utilization efficiency of advanced low-carbon agricultural machinery while introducing such equipment.

1. Introduction

As a pillar industry in China’s agricultural and rural development, the livestock sector plays a critical role in optimizing the dietary structure of urban and rural residents and promoting rural industrial revitalization. However, with the growth in demand for animal protein nutrition, the consumption of meat, eggs, and dairy products has surged, and production scale has been expanding steadily. Consequently, the environmental pollution issues associated with the livestock sector have become increasingly severe [1]. According to the statistics of the Food and Agriculture Organization of the United Nations (FAO), greenhouse gas (GHG) emissions from the livestock sector account for 12% of anthropogenic GHG emissions globally [2].
LCA has been widely used to measure carbon emissions throughout livestock production systems. Early studies predominantly focused on quantifying carbon emissions at two stages: manure management and enteric fermentation [3,4,5,6]. These studies show that the carbon emissions from China’s livestock husbandry decreased from 2000 to 2020, primarily attributed to reductions in methane emissions from animal enteric fermentation. As research has advanced, the scope of analysis has expanded from the breeding stage to encompass the entire prenatal, production, and postnatal processes of the livestock sector. This broader framework includes six key stages: feed grain planting, feed grain transportation and processing, energy consumption in livestock and poultry breeding, enteric fermentation, manure management, and energy consumption in livestock products’ slaughter and processing [7,8,9,10]. Among these, Dai et al. found that China shows a trend characterized by “high fluctuation rise, precipitous fall, and slow rebound and fall back” from 2000 to 2020 [9]. The results of Liang et al. show a sharp rise in carbon emissions from China’s hog industry in 2021 [11].
The decomposition of the driving factors for carbon emissions has been a focal point in the existing literature. Two primary methodologies are employed: the Logarithmic Mean Divisia Index (LMDI) method [5,12,13,14,15] and the Generalized Divisia Index Method (GDIM) [11,16,17,18]. For instance, Bai et al. utilized LMDI to decompose the drivers of carbon emissions in China’s livestock, finding that economic growth and population scale significantly increased emissions, while emission intensity reduction and industrial structural adjustments exerted inhibitory effects [5]. Since the LMDI method can only consider a single absolute factor during decomposition while neglecting other implicit absolute variables, potentially leading to biased analytical results, Vaninsky optimized the Kaya identity and proposed the GDIM, establishing a multi-dimensional decomposition model that incorporates multiple absolute and relative factors [19]. Although GDIM has been extensively applied in sectors such as transportation and manufacturing for carbon emission factor decomposition, its application in the livestock sector remains limited. Liang et al. employed GDIM to identify pork consumption as the primary factor driving emission increases [11].
A review of the literature reveals that existing studies on China’s livestock sector carbon emissions only extend to 2020, leaving a gap in analyzing post-2020 trends. Influenced by the African Swine Fever (ASF) outbreak, pork production declined, resulting in relatively low meat output in China during 2019 and 2020. However, following the recovery of pork production capacity post-2020, meat production has rapidly increased, reaching a 20-year historical high in 2023. Previous research indicates that China’s livestock sector carbon emissions declined from 2015 to 2019, with a slight rebound in 2020 compared to 2019 [9]. Whether this upward trend will persist post-2020 is a critical issue requiring attention. This study first employs the Life Cycle Assessment framework to categorize the livestock sector’s carbon emission processes into three systems and six stages, comprehensively measuring China’s total livestock sector carbon emissions from 2000 to 2023. Subsequently, the GDIM is applied to analyze the driving factors behind changes in carbon emissions. The objective is to elucidate the evolutionary characteristics of China’s livestock sector carbon emissions from 2000 to 2023, evaluate the intrinsic mechanisms driving emission fluctuations, and provide a reference for formulating and implementing effective carbon reduction policies in China.

2. Materials and Methods

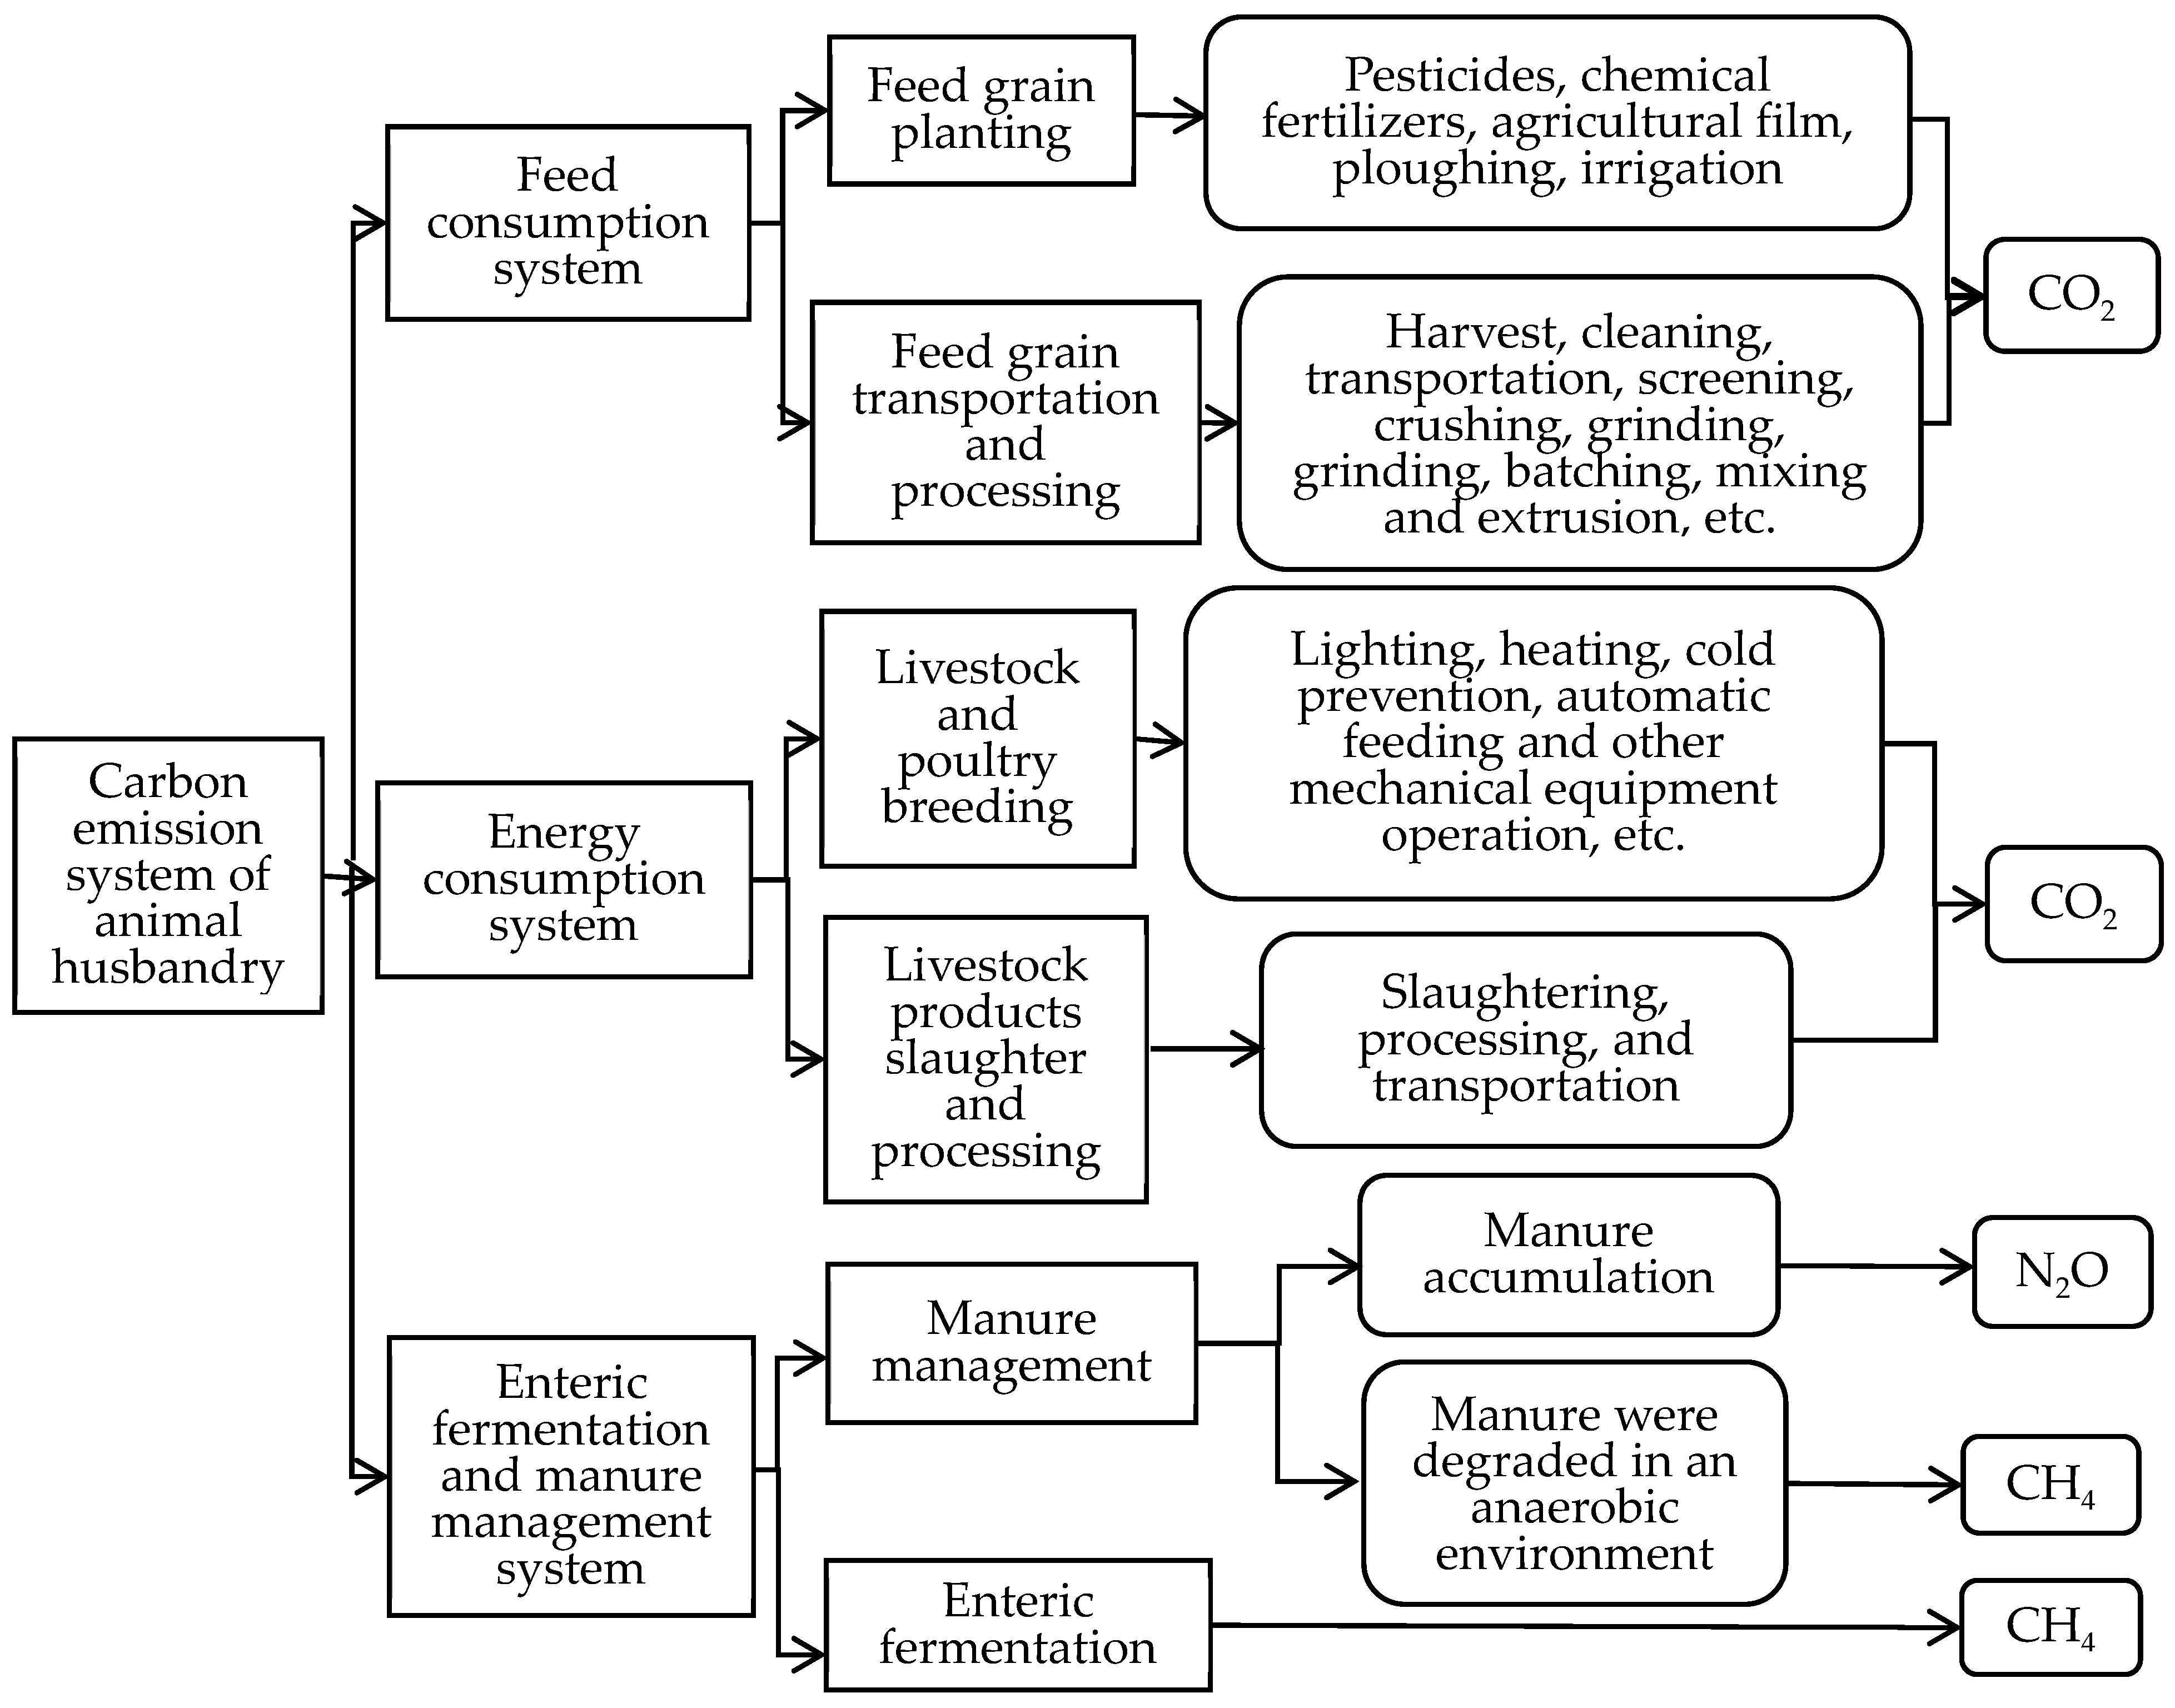
2.1. Life Cycle Assessment (LCA)

The LCA method was first proposed in the 1960s [20], and focuses on analyzing the whole process of the study object from the initial collection of raw materials to the final return to the environment, i.e., from “cradle to grave” [21,22]. The essence of low-carbon livestock is to minimize GHG emissions throughout the production, processing and transport of livestock products. GHG emissions occur throughout the prenatal, production, and postnatal processes of livestock systems. Thus, focusing solely on a single phase of livestock production is insufficient and this needs to be based on the whole process of livestock production [12]. This paper divides the carbon emissions accounting in the livestock sector into three systems; the system boundary is from “cradle to slaughterhouse”, which include six segments, as shown in Figure 1, covering livestock species such as pigs, dairy cows, beef cattle, poultry, sheep, rabbit, horse, donkey, mule, camel, etc.
The calculation of average annual feeding amount (AAF) requires adjustments based on different feeding cycles of species. Dayslive is used to represent the livestock feeding cycle. For Dayslive shorter than one year, the AAF should be adjusted using slaughter volume data. For those Dayslive exceeding one year, the AAF is determined by taking the mean value of year-end inventories from two consecutive years. The specific calculation formulas are as follows:
A A F = Herds , D a y s l i v e 365 D a y s l i v e × N A P A 365 , D a y s l i v e < 365
where Herds is the average of the year-end inventory quantities of two adjacent years and NAPA is the annual slaughter numbers. The Dayslive of pigs, poultry, and rabbits are 200, 55, and 105 days, respectively, with rearing cycles of less than one year [12].

2.1.1. Feed Grain Consumption System

Livestock and poultry concentrate feed is composed of corn, wheat, soybean meal, etc. The proportion of corn, wheat, and soybean in the feed is as follows: corn in swine feed accounted for 56.6%, the soybean cake category accounted for 10.2%; corn in cattle feed accounted for 37%, the soybean cake category accounted for 26%; and corn in sheep feed accounted for 62.61%, and the soybean cake category accounted for 12.89%. The proportion of corn, wheat, and soybean cake type in meat poultry feed is 57%, 5%, and 17%, respectively; the proportion of corn and soybean cake in egg poultry feed is 63.28% and 13.98%, respectively; the proportion of corn in dairy cattle feed is 46.793%, and of soybean cake 28.564% [23]. The calculation formula for carbon emissions is as follows:
T C c z = u = 1 n Q u × S u × q u j × e j 1
T C c y = u = 1 n Q u × S u × q u j × e j 2
where TCcz denotes the carbon emissions resulting from feed grain planting; TCcy signifies the carbon emissions associated with feed grain transportation and processing; Qu represents the annual output of livestock and poultry products species of category u; Su represents the grain consumption coefficient of livestock species of category u; quj represents the proportion of the j-type kind of grain for livestock species of category u; ej1 represents the carbon emission coefficient of feed grain planting of category j; and ej2 represents the carbon emission coefficient of grain transportation and processing of category j.

2.1.2. Energy Consumption System

The energy consumption system comprises two stages: livestock and poultry breeding, and slaughtering and processing of livestock products, and the carbon emission calculation formula is as follows:
T C s c = i = 1 n A A F i × c o s t i e p r i c e e × e f + i = 1 n A A F i × c o s t i c p r i c e c × e c
T C s g = u = 1 n Q u × M J u v × e f
where TCsc stands for the carbon emissions generated by the livestock and poultry breeding; TCsg stands for the carbon emissions generated by the livestock and poultry slaughtering and processing; AAFi represents the average annual feeding amount of category i; costie and costic represent the unit cost of electric power consumption and the unit cost of coal consumption of livestock breeds of category i, respectively; pricee and pricec represent the unit price of electric power and the unit price of coal, respectively; ef stands for the carbon emission coefficient of electricity consumption; ec stands for the carbon emission coefficient of coal consumption; MJu represents the energy consumption coefficient of slaughtering and processing of livestock breeds of category u; v represents the calorific value produced by the unit of electricity consumption.

2.1.3. Enteric Fermentation and Manure Management System

The enteric fermentation and manure management system carbon emission calculation formula is as follows:
T C s w = i = 1 n A A F i × e c i 1
T C m c = i = 1 n A A F i × e c i 2
T C m d = i = 1 n A A F i × e c i 3
where TCsw represents CH4 emissions from enteric fermentation; TCmc represents CH4 emissions from manure management; TCmd represents N2O emissions from manure management; eci1 represents the CH4 emission coefficients of enteric fermentation of livestock breeds of category i; eci2 represents the CH4 emission coefficient of manure management of livestock breeds of category i; eci3 represents the N2O emission coefficient of manure management of livestock species of category i (Table 1).

2.1.4. Total Carbon Emissions

The total carbon emissions is the sum of the three systems mentioned above:
T C t o t a l = T C c z + T C c y + ( T C s w × G W H C H 4 ) + ( T C m c × G W H C H 4 + T C m d × G W H N 2 O ) + T C s c + T C s g
where TCtotal represents the total carbon emission; G W H C H 4 and G W H N 2 O represent the global warming potential of CH4 and the global warming potential of N2O respectively. The carbon emission coefficients of the above systems are shown in Table 2.

2.2. Generalized Divisia Index Method (GDIM)

GDIM is an extension and expansion of the LMDI method. The LMDI method decomposes variables using a multiplication method, where the proportions of each factor are multiplied to determine the overall change, thus it can only handle a single absolute quantity indicator. In contrast, GDIM enables the quantitative analysis of the influence contributions from multiple factors (such as structural effects, intensity effects, technological effects, scale effects, etc.) on changes in multiple target indicators (e.g., total energy consumption, total carbon emissions, total pollutant emissions). Crucially, GDIM accommodates more complex functional relationships both between the factors themselves and between the factors and the multiple dependent variables.
This paper, based on the GDIM, decomposes the driving factors of carbon emission changes, selecting livestock sector output value (GDP), total mechanical power level in the livestock sector (TMP), and population size (Pop) to construct a multi-dimensional factor decomposition model. The decomposition formula is as follows:
C A = G D P × C A G D P = T M P × C A T M P = P o p × C A P o p = G D P × G C I = T M P × T C I = P o p × P C I
G D P / P o p = ( C A / P o p ) / ( C A / G D P ) = P C I / G C I
T M P / G D P = ( C A / G D P ) / ( C A / T M P ) = G C I / T C I
In the above calculation process, CA represents the total carbon emissions. The formula includes three absolute quantity factors and five relative quantity factors. The three absolute quantity factors are GDP, TMP, and Pop, where GDP represents the livestock sector output level, indicated by the livestock sector output value; TMP represents the total mechanical power consumption level in the livestock sector (since the data on the total mechanical power level in the livestock sector is not publicly available, we refer to the method of Yang et al. [26], using the product of the total mechanical power level in agriculture, forestry, animal husbandry, and fishery and the proportion of the total livestock industry output value to the total output value of agriculture, forestry, animal husbandry, and fishery to represent the total mechanical power level in China’s livestock sector); Pop represents the population scale, indicated by the year-end population number. The five relative quantity factors are GCI, TCI, PCI, PG, and GTI, where GCI = CA/GDP represents the output carbon intensity; TCI = CA/TMP represents the mechanical power consumption carbon intensity; PCI = CA/Pop represents the per capita carbon emissions; PG = GDP/Pop represents the per capita livestock sector output value; GTI = TMP/GDP represents the mechanical power consumption intensity. To eliminate the effects of inflation, the livestock sector output value has been deflated using a price index with the base year of 2000.
For further application of GDIM, Equations (10)–(12) are converted into the following form:
C A = G D P × C A / G D P
G D P × G C I T M P × T C I = 0
G D P × G C I P o p × P C I = 0
G D P P o p × P G = 0
T M P G D P × G T I = 0
The contribution of factor X to the change in carbon emissions is denoted as CA(X). The vector differential calculation and Jacobian matrix formulation for CA(X) are defined as follows:
C A = ( G C I , G D P , 0 , 0 , 0 , 0 , 0 , 0 ) T
Φ x = G C I G C I G D P G D P E C I 0 T M P 0 0 P C I 0 P o p 0 0 0 0 1 G E I 0 0 0 1 0 0 P G 0 0 0 P o p 0 0 G D P T
The total carbon emission variation ∆CA can be decomposed into the summation of contributions from the eight factors, expressed as follows:
C A [ X / Φ ] = L C A T ( I Φ x Φ x + ) d x
where L is the time span, I denotes the unit matrix, and the superscript “+” represents the generalized inverse matrix. If the Jacobian matrix ( Φ x ) has linearly independent columns, then Φ x + = ( Φ x T Φ x ) 1 Φ x T .
The changes in ∆CA are broken down into the combination of eight factors, i.e., three absolute quantitative factors, including impact of changes in the scale of livestock sector output (∆GDP), impact of changes in the total mechanical power level in livestock production (∆TMP), and impact of changes in population size (ΔPop). Five relative quantitative indicators are ΔGCI, ΔTCI, ΔPCI, ΔPG, ΔGTI, representing the changes of livestock sector carbon emissions caused by carbon intensity of livestock output, carbon intensity of mechanical power, per capita carbon emissions, per capita livestock output, and machinery utilization efficiency, respectively. The economic development of the livestock sector inevitably drives output expansion and increased livestock mechanization, which leads to an increase in carbon emissions from the livestock sector. However, focusing solely on absolute quantitative factors (e.g., GDP, TMP, Pop) may yield incomplete conclusions, Previous studies have demonstrated that output carbon intensity is a critical factor influencing China’s carbon emissions [27,28]. Therefore, analyzing the aforementioned five relative indicators holds significant research value.

3. Results

3.1. Livestock Sector Carbon Emission Measurement Results

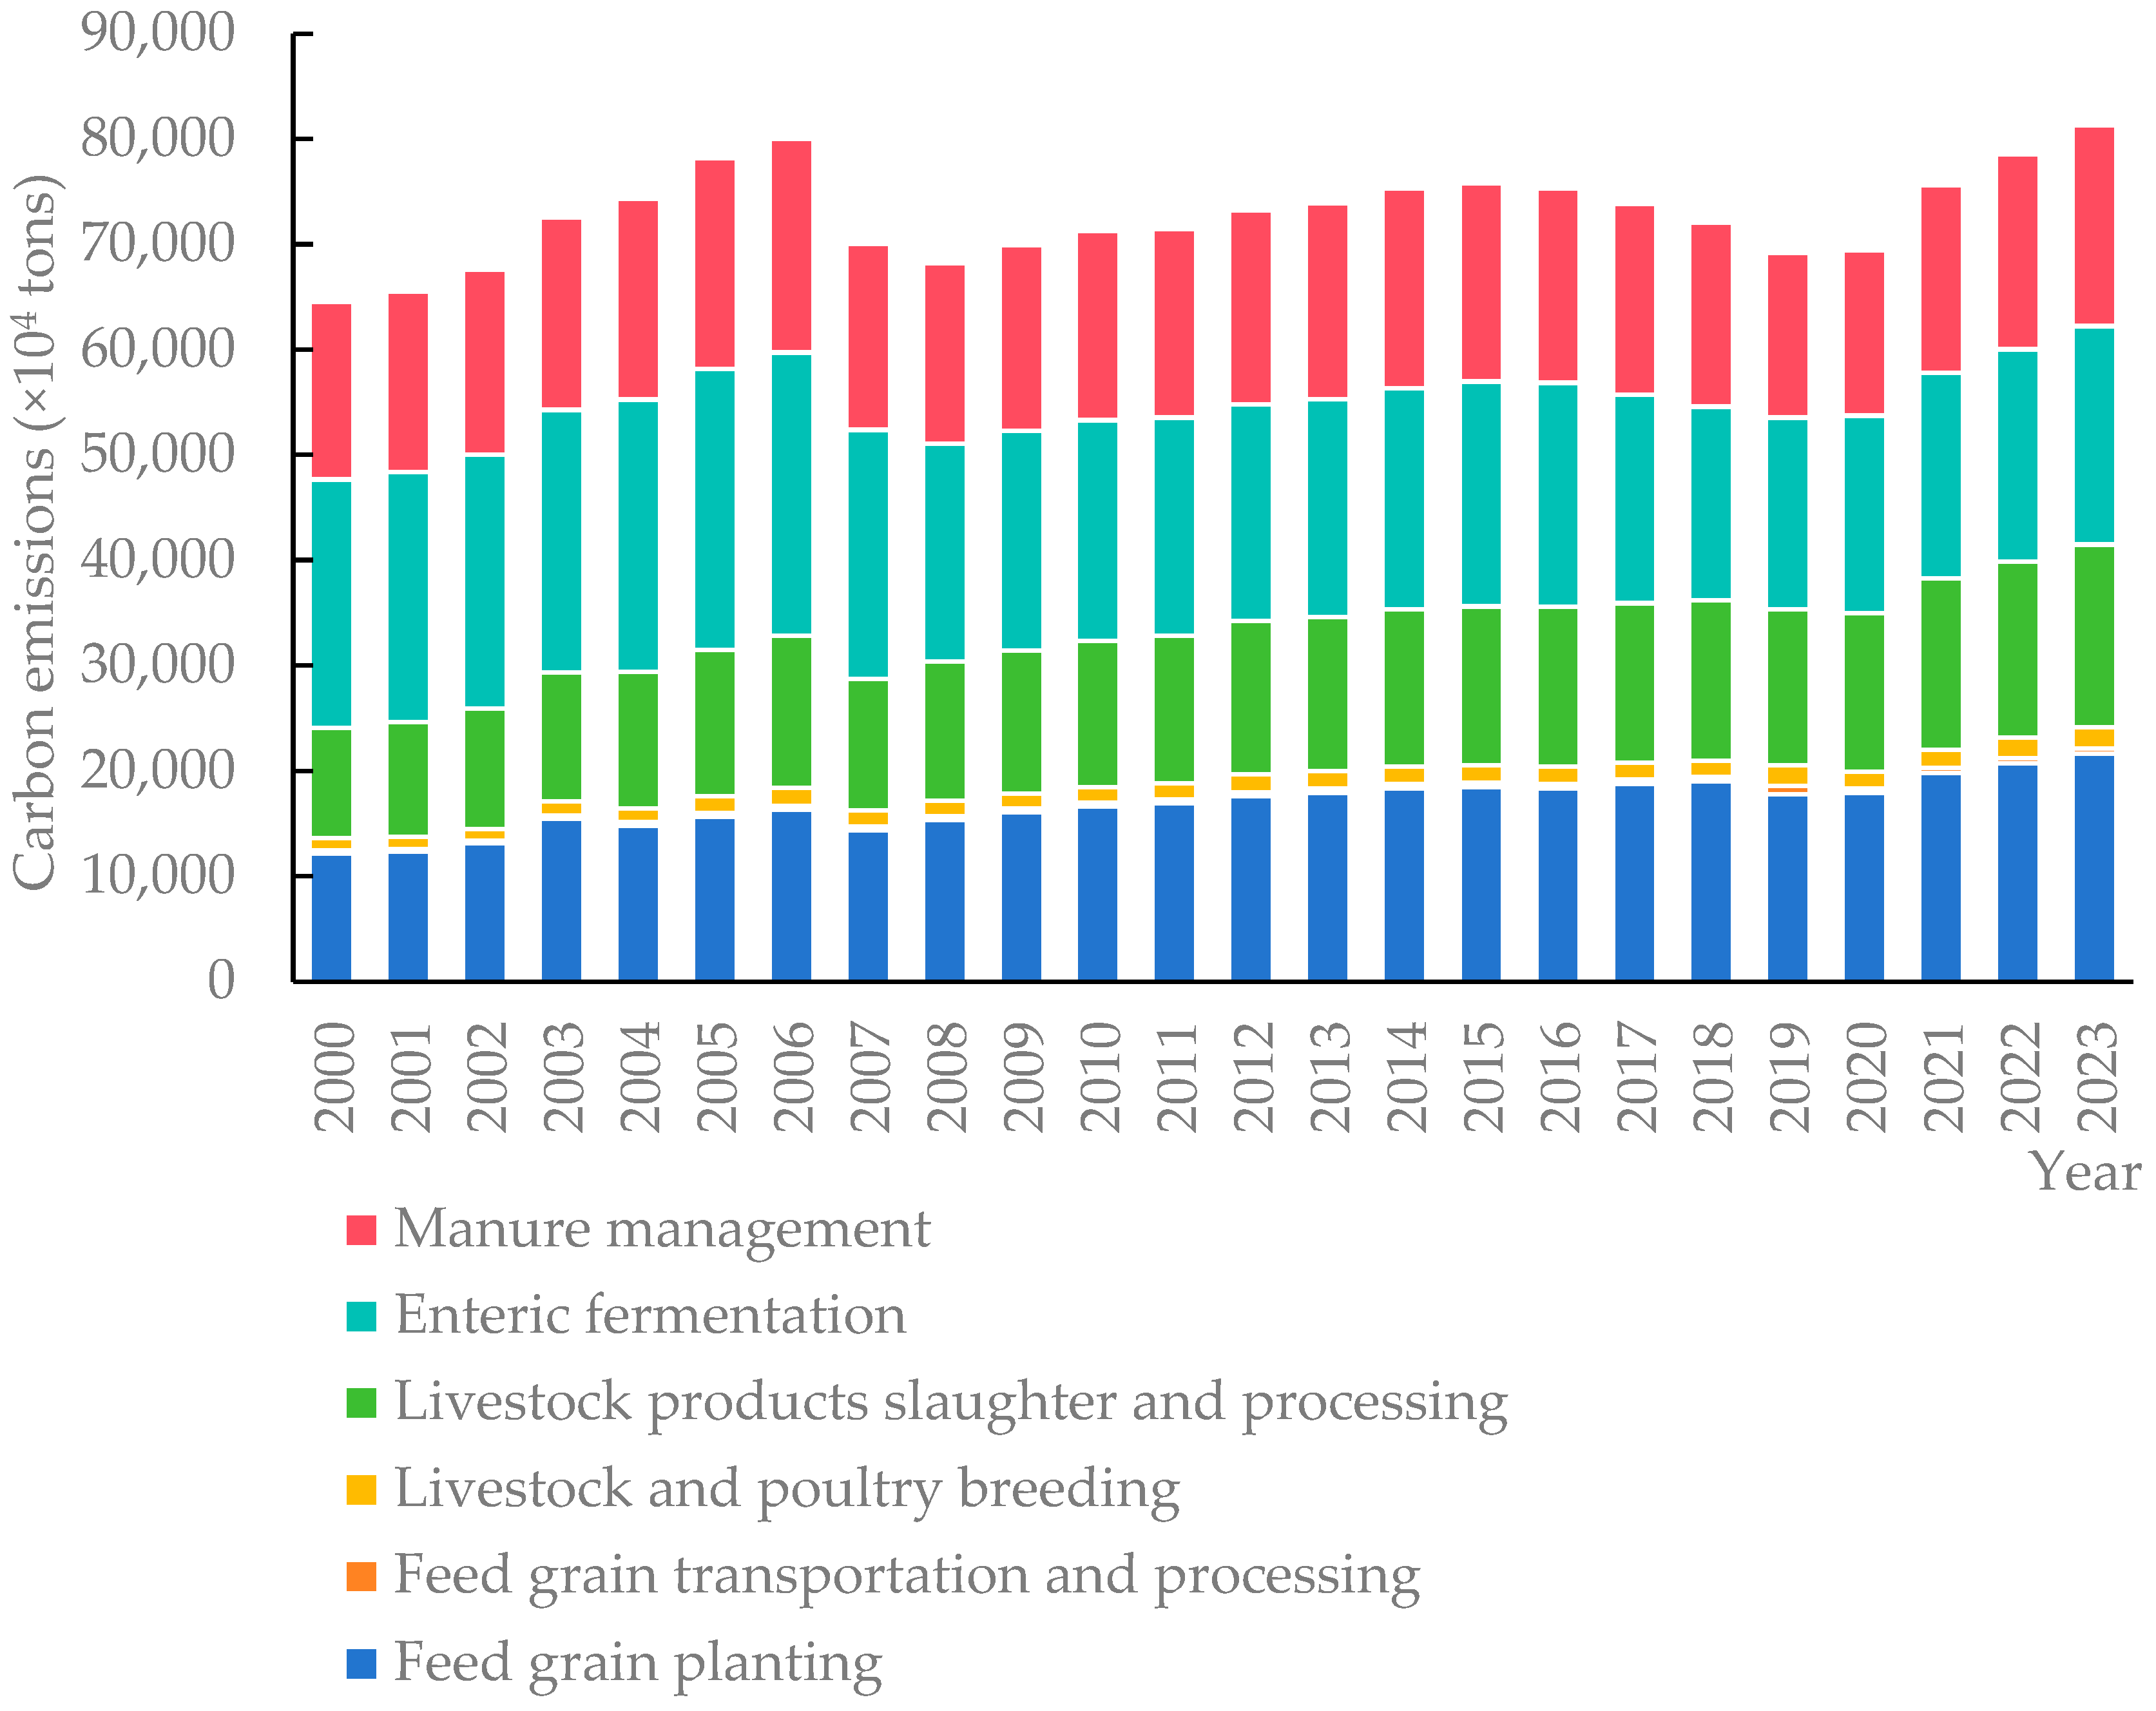
3.1.1. Evolutionary Trends in Total Carbon Emissions from Livestock Sector

Using the above-mentioned carbon emission measurement method, the total carbon emissions from the livestock sector in China and each province (municipalities directly under the central government and autonomous regions) were calculated from 2000 to 2023. The measurement results are presented in Figure 2.
From 2000 to 2023, carbon emissions showed a trend of “rapid increase–significant decline followed by slow increase–slow decline–rapid increase”. It can be roughly divided into four stages.
The first stage (2000 to 2006): Carbon emissions increased significantly, with an annual growth rate of 3.66%. This stage coincided with the period of adjustment of China’s agricultural industrial structure. In 2001, the Ministry of Agriculture issued its Opinions on Accelerating the Development of Livestock and Poultry Industry, which emphasized the need to rapidly develop the livestock sector, effectively converting grain and other by-products, and promoting strategic adjustments to the agricultural structure. This trend is mainly about the rapid growth of the livestock sector, leading to a significant increase in the number of livestock raised.
The second stage (2007 to 2015): In 2007, the global food crisis broke out, leading to a sharp decline in global grain reserves. As a result, the number of grain-consuming livestock species decreased dramatically, and the corresponding livestock product output also declined significantly, leading to a sharp decline in livestock sector carbon emissions in 2007. After 2007, the emissions showed a small fluctuation and a slight upward trend, with an annual growth rate of 1.00% from 2007 to 2015. During this stage, the number of pigs raised recovered and increased, driving the growth of livestock sector carbon emissions.
The third stage (2016 to 2019): Livestock sector carbon emissions continued to decline. This stage was characterized by a shift towards green development, with a focus on solving the problem of livestock manure pollution. Many small-scale breeding farms were forced to close due to environmental pressures, and the impact of the ASF outbreak in 2018 led to significant fluctuations in pig farming. As a result, the decline in livestock sector carbon emissions was more pronounced.
The fourth stage (2020 to 2023): Livestock sector carbon emissions entered a new phase of rapid increase. In this stage, the production of meat increased significantly, leading to an increase in carbon emissions, with an annual growth rate of 5.40%.

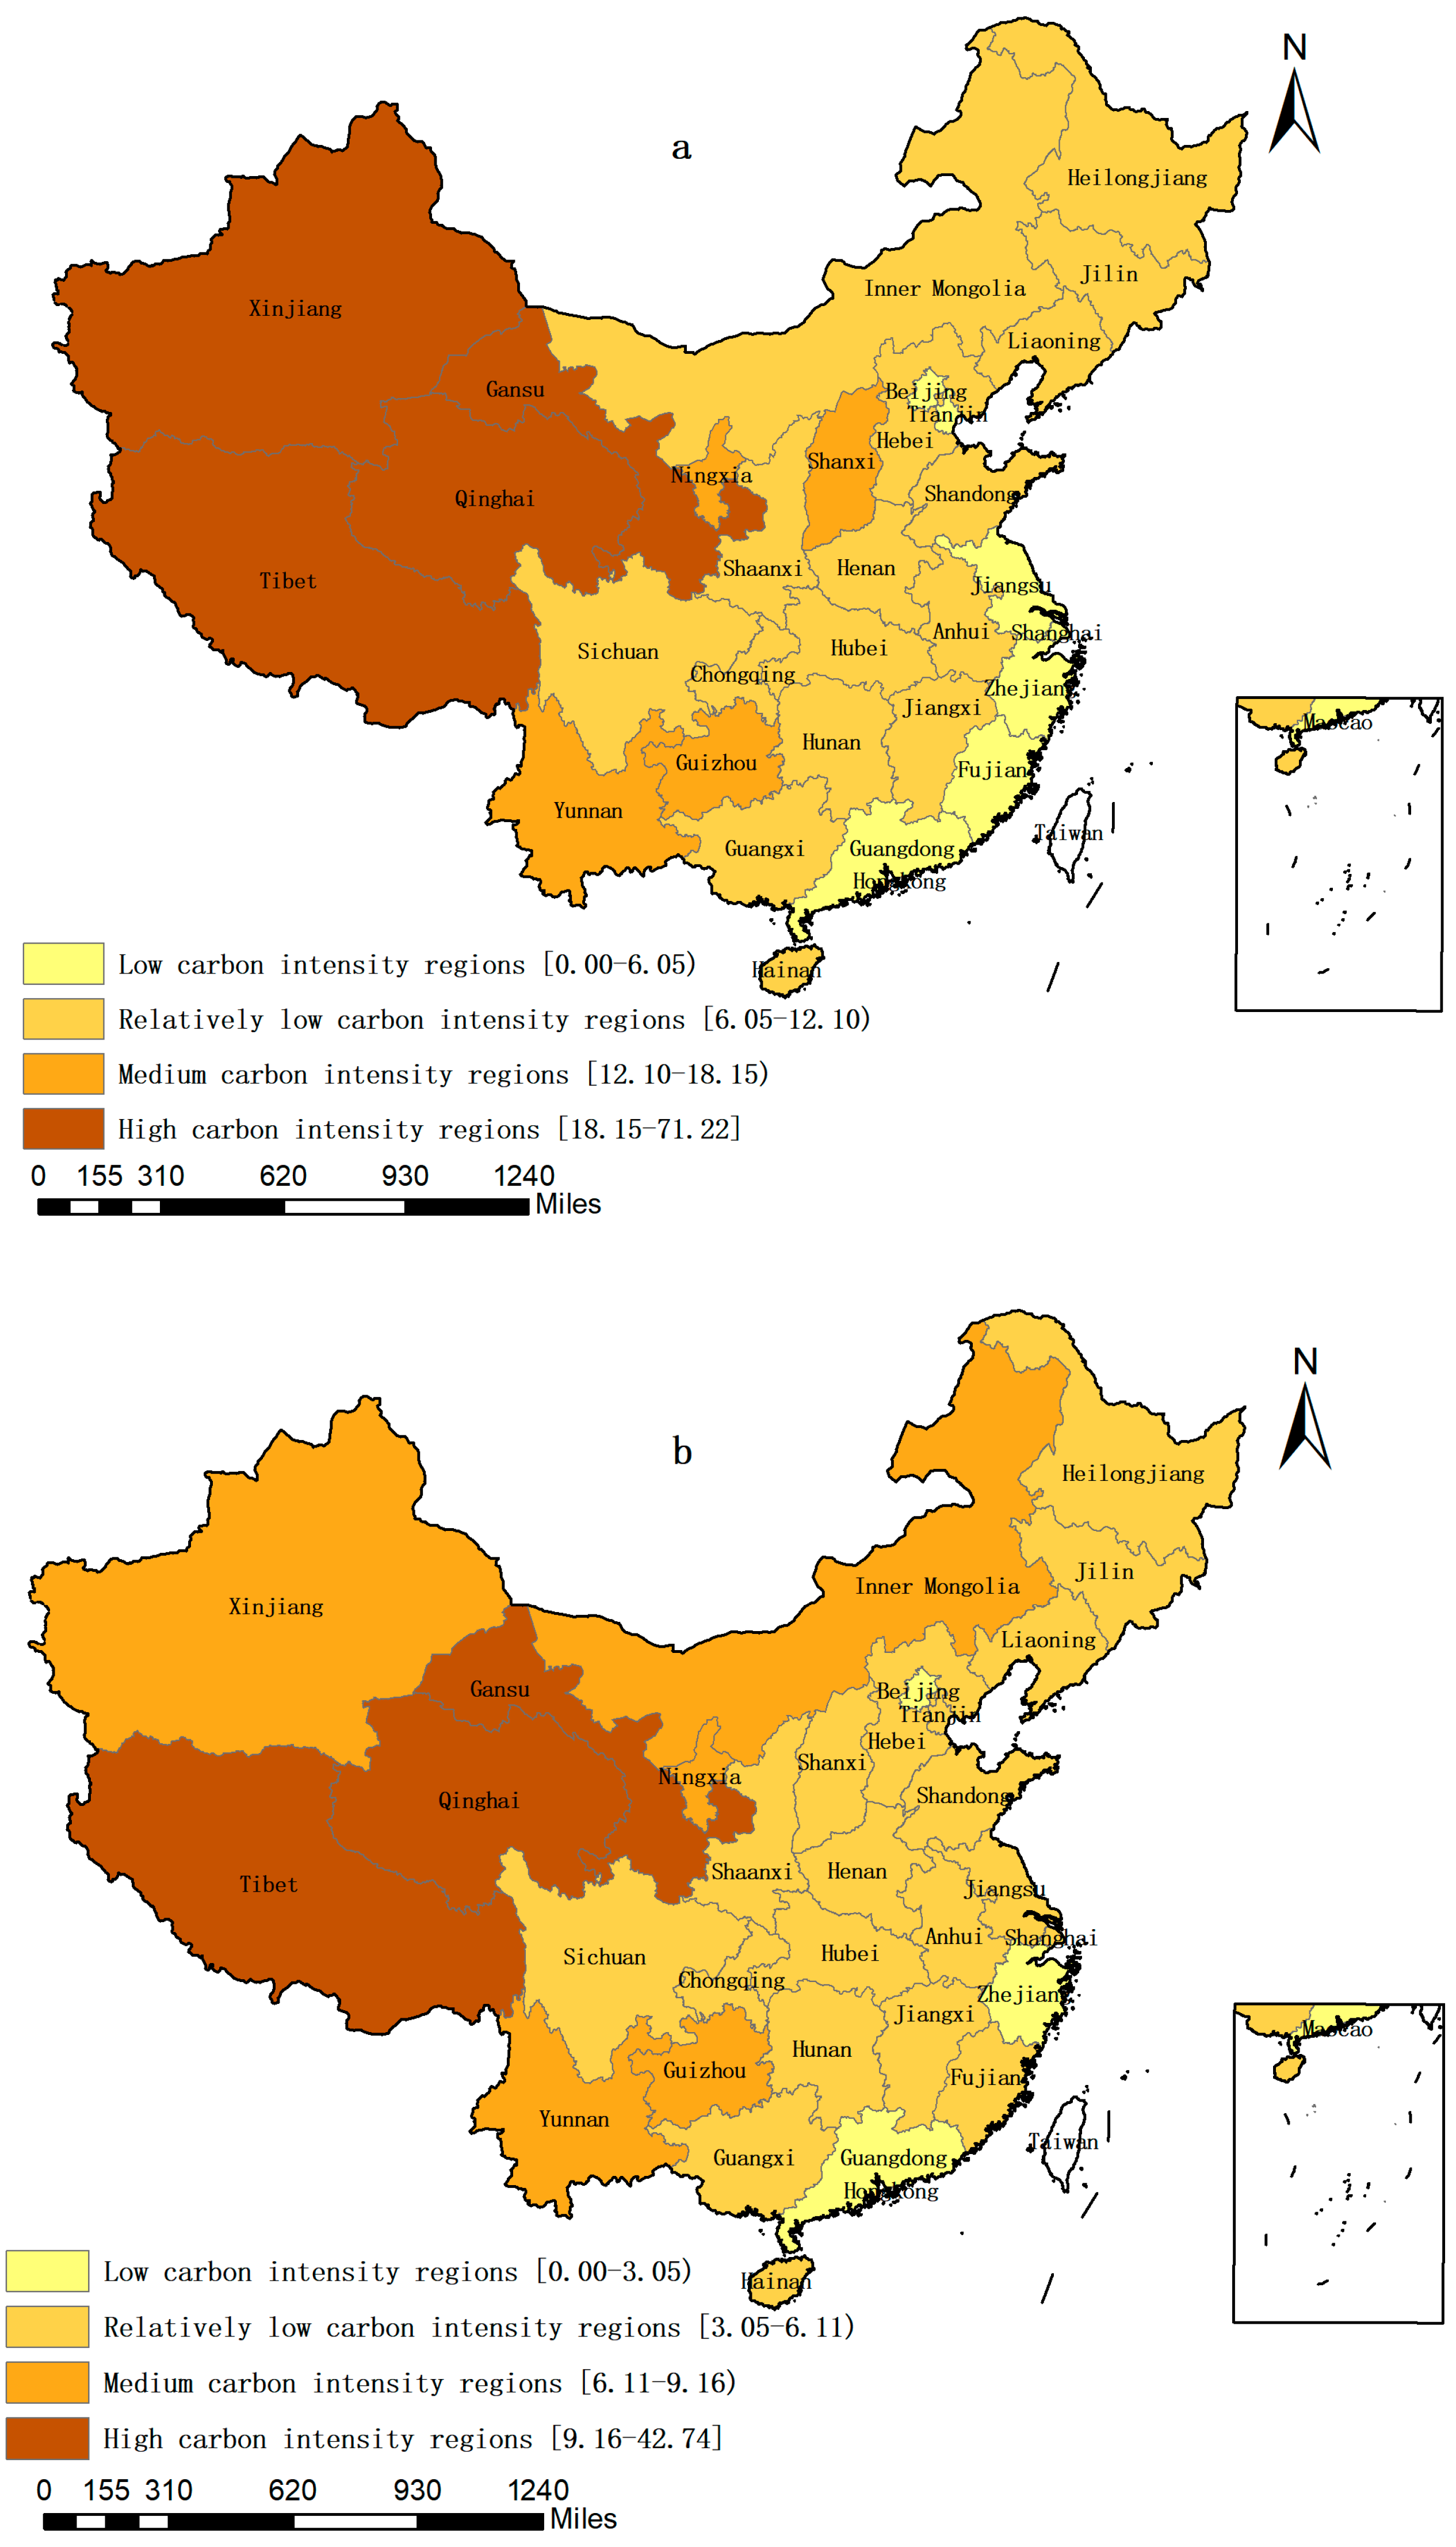
3.1.2. Spatial Characteristics of Livestock Sector Carbon Emissions

From a spatial perspective, the top 10 provinces with the highest average annual carbon emissions from 2000 to 2023 were Henan, Shandong, Sichuan, Hebei, Inner Mongolia, Hunan, Yunnan, Liaoning, Hubei, and Heilongjiang. The bottom 10 provinces were Shanghai, Beijing, Tianjin, Hainan, Ningxia, Zhejiang, Fujian, Shanxi, Chongqing, and Shaanxi. By comparing the rankings of carbon emissions from each province from 2000 to 2023, it was found that Henan, Shandong, Sichuan, and Hebei consistently ranked among the top four. In 2020, Shandong surpassed Henan to become the province with the highest carbon emissions from the livestock sector. In terms of the trend in carbon emissions for each province from 2000 to 2023, Beijing, Shanghai, Zhejiang, Henan, and Hainan showed a decline, while the remaining provinces showed an upward trend. Beijing and Shanghai had the largest decline, with Beijing dropping by 74.31% and Shanghai falling by 68.87%. The significant decline in carbon emissions from Beijing and Shanghai is related to the process of urbanization. Ningxia, Inner Mongolia, Liaoning, Gansu, and Xinjiang showed a significant increase in carbon emissions, with an increase of 236.46% in Ningxia and an increase of 105.97% in Inner Mongolia.
In addition to analyzing the carbon emissions from each province, it is also beneficial to examine the carbon emissions per unit of livestock sector output value (hereinafter referred to as carbon intensity), which can help reveal the low-carbon level of livestock development more clearly. The calculation formula for provincial carbon emission intensity is defined as the total carbon emissions of each province divided by its gross output value for animal husbandry. A lower carbon intensity indicates a higher level of low-carbon development. From the perspective of carbon intensity, the carbon intensity of each province in China showed a downward trend from 2000 to 2023, indicating that the resource utilization efficiency has been significantly improved, and the level of low-carbon development in China’s livestock sector has been improved over the past two decades. In 2023, the provinces with the highest carbon intensity were Tibet, Qinghai, Gansu, Ningxia, and Xinjiang, which are mainly grassland pastoral regions; the provinces with the lowest carbon intensity were Hainan, Fujian, Guangdong, Shaanxi, and Hubei. From 2000 to 2023, Tibet and Qinghai showed a relatively fast decline in carbon intensity, the rough grazing mode in the pastoral areas has been significantly improved, and the control of China’s grazing policy has been effectively implemented.
To ensure the comparability of carbon intensity among provinces, this paper refers to the method of Yao et al. [8] and divides the carbon intensity into four categories: low, relatively low, medium, and high carbon intensity regions, using 0.5, 1.0, and 1.5 times the average carbon intensity of each province as the dividing standard. The results show that, in 2023, the regional differences in carbon intensity are small; except for Tibet and Qinghai, which are high-carbon intensity regions, most regions are relatively low-carbon intensity regions (Figure 3).

3.1.3. Comparative Analysis of Carbon Emissions from Different System Boundaries

From the perspective of different systems, the carbon emissions from the enteric fermentation and manure management system have been gradually decreasing from 2000 to 2023, with an annual growth rate of −0.07%, while those from feed consumption and energy consumption systems have been increasing, with the growth rate of feed consumption system being the largest, with feed consumption systems at 2.53% per year and energy consumption systems at 2.25% per year.
From 2000 to 2023, the proportion of carbon emissions from enteric fermentation and manure management system has been decreasing, while that from feed consumption and energy consumption systems has been increasing. In 2000, the proportion of enteric fermentation and manure management system was the largest, accounting for 62.70%. Before 2018, the proportion for this system remained above 50%, but after 2018 it gradually decreased to below 50%, reaching 48.97% in 2023. In contrast, from 2000 to 2023, the proportion for the feed consumption and energy consumption systems increased from 19.29% and 18.01% to 27.21% and 23.82%, respectively (Figure 2).

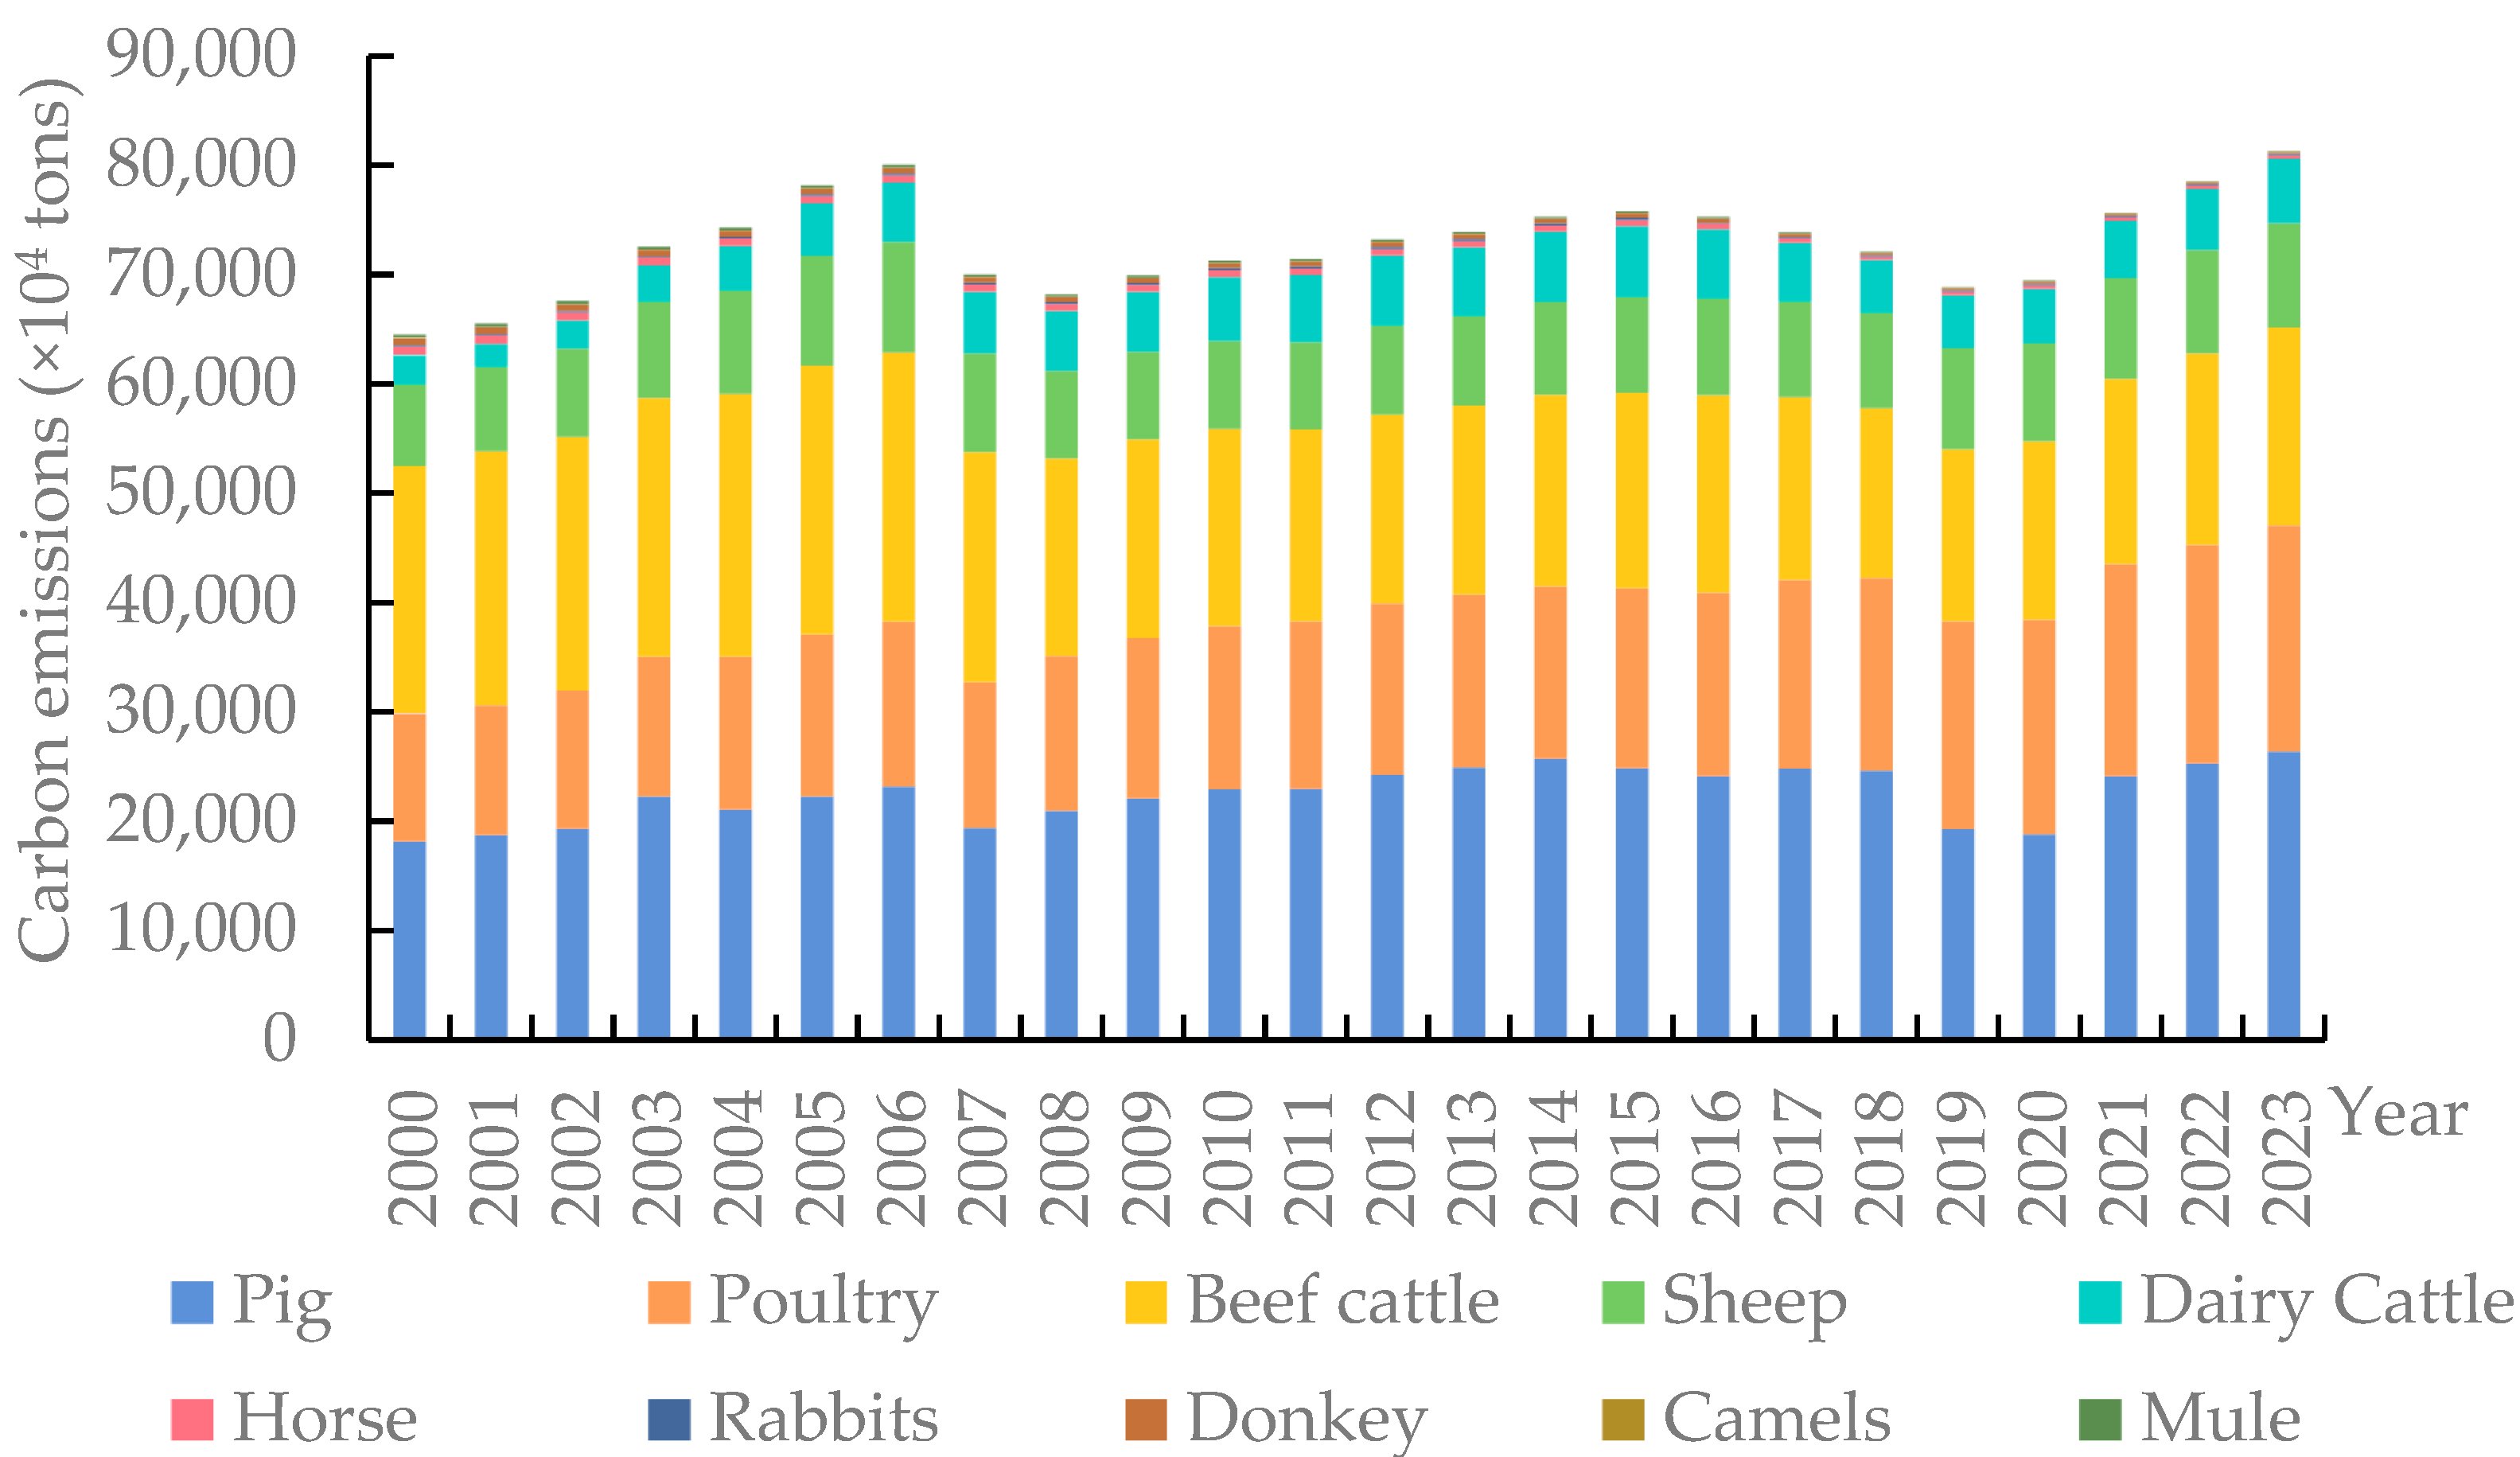
3.1.4. Comparative Analysis from Different Livestock Species

The carbon emission from pigs, sheep, and dairy cows have been showing a significantly increasing trend from 2000 to 2023, while those from beef cattle have been decreasing. From 2000 to 2007, beef cattle were the largest source of carbon emissions in China’s livestock sector. However, from 2008 onwards, pigs surpassed beef cattle as the largest source of carbon emissions. Until the outbreak of ASF in 2018, which led to a significant decrease in pig meat production, the carbon emissions of pig decreased significantly in 2019, and poultry became the largest source. From 2021 to 2023, pork supply recovered, and pig carbon emissions increased, making pig the largest source. In 2023, carbon emissions from pigs, poultry, and beef cattle accounted for 32.43%, 25.47%, and 22.25% of the total, respectively, while emissions from horses, donkeys, mules, camels, and rabbits were relatively minimal, accounting for less than 1% (Figure 4). The main consumption of meat in China is of pork and poultry, which determines that pigs and poultry produce large carbon emissions. First, pigs and poultry are grain-consuming species, which produces a large amount of carbon in the feed consumption phase. Second, pigs belong to the category of monogastric animals, which produces a large amount of carbon emissions in the manure management phase, accounting for 50% of the total carbon emissions from manure management. Cattle and sheep are ruminant livestock, which produce a large amount of methane in the enteric fermentation stage, accounting for 90% from enteric fermentation, with cattle accounting for more than 60%. Poultry has zero carbon emissions in the enteric fermentation phase, but produces a large amount in the poultry egg processing and transportation phase.

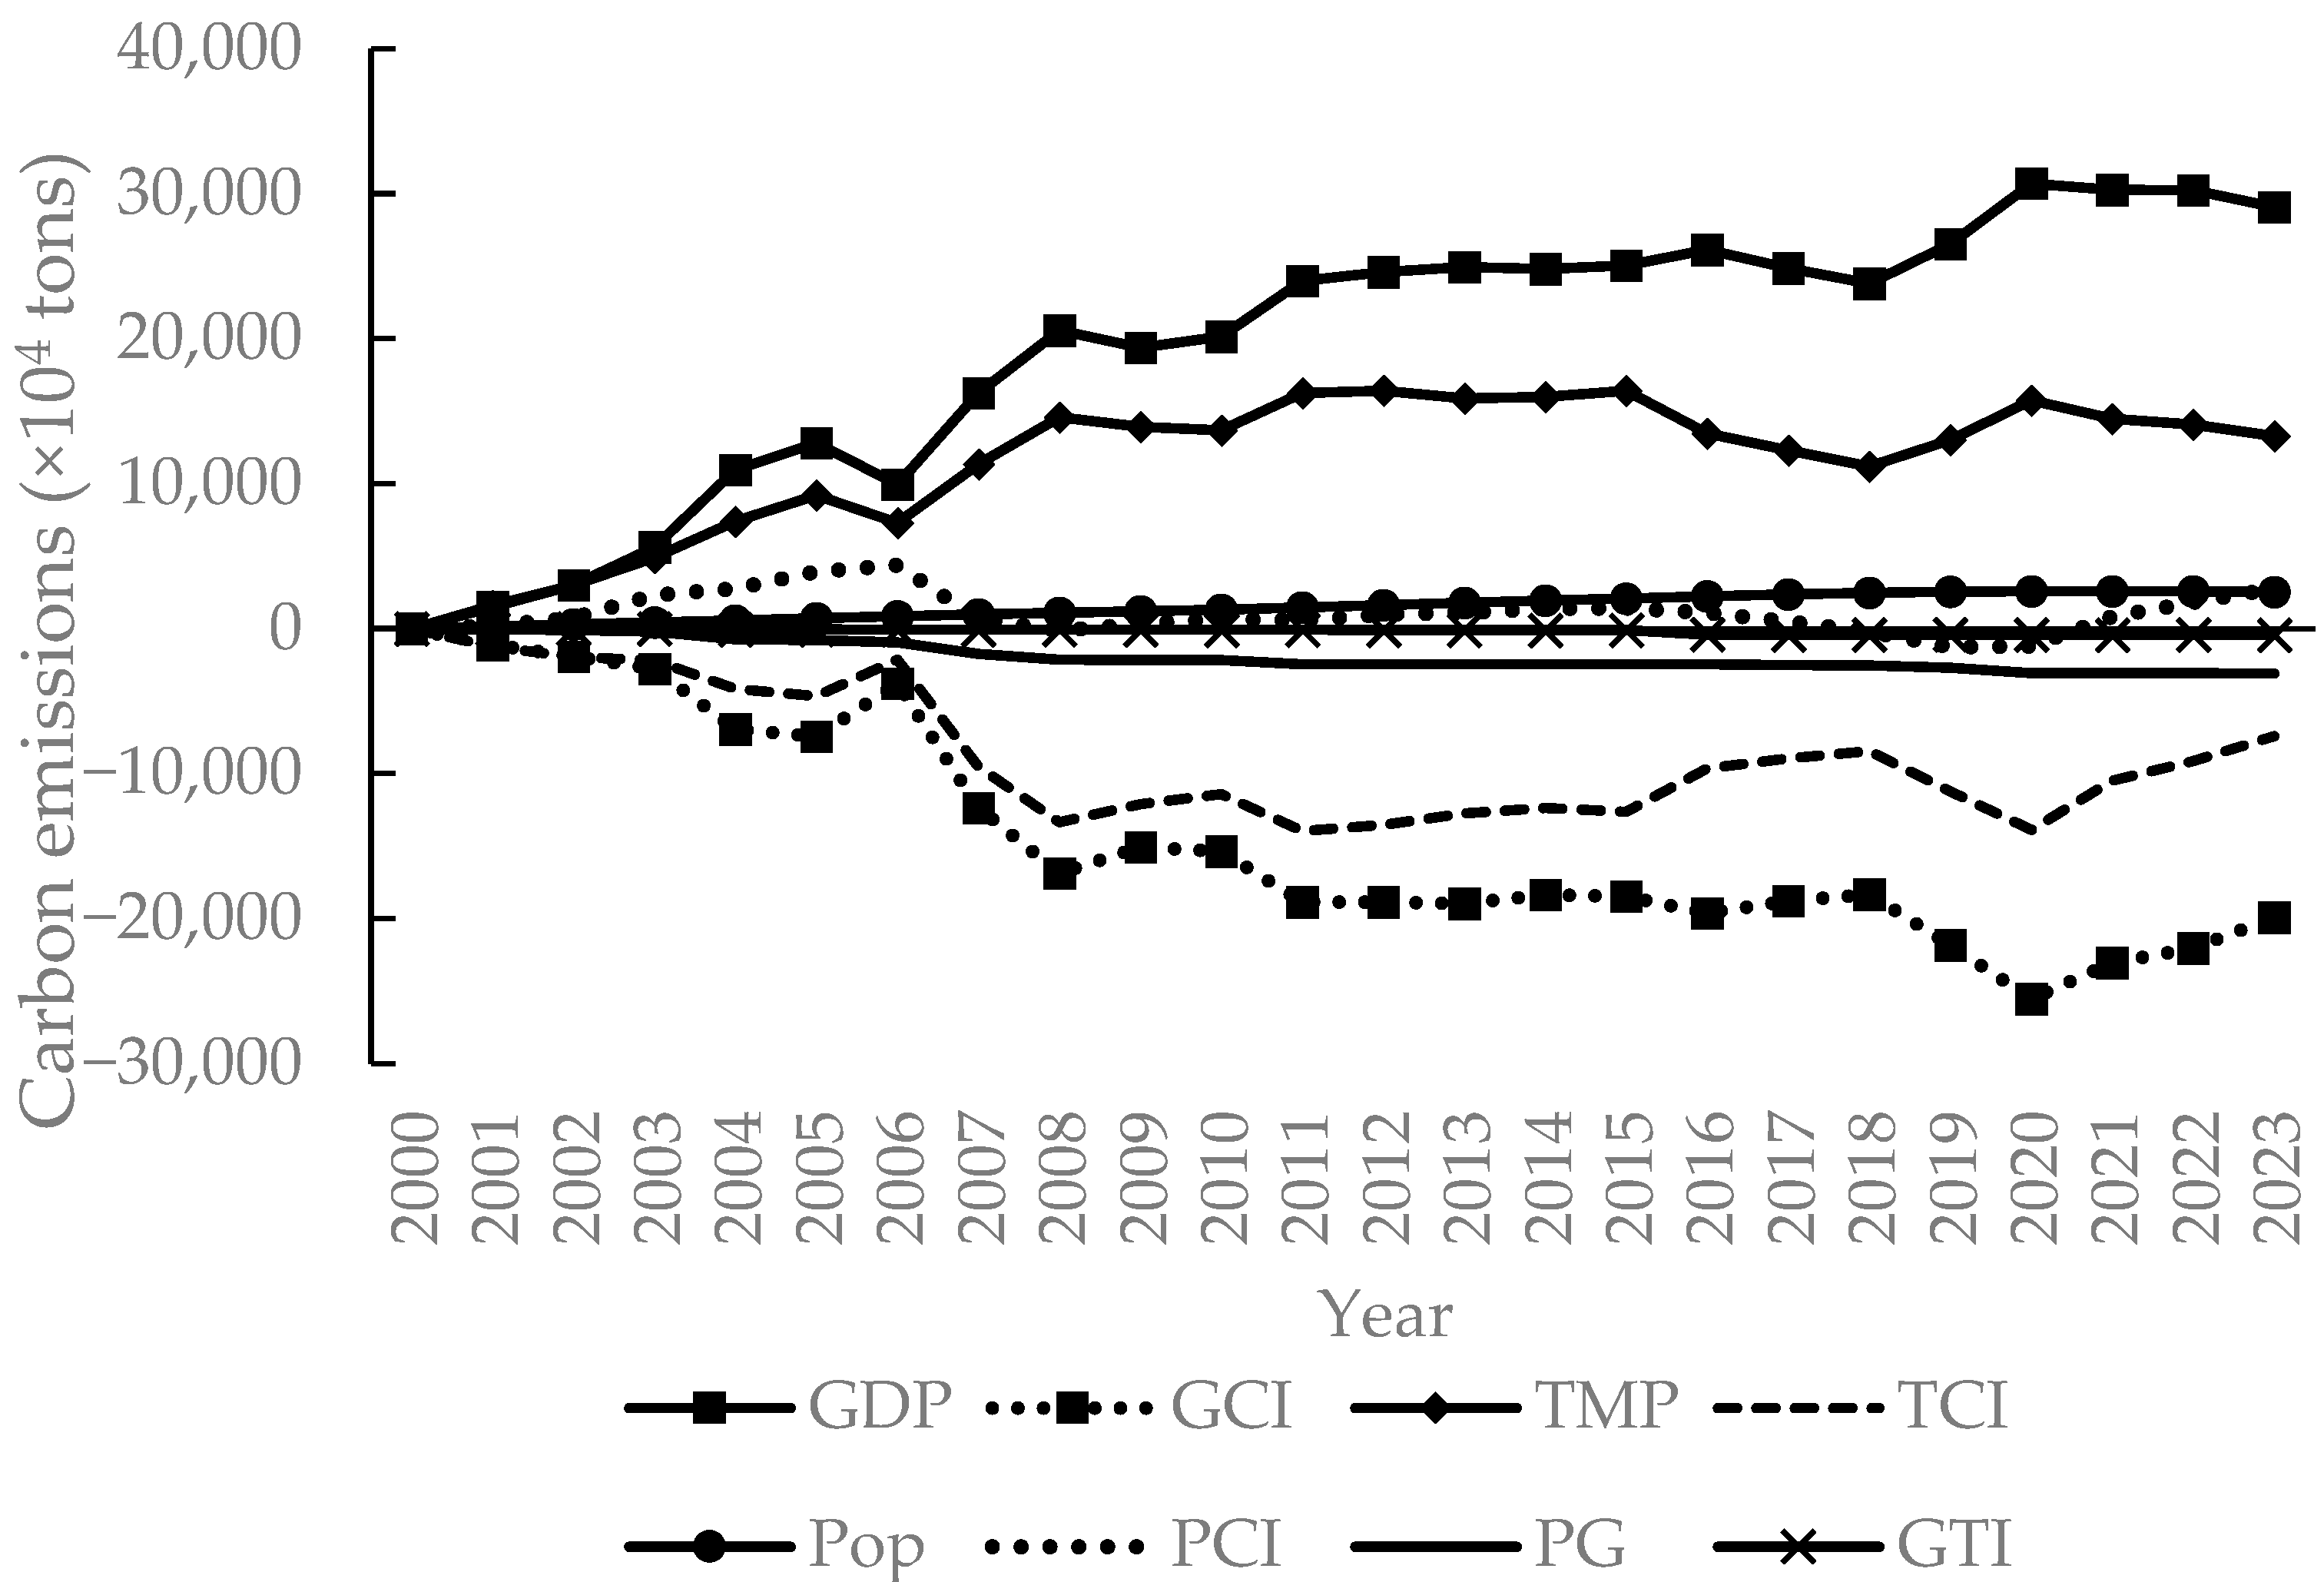
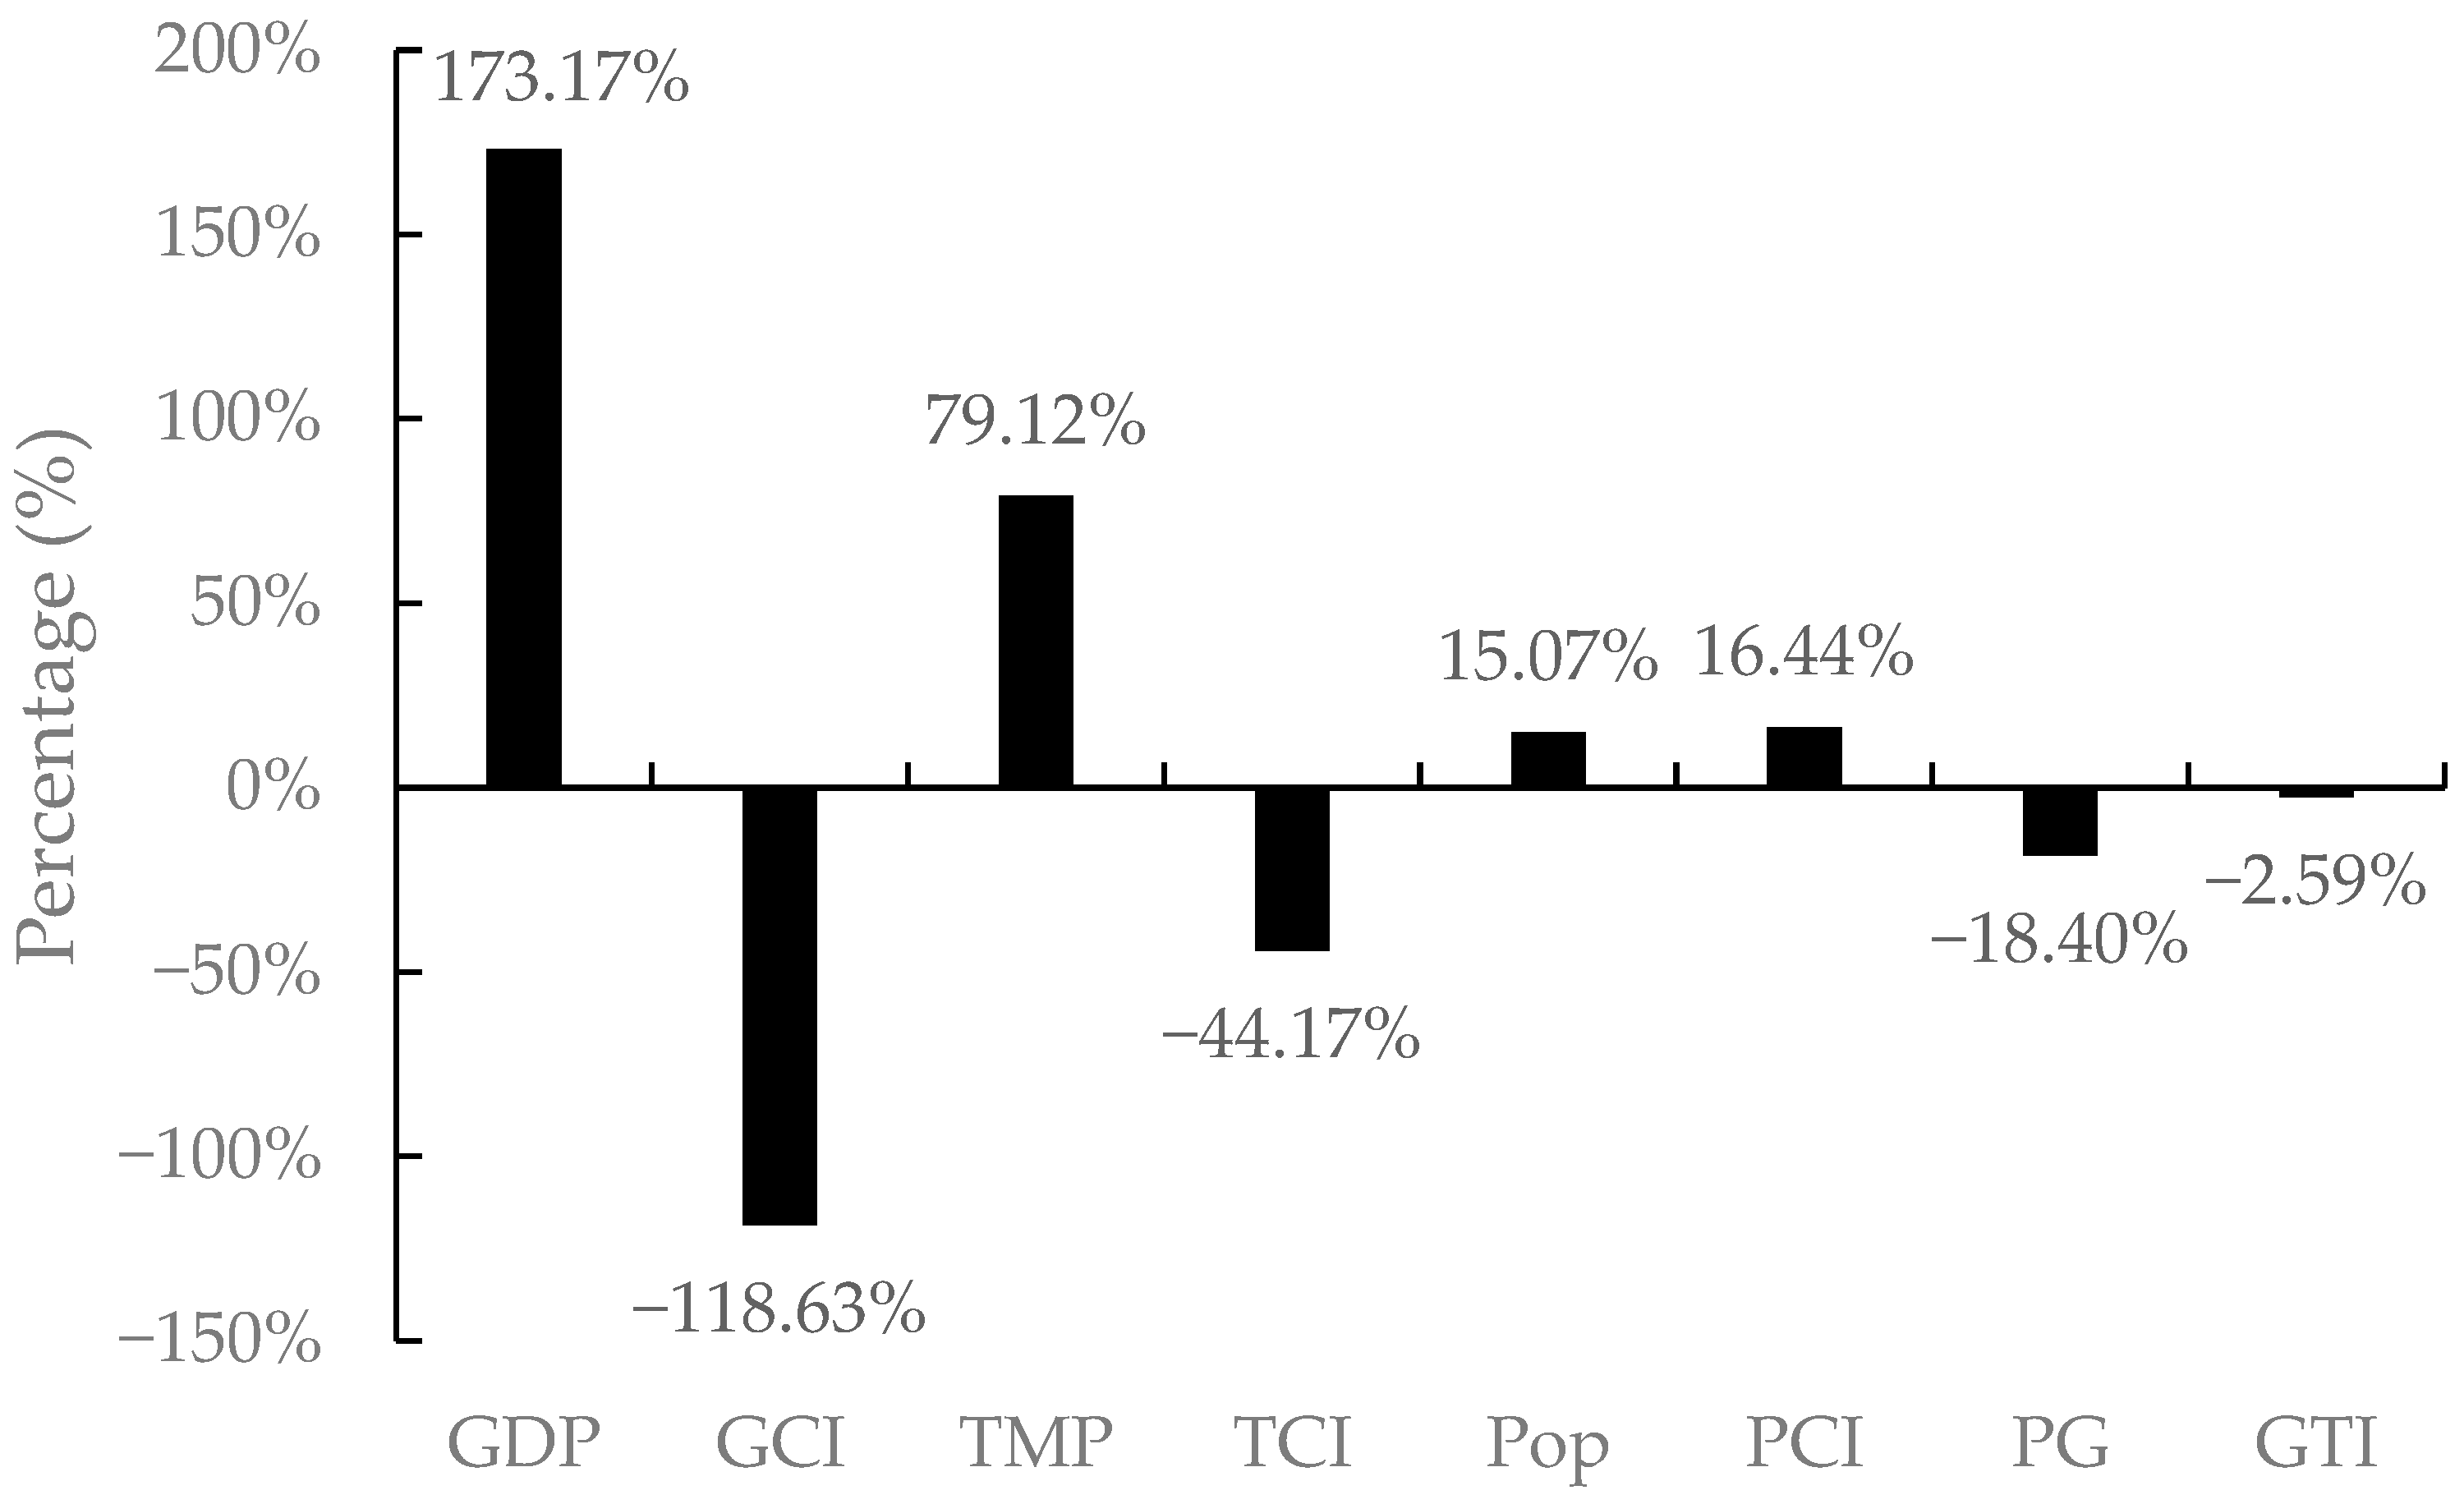
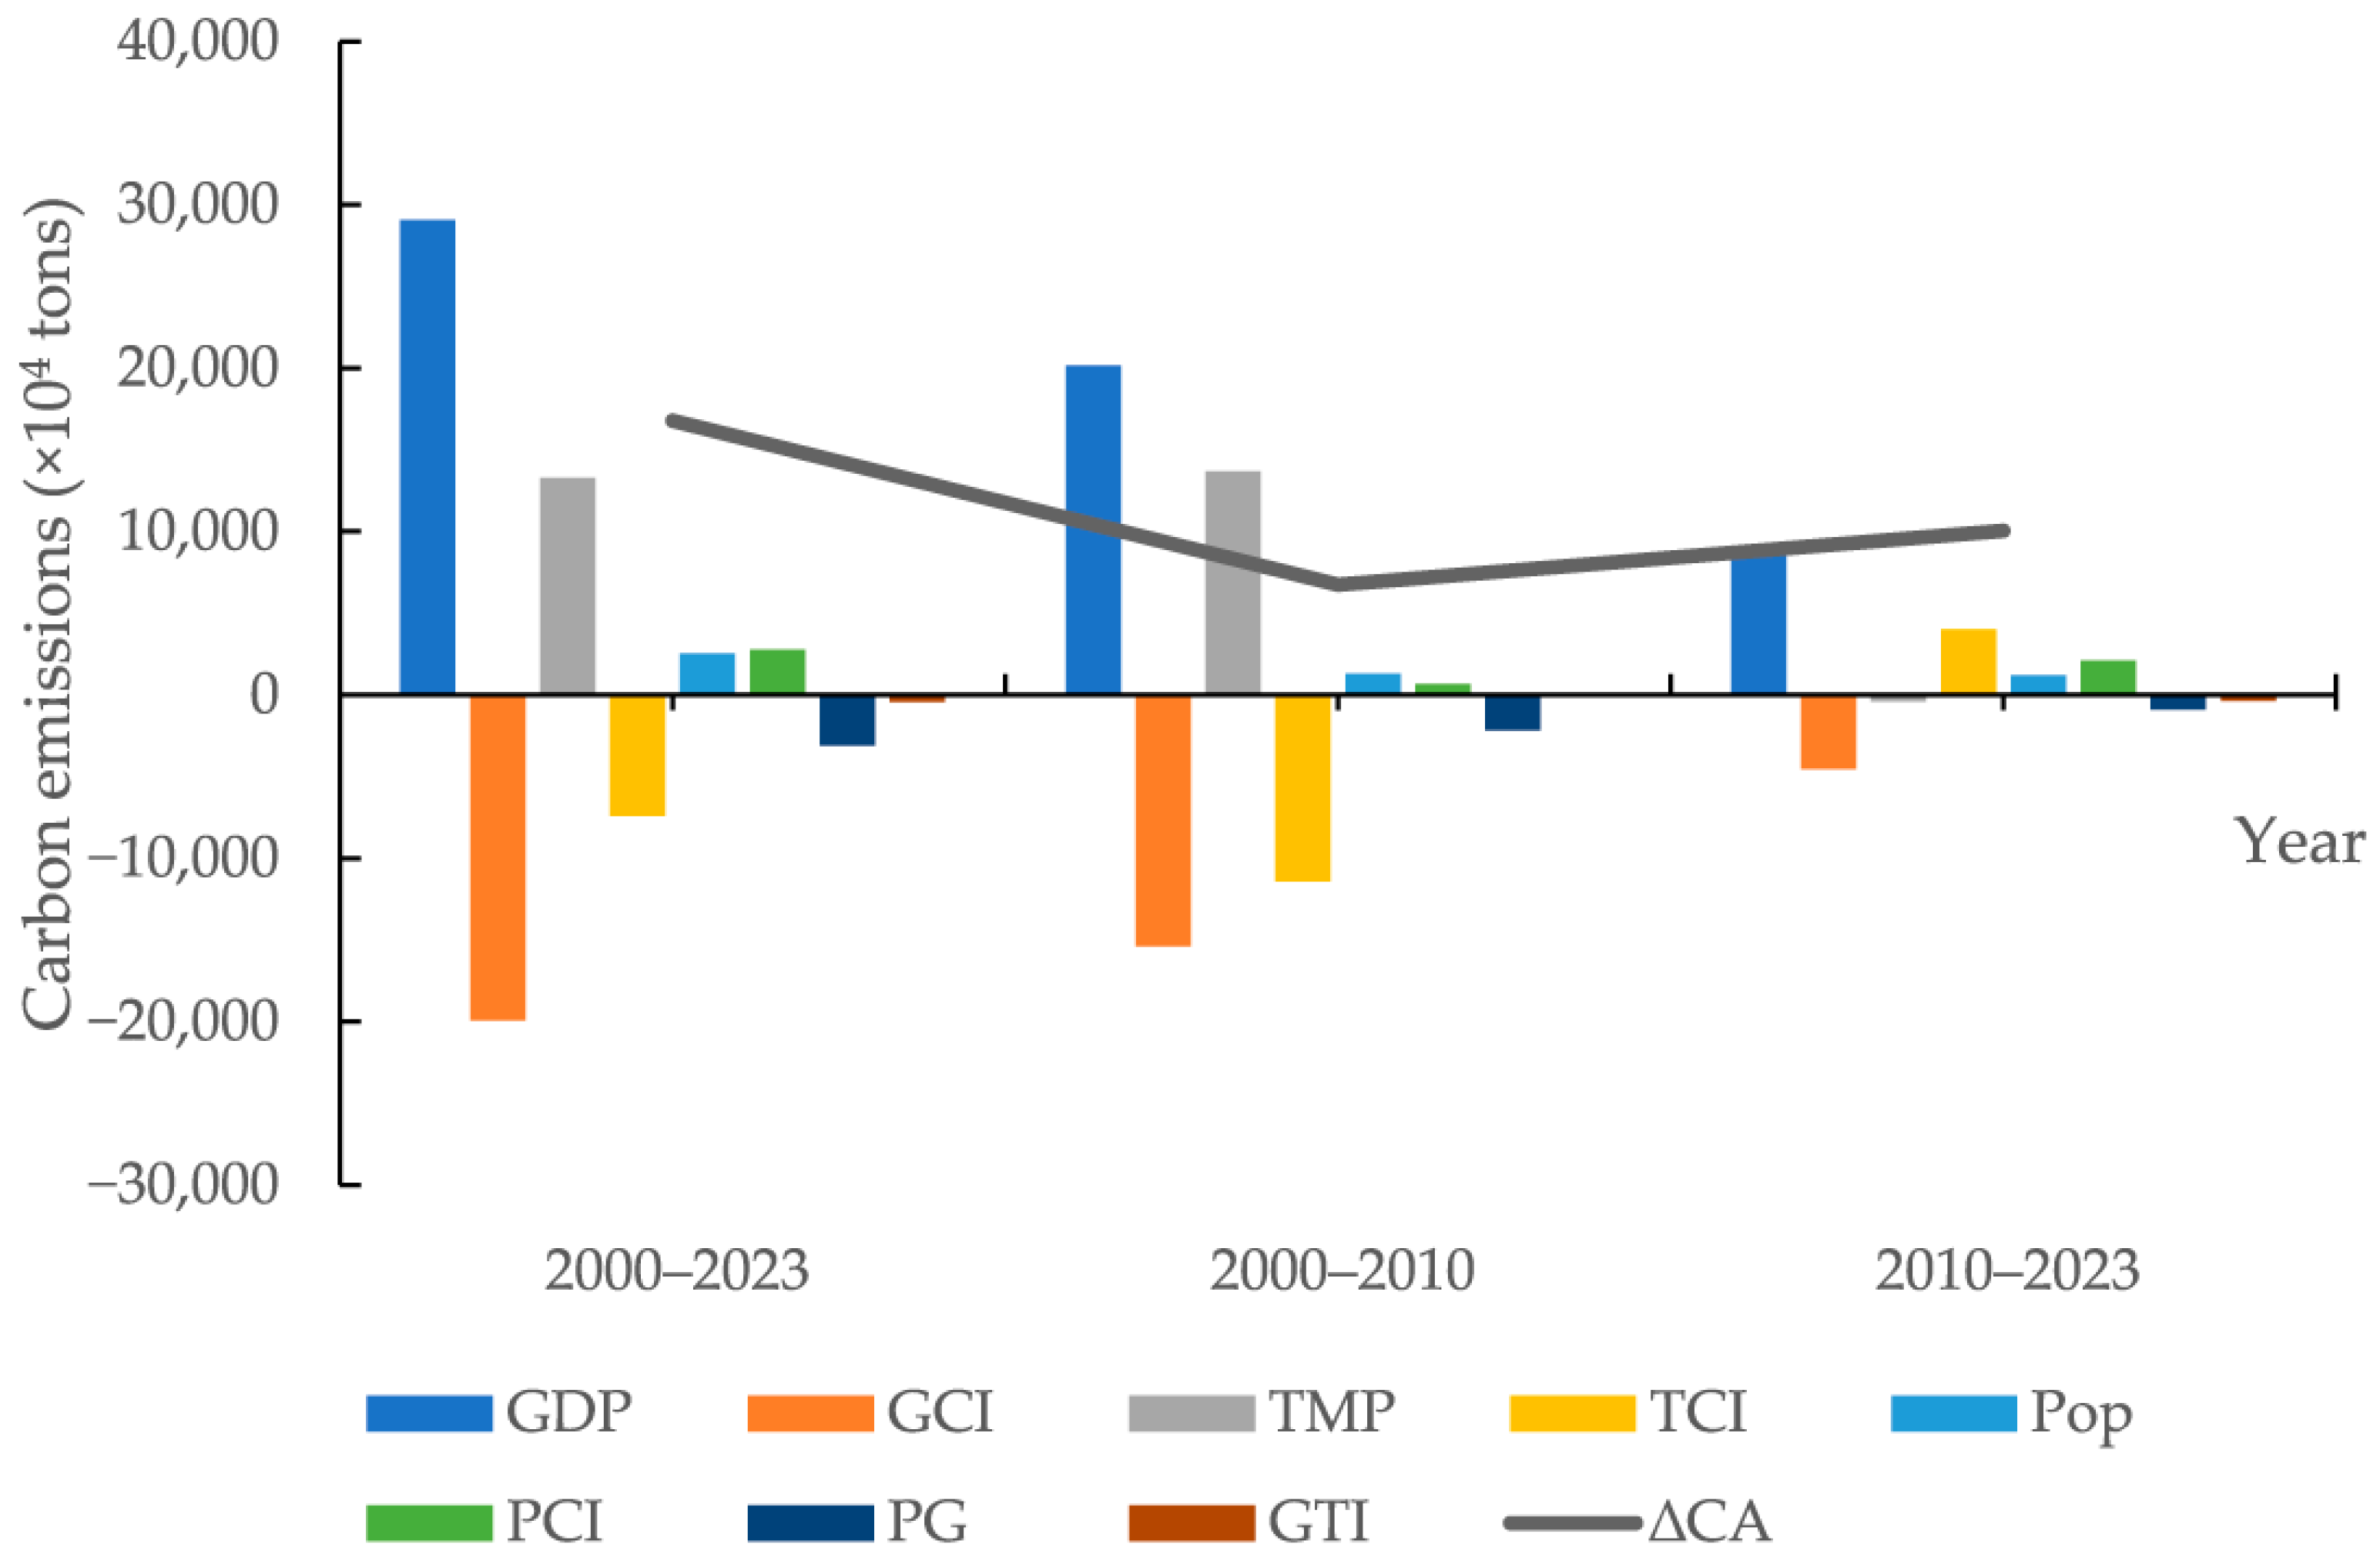
3.2. Factor Decomposition of Livestock Sector Carbon Emissions

Factor decomposition is performed in R (4.3.3). The accumulated contributions of the factors to livestock sector carbon emissions during 2000–2023 are reported in Figure 5 The contribution rates are reported in Figure 6. The results show that GDP, TMP, Pop, and PCI are the positive driving factors of carbon emissions from China’s livestock sector, while GCI, TCI, PG, and GTI are the negative driving factors.
Among the factors leading to increased carbon emissions, GDP has the highest accumulated contribution, with a value of 290.69 million tons and a contribution rate of 173.17% from 2000 to 2023. Within this period, the contribution value of GDP increased the fastest from 2000 to 2008, with a total increase of 205.62 million tons of carbon emissions during this period; the rapid expansion of livestock production was the main reason for the growth of carbon emissions. However, from 2020 to 2023, the accumulated contribution of GDP to carbon emissions began to decrease as the livestock sector output decreased. Secondly, TMP has an accumulated contribution value of 132.82 million tons and a contribution rate of 79.12%. The driving effect of TMP on carbon emissions varies similarly to that of GDP. During the rapid development of the livestock sector, mechanization is an important production element in modern farming. The equipment mainly includes ventilation devices, temperature control devices, feed processing equipment, drinking water devices, and manure processing devices. The level of livestock mechanization represents the level of technology development in China’s livestock sector, and the improvement of livestock technology has brought about an increase in production value, but also led to a significant increase in carbon emissions [29]. The accumulated contribution values of Pop and PCI to carbon emissions are 25.29 and 27.59 million tons, respectively, with contribution rates of 15.07% and 16.44%. From 2000 to 2006, the contribution value of PCI increased the most rapidly, with a cumulative contribution of 43.98 million tons. This indicates that, during this period, there was a phenomenon of over-consumption of livestock products, and the consumption structure was unreasonable. From 2020 to 2023, the accumulated contribution value of PCI began to increase significantly, possibly due to the increase in dining out after the COVID-19 pandemic, which exacerbated the waste of livestock products.
Among the factors responsible for a drop in carbon emissions, GCI played a key role, with a cumulative emission reduction contribution of 199.13 million tons and a contribution rate of −118.63%, demonstrating that rational improvement of resource utilization efficiency makes a significant contribution. Secondly, the TCI contributed to a cumulative reduction of 74.15 million tons, accounting for a contribution rate of −44.17%. The reduction in carbon intensity of machinery mainly reflects the promotion of green and energy-saving technologies, which has led to a continuous shift of livestock machinery towards green and energy-saving directions. GTI functioned as an inhibiting factor with relatively weak effects, cumulatively reducing by 435.06 million tons of carbon emissions, and with a contribution rate of −2.59%. GTI reflects the utilization efficiency of livestock machinery and, since 2015, under increasingly severe ecological environment pressure, the Chinese government has issued a series of policies and policy tools to promote the application and promotion of livestock manure resource utilization machinery [30]. Policies paper on accelerating the development of livestock mechanization have been successively issued. However, the contribution of GTI remains limited, indicating that the current efficiency of machinery utilization in China’s livestock sector is still relatively low. The promotion of such technologies has yet to achieve its intended effect, but it also suggests significant potential for future emission reductions.
The results of factor decomposition in different stages are shown in Figure 7. During the periods 2000–2010 and 2010–2023, GDP has consistently been the factor increasing carbon emissions, but its effect has gradually weakened. During the period 2000–2010, China was in a high-speed economic development stage, and the livestock sector total output value grew rapidly, becoming the factor that contributed the most to the growth of livestock sector carbon emissions. This indicates that the expansion of livestock sector output scale led to a large amount of energy consumption and corresponding carbon emissions during this period. However, as the livestock sector developed to a certain extent, the livestock sector total output value’s promotional effect on carbon missions gradually weakened. GCI has consistently made a negative contribution to the carbon emissions, but its negative effect has weakened. During the period 2000–2010, GCI had a strong negative driving effect on carbon emissions, indicating that livestock sector production activities achieved relatively good energy-saving and emission-reducing effects. However, with the recent decline in livestock sector resource utilization efficiency, these energy-saving and emission-reducing effects have weakened. TMP had a relatively strong promoting effect during the period 2000–2010, but became a weak inhibiting effect during the period 2010–2023, mainly due to the recent decline in livestock sector mechanical power level. During the period 2000–2010, TCI had a strong inhibiting effect on carbon emissions, but began to exhibit a promoting effect during the period 2010–2023, indicating that, since 2010, the livestock sector mechanical low-carbonization level has not improved, and most livestock sector machinery still relies heavily on high energy consumption. PG and GTI have consistently exhibited an inhibiting effect on carbon emissions, but GTI’s effect has been insignificant, indicating that the current efficiency of livestock sector machinery utilization is relatively low.

4. Discussion

(1) This study aims to measure the evolution of livestock sector carbon emissions and carbon emission intensity in China and its provinces from 2000 to 2023, and to identify the driving factors behind these changes. The goal is to provide references for the rational formulation and implementation of future carbon reduction policies in China’s livestock sector. Most existing studies on the evolution of carbon emissions from China’s livestock sector focus on the period from 2000 to 2020. Due to data limitations, few scholars have examined the post-2020 trends in carbon emissions from this sector. Many studies indicate a declining trend in livestock sector carbon emissions from 2000 to 2020. However, it is worth noting that 2020 marked a critical turning point in China’s economic development, during which the ASF and the COVID-19 pandemic severely impacted the livestock economy, leading to a significant decline in meat production. The subsequent recovery in meat output after 2020 raises important questions about its impact on carbon emissions, which is a key concern of this study. Therefore, in our analysis of national carbon emissions, we focus particularly on the post-2020 period and assess emissions by system boundary and livestock species. The results measured in this study are generally consistent with those of [15]; however, their analysis only extends to 2020. The findings reveal a significant upward trend in total carbon emissions from 2020 to 2023, with emissions in 2023 reaching the highest level since 2000. Carbon emission intensity also increased during 2020 to 2023, although the overall trend since 2000 has seen a decline, and the current carbon reduction situation in livestock remains challenging.
Building on the measurement of carbon emissions, this study further investigates the driving factors behind carbon emissions from 2000 to 2023. Most existing analyses of carbon emission drivers in the livestock sector adopt the LMDI method. Studies have shown that the intensity effect has the most significantly inhibitory effect on carbon emissions, while the economic effect is the most significant positive driver [5], which aligns with our findings. This study applies the GDIM and innovatively introduces the total power of livestock machinery as a variable. It examines the impact of the scale of machinery input, the degree of low-carbon development, and the utilization efficiency of machinery on carbon emissions. The results confirm that the scale of mechanical power input is the second strongest positive driving factor after output scale, while the low-carbon level of livestock sector machinery is the second strongest negative driver after carbon intensity per unit of output.
(2) The following policy recommendations are made:
First, the study found that the proportion of carbon emissions from the feed consumption system and the energy consumption system has gradually increased, indicating that attention should be paid to energy saving and emission reduction in feed and energy consumption in the animal husbandry industry, and suggesting the strengthening of research on new types of feed grain, emphasizing feed fermentation technologies, and the continued exploration of nutritional regulation technologies that result in lower GHG emissions [31,32]. Efforts should also be made to create environments more conducive to the growth of livestock and poultry, utilize more energy-efficient equipment and transportation tools, and adopt models such as “farming based on land capacity” to improve the treatment efficiency of livestock and poultry manure [33].
Second, in terms of carbon emissions by different livestock species, carbon emissions from China’s livestock sector are closely related to livestock structures. China’s meat consumption is primarily composed of pork and poultry, and the production structure aligned with consumer demand has led to pork and poultry being the main contributors to emissions. Pigs produce a large amount of carbon emissions from manure management, cattle and sheep produce a large amount of carbon emissions from enteric fermentation, and poultry are among the livestock species with the most low-carbon attributes due to their near-zero carbon emissions from enteric fermentation. The sharp increase in carbon emissions from 2020 to 2023 is mainly attributable to the rise in pig farming. It is recommended to reasonably adjust the proportion of meat types [34], moderately increase the share of poultry, and further optimize the overall structure of the industry. Regional differences and local livestock characteristics should also be fully considered to adapt livestock structure adjustments accordingly.
Third, by analyzing the driving factors of carbon emissions from China’s livestock industry, it was found that the level of livestock output and the level of total power of livestock machinery were the most important factors contributing to carbon emissions, and that the carbon intensity of output and the carbon intensity of the level of total power of livestock machinery were the main factors contributing to the decline. Reducing carbon emissions by cutting output or reducing the use of machinery is clearly inconsistent with the long-term development goals of the livestock sector. Emissions reduction should be achieved by enhancing resource use efficiency and the low-carbon performance of machinery. It is recommended to promote low-carbon economic and consumption models in the livestock sector and adopt low-carbon mechanized equipment to achieve effective emission reduction. The promotion of advanced low-carbon mechanization technologies can significantly reduce traditional energy consumption, lower carbon emissions, and improve output levels simultaneously [35]. Currently, the utilization efficiency of livestock machinery remains relatively low, indicating significant potential for improvement. While pursuing advanced technologies, more attention should be paid to improving the efficiency of machinery use and optimal allocation to better achieve emission reduction goals.
(3) As for limitations and future research directions, at present, there is no standardized and unified accounting method for measuring carbon emissions in livestock sector. Current estimations mainly rely on livestock and poultry breeding data, without considering factors such as farming methods, rearing stages, feed characteristics, and manure management practices. In order to avoid errors, this paper adopts the fixed carbon emission factor to measure carbon emission. Furthermore, this study does not consider the carbon sequestration in pastures, which could play a role in offsetting emissions. Future research should focus on carbon emissions associated with different breeding characteristics and production stages, incorporate the carbon sequestration potential of pastures, scientifically calculate total carbon emissions, and further explore the impact of livestock structure on carbon emissions.

5. Conclusions

This study conducts a comprehensive assessment of carbon emissions, and uses GDIM to analyze the driving factors behind these emissions. In addition, innovative trends are presented for the period from 2020 to 2023.
First, from 2000 to 2023, total carbon emissions from China’s livestock sector fluctuated within the range of 645.15 to 812.99 million tons. Since 2020, emissions have entered a new phase of continuous growth, increasing by 5.40% from 2020 to 2023. The proportion of emissions from enteric fermentation and manure management systems has gradually declined, while that from feed consumption and energy consumption systems have increased. Coordinated carbon reduction across the entire supply chain, along with industrial structure optimization, represents the future development trend.
Second, from 2000 to 2023, carbon emission intensity has shown a downward trend nationwide and across all provinces. Resource utilization efficiency has improved, with gradual convergence in inter-provincial disparities. The extensive grazing mode in pastoral areas has been significantly improved, and grazing policy controls have been effectively implemented. However, during the period from 2020 to 2023, carbon emission intensity began to show a slight upward trend, accompanied by a decrease in resource utilization efficiency.
Third, the continuous growth in livestock sector output value and the total power of machinery are the main factors promoting the growth of carbon emissions. Meanwhile, the carbon intensity of output and the carbon intensity of machinery power have made significant contributions to emission reductions. Therefore, in addition to introducing advanced low-carbon machinery, improving machinery utilization efficiency is a key direction for the future development of the sustainable livestock sector.

Author Contributions

Conceptualization, X.W.; methodology, X.W. and X.X. (Xuezhen Xiong); investigation, X.W.; resources, X.W.; data curation, X.W.; writing—original draft preparation, X.W.; writing—review and editing, X.W., X.X. (Xuezhen Xiong) and X.X. (Xiangfei Xin); supervision, X.X. (Xuezhen Xiong) and X.X. (Xiangfei Xin); funding acquisition, X.X. (Xiangfei Xin). All authors have read and agreed to the published version of the manuscript.

Funding

This research was supported by the National Natural Science Foundation of China, grant number 72033009, the National Social Science Fund of China, grant number 21BJY261, and the earmarked fund for China Agriculture Research System, grant number CARS-41.

Institutional Review Board Statement

Not applicable.

Informed Consent Statement

Not applicable.

Data Availability Statement

The data presented in this study are available on request from the corresponding author.

Acknowledgments

We thank all reviewers and editors for their constructive suggestions and comments.

Conflicts of Interest

The authors declare no conflicts of interest.

Abbreviations

The following abbreviations are used in this manuscript:
GHGGreenhouse Gas
LACLife Cycle Assessment
LMDILogarithmic Mean Divisia Index
GDIMGeneralized Divisia Index Method

References

  1. UNEP. Growing greenhouse gas emissions due to meat production. Environ. Dev. 2013, 5, 156–163. [Google Scholar] [CrossRef]
  2. FAO. Pathways Towards Lower Emissions—A Global Assessment of the Greenhouse Gas Emissions and Mitigation Options from Livestock Agrifood Systems; FAO: Rome, Italy, 2023. [Google Scholar]
  3. Hu, X.; Wang, J. Estimation of livestock greenhouse gases discharge in China. Trans. Chin. Soc. Agric. Eng. 2010, 26, 247–252. [Google Scholar] [CrossRef]
  4. Wu, Q.; Zhang, Y.; Zhang, M. Quantitative assessment, temporal and spatial characteristics and dynamic evolution of China’s animal husbandry carbon emissions. J. Arid Land Resour. Environ. 2022, 36, 65–71. [Google Scholar] [CrossRef]
  5. Bai, X.; Hu, H.; Zhou, Y.; Zhang, Y. Study on space-time evolution and influence factors of carbon emissions in China’s animal husbandry. J. China Agric. Univ. 2023, 28, 260–274. [Google Scholar] [CrossRef]
  6. Ning, J.; Zhang, C.; Hu, M.; Sun, T. Accounting for Greenhouse Gas Emissions in the Agricultural System of China Based on the Life Cycle Assessment Method. Sustainability 2024, 16, 2594. [Google Scholar] [CrossRef]
  7. Meng, X.; Cheng, G.; Zhang, J.; Wang, Y.; Zhou, H. Analyze on the spatial temporal characteristics of GHG estimation of livestock’s by life cycle assessment in China. China Environ. Sci. 2014, 34, 2167–2176. [Google Scholar]
  8. Yao, C.; Qian, S.; Li, Z.; Liang, L. Provincial animal husbandry carbon emissions in China and temporal-spatial evolution mechanism. Resour. Sci. 2017, 39, 698–712. [Google Scholar] [CrossRef]
  9. Dai, X.; Li, J.; He, Y.; Wang, F. Regional equity and efficiency of carbon emissions of China’s livestock industry in 2000–2020. Resour. Sci. 2023, 45, 62–76. [Google Scholar] [CrossRef]
  10. Li, Z.; Wei, Q.; Liu, X.; Zhu, R.; Li, C.; Li, Z. The Emission Characteristics of Greenhouse Gases from Animal Husbandry in Shandong Province Based on Life Cycle Assessment. Sustainability 2024, 16, 1375. [Google Scholar] [CrossRef]
  11. Liang, Y.; Wang, M. Deconstructing the Experience of China’s Pig Industry Carbon Emissions and Choosing a Dynamic Path to Peak. Issu. Agric. Econ. 2023, 10, 101–115. [Google Scholar] [CrossRef]
  12. Chen, Y.; Shang, J. Estimation and Effecting Factor Decomposition of Green House Gas Emission of Animal Husbandry Industry in Four Pastoral Areas. China Popul. Resour. Environ. 2014, 24, 89–95. [Google Scholar] [CrossRef]
  13. Chen, S.; Hu, H. Study on the spatial-temporal changes and influence factors of greenhouse gases emission from livestock and poultry in China. China Popul. Resour. Environ. 2016, 26, 93–100. [Google Scholar] [CrossRef]
  14. Yao, C.; Qian, S.; Mao, Y.; Li, Z. Decomposition of impacting factors of animal husbandry carbon emissions change and its spatial differences in China. Trans. Chin. Soc. Agric. Eng. 2017, 33, 10–19. [Google Scholar] [CrossRef]
  15. He, D.; Deng, X.; Wang, X.; Zhang, F. Livestock greenhouse gas emission and mitigation potential in China. J. Environ. Manag. 2023, 348, 119494. [Google Scholar] [CrossRef] [PubMed]
  16. Yan, Q.; Yin, J. Factor Decomposition of Carbon Emissions in Beijing, Tianjin, Hebei: A Study Based on Generalized Divisia Index Method. Sci. Technol. Manage. Res. 2017, 37, 239–245. [Google Scholar] [CrossRef]
  17. Shao, S.; Zhang, X.; Zhao, X. Empirical Decomposition and Peaking Pathway of Carbon Dioxide Emissions of China’s Manufacturing Sector—Generalized Divisia Index Method and Dynamic Scenario Analysis. China Ind. Econ. 2017, 3, 44–63. [Google Scholar] [CrossRef]
  18. Wang, S.; Xu, Y.; Weng, D.; Zhang, H.; Wen, X.; Hu, X.; Zhang, L. Driving factors and peak analysis of road traffic carbon emissions in China. Acta Ecol. Sin. 2025, 45, 1315–1327. [Google Scholar] [CrossRef]
  19. Vaninsky, A. Factorial decomposition of CO2 emissions: A generalized Divisia index approach. Energy Econ. 2014, 45, 389–400. [Google Scholar] [CrossRef]
  20. Liu, G.; Müller, D.B. Addressing sustainability in the aluminum industry: A critical review of life cycle assessments. J. Clean. Prod. 2012, 35, 108–117. [Google Scholar] [CrossRef]
  21. Hörtenhuber, S.J.; Seiringer, M.; Theurl, M.C.; Größbacher, V.; Piringer, G.; Kral, I.; Zollitsch, W.J. Implementing an appropriate metric for the assessment of greenhouse gas emissions from livestock production: A national case study. Animal 2022, 16, 100638. [Google Scholar] [CrossRef]
  22. Ma, Y.; Cao, D.; Luo, W.; Li, G.; Zhang, W.; Li, Y. Carbon Emission Accounting Methodology of Livestock and Poultry Breeding Industry in China Based on Life Cycle Theory. China Environ. Sci. 2024, 44, 2799–2810. [Google Scholar] [CrossRef]
  23. Xie, H.; Chen, X.; Yang, M.; Zhao, Q.; Zhao, M. The ecological footprint analysis of 1 kg livestock product of China. Acta Ecol. Sin. 2009, 29, 3264–3270. [Google Scholar]
  24. NCSC. Emission Factor of China’s Regional Power Grid Baseline for the 2021 Emission Reduction Project. Available online: https://ccer.cets.org.cn/notice/noticeDetail?bulletinInfoId=1175122354980917248 (accessed on 8 April 2025).
  25. IPCC. IPCC Sixth Assessment Report, Climate Change 2022; IPCC: Geneva, Switzerland, 2022.
  26. Yang, C.; Zhu, Z.; Liu, Z. Analysis on Total Factor Productivity of Regional Animal Husbandry in China. Stat. Decis. 2019, 35, 91–94. [Google Scholar] [CrossRef]
  27. Guan, D.; Hubacek, K.; Weber, C.L.; Peters, G.P.; Reiner, D.M. The drivers of Chinese CO2 emissions from 1980 to 2030. Glob. Environ. Chang. 2008, 18, 626–634. [Google Scholar] [CrossRef]
  28. Minx, J.C.; Baiocchi, G.; Peters, G.P.; Weber, C.L.; Guan, D.; Hubacek, K. A “carbonizing dragon”: China’s fast growing CO2 emissions revisited. Environ. Sci. Technol. 2011, 45, 9144–9153. [Google Scholar] [CrossRef] [PubMed]
  29. Garnier, J.; Noë, J.L.; Marescaux, A.; Sanz-Cobena, A.; Lassaletta, L.; Silvestre, M.; Thieu, V.; Billen, G. Long-term changes in greenhouse gas emissions from French agriculture and livestock (1852–2014): From traditional agriculture to conventional intensive systems. Sci. Total Environ. 2019, 660, 1486–1501. [Google Scholar] [CrossRef] [PubMed]
  30. Chen, Q.; Zhang, Y. Evolution of carbon reduction policies for animal husbandry—An analysis based on 452 policies. J. Huazhong Agric. Univ. (Soc. Sci. Ed.) 2022, 1, 10–23. [Google Scholar] [CrossRef]
  31. Li, T.; Wang, M. Research on the Realization Path of Carbon Peaking and Carbon Neutrality Goals Assisted by Animal Husbandry—Based on the Experience Comparison and Enlightenment of Different Countries. World Agric. 2023, 1, 5–16. [Google Scholar] [CrossRef]
  32. Kumari, S.; Fagodiya, R.K.; Hiloidhari, M.; Dahiya, R.P.; Kumar, A. Methane production and estimation from livestock husbandry: A mechanistic understanding and emerging mitigation options. Sci. Total Environ. 2020, 709, 136135. [Google Scholar] [CrossRef]
  33. Liu, C.; Ma, G.; Liu, C.; Wang, J.; Xin, X. Review and countermeasures on resource utilization of livestock and poultry manure—Based on the two-dimensional perspective of supply and demand. Heilongjiang Anim. Sci. Vet. Med. 2022, 2, 13–17+25. [Google Scholar] [CrossRef]
  34. Xin, X.; Wang, X.; Wang, J. High-quality Development of Broiler Industry: Challenges, Trend and Policy. China Poult. 2024, 46, 1–10. [Google Scholar] [CrossRef]
  35. Hu, C.; Wei, Y.; Hu, W. Research on the Relationship between Agricultural Policy, Technological Innovation and Agricultural Carbon Emissions. Issues Agric. Econ. 2018, 9, 66–75. [Google Scholar] [CrossRef]
Figure 1. Livestock carbon emission system.
Sustainability 17 06537 g001
Figure 2. Carbon emissions from each livestock stage in 2000–2023.
Sustainability 17 06537 g002
Figure 3. Carbon Intensity by Region in 2000, 2010, and 2023 ((ac) represent 2000, 2010, 2023, respectively). The small map in the lower right corner of each main panel shows the location of the South China Sea Islands.
Sustainability 17 06537 g003aSustainability 17 06537 g003b
Figure 4. Carbon emissions for each livestock species from 2000 to 2023.
Sustainability 17 06537 g004
Figure 5. Cumulative contribution values from 2000 to 2023.
Sustainability 17 06537 g005
Figure 6. The total contribution rate of carbon emission in livestock sector in China from 2000 to 2023.
Sustainability 17 06537 g006
Figure 7. Contributions of each factor influencing livestock sector carbon emissions in different stages.
Sustainability 17 06537 g007
Table 1. Carbon emission coefficient of each livestock species (kg/(head·a)).
CategoryEnteric FermentationManure ManagementReference Source
CH4 (eci1)CH4 (eci2)N2O (eci3)
Pig13.50.53[3]
Dairy Cattle68161
Beef cattle51.41.501.37[9]
Poultry00.020.02[3]
Sheep50.160.33
Rabbit0.2540.080.02
Horse181.641.39
Donkey100.901.39
Mule100.901.39
Camel461.921.39
Table 2. Carbon emission coefficient.
SystemSignCarbon Emission CoefficientValueReference Source
Feed grain plantingej1Wheat (t/t)1.22[8]
Corn (t/t)1.5
Feed grain transportation and processingej2Wheat (t/t)0.0319
Corn (t/t)0.0102
Soybean (t/t)0.1013
Livestock and poultry breedingpriceeUnit price of electricity (CNY/kWh)0.4275[9]
pricecUnit price of coal (CNY/t)800
efelectricity consumption (tCO2/MWh)0.8803[24]
eccoal consumption (t/t)1.98[9]
Livestock products’ slaughter and processingMJubeef (MJ/kg)4.37[8]
pork (MJ/kg)3.76
Mutton (MJ/kg)10.4
Poultry (MJ/kg)2.59
poultry egg (MJ/kg)8.16
Milk (MJ/kg)1.12
vthe calorific value of one degree
Electricity (MJ)
3.6
Other conversion coefficients G W H C H 4 -27[25]
G W H N 2 O -273
Disclaimer/Publisher’s Note: The statements, opinions and data contained in all publications are solely those of the individual author(s) and contributor(s) and not of MDPI and/or the editor(s). MDPI and/or the editor(s) disclaim responsibility for any injury to people or property resulting from any ideas, methods, instructions or products referred to in the content.

