Article

A New Approach Based on Trend Analysis to Estimate Reference Evapotranspiration for Irrigation Planning

Irrigation Technology Program, Plant and Animal Production Department, Forestry Vocational School, Istanbul University-Cerrahpaşa, Istanbul 34473, Türkiye
Sustainability 2025, 17(14), 6531; https://doi.org/10.3390/su17146531
Submission received: 4 June 2025 / Revised: 4 July 2025 / Accepted: 8 July 2025 / Published: 17 July 2025

Abstract

Increasing drought conditions at the global level have created concerns about the decrease in water resources. This situation has made the correct planning of irrigation applications the most important situation. Irrigation management in future periods is possible with the correct determination of the reference evapotranspiration (ET0) trend. In the current situation, the trend is usually determined using one or two methods. Failure to conduct a detailed trend analysis results in incorrect irrigation management. With the new approach presented in the research, all of the Mann–Kendall (MK), innovative trend analysis (ITA), Sen’s slope (SS) and Spearman’s rho (SR) tests were used, and the common results of the four tests, namely increase, decrease, and no trend, were taken into account. The ET0 values calculated in different approaches were focused on temporal and spatial analysis for the future irrigation management of Türkiye with the Blaney–Criddle (BC), Turc (TR), and Coutagne (CT) methods. The future period forecast was made using four different trend analyses with geographical information system (GIS) based spatial applications using 12-month ET0 data calculated from 59 years of data between 1965 and 2023. Statistical analysis was performed to reveal the relationship between ET0 calculation methods. The findings showed that although there is a general increasing trend in ET0 values in the region, this situation is more pronounced, especially in the provinces in the western and central regions. The research results improve the determination of plant water needs for future periods in terms of irrigation management. This new approach, which determines ET0 trend analysis in the Black Sea region, can be used in regional, national, and international studies by supporting different calculations to be made in order to plan future water management correctly, to reduce the concern of decreasing water resources in drought conditions, and to obtain comprehensive data in order to provide appropriate irrigation.

1. Introduction

As a result of agricultural and industrial developments, there is an increase in the demand for water. This situation reveals the importance of studies on water consumption, water management, and irrigation practices. Irrigated agriculture contributes substantially to global food production. When the total cultivated agricultural land in the world and the irrigated lands are compared, it can be seen that less than 20% of the total area is irrigated agriculture. On the other hand, around 40% of the world’s food needs are met in regions where irrigated agriculture is practiced [1].
The amount of evapotranspiration, which is closely related to irrigation and agricultural production, is the actual amount of water consumed by plants. In this respect, ensuring sustainability in agricultural production is possible by determining the evapotranspiration amounts appropriately. Evapotranspiration (ET) is defined as the total amount of water lost through evaporation on the soil surface and transpiration from plant material [2]. Based on the importance of evapotranspiration values, regional evapotranspiration maps have been prepared for sustainable agriculture and especially for proper water management [3,4,5]. In addition, irrigation applications can be planned with qualitative and quantitative methods. The method that individuals often use personally is to observe the grass and irrigate when yellowing or drying occurs. However, plant losses may occur with this type of planning. In terms of irrigation planning, it is more appropriate to make measurements with the help of evaporation loss calculations [6].
As a result of the water cycle, a large amount of water falling on the earth as a result of precipitation returns to the atmosphere by evapotranspiration in plants. Evapotranspiration, which is important in many different aspects from a hydrological point of view, is a difficult process to determine precisely and clearly. It is necessary to know about evapotranspiration in many types of research, such as irrigation management and planning, sustainability of water resources, drainage practices, drought analysis, groundwater studies, and environmental analysis. The calculation of evapotranspiration is not only important in arid regions but also in humid regions in summer, and as a result of climate change, it has critical importance in terms of decreasing water resources. However, an accurate evapotranspiration calculation is of great importance for irrigated agricultural activities and hydrological basins in humid regions. Methods such as the water balance method [7] and the water vapor mass flow transfer method [8] in evapotranspiration determination make calculations that are costly and take a great deal of time. In addition to these methods, there are reference evapotranspiration calculation methods that require less time and cost [9].
Estimation of reference evapotranspiration (ET0) in terms of agricultural production is frequently used in irrigation management applications. In this context, vegetative irrigation needs can be estimated for future periods [10]. Many methods have been developed to determine ET0. When a lot of data are required in the developed methods, it is often difficult to obtain the required data correctly. In this context, empirical methods have been developed to calculate reference evapotranspiration with a small amount of data and cost. Some of these methods, namely Blaney–Criddle (BC), Turc (TR), and Coutagne (CT) methods, which are measured according to air temperature values, allow ET0 measurements with temperature and precipitation data [11,12,13,14].
In many studies, BC, TR, and CT techniques have been used for estimating ET0 in different regions [15,16,17]. It has been emphasized that these techniques provide results with few data. For example, the BC method came to the forefront in determining ET0 values in the Mediterranean region [18]. Similarly, the correct results of the differentiated BC method were determined [19,20]. On the other hand, the TR method came to the fore in the research conducted in the USA and India [21,22,23,24]. In a study conducted in Italy, TR and CT methods were used together, and correct results were obtained with both methods [25].
Trend analysis is applied in the interpretation and prediction of many hydrological events such as ET0 calculations. Although there are many methods developed for trend analysis, the trend is usually determined by more than one method. The most commonly used method among these methods is Mann–Kendall (MK). The MK Test is widely used to detect the existence of a statistically significant trend, especially in a hydrological time series [26,27]. It is a linearly fitted, nonparametric model and does not require any hypothesis about the distribution of variables [28]. The MK method has been used for ET0 trend analysis in many other studies in China, India, the USA, and globally [29,30,31,32,33,34,35].
Another method used to determine the trend of ET0 calculations, innovative trend analysis (ITA), has been used in many studies. For example, in a study conducted in Malaysia, the trend of ET0 data was determined by the ITA [36]. Similarly, [37,38,39,40] used the ITA in their trend studies. In a different study, Sen’s slope (SS) was used to determine the trend of the reference evapotranspiration values of the Western Himalayan region [41]. In a similar way, results were reached with Sen’s slope in different conducted studies [42,43,44,45,46]. In a different study conducted in Brazil, the Spearman’s rho method was used for the ET0 trend [47]. However, in different conducted research, trend study was conducted with the Spearman’s rho in a similar way [48,49,50].
In this study, we aimed to determine irrigation requirement and especially ET0, which is one of the most important parameters of the hydrological cycle, with quantitative empirical methods as an important guide for national and international studies to be carried out for water management, irrigation planning, and basin-based approaches in the future. For this purpose, according to the 12-month ET0 values determined by three different methods of the provinces in the region, the trends in the future periods were revealed with MK, ITA, SR, and SS trend tests from 1965 to 2023. The innovation brought by the different approach in the research is that instead of reaching the result with one or two trend tests and a single ET0 determination method, the trends found in common in three different ET0 calculation methods and four different trend test results are taken into consideration. In addition, the ET0 trend of the entire Black Sea region was determined instead of a subunit of a province or region. In this context, the research was carried out with the aim of determining more comprehensive and accurate trends.

2. Materials and Methods

2.1. Study Area and Data

The study area covers the provinces in the Black Sea region of Turkey, where there are 18 meteorological stations representing different parts of the region given in Figure 1. These provinces are the Western Black Sea region, consisting of Bartın, Bolu, Düzce, Karabük, Kastamonu, Sinop, and Zonguldak Provinces; the Central Black Sea region, consisting of Amasya, Çorum, Ordu, Samsun, and Tokat Provinces; and the Eastern Black Sea region, consisting of Artvin, Bayburt, Giresun, Gümüşhane, Trabzon, and Rize Provinces. Within the scope of the research, the Black Sea region was evaluated as three subregions and 18 provinces. The necessary climatic data for the annual potential evapotranspiration values calculated with the BC [11], TR [12], and CT [13] formulas for the last 59 years between 1965 and 2023 in the region were provided from Turkey. They was obtained from the meteorological stations affiliated to the General Directorate of Meteorology of the Ministry of Agriculture and Forestry and located in each province in the region. The climatic data required for determining the amount of ET0 [51] were obtained through the Meteorological Data Information Presentation and Sales System [52] of the General Directorate of Meteorology. The coordinates and altitude information of the stations where the climate data were recorded are presented in Table 1, and their spatial distributions are presented in Figure 1.

2.2. Reference Evapotranspiration (ET0) Calculation

BC, TR, and CT formulas were used in annual ET0 calculations according to the data obtained from regional meteorological stations of the provinces in the Black Sea region. One of the biggest problems in ET0 calculations is data limitations. In some regions, there are problems in ET0 calculations due to the scarcity of climatic data recorded in the past. This situation negatively affects trend analyses for future periods. In this respect, ET0 methods that can be calculated with relatively fewer data were used in the scope of the research. In addition, the ease of application of the models and their high regional relevance are the reasons for choosing these methods. All of the methods calculate ET0 with the help of meteorological data without considering the vegetation cover or the agricultural product to be grown. The formulas of the BC, TR, and CT methods used in the study are listed below.
According to the Blaney–Criddle equation, ET0 is in mm day−1, T is the daily mean air temperature (°C), p is the daily percentage of annual daylight hours, and a and b are the parameters of the equation [11,14]. The formula is as follows:
ET0 = a + b (p (0.46 T + 8.13)),
When the ET0 equation is examined according to the TR formula, p is the annual precipitation calculated in mm/year. T is the annual precipitation in °C, and LT is a formula function calculated according to the temperature amount [12]. The formula is as follows:
ET0 = P; for P/LT ≤ 0.316,
ET 0 = P 0.9 + P L t 2 · 0.5   ; for P/LT.  >   0.316 ,
where LT. = 300 + 25T + 0.05T2
According to the ET0 formula calculated with the CT method, P is the annual precipitation in mm/year, T is the annual average temperature in °C, and the L value is a function of the CT formula obtained according to the temperature amount [13]. The formula is as follows:
ET0 = P; for P < L/8,
ET0 = P(1 − P/L); for L/8 ≤ P ≤ L/2,
ET0 = 200 + 35T; for P > L/2 where L = 800 + 140T,
In the study, the applicable conditions were taken into account in all formulas used in calculating ET0, and calculations were performed in this manner. In this context, R-squared, F test, and root mean square error (RMSE) regression fit analyses were performed for the coefficients of the formulas used in calculating ET0 in the study. The R-squared method, generally known as R2, quantitatively indicates the extent to which the dependent variable is determined by the independent variables. In this context, it has been applied in many studies in terms of regression fit analysis [53,54]. However, the F test [55,56] and the method known as the root mean square error (RMSE) were also applied in terms of regression fit analysis [57,58]. In this respect, regression fit analyses were completed using appropriate methods, and calculations were obtained.

2.3. Regression and Correlation Analysis

Regression and correlation analyses were performed to reveal the binary relationships between the ET0 values calculated with the BC, TR, and CT formulas. Regression and correlation analyses were performed to determine the effect of a change in one of the variables on the other variable, the change at the same rate, and, indirectly, the predicted situations that will occur in the future. Correlation shows whether there is a statistically linear relationship between two different variables. The correlation coefficient is a value used to show the relationship between these variables [59,60].
In the equations to be created for regression analysis and in the formula used for the linearity test between two variables, y is the dependent variable, x is the independent variable, α and β represent the parameters of the model, and ε represents the error value. The formula is as follows:
Yx = α + βx + ε
The Yx value in the formula gives the estimated value within the scope of the research. The ε value in the formula gives the value of the point where the line intersects the y-axis, and the α value gives the slope value of the line. The slope of the line was used in the trend analysis calculations used in the research, and the positive slope indicates the increasing trend and the negative slope indicates the decreasing trend. In addition, the regression analysis was carried out at a significance level of 5% (0.05) in the 95% confidence interval. The coefficients, standard error, and probability values obtained in the regression analysis were determined depending on the independent variables [61,62].
While creating the regression equation, calculations were made using the least squares method to ensure that the sum of the squares of the errors resulting from the differences between the x and y values was at the smallest value. In order for the margin of error to be the smallest, the regression equation in which the a and b parameters were obtained using the least squares method was used. One of the variables created in the regression method is the dependent variable; in other words, it is accepted as the estimated (Y), while the other is accepted as the independent variable (X), which is called the estimator. In this context, the aim is to create a linear line in which any obtained value of the determined independent variable (X) gives the best statistical estimate with the value of the dependent variable (Y) [63]. While creating the regression equation, calculations were made using the least squares method so that the sum of the squares of the errors, which are the differences of the x and y values, would be at a minimum value. The formula is as follows:
∑ei = ∑ yi − yi = yi − a − bxi
y = ax + b
In the least squares method formula used in regression analysis, there are series of two variables, namely Xi and Yi, up to i = 1, …, n; the X and Y values are considered as the averages of these series. After these values, the general and estimation equations of the regression analysis are formed according to the least squares method according to the formula numbered 10 [64].

2.4. Trend Analysis

According to all ET0 methods calculated in the research, studies were conducted with four different trend methods in terms of determining trend records in the western, central, and eastern Black Sea regions. Mann–Kendall (MK), innovative trend analysis (ITA), Sen’s slope, and Spearman’s rho methods used in the research are presented under subheadings.

2.4.1. Mann–Kendall Trend Test

The MK test is a sequential and nonparametric test that does not require normal distribution of long-term data [65,66,67,68]. Many researchers [69,70,71,72,73] have used the MK test to measure the importance of trends, especially in hydro-meteorological time series. Another positive aspect of the test is its low sensitivity to sudden breaks in nonhomogeneous time series [74]. The MK test statistic S is calculated using the following formula.
i = 1 n 1 j = i + 1 n s g n ( x j x j )
Here, n is the number of data points; xi and xj are the data values in the time series i and j (j > i), respectively; and the sign function is determined by the following formula.
sgn ( x j x i ) = + 1 ,   i f   x j x i > 0 ;   0 ,    i f   x j x i > 0 ;   1 , i f   x j x i < 0
The variance is calculated by the formula given below:
Var ( S ) = n · n 1 · ( 2 n + 5 ) 18
In the current case, n is the number of data points, m is the number of dependent groups, and i is the number of ties in the scope. A dependent group is defined as a sample dataset with the same value. In this context, when there is no correlation between the observed results, the variance is calculated using the following formula:
Z s   = S 1 V a r   ( S ) , if S  >   0
Z s   =   0 , if S  =   0
Z s   = S + 1 V a r   ( S ) , if S  <   0
In cases where the sample size is n > 10, the standard normal test statistic is calculated with the ZS formula.
Φ ( I Z s I ) = 1 2 π 0 I Z s e r 2 2   dt
The cumulative distribution function of a standard normal variable is determined by the formula. Given the significance level (α), a trend is considered statistically significant if p < α. For example, if p ≤ 0.05 at a significance level of 0.05, the trend is considered statistically significant. The formula is as follows:
D = 1 6   i = 1 n ( R X i i ) 2 n ( n 2 1 )
According to all ET0 methods calculated in the research, studies were conducted with four different trend methods in terms of determining trend records in the western, central, and eastern Black Sea regions. The Mann–Kendall (MK), innovative trend analysis (ITA), Sen’s slope, and Spearman’s rho tests used in the research are presented under subheadings.

2.4.2. Innovative Trend Analysis

The ITA test does not require any assumptions (serial correlation, non-normality, sample size, etc.). This is an advantage for trend analysis studies using the ITA test. First, the time series is divided into two equal parts, which are sorted separately in increasing order. Then, the first and second halves of the time series are located on the X-axis and Y-axis, respectively. If the data are collected on the 1:1 ideal line (45° line), there is no trend in the time series. If the data are located in the upper triangular area of the ideal line, there is an increasing trend in the time series. If the data are collected in the lower triangular area of the 1:1 line, there is a decreasing trend in the time series. Thus, the trends of low, medium, and high values of any hydro-meteorological or hydro-climatic time series can be clearly determined by this test [75,76].
In the ITA test, the time series, X1, …, Xn is divided into two equal halves, and then, both subseries are sorted in ascending order. The first subseries (xi) is located on the x-axis in the Cartesian square coordinate system, and the other subseries (yi) is located on the y-axis. The 1:1 line represents the trendless line, while the distribution points above or below the trendless line represent the increasing or decreasing trend. The trend indicator formula is given as follows:
Φ = 1 n t = 1 n 10 ( X i X t ) μ
where Φ = trend indicator, n = number of observations in the subseries, Xi = data series in the first half subseries class, Xj = data series in the second half subseries class, and μ = mean of data series in the first half subseries class. A positive value of Φ indicates an increasing trend. However, a negative value of Φ indicates a decreasing trend. However, when the distribution points are closest to the 1:1 straight line, it means that there is no significant trend.

2.4.3. Sen’s Slope

If a linear trend is present in a time series, the true slope or change per unit time can be estimated using a simple nonparametric procedure developed by Sen. The slope estimates for N data pairs are first calculated as follows [77,78].
Q i = X j X k j k   for   I   =   1 , ,   N
where xR, jR and xR, kR are the data values at time j and k (j > k), respectively. The median of these N QR iR values is Sen’s slope estimator. Finally, Qmed is tested with a two-sided test at a 100% (1 − α) confidence interval, and the true slope can be obtained by nonparametric testing. Sen’s estimator is calculated with the following formula:
QR medR = Q (n + 1)/2 if N is odd
Q R   m e d R = [ Q n / 2 + Q   ( n + 2 ) / 2 ) ] / 2   i f   N   i s   e v e n

2.4.4. Spearman’s Rho

Spearman’s rho test is another rank-based nonparametric method used for trend analysis. In this test, which assumes that time series data are independently and identically distributed, the null hypothesis (H0) again indicates that there is no trend over time; the alternative hypothesis (H1) is that a trend exists, and the data increase or decrease with i. The test statistics Rsp and the standardized statistics Zsp are defined as [69,79,80]. The formula is as follows:
Rsp = 1 6   i = 1 n ( D i i ) 2 n ( n 2 1 )
Z s p = R s p n 2 1 R s p 2
In these equations, Di is the rank of the ith observation, I is the chronological order number, n is the total length of the time series data, and Zsp is the Student’s t-distribution with (n − 2) degrees of freedom. Positive values of Zsp represent an increasing trend across the hydrological time series; negative values represent decreasing trends. The critical value of t at the 0.05 significance level of the Student’s t-distribution table is defined as t(n − 2, 1 − α/2). If |Zsp| > t(n − 2, 1 − α/2), (H0) is rejected, and there is a significant trend in the hydrological time series [81].

3. Results

3.1. Reference Evapotranspiration (ET0) Results

Within the scope of the research, firstly, the annual ET0 amounts calculated for the provinces of the Black Sea region were determined separately according to the BC, TR, and CT methods. The evaluation process was carried out in order to reveal the same and different trends in the region. In this respect, both the provinces themselves and the subregions were evaluated among themselves. In addition, statistical analysis was carried out between the BC-TR, BC-CT, and TR-CT methods in order to determine the bilateral relationships between the annual changes in the calculated ET0 values of all the provinces in the region.
When ET0 values were examined in general terms in terms of all provinces in the Black Sea region, it was determined that the highest annual values were seen in Rize Province. The closest results were seen in Zonguldak, Ordu, and Giresun. There was a decrease in ET0 values compared to the inner regions, and the lowest values were calculated in Tokat, Çorum, and Bolu Provinces. The ET0 values obtained within the scope of the research are listed below regionally.

3.1.1. Reference Evapotranspiration (ET0) Results for the Western Black Sea Region

When the ET0 values obtained in the study were evaluated in terms of the western provinces of the region, the highest values were obtained according to the BC method given in Table S1. The highest ET0 value for the western Black Sea region was determined in Bartın Province, and the highest value after this province was in Zonguldak Province. The lowest ET0 value was calculated in Kastamonu Province. The values closest to this are seen in Bolu and Karabük Provinces.
The ET0 values obtained with the Turc and Coutage methods given in Tables S1 and S2, respectively, were found to be relatively lower than those obtained with the Blaney–Criddle method. In general, the lowest ET0 values were obtained with the Coutagne method. According to the ET0 values obtained with the Turc method, the highest province is Zonguldak, and the closest value to this province is Bartın. The lowest province is Karabük, while Kastamonu has the lowest ET0 value. In the Coutagne method, the highest ET0 value is in Zonguldak, and Bartın is the second province with the highest ET0 value. The lowest ET0 value was calculated in the provinces of Kastamonu and Bolu.

3.1.2. Reference Evapotranspiration (ET0) Results for the Central Black Sea Region

In terms of the central parts of the Black Sea region, the highest values among the ET0 values calculated for each province were obtained according to the Blaney–Criddle method given in Table S2. The highest ET0 value of the region is in Ordu Province, and Samsun is also one of the provinces with high ET0 values. The lowest ET0 value is in Tokat Province, and Amasya Province has a low ET0 value.
Within the scope of the research, the ET0 values obtained with the Turc and Coutage methods, which are other ET0 formulas calculated for the provinces in the central part of the region, were found to be relatively lower compared to the methods obtained with the Blaney–Criddle method, similar to the situation in the western Black Sea region. In general, the lowest ET0 values were obtained with the Coutagne method. According to the ET0 values obtained with the Turc method, the highest is Ordu Province, and Samsun is one of the provinces with high ET0 values in the region. The lowest was seen in Çorum and Tokat Provinces. In the Coutagne method, the highest ET0 value was calculated in Ordu and Samsun Provinces, similar to the Turc method. The lowest ET0 values were seen in Tokat and Amasya Provinces. ET0 values obtained according to TR and CT methods in the region are given in the Table S2.

3.1.3. Reference Evapotranspiration (ET0) Results for the Eastern Black Sea Region

Among the ET0 values calculated for each province in the eastern part of the region, the highest values were obtained according to the BC method given in Table S3 as determined in the provinces in the western and central regions. In this respect, it was observed that the ET0 values calculated with the BC method for the Black Sea region were generally higher than the TR and CT values. The highest ET0 value of the region was determined in Giresun Province together with Bayburt Province. The lowest ET0 value was observed in Gümüşhane Province. Artvin was determined as another province with a low ET0 value in the region.
The ET0 values obtained with the TR and CT methods, which are other ET0 formulas calculated in the eastern Black Sea region, were found to be relatively lower than the methods obtained with the BC method. This situation reflects that the results in the western and central regions of the region are parallel to the results in the eastern region. In general, the lowest ET0 values were obtained with the CT method. According to the ET0 values obtained with the TR method, the highest was in Giresun, while the lowest was in Gümüşhane. In the CT method, the highest ET0 value was in Giresun, as in the TR method, while the lowest was in Gümüşhane. ET0 values calculated according to TR and CT methods are given in the Table S3.

3.2. Statistical Analysis of Reference Evapotranspiration (ET0) Values

ET0 values were determined by BC, TR, and CT methods for all provinces in the region, and statistical analysis was performed to determine the relationship between these values and different measurement methods. In this context, correlation coefficients between BC-TR, BC-CT, and TR-CT were calculated. Statistical significance relationships were examined in line with the obtained correlation coefficients. In this context, provinces in the western, central, and eastern regions of the Black Sea region were evaluated separately. After the intra-regional evaluation, the provinces with the highest and lowest correlations were generally revealed.

3.2.1. Statistical Analysis Between Reference Evapotranspiration Values in the Western Black Sea Region

When the correlation values between BC and TR given in Table 2 are examined in terms of the western provinces of the region, it is seen that the highest correlation is in Bolu Province. The lowest correlation is in Bartın Province, and it can be said that there is a high correlation in all provinces of the western Black Sea region in general. According to the obtained data, the ET0 values calculated with the BC method showed a high positive correlation with the values calculated with the TR method.
The ET0 values of the western Black Sea region obtained within the scope of the research were statistically examined in terms of TR-CT, and correlation values were created. When the correlation values between TR and CT given in Table 2 were examined, it was seen that the highest correlation was in Bolu and Düzce Provinces. The lowest correlation was obtained in Bartın Province. When the provinces in the region were evaluated in general, it could be said that all provinces had high correlation values between TR-CT. According to the calculated results, the ET0 values calculated with the TR method showed a high positive correlation with the values calculated with the CT method.
In the study, correlation calculations between BC-CT, which is another method examining binary statistical relationships, are presented separately for the western, central, and eastern Black Sea regions. The highest correlation for the western Black Sea region, as given in Table 2, was seen in Kastamonu Province. A close correlation was also determined in Karabük Province. It was revealed that the lowest correlation in the region was in Düzce Province. Although the correlation between BC-CT was generally among all provinces, relatively low values were obtained for the correlation coefficients between BC-TR and TR-CT in terms of the western Black Sea region.

3.2.2. Statistical Analysis Between Reference Evapotranspiration Values in the Central Black Sea Region

When the statistical relationship between BC-TR given in Table 3 is examined in terms of the provinces in the central part of the Black Sea region, it can be seen that there are generally highly positive correlation values between BC-TR, TR-CT, and BC-CT. In this respect, all three methods have a linear correlation among themselves. However, there are numerical differences in terms of correlation coefficient. In this context, the highest numerical correlation value for BC-TR is in Ordu and Tokat Provinces, while the lowest correlation is in Çorum and Samsun Provinces.
Among the provinces in the central Black Sea region, the highest numerical correlation value between TR and CT is seen in Ordu and Samsun Provinces, while the lowest correlation is seen in Çorum Province, with a very close value. The correlation values in the central Black Sea region, as in the western Black Sea region, generally show a high degree of correlation in terms of TR-CT.
The statistical relationship between BC-CT in terms of the central Black Sea region, given in Table 3, is in the same direction, and the highest numerical correlation is seen in Amasya and Samsun Provinces. Similarly, the lowest numerical correlation was determined in Çorum Province. In terms of the central Black Sea region, the BC-CT correlation values are numerically lower than the values between BC-TR and TR-CT, as in the western Black Sea region, but it can be said that the difference between them is less, and they are in the same direction in terms of correlation.

3.2.3. Statistical Analysis Between Reference Evapotranspiration Values in the Eastern Black Sea Region

In the eastern Black Sea region, a high correlation was obtained between BC-TR, TR-CT, and BC-CT, as in the central Black Sea region. However, the obtained correlation coefficients have numerical differences. In the study, the provinces in the region were evaluated according to the numerical differences in the correlation coefficients. In this context, when the correlation relationship between BC-TR was examined, all provinces showed a positive correlation. The highest correlation relationship was seen in Gümüşhane and Artvin Provinces, while the lowest correlation was seen in Bayburt and Giresun Provinces. The correlation values of the eastern Black Sea region in terms of BC-TR are given in Table 4.
When the correlation relationship between TR-CT in terms of the eastern provinces of the region was examined, Giresun Province showed the highest correlation numerically. However, Bayburt, Gümüşhane, Trabzon, and Rize Provinces showed values very close to Giresun Province. The lowest correlation in the region was observed in Artvin province.
When the provinces in the eastern Black Sea region given in Table 4 were examined in terms of the statistical relationship between BC-CT, the highest correlation numerically was seen in Giresun and Trabzon Provinces. The lowest value was determined in Artvin Province. The correlation values between BC-CT of the region showed values close to the values between BC-TR and TR-CT.

3.3. Trend Analysis of Reference Evapotranspiration (ET0) Values

After calculating the annual ET0 values, MK, ITA, SS, and SR tests were applied to reveal trend tendencies at a confidence level of 95% for the provinces of the western, central, and eastern regions of the Black Sea region and for general evaluation. The analysis methods applied in the study were also used in many ET0 trend studies [82,83,84]. In the study conducted, unlike many studies, all four trend analysis methods were applied for each province. The results of the MK, ITA, SS, and SR analyses obtained in the study were explained separately for the western, central, and eastern Black Sea regions under the headings of analysis methods, and thematic maps were prepared.

3.3.1. Trend Results According to Mann–Kendall (MK) Test

The MK trend test was applied to the ET0 values of all provinces in the Black Sea region between the years 1965–2023 according to the BC, TR, and CT measurement methods, handling each measurement test’s results separately. In this context, it was concluded that there was an increasing trend in five of the ET0 values calculated according to the BC method and no trend in two in the western Black Sea region. According to the TR method, there was an increasing trend in four and no trend in three. According to the CT measurement method, it was concluded that there was an increase in four provinces and no trend in three provinces. According to the MK trend test, no decreasing trend was detected in any province in the region. In all BC, TR, and CT methods used in the research, an increase was obtained in four provinces in the MK trend test, and a no-trend result was obtained in three provinces.
When the MK test results were evaluated in terms of the central Black Sea region, an increasing trend was observed in three provinces according to the BC method, in two provinces according to the TR method, and in three provinces according to the CT method. An increase was detected in two provinces in common according to all trend methods. There was no trend in two provinces in the BC method, in three provinces in the TR method, and in two provinces in the CT method.
According to the MK test values in the eastern Black Sea region, an increasing trend was observed in three provinces in the BC method, three in the TR method, and two in the CT method. No decreasing trend was determined according to the MK test in all methods. According to the MK test results, the trend results for the western, central, and eastern Black Sea regions are given in Table 5.
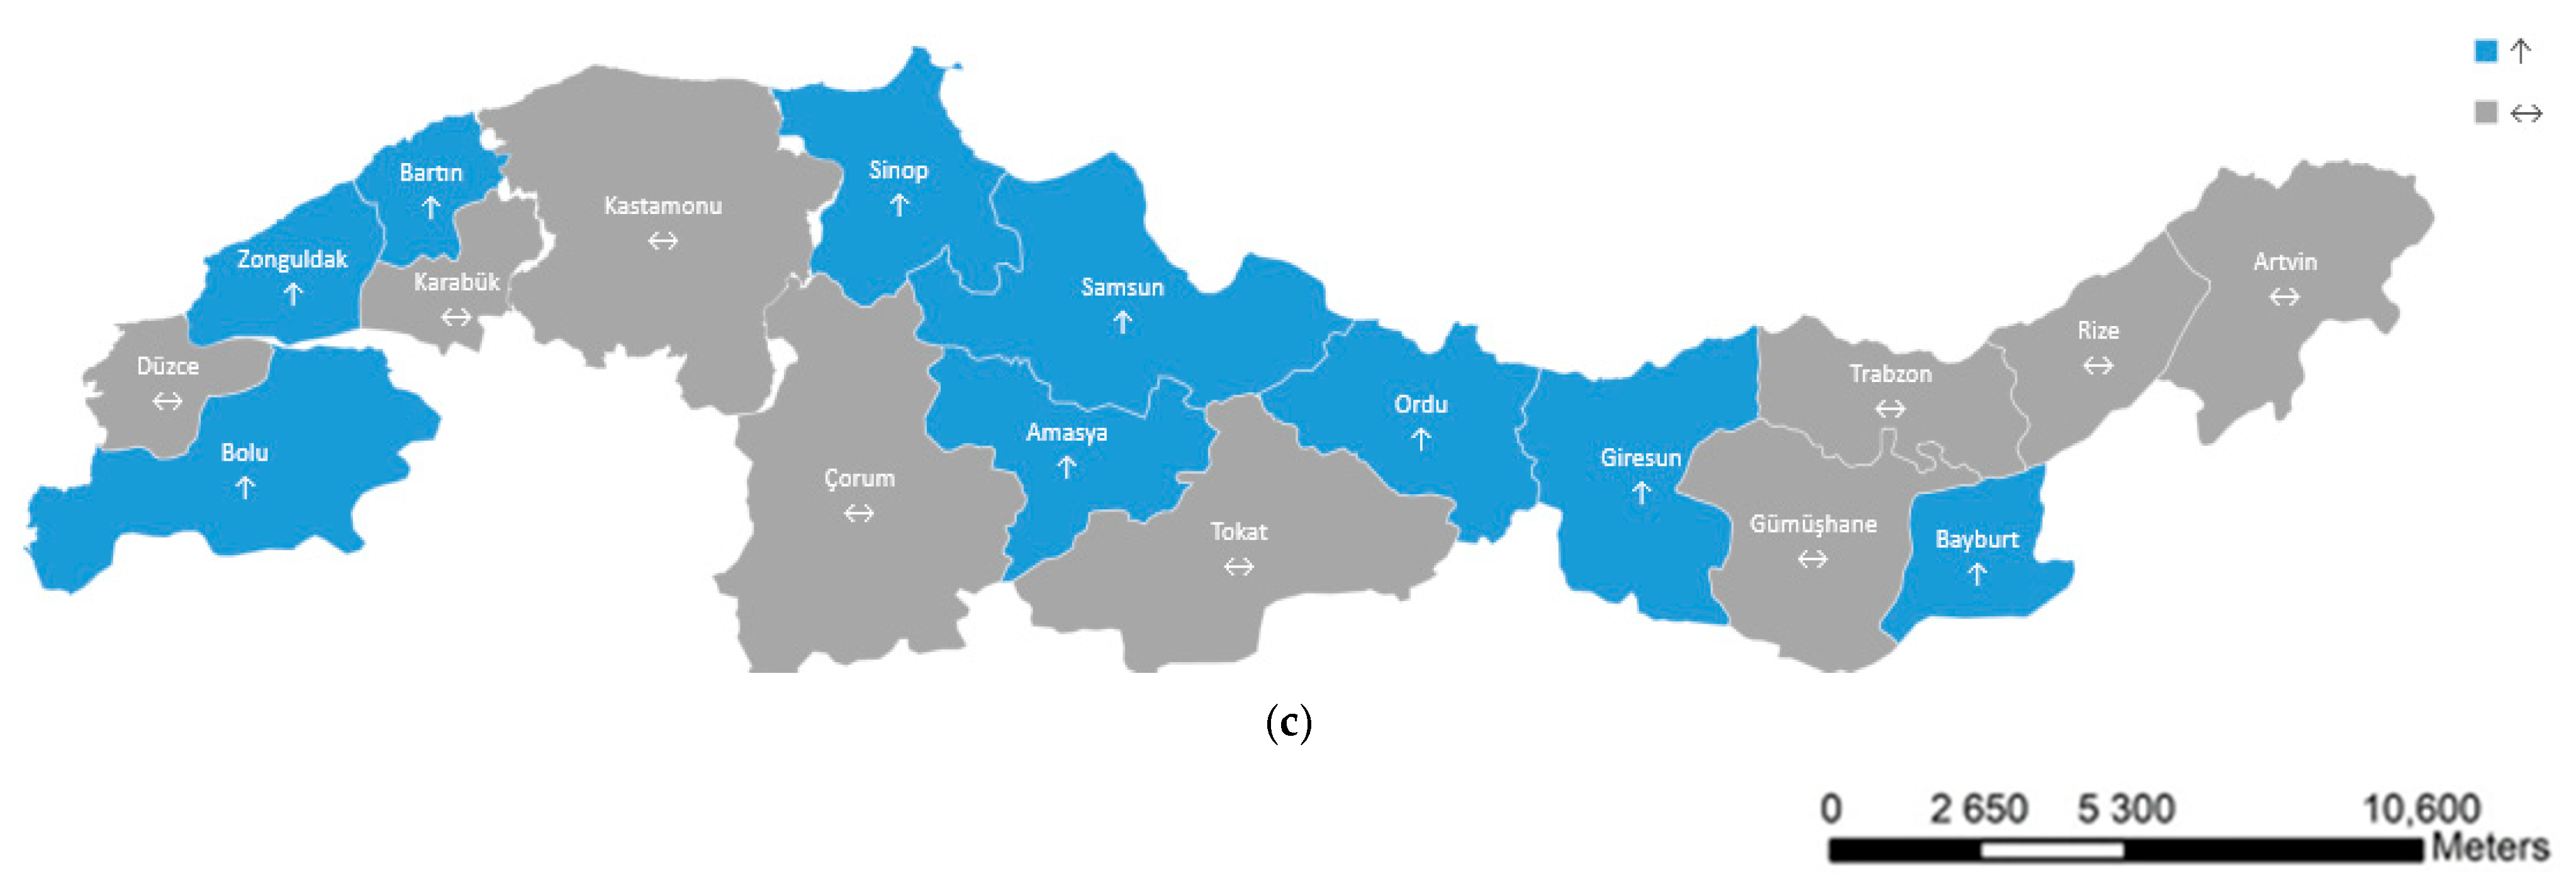
According to the thematic maps prepared according to the MK trend analysis results given in Figure 2, an increasing trend was observed in Bartın, Bolu, Karabük, Sinop, and Zonguldak Provinces in the BC method and no trend in Düzce and Kastamonu Provinces. According to the TR method, an increasing trend was observed in Sinop, Bartın, Bolu, and Zonguldak Provinces and no trend in Düzce, Karabük, and Kastamonu Provinces. According to the CT method, there was an increase in Zonguldak, Sinop, Bartın, and Bolu provinces and no trend in Düzce, Karabük, and Kastamonu Provinces. In this context, according to the MK trend test, it was observed that there was a common increase in Bartın, Bolu, Sinop, and Zonguldak Provinces according to all ET0 determination methods used in the research and no common trend in Düzce and Kastamonu Provinces. According to the MK test, there is no province in the region with a decreasing trend in terms of ET0.
According to the thematic maps given in Figure 2, created according to the results of the BC, TR, and CT ET0 calculation methods of the central Black Sea region, there was an increasing trend in Amasya, Ordu, and Samsun Provinces according to the BC method; in Ordu and Samsun Provinces according to the TR method; and in Amasya and Ordu and Samsun Provinces according to the CT method within the scope of the MK trend tendency test. In this context, Ordu and Samsun Provinces showed an increasing trend according to all ET0 calculation methods. On the other hand, there was no trend in Çorum and Tokat Provinces according to the BC method; Amasya, Çorum, and Tokat Provinces according to the TR method; and Çorum and Tokat Provinces according to the CT method. Çorum and Tokat Provinces stand out as provinces with no trend in all ET0 calculations.
According to the thematic maps given in Figure 2, created according to the MK trend tendency results, there was an increase in Artvin, Bayburt, and Giresun Provinces according to the BC method in the eastern Black Sea region, and no trend was observed in Gümüşhane, Trabzon, and Rize Provinces. According to the TR method, there was an increasing trend in the provinces of Artvin, Bayburt, and Giresun, but no trend was found in the provinces of Rize, Trabzon, and Gümüşhane. According to the CT method, although an increase was observed in Giresun and Bayburt provinces, no trend was observed in Artvin, Gümüşhane, Trabzon, and Rize Provinces. In the region, Giresun and Bayburt stand out in terms of providing a common increasing trend, while there was no common trend in the provinces of Gümüşhane, Trabzon, and Rize.

3.3.2. Trend Results According to Innovative Trend Analysis (ITA) Test

According to the trend results made according to the ITA test in terms of all regions, there was no decreasing trend in any of the BC, TR, and CT methods. However, according to the trend results given in Table 6, an increasing trend was observed in a total of five provinces under the BC method, four under the TR method, and five under the CT method in the western Black Sea region. On the other hand, it was observed that there was no trend in two provinces according to the BC method, three under the TR method, and two with the CT method. When the trend trends were evaluated in terms of the central Black Sea region, an increasing trend was found in two provinces under the BC and CT methods and three with the TR method. However, no trend was found in two provinces under the BC and CT methods and three with the TR method. In the eastern Black Sea region, an increasing trend was seen in four provinces with the BC and CT methods and three with the TR method. However, there was a trend in two provinces under the BC and CT methods and three with the TR method.
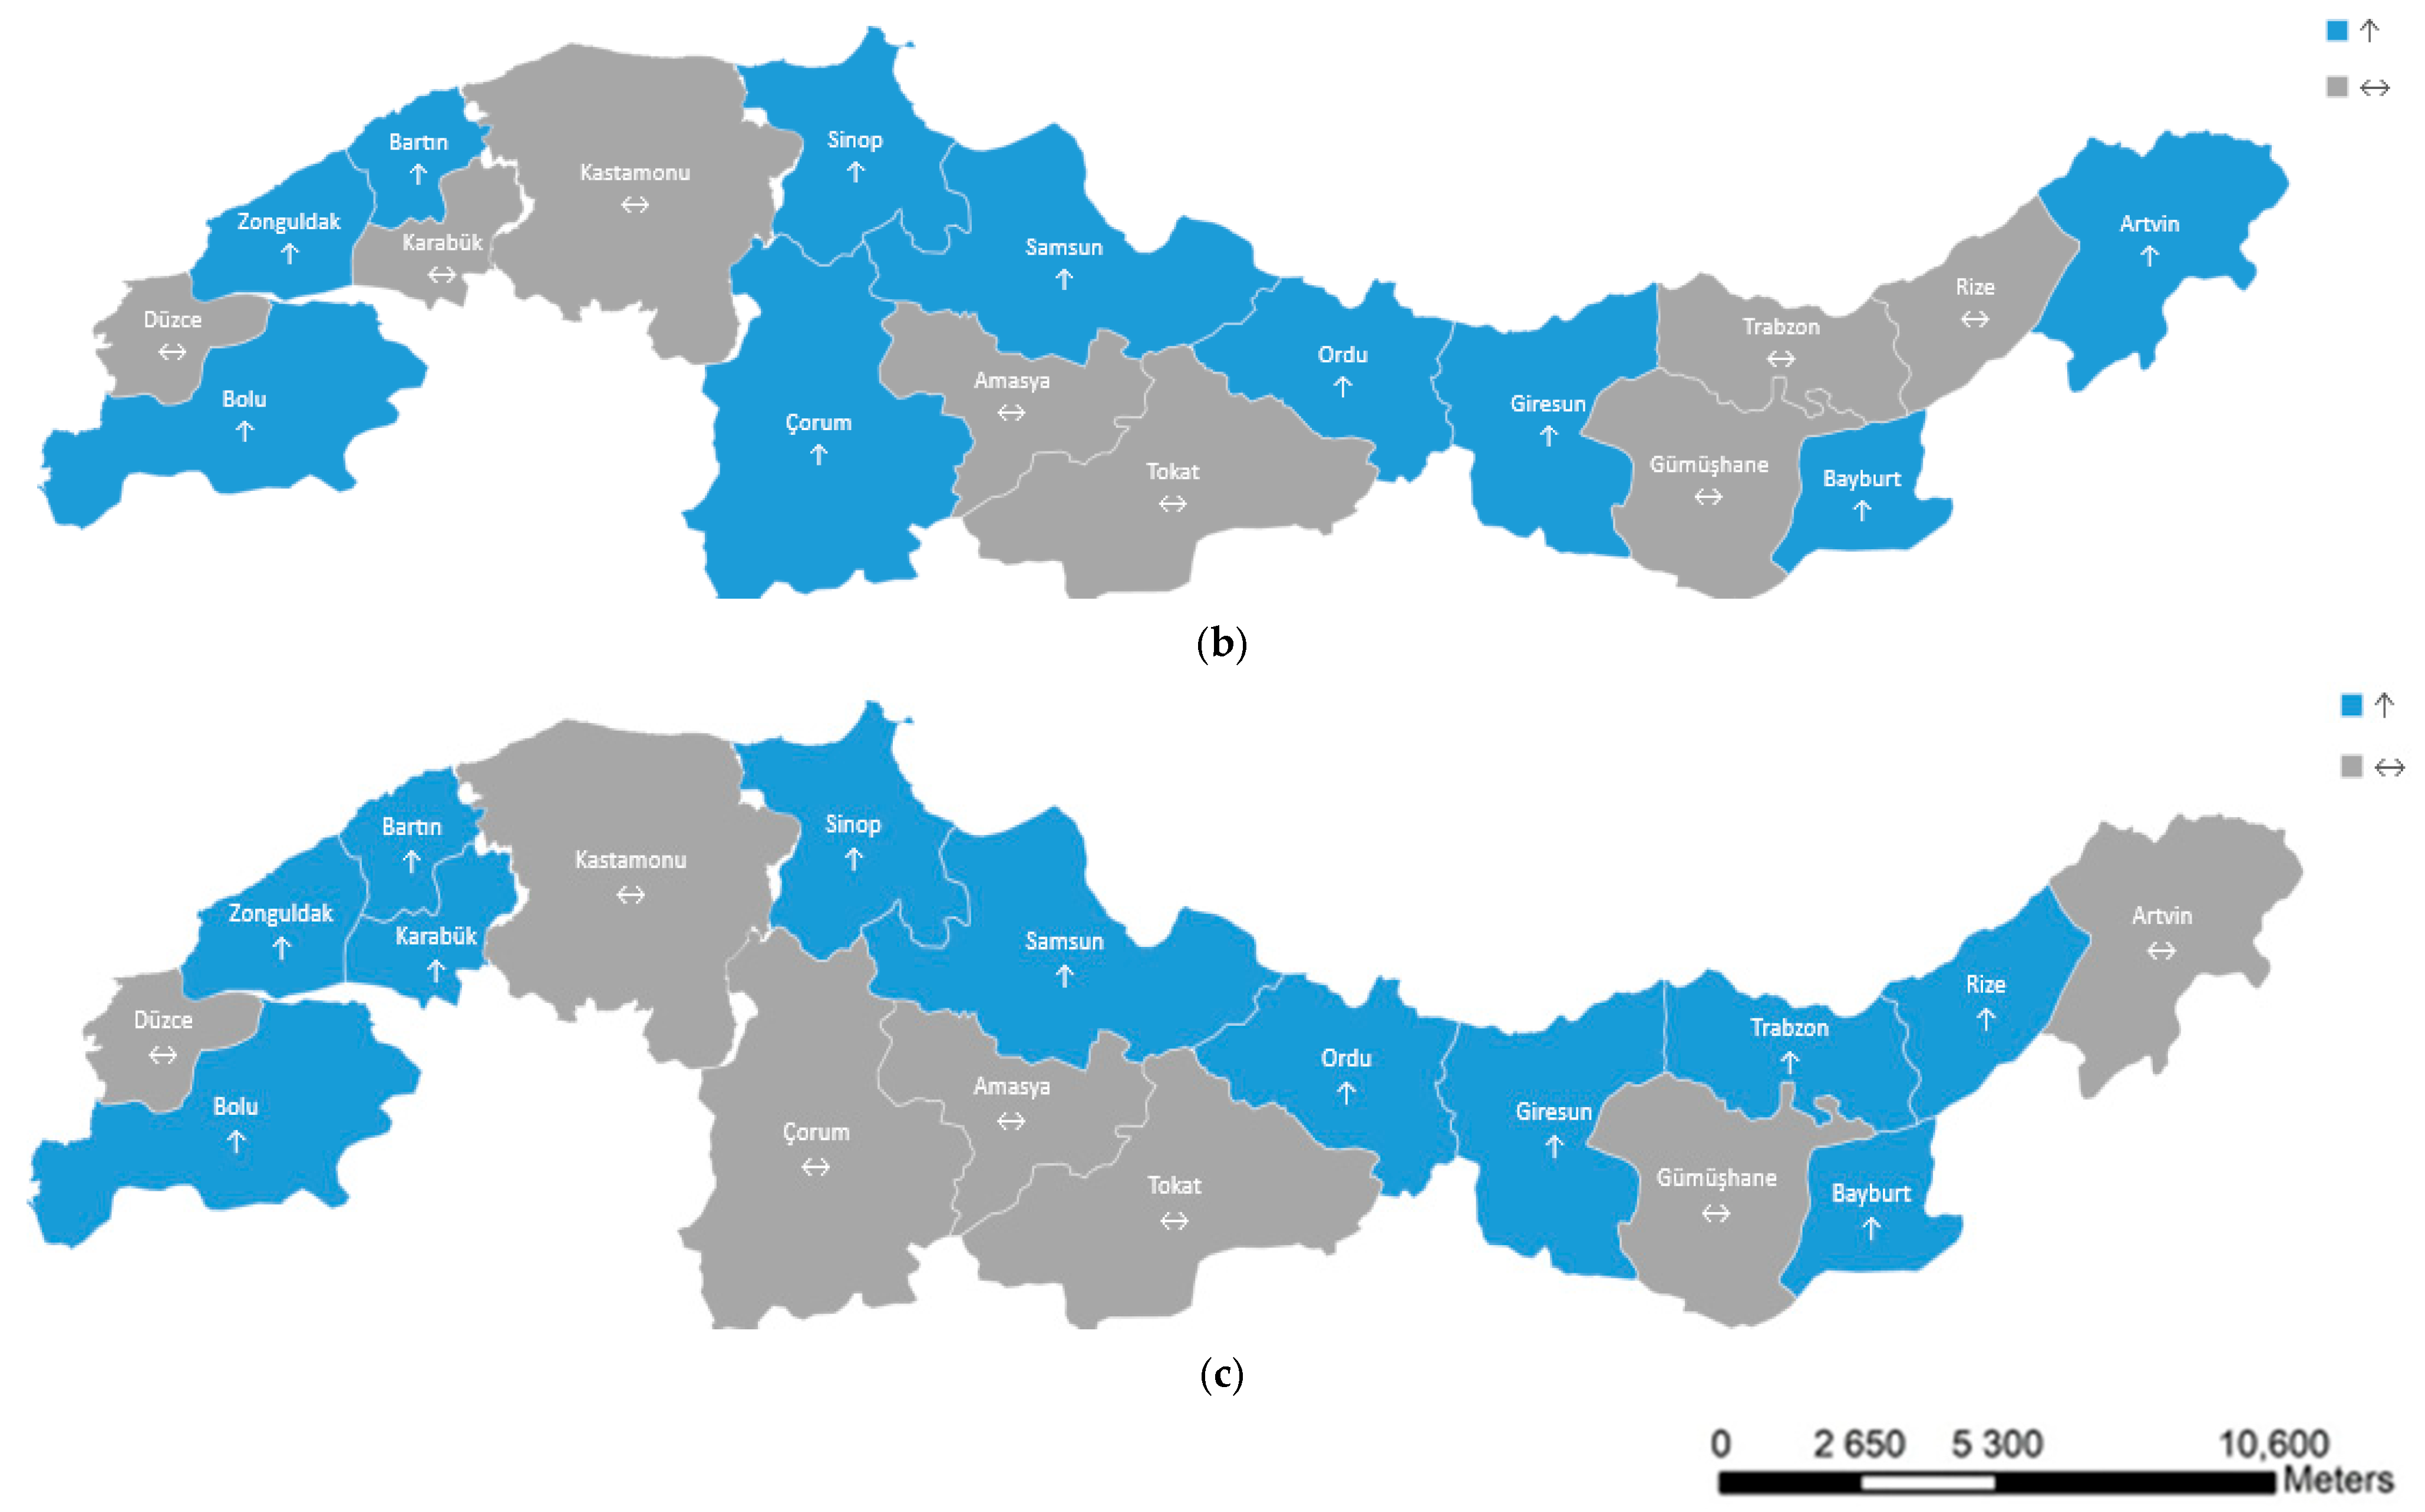
When the ITA test results given in Figure 3 were analyzed regionally, despite the increasing trend seen in Bartın, Bolu, Düzce, Sinop, and Zonguldak Provinces of the western Black Sea region according to the BC method, there was no trend in Karabük and Kastamonu Provinces. According to the TR method, there was no increasing trend in Bartın, Bolu, Sinop, and Zonguldak Provinces, while there was no increasing trend in Düzce, Karabük, and Kastamonu Provinces. According to the TR method, there was an increasing trend in the provinces of Bartın, Bolu, Sinop, and Zonguldak, while there was no increasing trend in the provinces of Düzce, Karabük, and Kastamonu. According to the ITA test, an increase was observed in Bartın, Bolu, Sinop, and Zonguldak Provinces under all trend tests. In addition, there was no common trend in Kastamonu Province.
In the central Black Sea region, Ordu and Samsun showed an increasing trend according to the BC method; Çorum, Ordu, and Samsun according to the TR method; and Ordu and Samsun according to the CT method. However, no trend was found in Amasya, Çorum, and Tokat under the BC method; Amasya and Tokat with the TR method; and Amasya, Çorum, and Tokat with the CT method. Thematic maps of the Black Sea region prepared according to trend analyses are given in Figure 3.
According to the thematic maps given in Figure 3, created according to the ITA test, there was an increasing trend in Artvin, Bayburt, Giresun, and Trabzon Provinces according to BC method in the eastern Black Sea region; Artvin, Bayburt, and Giresun according to the TR method; and Bayburt, Giresun, Trabzon, and Rize Provinces according to the CT method. However, no trend was found in Gümüşhane and Rize with the BC method; Trabzon, Rize, and Gümüşhane under the TR method; and Artvin and Gümüşhane with the CT method. In the provinces of Bayburt and Giresun in the region, no common increase was found according to all ET0 methods, while in the province of Gümüşhane, no common trend was found.

3.3.3. Trend Results According to Sen’s Slope (SS) Test

According to the trend analysis of all provinces in the Black Sea region according to the SS test, an increase was observed in the BC formula in all western provinces of the region. With the TR method, which is the other ET0 formula in the study, there was an increase in six provinces, while there was no trend in one province. When evaluated in terms of the CT method, there was an increase trend in six provinces, but no trend was found in one province. No decreasing trend was observed in the trend analysis studies given in Table 7, which were conducted in all provinces in the region according to the SS test according to the BC, TR, and CT methods. When the SS trends were examined in terms of the central Black Sea region, an increase was found in two provinces, and a trend was not found in three provinces according to the BC, TR, and CT methods. According to all ET0 calculation methods, an intermediate result was obtained in the central Black Sea region according to the SS trend analysis. According to the SS trend analysis, an increase was found in five provinces, and a trend was not found in one province in the eastern Black Sea region according to the BC method. According to the TR method, there was an increase in three provinces, while no trend was found in three provinces. When evaluated in terms of the CT method, there was an increase in four provinces, and there was no trend in two provinces.
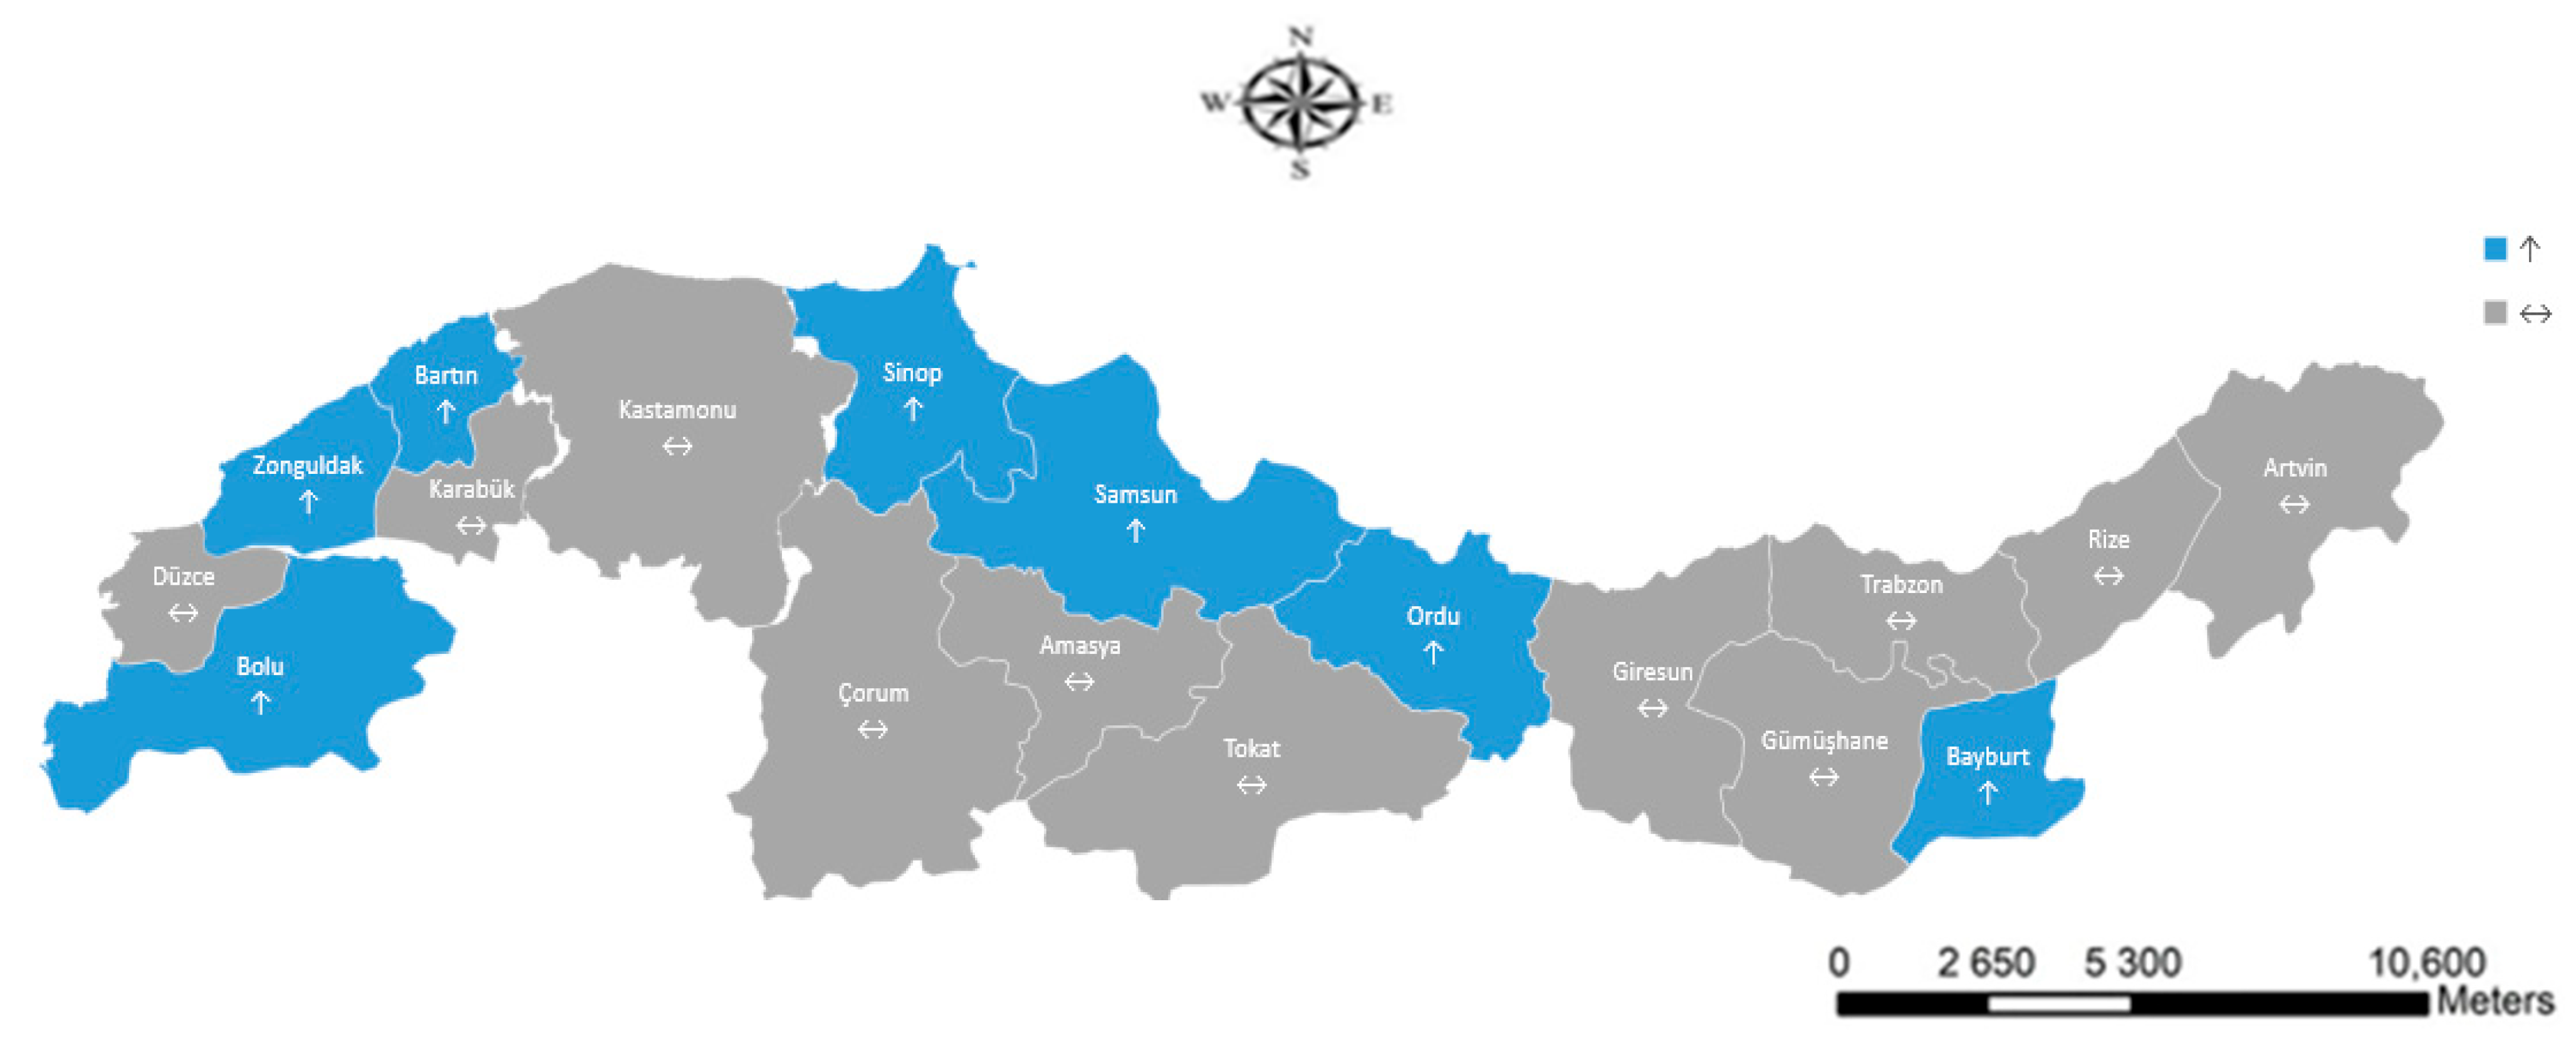
According to the thematic maps created for the trend analysis determined according to the SS test in the research and given in Figure 4, while an increasing trend was seen in all provinces in the western Black Sea region in the BC method, when evaluated in terms of the TR method, there was no trend in Karabük Province, and there was an increase in trend in other provinces in the region. According to the CT method, there was no trend in Düzce Province, but an increase was determined in all other provinces. In the central Black Sea region, there was an increase in Ordu and Samsun Provinces according to all ET0 calculation methods. There was no trend in all other provinces. In the eastern Black Sea region, there was no trend in Gümüşhane Province according to the BC method, and there was an increase in all other provinces. Under the TR method, there was an increase in trend in Bayburt, Giresun, and Rize Provinces and no trend in Artvin, Gümüşhane, and Trabzon Provinces. However, there was no trend in Artvin and Gümüşhane Provinces with the CT method but an increase in trend in all other provinces.

3.3.4. Trend Results According to Spearman’s Rho (SR) Test

According to the amount of trend analysis made according to the SR test given in Table 8 and within the scope of the research, an increase was observed in all provinces in the western Black Sea region according to the BC and TR formulas, and an increase was determined in six provinces according to the CT formula. However, in the central Black Sea region, there were three trend increases in the BC and TR methods, and no trend was found in two trends. with the CT method, there was a trend increase in all provinces except one province. In the eastern Black Sea region, there was no trend found in one province in the BC and TR methods and in two provinces in the CT method. An increase was observed in the other provinces in the region. When evaluated in general, there was no decreasing trend in any region or province according to the SR test.
According to the thematic maps given in Figure 5, according to the SR trend analysis, an increasing trend was observed in all provinces of the western Black Sea region according to the BC and TR methods. According to the CT method, an increasing trend was seen in all provinces except Düzce Province. In the central Black Sea region, according to the CT method, there was an increasing trend in Çorum, Amasya, Ordu, and Samsun Provinces, while there was no trend in all other provinces. In the eastern Black Sea region, there was no trend in Giresun with the BC and TR methods and in Artvin and Giresun Provinces in CT method. An increasing trend was seen in all other provinces.

4. Discussion

Calculation of ET0 values according to time series and estimation according to trend analysis have come to the forefront as an effective method, especially since they can better determine more complex patterns in the data [85]. In the study, it was observed that an increase occurred mainly in ET0 values. In a study conducted in the eastern provinces of the Black Sea region, a trend analysis was conducted in terms of drought in terms of temperature, precipitation, evaporation, and wind conditions between the years 1960 and 2016 with a 95% confidence interval [86]. According to the results of the study, it was concluded that evaporation increased in the province of Trabzon in the eastern Black Sea region. Similarly, according to ITA, SS, and SR trend analyses in the study, an increase was experienced in the current provinces. In addition, since more trend-testing methods were used in the study, it was observed that different provinces in the region tended to increase more comprehensively.
In another study conducted in the Black Sea region, the authors attempted to reveal the drought trend using different hydrological models according to data from 1973 to 2006 [87]. The results of the study are similar to that of the present research and indicated that drought values are increasing. Similarly, in a different study, the evapotranspiration trend for future periods was revealed using MK, SS, ITA, and SR tests in Bayburt and Gümüşhane Provinces in the eastern Black Sea region between 1965 and 2018 [88]. Although the results of the study are generally similar to that of the present research, they indicated an increase in drought. In a study conducted in the western Black Sea region, a trend analysis was conducted in order to reveal the drought trends of the region. In the study, the trend tendency of rainfall and flow conditions was revealed using MK, ITA, SS, and SR tests. According to the results of the study, it was concluded that there was a decrease in rainfall and flow conditions and that drought was increasing [89]. In general, the studies conducted in the Black Sea region were conducted regionally, namely in the western, central, or eastern Black Sea regions, unlike the present study, which covered the entire western, central, and eastern Black Sea region.
In another study, trend analysis was conducted in Iran between 1965 and 2005 according to ET0 values, and MK and SR tests were used [31]. Similarly, in the ET0 trend analysis study conducted in the Marmara region, the trend in the region was determined using MK and SS tests [90]. The conducted studies gave consistent results at a 5% significance level, as confirmed by the research, between MK and SR tests. In another study, ET0 trend analysis was conducted in the Punjab region of India between 1980 and 2021 [37]. In the study results, the ITA and SS trend analyses showed similar values. Although there were differences in some provinces in ITA and SS trend values within the scope of the study, similar results were obtained. When the studies were evaluated, it was seen that the trend tests used were generally two different tests, e.g., MK-ITA, ITA-SR, or MK-SS. In the study, the use of MK, ITA, SS, and SR tests in a more comprehensive manner allowed the trend to be revealed in more detail. In addition, differences between trend methods were obtained in this way.
In Turkey, from the point of view of evapotranspiration values in the Konya region, especially under the BC method, there was an increasing trend, and differentiation was a good alternative [91]. According to the results, a higher change was seen in the 2016 ET0 values compared to 2015, which showed an increase or decrease in the effect. According to the climate reference evaporation data estimated and according to the observations, some changes affected the performances of the models [92]. In another climate, the correct results under the BC method of the ET0 values in the Kahramanmaraş Province and the region showed an increasing trend [18]. Similarly, in the Black Sea region, according to the BC method, there was no regional and no decreasing trend in the ET0 values. In general, no increasing maintenance features or trends were found.
In a study conducted in the Peloponnese Peninsula of Greece between 2016 and 2019 using the TR and CT methods, the annual ET0 values calculated with both methods gave very close results [93]. In addition, in another study similar to the present research, it was determined that the results obtained with the TR formula were generally close to the ET0 values determined with the BC and CT formulas [94].
In another similar study, trend analysis was performed using TR and CT methods according to ET0 values between 1950 and 2015 in Niğde Province [95]. The MK test was used in the study, and an increasing trend result was obtained in terms of trend. Due to the positive values obtained, it was concluded that the irrigation need in this region may increase in the future. Similarly, the fact that the values generally show a positive trend according to the results of MK and other trend tests in the Black Sea region may lead to the conclusion that the irrigation need may increase in the same way. However, in a different study conducted on the Setif Plateau, the correlation coefficients between the TR and CT trends of the ET0 values between 1981 and 2014 were found to be significantly high [96]. Similarly, the obtained correlation coefficients between TR-CT, BC-TR, and BC-CT were significantly high in the study.
Within the scope of the literature information provided above, it is seen that the conducted ET0 trend analysis studies are generally carried out at the provincial level or regionally, i.e., in a single subregion. In addition, one or two trend tests were used in these studies, and the results were determined according to the obtained trends. As a different approach in our research, provinces with different trends and ET0 calculation methods were evaluated more carefully in terms of irrigation management, with comparisons both of provinces within the regions and among the regions. In this context, in addition to evaluating the trend results obtained with MK, ITA, SS, and SR tests separately, provinces that gave common results in all trend tests and all ET0 calculation methods were revealed. Provinces that showed a common increasing trend in all ET0 calculation methods and trend analysis tests are given regionally in Table 9. According to the obtained results, an increasing trend was observed in four provinces in the western Black Sea region, two provinces in the central Black Sea region, and one province in the eastern Black Sea region. When evaluated in percentages, there was an increasing trend of 57% the western Black Sea region, 40% in the central Black Sea region, and 17% in the eastern Black Sea region.
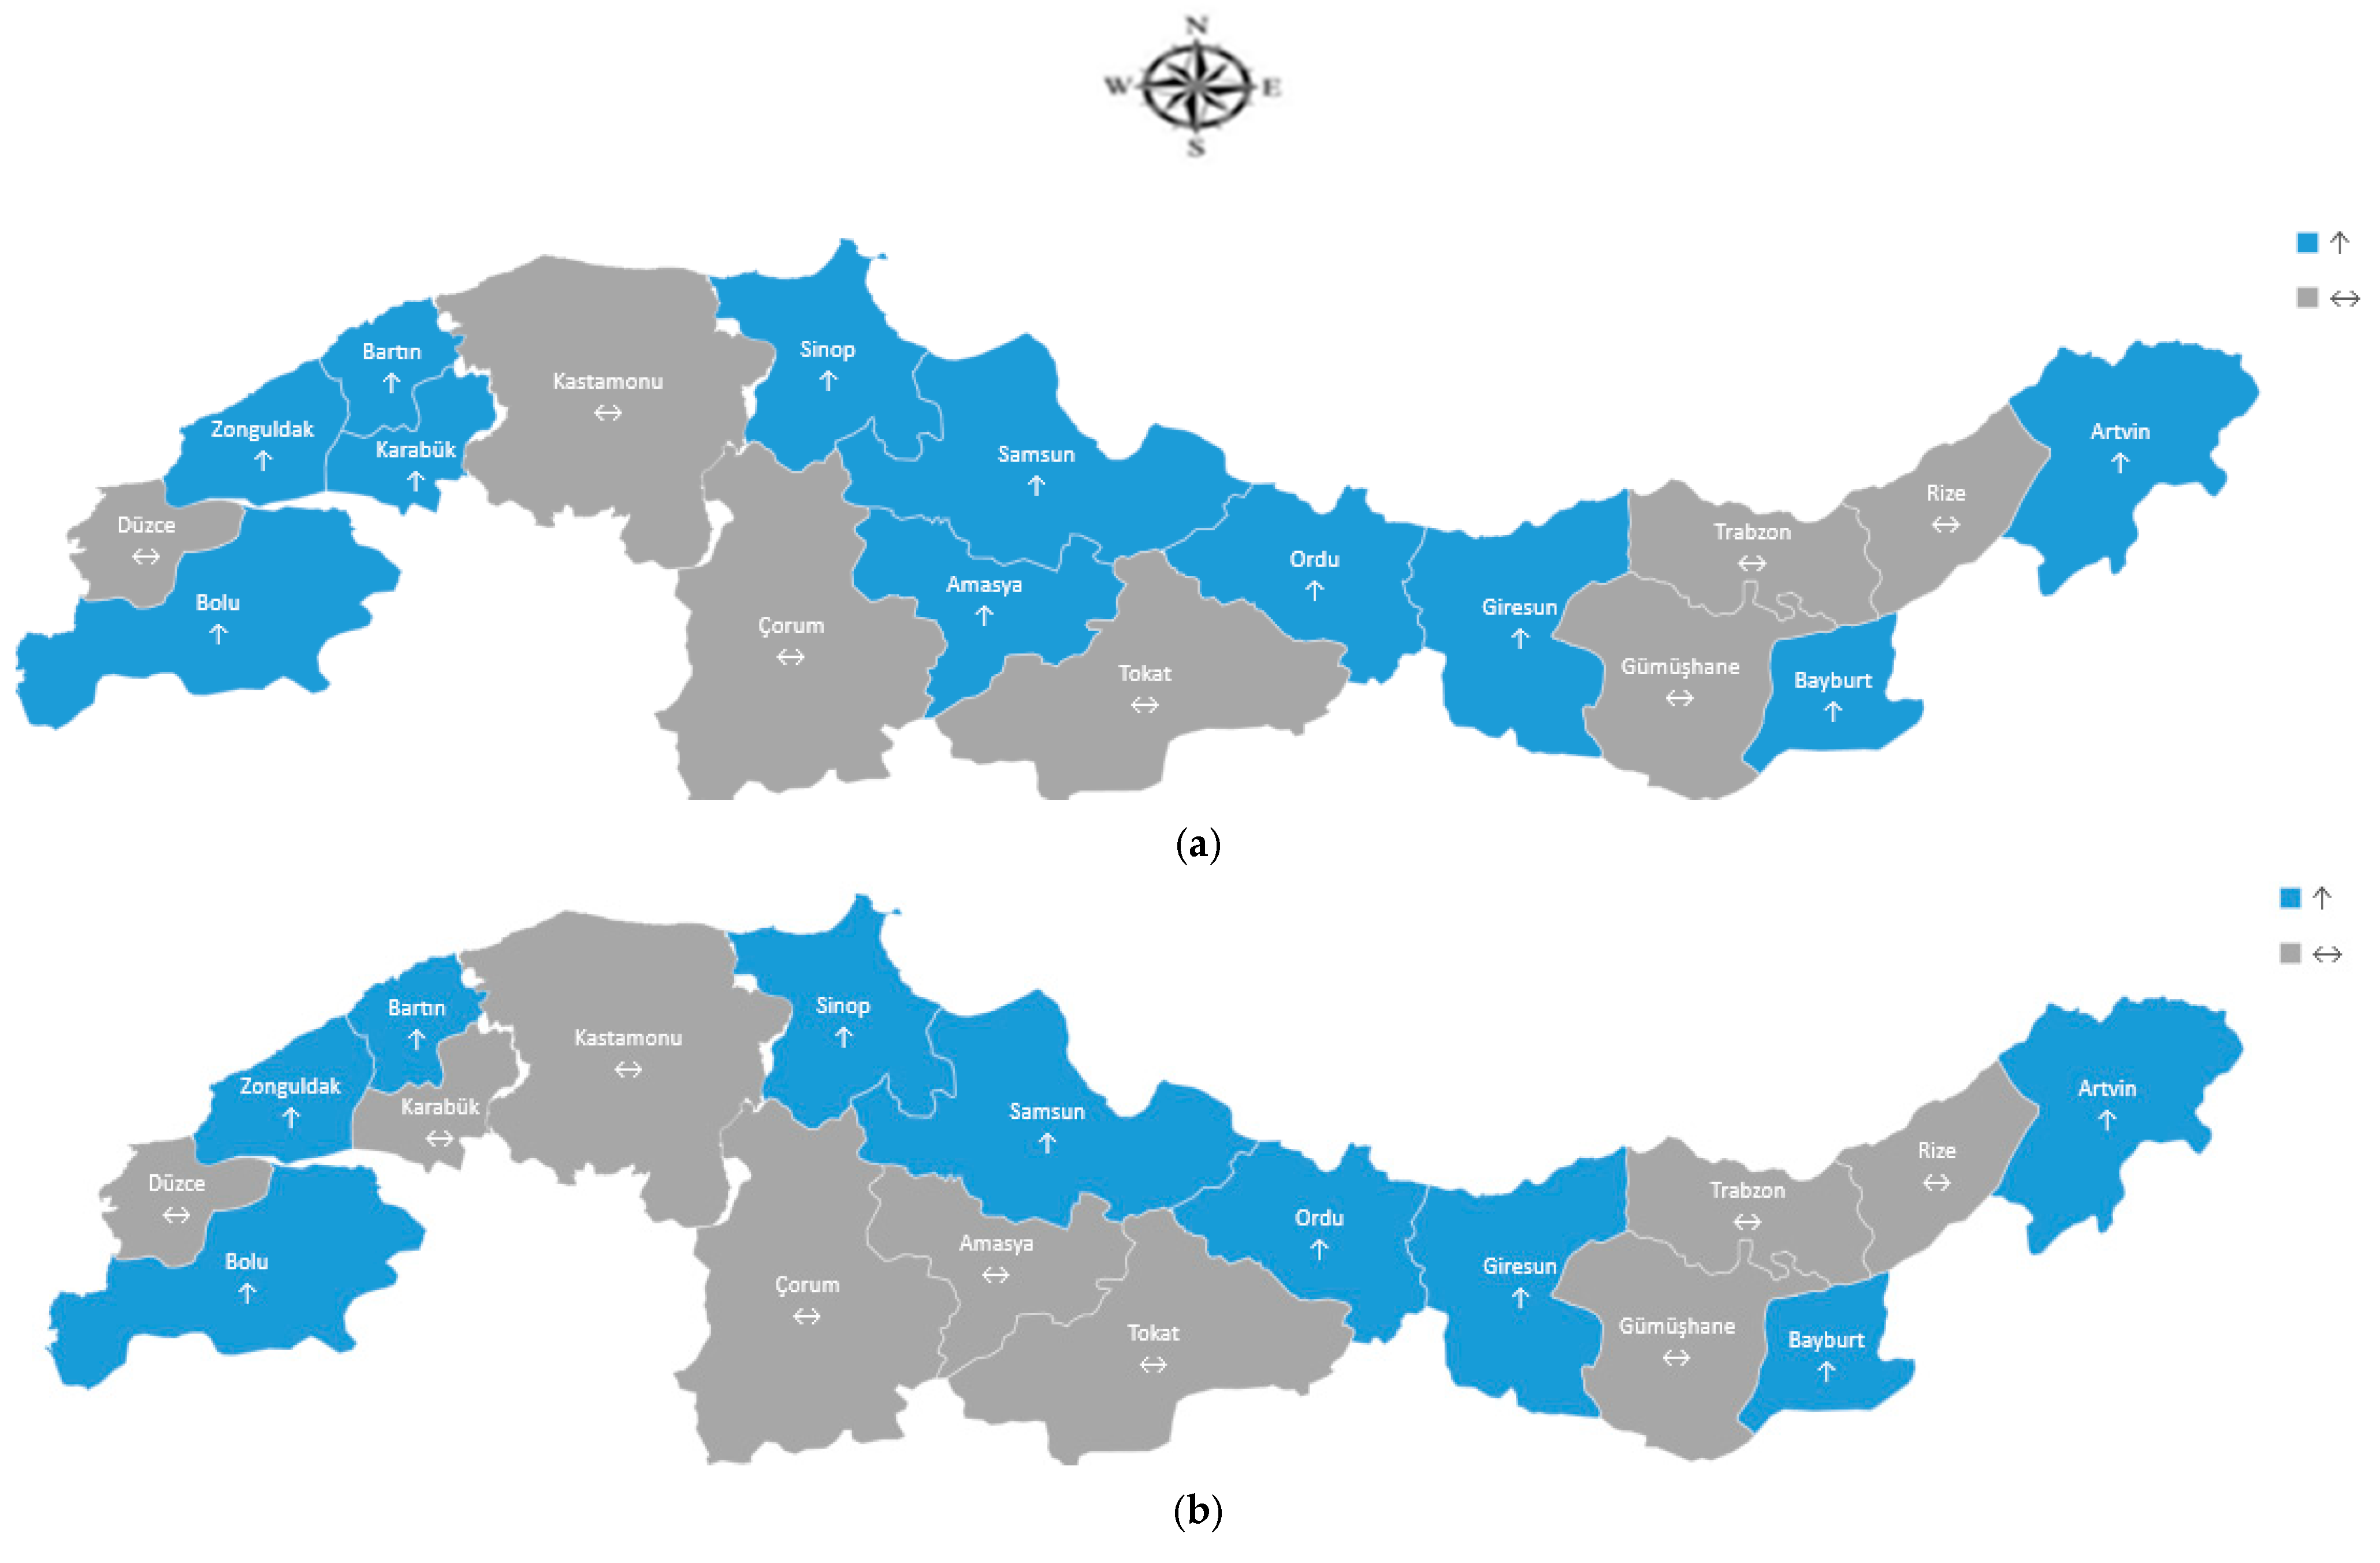
Provinces with an increasing trend according to all ET0 calculation and trend methods in terms of regions are given in Figure 6. According to the findings, there was an increasing trend in Bartın, Bolu, Sinop, and Zonguldak in the western Black Sea region; Ordu and Samsun in the central Black Sea region; and Bayburt in the eastern Black Sea region. However, provinces with an increasing trend according to different ET0 calculation methods compared in the single trend analysis method were also taken into consideration in terms of irrigation management, and as a result of the different approach used in the research, the provinces with an increasing trend given in figure should be evaluated more carefully.

5. Conclusions

This study revealed the increasing ET0 values in the Black Sea region with a different approach that can be used in international regions, countries, and provinces for ET0 estimation in irrigation management in terms of the high impact of climate change. In this context, ET0 values for the region and provinces were examined with meticulous research using four different trend analysis tests and three different ET0 calculation methodologies. With the different approach followed in the study, it was concluded that the highest ET0 increasing trend was experienced in the western Black Sea region, while the central and eastern Black Sea regions also followed this trend. However, when examined in terms of ET0, it was seen that the values calculated with BC, TR, and CT generally had a statistically significant correlation with each other. Although there was a general increase in the region in terms of trends, there were also provinces with no trend. However, the fact that there was no decreasing trend in any of the four different trend analysis tests indicates that there may be a drought problem in the region.
With this new approach applied within the scope of the research, an increasing trend was observed in the provinces of Bolu, Zonguldak, Bartın, Sinop, Samsun, Ordu, and Bayburt according to the ET0 trends seen in the provinces in the Black Sea region. This trend was obtained according to the new approach. In this context, the provinces with an increasing trend stand out as the provinces that create a common trend increase according to the four different trend tests and three different ET0 measurement methods. In addition, according to the new approach values, a decrease in trend was not determined in any province in the region. This situation indicates that drought conditions may be seen in the Black Sea region in general in the coming periods and that this situation is much more prominent, especially in the provinces of Bolu, Zonguldak, Bartın, Sinop, Samsun, Ordu, and Bayburt.
When the statistically obtained correlation coefficients were evaluated, the fact that values above the coefficient of 0.9 were obtained in almost all of the western, central, and eastern parts of the region shows that the BC-TR and CT methods create a high correlation with each other. In this context, it can be concluded that the relevant ET0 calculation methods can be used as a substitute calculation method for each other.
The research emphasizes that the provinces in the western regions of the Black Sea region may need more irrigation in the future. Our different approach created with Geographic Information System (GIS) methods was determined as a relatively more consistent and comprehensive method for spatial ET0 estimations. Especially for decision-making and regulatory institutions, the new approach has the advantage of obtaining more comprehensive results in terms of irrigation management. As a result, it can be said that it is a method that can be used as an alternative in future water and irrigation policies in climatic drought and ET0 estimations and can provide a comprehensive ET0 estimation opportunity. The new approach was used to represent a region within the scope of the research. In addition, this new approach is a method that can make a significant contribution to the re-planning of drinking, usage, and agricultural water consumption patterns of products grown at the regional, national, and province levels, with its use supported by different ET0 calculations for different regions and provinces.

Supplementary Materials

The following supporting information can be downloaded at: https://www.mdpi.com/article/10.3390/su17146531/s1, Table S1: Reference Evapotranspiration (ET0) Values of the Western Black Sea Region; Table S2: Reference Evapotranspiration (ET0) Values of the Central Black Sea Region; Table S3: Reference Evapotranspiration (ET0) Values of the Eastern Black Sea Region.

Funding

This research received no external funding.

Institutional Review Board Statement

Not applicable.

Informed Consent Statement

Not applicable.

Data Availability Statement

Data are contained within the article.

Conflicts of Interest

The authors declare no conflicts of interest.

References

  1. Van Dam, J.C.; Singh, R.; Bessembinder, J.J.E.; Leffelaar, P.A.; Bastiaanssen, W.G.M.; Jhorar, R.K.; Droogers, P. Assessing options to increase water productivity in irrigated river basins using remote sensing and modelling tools. Water Resour. Dev. 2006, 22, 115–133. [Google Scholar] [CrossRef]
  2. Allen, R.G.; Pereira, L.S.; Raes, D.; Smith, M. Crop Evapotranspiration-Guidelines for Computing Crop Water Requirement; FAO Publishing: Roma, Italy, 1998; 300p. [Google Scholar]
  3. Bastiaanssen, W.G.; Harshadeep, N.R. Managing scarce water resources in Asia: The nature of the problem and can remote sensing help? Irrig. Drain. Syst. 2005, 19, 269–284. [Google Scholar] [CrossRef]
  4. Allen, R.G.; Pereira, L.S.; Smith, M.; Raes, D.; Wright, J.L. FAO-56 dual crop coefficient method for estimating evaporation from soil and application extensions. J. Irrig. Drain. Eng. 2005, 131, 2–13. [Google Scholar] [CrossRef]
  5. Allen, R.G.; Tasumi, M.; Morse, A.; Trezza, R.; Wright, J.L.; Bastiaanssen, W.; Robison, C.W. Satellite-based energy balance for mapping evapotranspiration with internalized calibration (METRIC)—Applications. J. Irrig. Drain. Eng. 2007, 133, 395–406. [Google Scholar] [CrossRef]
  6. Berle, D.C.; Harrison, K.A.; Seymour, R.M.; Wade, G.L.; Waltz, C.; Westerfield, R. Best Management Practices for Landscape Water Conservation; University of Georgia Publishing: Athens, Greece, 2007; 51p. [Google Scholar]
  7. Guitjens, J.C. Models of alfalfa yield and evapotranspiration. J. Irrig. Drain. Div. 1982, 108, 212–222. [Google Scholar] [CrossRef]
  8. Harbeck, G.E. A Practical Field Technique for Measuring Reservoir Evaporation Utilizing Mass-Transfer Theory; US Government Printing Office: Washington, DC, USA, 1962; pp. 101–105. [Google Scholar]
  9. Karimi, S.; Shiri, J.; Marti, P. Supplanting missing climatic inputs in classical and random forest models for estimating reference evapotranspiration in humid coastal areas of Iran. Comput. Electron. Agric. 2020, 176, 105633. [Google Scholar] [CrossRef]
  10. El-Zawily, H.M.A.; Abo El-Enin, M.M.S.; Elmenofy, H.M.; Hassan, I.F.; Manolikaki, I.; Koubouris, G.; Alam-Eldein, S.M. Improving Yield and Quality of ‘Balady’ Mandarin Trees by Using Shading Techniques and Reflective Materials in Response to Climate Change Under Flood Irrigation Conditions. Agronomy 2024, 14, 2456. [Google Scholar] [CrossRef]
  11. Blaney, H.F.; Criddle, W.D. Determining Water Requirements in Irrigation Areas from Climatological and Irrigation Data; United States Department of Agriculture, Soil Conservation Service: Washington, DC, USA, 1950; 48p. [Google Scholar]
  12. Turc, L. Evaluation des besoins en eau d’irrigation, évapotranspiration potentielle. Ann. Agron. 1961, 12, 13–49. [Google Scholar]
  13. Coutagne, A. Quelques considérations sur le pouvoir évaporant de l’atmosphère, le déficit d’écoulement effectif et le déficit d’écoulement maximum. Houille Blanche 1954, 3, 360–374. [Google Scholar] [CrossRef]
  14. Blaney, H.F.; Criddle, W.D. Determining Consumptive Use and Irrigation Water Requirements; Technical Bulletin No. 1275; United States Department of Agriculture in Cooperation with the Office of Utah State Engineer: Washington, DC, USA, 1962; 59p. [Google Scholar]
  15. Tabari, H. Evaluation of reference crop evapotranspiration equations in various climates. Water Resour. Manag. 2010, 24, 2311–2337. [Google Scholar] [CrossRef]
  16. Moradi, A. Evaluation of the FAO Proposed Models for Reference Crop Evapotranspiration (ET0) Estimation in Hajiabad Watershed of Hormozgan Province. J. Watershed Manag. Res. 2023, 36, 121–133. [Google Scholar] [CrossRef]
  17. Abdelraouf, R.E.; El-Shawadfy, M.A.; Bakry, A.B.; Abdelaal, H.K.; El-Shirbeny, M.A.; Ragab, R.; Belopukhov, S.L. Estimating ET0 and scheduling crop irrigation using Blaney–Criddle equation when only air-temperature data are available and solving the issue of missing meteorological data in Egypt. BIO Web Conf. 2024, 82, 02020. [Google Scholar] [CrossRef]
  18. Uzunlar, A. Novel Approaches for the Empirical Assessment of Evapotranspiration over the Mediterranean Region. Water 2024, 16, 507. [Google Scholar] [CrossRef]
  19. Yang, H.; Shukla, M.K.; Gonzalez, A.; Yuan, Y. Determination of Crop Coefficients for Flood-Irrigated Winter Wheat in Southern New Mexico Using Three ET0 Estimation Methods. Water 2024, 16, 2463. [Google Scholar] [CrossRef]
  20. Zhang, L.; Zhao, X.; Ge, J.; Zhang, J.; Traore, S.; Fipps, G.; Luo, Y. Evaluation of five equations for short-term reference evapotranspiration forecasting using public temperature forecasts for North China Plain. Water 2022, 14, 2888. [Google Scholar] [CrossRef]
  21. Yoder, R.E.; Odhiambo, L.O.; Wright, W.C. Evaluation of methods for estimating daily reference crop evapotranspiration at a site in the humid southeast United States. Appl. Eng. Agric. 2005, 21, 197–202. [Google Scholar] [CrossRef]
  22. Fisher, D.K.; Pringle, H.C. Evaluation of alternative methods for estimating reference evapotranspiration. Agric. Sci. 2013, 4, 51–60. [Google Scholar] [CrossRef]
  23. Pandey, P.K.; Dabral, P.P.; Pandey, V. Evaluation of reference evapotranspiration methods for the northeastern region of India. Int. Soil Water Conserv. Res. 2016, 4, 52–63. [Google Scholar] [CrossRef]
  24. Srivastava, A.; Sahoo, B.; Raghuwanshi, N. Evaluation of Variable-Infiltration Capacity Model and MODIS-Terra Satellite-Derived Grid-Scale Evapotranspiration Estimates in a River Basin with Tropical Monsoon-Type Climatology. J. Irrig. Drain. Eng. 2017, 143, 04017028. [Google Scholar] [CrossRef]
  25. Ruggieri, G.; Allocca, V.; Borfecchia, F.; Cusano, D.; Marsiglia, P.; De Vita, P. Testing evapotranspiration estimates based on MODIS satellite data in the assessment of the groundwater recharge of karst aquifers in southern Italy. Water 2021, 13, 118. [Google Scholar] [CrossRef]
  26. Birsan, M.V.; Molnar, P.; Burlando, P.; Pfaundler, M. Streamflow trends in Switzerland. J. Hydrol. 2005, 314, 312–329. [Google Scholar] [CrossRef]
  27. Norrant, C.; Douguedroit, A. Monthly and daily precipitation trends in the Mediterranean (1950–2000). Theor. Appl. Climatol. 2006, 83, 89–106. [Google Scholar] [CrossRef]
  28. Renard, B.; Lang, M.; Bois, P.; Dupeyrat, A.; Mestre, O.; Niel, H.; Sauquet, E. Evolution des extrêmes hydrométriques en France à partir de données observées. Houille Blanche 2006, 92, 48–54. [Google Scholar] [CrossRef]
  29. Zhao, D.; Zheng, D.; Wu, S.; Wu, Z. Climate changes in northeastern China during the last four decades. Chin. Geogr. Sci. 2007, 17, 317–324. [Google Scholar] [CrossRef]
  30. Tabari, H.; Somee, B.S.; Zadeh, M.R. Testing for long-term trends in climatic variables in Iran. Atmos. Res. 2011, 100, 132–140. [Google Scholar] [CrossRef]
  31. Shadmani, M.; Marofi, S.; Roknian, M. Trend analysis in reference evapotranspiration using Mann-Kendall and Spearman’s Rho tests in arid regions of Iran. Water Resour. Manag. 2012, 26, 211–224. [Google Scholar] [CrossRef]
  32. Darshana, P.; Pandey, A.; Pandey, R.P. Analysing trends in reference evapotranspiration and weather variables in the Tons River Basin in Central India. Stoch. Environ. Res. Risk Assess. 2013, 27, 1407–1421. [Google Scholar] [CrossRef]
  33. Li, G.; Zhang, F.; Jing, Y.; Liu, Y.; Sun, G. Response of evapotranspiration to changes in land use and land cover and climate in China during 2001–2013. Sci. Total Environ. 2017, 596, 256–265. [Google Scholar] [CrossRef]
  34. Amirataee, B.; Montaseri, M.; Sanikhani, H. The analysis of trend variations of reference evapotranspiration via eliminating the significance effect of all autocorrelation coefficients. Theor. Appl. Climatol. 2016, 126, 131–139. [Google Scholar] [CrossRef]
  35. Shan, N.; Shi, Z.; Yang, X.; Zhang, X.; Guo, H.; Zhang, B.; Zhang, Z. Trends in potential evapotranspiration from 1960 to 2013 for a desertification-prone region of China. Int. J. Climatol. 2016, 36, 3434–3445. [Google Scholar] [CrossRef]
  36. Yong, S.L.S.; Ng, J.L.; Huang, Y.F.; Ang, C.K. Innovative trend analysis of reference crop evapotranspiration in peninsular Malaysia. IOP Conf. Ser. Earth Environ. Sci. 2022, 1022, 012071. [Google Scholar] [CrossRef]
  37. Madane, D.A.; Bankey, H.; Sharda, R. Spatio-temporal variations of reference evapotranspiration using Innovative and Mann–Kendall trend analysis under limited weather data in semi-arid region of Indian Punjab. Theor. Appl. Climatol. 2024, 155, 6507–6528. [Google Scholar] [CrossRef]
  38. Ha, P.T.; Phuong, D.N.D.; Anh, H.H.; Tu, L.H.; Vuong, N.D.; Loi, N.K. Quantitative exploration of the innovative trend method for evapotranspiration and its sensitivity to climatic variables: The case study of Southeast Vietnam. Earth Sci. Inform. 2024, 17, 299–314. [Google Scholar] [CrossRef]
  39. Dia, R.B.; Mallick, J.; Aziz, T.; Fattah, M.A.; Ullah, S.; Salam, M.A.; Islam, A.R.M.T. Comparative Trend Variability Analysis of Reference Evapotranspiration in Bangladesh Using Multiple Trend Detection Approaches. Theor. Appl. Climatol. 2024, 155, 6965–6982. [Google Scholar] [CrossRef]
  40. Ashraf, M.S.; Shahid, M.; Waseem, M.; Azam, M.; Rahman, K.U. Assessment of variability in hydrological droughts using the improved innovative trend analysis method. Sustainability 2023, 15, 9065. [Google Scholar] [CrossRef]
  41. Mohsin, S.; Lone, M.A. Trend analysis of reference evapotranspiration and identification of responsible factors in the Jhelum River Basin, Western Himalayas. Model. Earth Syst. Environ. 2021, 7, 523–535. [Google Scholar] [CrossRef]
  42. Aschale, T.M.; Peres, D.J.; Gullotta, A.; Sciuto, G.; Cancelliere, A. Trend analysis and identification of the meteorological factors influencing reference evapotranspiration. Water 2023, 15, 470. [Google Scholar] [CrossRef]
  43. Jerin, J.N.; Islam, H.M.; Islam, A.R.M.; Shahid, S.; Hu, Z.; Badhan, M.A.; Elbeltagi, A. Spatiotemporal trends in reference to evapotranspiration and its driving factors in Bangladesh. Theor. Appl. Climatol. 2021, 144, 793–808. [Google Scholar] [CrossRef]
  44. Nasrollahi, M.; Zolfaghari, A.A.; Yazdani, M.R. Spatial and temporal properties of reference evapotranspiration and its related climatic parameters in the main agricultural regions of Iran. Pure Appl. Geophys. 2021, 178, 4159–4179. [Google Scholar] [CrossRef]
  45. Solaimani, K.; Ahmadi, S.B. Evaluation of TerraClimate gridded data in investigating the changes of reference evapotranspiration in different climates of Iran. J. Hydrol. Reg. Stud. 2024, 52, 101678. [Google Scholar] [CrossRef]
  46. Gul, S.; Ren, J.; Xiong, N.; Khan, M.A. Design and analysis of statistical probability distribution and non-parametric trend analysis for reference evapotranspiration. PeerJ 2021, 9, e11597. [Google Scholar] [CrossRef] [PubMed]
  47. Sabino, M.; da Silva, A.C.; de Almeida, F.T.; de Souza, A.P. Reference evapotranspiration in climate change scenarios in Mato Grosso, Brazil. Hydrology 2024, 11, 91. [Google Scholar] [CrossRef]
  48. Di Nunno, F.; Diodato, N.; Bellocchi, G.; Tricarico, C.; de Marinis, G.; Granata, F. Evapotranspiration Analysis in Central Italy: A Combined Trend and Clustering Approach. Climate 2024, 12, 64. [Google Scholar] [CrossRef]
  49. Lee, S.; Moriasi, D.N.; Mehr, A.D.; Mirchi, A. Sensitivity of Standardized Precipitation and Evapotranspiration Index (SPEI) to the choice of SPEI probability distribution and evapotranspiration method. J. Hydrol. Reg. Stud. 2024, 53, 101761. [Google Scholar] [CrossRef]
  50. Di Nunno, F.; De Matteo, M.; Izzo, G.; Granata, F.A. Combined clustering and trends analysis approach for characterizing reference evapotranspiration in Veneto. Sustainability 2023, 15, 11091. [Google Scholar] [CrossRef]
  51. MEVBIS, The Meteorological Data Information Presentation and Sales System User’s Manuel, the Turkiye State Meteorological Service, TC Ministry of Forest and Water, Ankara, Turkiye. Available online: https://mevbis.mgm.gov.tr/mevbis/ui/HelpMenu/MEVBIS_Kullanim_Kilavuzu.pdf (accessed on 19 July 2024).
  52. MGM, Meteorological Station Information Database, TC Ministry of Forest and Water, Ankara, Turkiye. Available online: https://www.mgm.gov.tr/site/urunler.aspx?u=tum (accessed on 15 June 2024).
  53. Bucchianico, A.D. Coefficient of Determination (R2). In Encyclopedia of Statistics in Quality and Reliability; John Wiley & Sons, Ltd.: Hoboken, NJ, USA, 2008. [Google Scholar]
  54. Barrett, G.B. The coefficient of determination: Understanding r squared and R squared. Math. Teach. 2000, 93, 230–234. [Google Scholar] [CrossRef]
  55. Shen, Q.; Faraway, J. An F test for linear models with functional responses. Stat. Sin. 2004, 14, 1239–1257. [Google Scholar]
  56. Yang, X.; Shen, Q.; Xu, H.; Shoptaw, S. Functional regression analysis using an F test for longitudinal data with large numbers of repeated measures. Stat. Med. 2007, 26, 1552–1566. [Google Scholar] [CrossRef]
  57. Nevitt, J.; Hancock, G.R. Improving the root mean square error of approximation for nonnormal conditions in structural equation modeling. J. Exp. Educ. 2000, 68, 251–268. [Google Scholar] [CrossRef]
  58. Hancock, G.R.; Freeman, M.J. Power and sample size for the root mean square error of approximation test of not close fit in structural equation modeling. Educ. Psychol. Meas. 2001, 61, 741–758. [Google Scholar] [CrossRef]
  59. Orhunbilge, N. Applied Regression and Correlation Analysis; İ.Ü. Faculty of Business Publications: İstanbul, Turkiye, 2002; 394p. [Google Scholar]
  60. Yildiz, N.; Akbulut, O.; Bircan, H. Introduction to Statistics; Active Publications: İstanbul, Turkiye, 1999; 326p. [Google Scholar]
  61. Unver, O.; Gamgam, H. Applied Statistical Methods; Political Publishing: Ankara, Türkiye, 1999; 412p. [Google Scholar]
  62. Suzan, U.; Gürgülü, H. Estimation of Reference Evapotranspiration for Isparta Using Multiple Linear Regression Method. J. Adnan Menderes Unıv. Agric. Fac. 2024, 21, 137–143. [Google Scholar]
  63. Türkes, M. Observed and projected climate change, drought and desertification in Turkey. Ank. Univ. J. Environ. Sci. 2012, 4, 1–32. [Google Scholar]
  64. İltir, C. Statistical Data Analysis with Excel; Seçkin Publishing: Ankara, Türkiye, 2019; 344p. [Google Scholar]
  65. Mann, H.B. Nonparametric tests against trend. J. Econom. Soc. 1945, 13, 245–259. [Google Scholar] [CrossRef]
  66. Kendall, M. Rank Correlation Methods; Charles Griffin: London, UK, 1948. [Google Scholar]
  67. Hisdal, H.; Stahl, K.; Tallaksen, L.M.; Demuth, S. Have streamflow droughts in Europe become more severe or more frequent? Int. J. Climatol. 2001, 21, 317–333. [Google Scholar] [CrossRef]
  68. Wu, H.; Soh, L.K.; Samal, A.; Chen, X.H. Trend analysis of streamflow drought events in Nebraska. Water Resour. Manag. 2008, 22, 145–164. [Google Scholar] [CrossRef]
  69. Yue, S.; Pilon, P.; Cavadias, G. Power of the Mann–Kendall and Spearman’s rho tests for detecting monotonic trends in hydrological series. J. Hydrol. 2002, 259, 254–271. [Google Scholar] [CrossRef]
  70. Partal, T.; Kahya, E. Trend analysis in Turkish precipitation data. Hydrol. Process. 2006, 20, 2011–2026. [Google Scholar] [CrossRef]
  71. Modarres, R.; Da Silva, V.D.P.R. Rainfall trends in arid and semi-arid regions of Iran. J. Arid Environ. 2007, 70, 344–355. [Google Scholar] [CrossRef]
  72. Hamed, K.H. Exact distribution of the Mann–Kendall trend test statistics for persistent data. J. Hydrol. 2009, 365, 86–94. [Google Scholar] [CrossRef]
  73. Tabari, H.; Marofi, S.; Aeini, A.; Talaee, P.H.; Mohammadi, K. Trend analysis of reference evapotranspiration in the western half of Iran. Agric. For. Meteorol. 2011, 151, 128–136. [Google Scholar] [CrossRef]
  74. Jaagus, J. Trends in sea ice conditions in the Baltic Sea near the Estonian coast during the period 1949/1950-2003/2004 and their relationships to large-scale atmospheric circulation. Boreal Environ. Res. 2006, 11, 169–183. [Google Scholar]
  75. Şen, Z. An innovative trend analysis methodology. J. Hydrol. Eng. 2012, 17, 1042–1046. [Google Scholar] [CrossRef]
  76. Şen, Z. Trend identification simulation and application. J. Hydrol. Eng. 2014, 19, 635–642. [Google Scholar] [CrossRef]
  77. Sen, P.K. Estimates of the regression coefficient based on Kendall’s tau. J. Am. Stat. Assoc. 1968, 63, 1379–1389. [Google Scholar] [CrossRef]
  78. Sen, P.K. On a class of aligned rank order tests in two-way layouts. Ann. Math. Stat. 1968, 39, 1115–1124. [Google Scholar] [CrossRef]
  79. Lehmann, E.L. Nonparametrics, Statistical Methods Based on Ranks, 2nd ed.; Springer: New York, NY, USA, 2006; 473p. [Google Scholar]
  80. Sneyers, R. On the Statistical Analysis of Series of Observations; Technical Note No. 143, WMO No. 415; World Meteorological Organization: Geneva, Switzerland, 1990; 192p. [Google Scholar]
  81. Dahmen, E.R.; Hall, M.J. Screening of Hydrological Data: Tests for Stationarity and Relative Consistency; International Institute for Land Reclamation and Improvement: Wageningen, The Netherlands, 1990. [Google Scholar]
  82. Cabral Júnior, J.B.; de Almeida, H.A.; Bezerra, B.G.; Spyrides, M.H.C. Detecting linear trend of reference evapotranspiration in irrigated farming areas in Brazil’s semiarid region. Theor. Appl. Climatol. 2019, 138, 215–225. [Google Scholar] [CrossRef]
  83. Gocic, M.; Trajkovic, S. Analysis of precipitation and drought data in Serbia over the period 1980–2010. J. Hydrol. 2013, 494, 32–42. [Google Scholar] [CrossRef]
  84. Jhajharia, D.; Dinpashoh, Y.; Kahya, E.; Singh, V.P.; Fakheri-Fard, A. Trends in reference evapotranspiration in the humid region of northeast India. Hydrol. Process. 2012, 26, 421–435. [Google Scholar] [CrossRef]
  85. Banda, P.; Cemek, B.; Küçüktopcu, E. Estimation of daily reference evapotranspiration by neuro computing techniques using limited data in a semi-arid environment. Arch. Agron. Soil Sci. 2018, 64, 916–929. [Google Scholar] [CrossRef]
  86. Yılmaz, C.; Demir, V.; Sevimli, M.F. Trend Analysis of Meteorological Parameters in the Eastern Black Sea Region Doğu Karadeniz Bölgesi Meteorolojik Parametrelerinin Trend Analizi. Eur. J. Sci. Technol. 2021, 24, 489–496. [Google Scholar] [CrossRef]
  87. Rouholahnejad Freund, E.; Abbaspour, K.C.; Lehmann, A. Water resources of the Black Sea catchment under future climate and landuse change projections. Water 2017, 9, 598. [Google Scholar] [CrossRef]
  88. Katipoğlu, O.M. Revealing the trend and change point in Hargreaves equation based on potential evapotranspiration values with various statistical approaches. Environ. Sci. Pollut. Res. 2023, 30, 70604–70620. [Google Scholar] [CrossRef] [PubMed]
  89. Aydin, H.; Yenigun, K.; Isinkaralar, O.; Isinkaralar, K. Hydrological low flow and overlapped trend analysis for drought assessment in Western Black Sea Basin. Nat. Hazards 2024, 121, 1833–1863. [Google Scholar] [CrossRef]
  90. Arabi, C.; Candoğan, B.N. Spatial and temporal change of reference crop evapotranspiration in Marmara region. Int. J. Agric. Wildl. Sci. 2022, 8, 268–281. [Google Scholar] [CrossRef]
  91. Amarkai, P.A.; Süheri, S. Comparative Evaluation of Crop Evapotranspiration Estimation Methods in a Semi-Arid Region. Sustainability 2024, 16, 11133. [Google Scholar] [CrossRef]
  92. Lum, M.; Bateni, S.; Shiri, J.; Keshavarzi, A. Estimation of Reference Evapotranspiration from Climatic Data. Int. J. Hydrol. 2017, 1, 25–30. [Google Scholar]
  93. Dimitriadou, S.; Nikolakopoulos, K.G. Evapotranspiration trends and interactions in light of the anthropogenic footprint and the climate crisis: A review. Hydrology 2021, 8, 163. [Google Scholar] [CrossRef]
  94. Birkle, P.; Torres Rodriguez, V.; González Partida, E. Effects of evapotranspiration on the water balance of the Valley of Mexico. Geofísica Int. 1996, 35, 63–72. [Google Scholar] [CrossRef]
  95. Arslan, O. Trend analysis of potential evapotranspiration estimates in Niğde province. NÖHÜ J. Eng. Sci. 2017, 6, 602–608. [Google Scholar] [CrossRef]
  96. Chennafi, H. Déficit d’écoulement sur les Hauts Plateaux Sétifiens. Méthodes de Coutagne et de Turc Flow deficit on the High Setif plateaus. Coutagne and Turc methods. Agric. Rev. 2016, 12, 68–72. [Google Scholar]
Figure 1. Spatial Distribution of Meteorological Stations in the Study Area and the Black Sea Region.
Sustainability 17 06531 g001
Figure 2. ET0 thematic maps of the western, central, and eastern Black Sea regions according to the MK trend analysis results: (a) BC method; (b) TR method; (c) CT method.
Sustainability 17 06531 g002aSustainability 17 06531 g002b
Figure 3. ET0 thematic maps of the western, central, and eastern Black Sea regions according to the ITA trend analysis results: (a) BC method; (b) TR method; (c) CT method.
Sustainability 17 06531 g003aSustainability 17 06531 g003b
Figure 4. ET0 thematic maps of the Black Sea regions according to the SS trend analysis results: (a) BC method; (b) TR method; (c) CT method.
Sustainability 17 06531 g004aSustainability 17 06531 g004b
Figure 5. ET0 thematic maps of the Black Sea regions according to the SR trend analysis results: (a) BC method; (b) TR method; (c) CT method.
Sustainability 17 06531 g005aSustainability 17 06531 g005b
Figure 6. New approach trend thematic map of the Black Sea region according to all trend analyses and ET0 methods.
Sustainability 17 06531 g006
Table 1. Geographical coordinates of meteorological stations belonging to the study area.
CityStation NoLatitudeLongitudeAltitude (m)
Artvin 1704541°10′30.7″ N41°49′07.3″ E345
Amasya1708540°40′00.6″ N35°50′07.2″ E1150
Bartın1702041°37′29.3″ N32°21′24.8″ E25
Bayburt1708940°15′16.9″ N40°13′14.5″ E1550
Bolu1707040°43′58.4″ N31°36′07.9″ E726
Çorum1708440°32′46.0″ N34°56′10.3″ E820
Düzce1707240°50′37.3″ N31°08′55.7″ E150
Gümüşhane1708840°27′35.3″ N39°27′55.1″ E1153
Giresun1703440°55′21.7″ N38°23′16.1″ E10
Karabük1707841°12′16.0″ N32°37′58.2″ E354
Kastamonu1707441°22′15.6″ N33°46′32.2″ E780
Ordu1703340°59′01.7″ N37°53′08.9″ E6
Rize1704041°02′24.0″ N40°30′04.7″ E6
Samsun1703041°20′39.0″ N36°15′23.0″ E4
Sinop1702642°01′47.6″ N35°09′16.2″ E28
Tokat1708640°19′52.3″ N36°33′27.7″ E623
Trabzon1703740°59′54.5″ N39°45′53.8″ E39
Zonguldak 1702241°26′57.3″ N31°46′40.5″ E13
Table 2. Correlation coefficients between ET0 values in the Western Black Sea Region.
RegionCityBC-TRBC-CTTR-CT
The Western Black SeaBartın0.9130.9010.965
Bolu0.9700.9120.994
Düzce0.9360.8990.991
Karabük0.9400.9450.975
Kastamonu0.9600.9560.985
Sinop0.9240.9250.982
Zonguldak0.9250.9160.989
Table 3. Correlation coefficients between ET0 values in the Central Black Sea Region.
RegionCityBC-TRBC-CTTR-CT
The Central Black Sea Amasya0.9530.9600.988
Çorum0.9420.9060.987
Ordu0.9710.9170.990
Samsun0.9430.9530.990
Tokat0.9760.9420.991
Table 4. Correlation coefficients between ET0 values in the Central Black Sea Region.
RegionCityBC-TRBC-CTTR-CT
The Eastern Black Sea Artvin0.9610.9200.978
Bayburt0.9250.9420.989
Giresun0.9190.9610.990
Gümüşhane0.9700.9520.980
Trabzon0.9560.9600.983
Rize0.9500.9210.988
Table 5. Trend results of Western, Central, and Eastern Black Sea Regions according to MK test.
RegionCityET0 Trend (BC)ET0 Trend (TR)ET0 Trend (CT)
Western Black Sea Bartın
Bolu
Düzce
Karabük
Kastamonu
Sinop
Zonguldak
Middle Black SeaAmasya
Çorum
Ordu
Samsun
Tokat
Eastern Black Sea Artvin
Bayburt
Giresun
Gümüşhane
Trabzon
Rize
↑ (increase trend); ↔ (no trend).
Table 6. Trend Results of Western, Central, and Eastern Black Sea Regions according to ITA Test.
RegionCityET0 Trend (BC)ET0 Trend (TR)ET0 Trend (CT)
Western Black Sea Bartın
Bolu
Düzce
Karabük
Kastamonu
Sinop
Zonguldak
Middle Black SeaAmasya
Çorum
Ordu
Samsun
Tokat
Eastern Black Sea Artvin
Bayburt
Giresun
Gümüşhane
Trabzon
Rize
↑ (increase trend); ↔ (no trend).
Table 7. Trend Results of Western, Central and Eastern Black Sea Regions according to SS Test.
RegionCityET0 Trend (BC)ET0 Trend (TR)ET0 Trend (CT)
Western Black Sea Bartın
Bolu
Düzce
Karabük
Kastamonu
Sinop
Zonguldak
Middle Black SeaAmasya
Çorum
Ordu
Samsun
Tokat
Eastern Black Sea Artvin
Bayburt
Giresun
Gümüşhane
Trabzon
Rize
↑ (increase trend); ↔ (no trend).
Table 8. Trend Results of Western, Central and Eastern Black Sea Regions according to SR Test.
RegionCityET0 Trend (BC)ET0 Trend (TR)ET0 Trend (CT)
Western Black Sea Bartın
Bolu
Düzce
Karabük
Kastamonu
Sinop
Zonguldak
Middle Black SeaAmasya
Çorum
Ordu
Samsun
Tokat
Eastern Black Sea Artvin
Bayburt
Giresun
Gümüşhane
Trabzon
Rize
↑ (increase trend); ↔ (no trend).
Table 9. Number of provinces showing decreasing/increasing trend according to the results of all trend tests and ET0 methods.
RegionNumber of ProvincesTrendAll Method
Trend NumberTrend Percentage
The Western Black Sea7Increasing trend4/757%
Decreasing trend0/70%
The Central Black Sea5Increasing trend2/540%
Decreasing trend0/50%
The Eastern Black Sea6Increasing trend1/617%
Decreasing trend0/60%
Disclaimer/Publisher’s Note: The statements, opinions and data contained in all publications are solely those of the individual author(s) and contributor(s) and not of MDPI and/or the editor(s). MDPI and/or the editor(s) disclaim responsibility for any injury to people or property resulting from any ideas, methods, instructions or products referred to in the content.