Article

Turkiye’s Carbon Emission Profile: A Global Analysis with the MEREC-PROMETHEE Hybrid Method

by
İrem Pelit
1,* and
İlker İbrahim Avşar
2
1
International Trade and Logistic, Çağ University, Mersin 33800, Türkiye
2
Department of Management and Organization, Osmaniye Korkut Ata University, Osmaniye 80000, Türkiye
*
Author to whom correspondence should be addressed.
Sustainability 2025, 17(14), 6527; https://doi.org/10.3390/su17146527
Submission received: 3 June 2025 / Revised: 7 July 2025 / Accepted: 8 July 2025 / Published: 16 July 2025

Abstract

This study conducts a comparative evaluation of Turkiye’s carbon emission profile from both sectoral and global perspectives. Utilizing 2022 data from 76 countries, it applies two widely recognized multi-criteria decision-making (MCDM) methods: MEREC, for determining objective weights of criteria, and PROMETHEE II, for ranking countries based on these criteria. All data used in the analysis were obtained from the World Bank, a globally recognized and credible statistical source. The study evaluates seven criteria, including carbon emissions from the energy, transport, industry, and residential sectors, along with GDP-related indicators. The results indicate that Turkiye’s carbon emissions, particularly from industry, transport, and energy, are substantially higher than the global average. Moreover, countries with higher levels of industrialization generally rank lower in environmental performance, highlighting a direct relationship between industrial activity and increased carbon emissions. According to PROMETHEE II rankings, Turkiye falls into the lower-middle tier among the assessed countries. In light of these findings, the study suggests that Turkiye should implement targeted, sector-specific policy measures to reduce emissions. The research aims to provide policymakers with a structured, data-driven framework that aligns with the country’s broader sustainable development goals. MEREC was selected for its ability to produce unbiased criterion weights, while PROMETHEE II was chosen for its capacity to deliver clear and meaningful comparative rankings, making both methods highly suitable for evaluating environmental performance. This study also offers a broader analysis of how selected countries compare in terms of their carbon emissions. As carbon emissions remain one of the most pressing environmental challenges in the context of global warming and climate change, ranking countries based on emission levels serves both to support scientific inquiry and to increase international awareness. By relying on recent 2022 data, the study offers a timely snapshot of the global carbon emission landscape. Alongside its contribution to public awareness, the findings are expected to support policymakers in developing effective environmental strategies. Ultimately, this research contributes to the academic literature and lays a foundation for more sustainable environmental policy development.

Graphical Abstract

1. Introduction

Global warming and climate change evolved into a multidimensional crisis that must be addressed not only as an environmental issue, but also through its economic, social, and political dimensions [1]. This crisis is directly linked to national energy policies, production systems, and consumption patterns. Carbon emissions, constituting a major component of greenhouse gases, are extensively acknowledged in the scientific literature as a fundamental contributor to climate change. Thus, analyzing the carbon emission profiles of countries is of critical importance for the formulation of sustainable development policies [2].
With the increasing energy demand, rising urbanization rates, and the process of industrialization, energy production based on fossil fuel consumption, along with the growth of high carbon-intensive sectors such as industry and transportation, significantly increased carbon emissions [3]. In this context, not only the total emission levels, but also sector-based analyses of emission sources and international comparisons have become increasingly important. Such analyses enable countries to structure their emission reduction strategies more effectively.
As a developing economy, Turkiye exhibits a trend of increasing carbon emissions driven by rapid urbanization, rising energy consumption, and growth in industrial production. According to data from the Turkish Statistical Institute (2023), Turkiye’s total carbon emissions reached 523 million tons of CO2 in 2021, with more than 70% of these emissions originating from the energy, industry, and transportation sectors. Nevertheless, Turkiye adopted a net-zero emission target by 2053, and as a party to the Paris Climate Agreement, committed to taking responsibility within the framework of global climate policy [4]. Achieving this target requires a thorough analysis of the current carbon emission structure and the development of sector-based strategic policy recommendations.
The need to reduce carbon emissions is becoming more urgent every day. However, most studies still focus on general national data instead of breaking things down by sector, and they often overlook the use of more objective and transparent decision-making methods. When it comes to Turkiye, there are not many detailed analyses that show how the country compares to others. This study aims to fill that gap by using recent data and a solid method to offer a multicriteria, sector-based look at carbon emissions.
This study examines Turkiye’s standing in the global context of carbon emissions by looking at its emission patterns through both sector-based and international lenses. To conduct this analysis, the preference ranking organization method for enrichment evaluation (PROMETHEE) approach was applied to rank countries according to several emission-related criteria. PROMETHEE has been used in various decision-making contexts due to its ability to handle multiple, often conflicting, factors at once [5]. Alongside this, the study also employed the method based on the removal effects of criteria (MEREC) technique to calculate criterion weights in an objective way [6]. Using these two methods together allowed for a more balanced and transparent evaluation process, especially when dealing with the complexities of environmental data.
While many previous studies focused on the links between carbon emissions and broader variables such as energy use, economic growth, or renewable sources, very few approached the issue through sectoral comparisons across countries using MCDM techniques. When it comes to Turkiye, there are even fewer examples of studies that apply the PROMETHEE method to analyze emissions data. This research aims to address that gap by comparing Turkiye’s sector-specific emissions, particularly in industry, transport, and industrial processes, with those of other nations. In doing so, it provides a clearer picture of where Turkiye stands and how it performs relative to others in key emission-intensive sectors.
This research has been structured around the following primary goals:
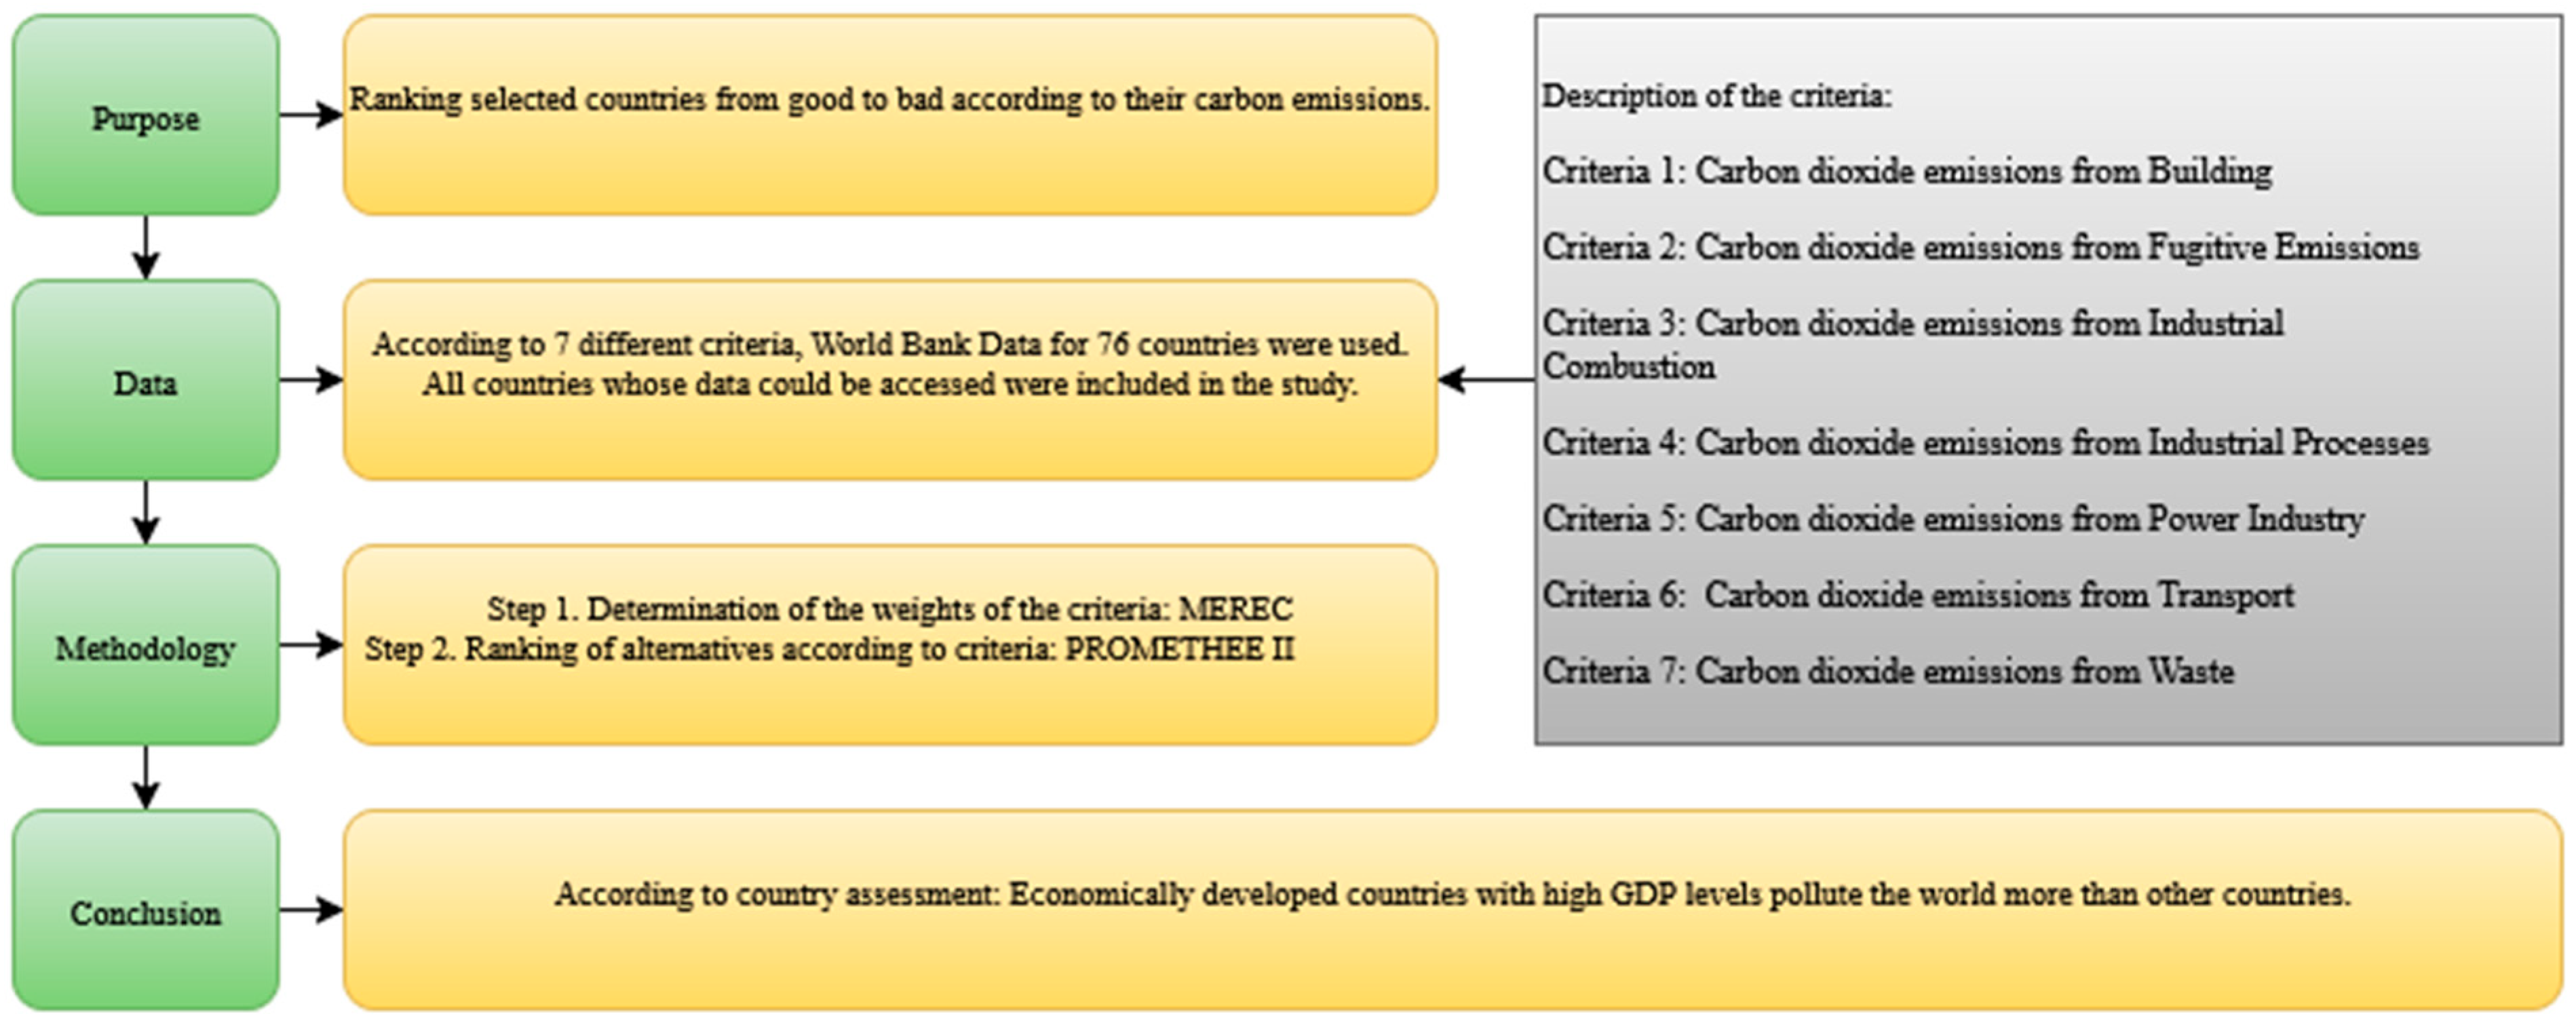
  • To conduct a detailed sector-based analysis of Turkiye’s carbon emissions,
  • To determine Turkiye’s position through a comparative global ranking,
  • To identify the sectors with the highest emission intensities and provide guidance to policymakers,
  • To propose scientifically grounded strategies to support Turkiye’s achievement of its sustainable development and low-carbon economy goals.
The findings obtained at the end of the study present strategic recommendations that can be utilized in reshaping Turkiye’s carbon emission reduction policies. In this way, the study aims to contribute to more effective and data-driven decision-making processes during Turkiye’s transition to a low-carbon economy.
This research can be evaluated in terms of its contribution to existing literature on the subject under the following four headings: (1) Providing an updated dataset and comparative analysis of carbon emissions. The paper offers a concise overview of current carbon emission levels in specific countries. This enables policymakers and researchers to identify differences between countries. (2) Proposing an awareness-driven framework; the study provides a quantitative ranking and discusses how this can raise public awareness and influence environmental policies. In this respect, it offers a unique perspective on the socio-political implications of environmental rankings. (3) Emission rankings used as a potential pressure tool for decision-makers. (4) The possibility of an interdisciplinary approach; the article makes an interdisciplinary contribution by combining environmental science with public policy, the media, and sociology. This is a unique effort to integrate different perspectives in sustainability literature.
Many recent studies in the field of sustainability and MCDM focus mainly on overall national emission data or rely on basic evaluation methods without comparing sectors in detail. For example, Tighnavard et al. (2025) review various MCDM applications in the circular economy, but they do not explore emissions on a sectoral level [7]. Likewise, Elsayed (2024) introduces a hybrid method combining MEREC and TODIM to assess green fuel alternatives, yet his analysis remains somewhat narrow in scope [8]. What sets this study apart is its use of both MEREC, to assign objective weights, and PROMETHEE II, to rank countries based on sector-specific emission indicators. This dual-method approach improves transparency and allows for clearer comparisons between countries. Moreover, by incorporating social and policy-related factors into the evaluation, the study aligns with recent academic calls for more integrated and multi-dimensional frameworks in sustainability science [7,8].

2. Conceptual Background

On a global scale, the problematization of environmental sustainability necessitates a paradigmatic transformation that extends beyond the deterioration of natural systems to encompass the macroeconomic and geopolitical ramifications of production and consumption dynamics [1,2]. Within this broader context, carbon emissions cease to function merely as environmental externalities and instead emerge as strategic determinants that compel the rearticulation of development policies along structurally transformative axes [9].
The measurement and transnational analysis of emission profiles demand evaluative models that transcend traditional deterministic assessment paradigms. In this regard, uncertainty, multidimensionality, and systemic interdependencies call for methodological constructs capable of capturing the intricacies inherent in environmental phenomena. Accordingly multi-criteria decision-making (MCDM) approaches gained increasing traction within sustainability-related evaluations [10,11]. Within this analytical framework, the integration of the MEREC and PROMETHEE II methods provides a dual mechanism: the former enables the objective derivation of criterion weights based on data structure [6], while the latter facilitates the generation of preference-based hierarchical rankings [5].
MEREC functions by minimizing subjective interference, deriving criterion significance intrinsically from the dataset, whereas PROMETHEE II allows for the expression of relative preferences in quantitative terms. Their combined use reinforces the operational efficacy of decision support systems and contributes to the generation of policy-relevant outputs within the field of sustainability assessment [12,13].
In this conceptual framework, carbon emissions are reframed not simply as ecological consequences, but as structural by-products embedded in developmental models, energy configurations, and sectoral dynamics. Particularly in high-emission domains, such as industry, transportation, and energy, emission intensities exhibit significant variability across countries, reflecting the heterogeneity of national growth trajectories and structural constraints. This variation underscores the imperative of constructing sector-specific mitigation strategies that reflect differentiated national conditions [14,15].
Ultimately, this study redefines carbon emissions not as isolated technical indicators, but as complex analytical objects situated at the intersection of economic architectures, institutional capacity, and sustainability-oriented governance. In doing so, it advances a multidimensional theoretical lens that challenges the reductionist approaches prevalent in mainstream literature.

3. Literature Review

Reducing carbon emissions became a key priority in global efforts to tackle climate change and support long-term environmental sustainability. Among the leading contributors to greenhouse gas emissions are the energy, industrial, and transportation sectors, each playing a considerable role in the ongoing rise of global carbon outputs. Given this context, analyzing emissions at the sectoral level and comparing environmental performance across countries can provide valuable insights for developing more effective and focused policy responses.
In response to the complexity of these interconnected environmental issues, researchers in recent years increasingly turned to multi-criteria decision-making (MCDM) methods [11]. One of the more prominent tools within this framework is the preference ranking organization method for enrichment evaluation (PROMETHEE), which offers flexibility and the ability to evaluate multiple criteria simultaneously [5]. Its applications ranged from sustainable energy planning to environmental impact assessment and the formulation of low-carbon strategies [10]. For example, Li, Li, and Song (2021) applied a variety of MCDM techniques to assess the potential of renewable energy sources in reducing emissions; however, their work did not include sectoral or international comparisons [16]. Similarly, Bertoncini et al. (2022) used the PROMETHEE II method to evaluate urban energy restructuring projects in European cities, highlighting their role in reducing greenhouse gases [14]. In another study, Saraswat and Digalwar (2021) combined Shannon’s entropy and fuzzy MCDM to assess carbon mitigation strategies in India’s energy sector, aligning the analysis with broader sustainability goals [17].
In addition to these methodological advances, more recent research focused on integrating objective weighting techniques into MCDM frameworks. For instance, Hezam et al. (2022) developed a MEREC-based intuitionistic fuzzy model to evaluate the sustainability of alternative fuel vehicles [12]. Esangbedo and Tang (2023) introduced a hybrid model that combines MEREC and MAIRCA within a grey systems context to manage uncertainty in corporate decarbonization strategies [18]. Their study evaluated the performance of six Chinese companies in reducing carbon emissions. Likewise, Xue, Zhang, Cai, and Ponkratov (2023) employed MCDM methods to assess various alternative energy sources in China, using an extensive set of criteria such as cost, environmental impact, reliability, energy output, and scalability [19]. Their results point to wind energy as the most effective option among those considered.
Although the PROMETHEE method gained increasing attention in carbon emission analysis, most studies to date focused on international comparisons or the ranking of alternative energy solutions, with limited attention given to sector-specific emissions within individual countries. The scarcity of comprehensive sector-specific analyses underscores a notable gap in the literature, particularly regarding the method’s applicability in source-based assessments of carbon emissions. For instance, Martins, Ferreira, and Costa (2021) developed an MCDM model integrating value-focused thinking and the PROMETHEE methodology to evaluate distributed energy generation projects in Brazil, incorporating economic, environmental, and social sustainability criteria [20]. In a similar vein, Richards et al. (2025) applied an MCDM framework to assess the environmental impacts of solar energy deployment, highlighting the effectiveness of spatial strategies in mitigating carbon emissions [21].
In the case of Turkiye, scholarly investigations into carbon emissions have largely been situated within the frameworks of energy consumption, economic growth, and renewable energy policies. For example, Soytaş and Sarı (2009) explored the dynamic relationship between energy consumption and economic growth, concluding that increased energy use significantly contributes to carbon emissions [22]. Miçooğulları (2023) examined the long-term causal relationship between per capita carbon emissions and economic growth, while Ozdemir and Koç (2020) analyzed the role of renewable energy in emission reduction within the framework of the environmental Kuznets curve [15,23]. Despite their contributions, these studies share a common limitation: the absence of detailed sectoral perspectives and the lack of integration of decision support system-based approaches. One of the few sector-focused studies, conducted by Çoban (2015), analyzed Turkiye’s emission profiles stemming from energy consumption; however, critical sectors such as transportation and industrial processes were excluded from the scope. Research applying analytical models directly to Turkiye’s sectoral emissions remains highly limited [24]. The EBRD (2023) report evaluated the potential for mitigation through energy efficiency and alternative fuels but lacked a methodological analytical model [25]. Similarly, the study by Avşar and Ecemiş (2023) analyzed the sustainability performance of the logistics sector using MCDM methods; however, it did not directly model carbon emissions [26].
Within this framework, the original contributions of the present study are summarized as follows:
  • The disaggregation of Turkiye’s carbon emissions by major sectors, namely industry, transportation, and industrial processes;
  • The evaluation of emission trends for the year 2022 based on World Bank data;
  • The positioning of Turkiye’s global emission performance within a multi-criteria comparative ranking framework using the PROMETHEE method;
  • The provision of scientifically grounded and practically applicable policy recommendations based on the findings.
In conclusion, this study represents one of the first comprehensive analyses to address Turkiye’s carbon emissions at the sectoral level through a multi-criteria approach and to apply the PROMETHEE method. In this regard, the study not only addresses a methodological gap within the national context, but also enhances the global body of literature by establishing a decision support framework designed to offer actionable insights for policymakers.

4. Methodology

In this study, annual carbon emission data for the year 2022, sourced from the most recent World Bank datasets, were used to analyze Turkiye’s carbon emission profile. Emissions originating from the industrial, transportation, and industrial processes sectors were examined using the MEREC and PROMETHEE II methods within the framework of a multi-criteria decision-making (MCDM) approach. The MEREC method was applied to objectively determine the weights of the criteria, while the PROMETHEE II method was used to rank the alternatives (countries) from best to worst based on these criteria [6]. This methodological approach enabled a comprehensive and comparative evaluation of countries in the context of carbon emissions.

4.1. Data Source and Scope

This study uses carbon emission data from the World Bank, focusing on the latest figures for emissions from industrial activities, transportation, and industrial processes. It also examines Turkiye’s progress in meeting the goals of the Paris Climate Agreement. The analysis is based on three main criteria: emissions from industry, emissions from the transport sector, and emissions related to industrial processes. A total of 76 countries were included in the study, selected based on the availability of complete data for the seven indicators shown in Table 1.
Countries with missing data for any of the indicators were excluded to ensure reliable cross-country comparisons. The main goal of the study is to rank the countries from the lowest to the highest carbon emitters based on the chosen criteria. This approach not only supports international benchmarking, but also offers a clear assessment of Turkiye’s environmental position on the global stage.

4.2. Method: MEREC

Assigning appropriate weights to criteria is a vital step when addressing multi-criteria decision-making (MCDM) problems. In practice, researchers often use either subjective or objective techniques to determine these weights. While subjective methods draw on the insights and preferences of decision-makers, objective approaches rely entirely on the data. One such method is MEREC, which bases its calculations on how the removal of individual criteria affects the performance scores of the alternatives [6].
Developed by Keshavarz-Ghorabaee and colleagues in 2021, the MEREC method has since been recognized as a data-driven technique within the family of MCDM models [6]. It provides a systematic way to assign weights without the influence of expert bias. Based on the relevant literature, the main steps followed in the application of the MEREC approach in this study are outlined below.
  • A decision matrix is constructed (Equation (1)).
    X = x 11 x 21 x 21 x 22 x 1 j x 1 m x 2 j x 2 m x i 1 x i 2 x n 1 x n 2 x i j x i m x n j x n m
  • In the second step, a normalized matrix is generated based on Equation (2), where the normalized values necessary for the application of the MEREC method are obtained.
    n i j x = m i n x k j k x i j i f   J   ϵ   B x i j m a x x k j k i f   J   ϵ   H
  • The aggregated performance values of the alternatives are calculated.
    S i = l n 1 + ( 1 m j l n n i j x | ) )
  • The performance of the alternatives is recalculated by removing each criterion individually. The key difference from the third step is that, in this step, the performance values of the alternatives are computed separately for each case where a single criterion is omitted.
    S i j = l n 1 + ( 1 m k , k j l n n i k x | ) )
  • Based on the values obtained from Equations (3) and (4), the total absolute deviation is calculated.
    E j = i S i j S i
  • At this stage, the objective weight of each criterion is determined by evaluating its removal effect on the aggregated performance of the alternatives.
    w j = E j k E k

4.3. Method: PROMETHEE

The PROMETHEE method consists of the following steps [5,27,28,29]:
  • A decision matrix is constructed using the alternatives expressed as (a1, a2, …, aₙ) and the criteria are denoted as (q1, q2, …, qₖ).
  • One of the six preference functions is selected, and the subsequent operations are carried out according to the selected function. These functions include Usual, U-shape, V-shape, Level, V-shape with indifference, and Gaussian.
  • Preference indices for the alternatives are calculated. For a given pair of alternatives a and b, the preference index is defined as follows:
    π a , b =   j = 1 n w j · P j ( a , b )
    π b , a =   j = 1 w j · P j ( b , a ) .
The properties of the preference indices are provided in Equations (9)–(12).
π a , a = 0
0 π ( a , b ) 1
0 π ( b , a ) 1
0 π a , b + π ( b , a ) 1
4.
Equation (13) presents the calculation of the positive outranking flow for alternative a, while Equation (14) provides the calculation of the negative outranking flow.
+ a = 1 n 1 x ϵ A π x , a ,
a = 1 n 1 x ϵ A π x , a .
5.
Pairwise comparisons of the alternatives are conducted, and the relationships are categorized as preference (P), indifference (I), or incomparability (R).
+ a > + b ; ( a ) P + ( b )
a < b ; ( a ) P ( b )
+ a =   + b ; ( a ) I + ( b )
a =   b ; ( a ) I ( b )
6.
The PROMETHEE I method is applied by comparing the positive and negative outranking flows to determine the partial ranking of the alternatives.
( a ) P + b   a n d   ( a ) P b a > b ( a ) P + b   a n d   ( a ) I b ( a ) I + b   a n d   ( a ) P b
a = b ( a ) P + b   a n d   ( a ) P b
7.
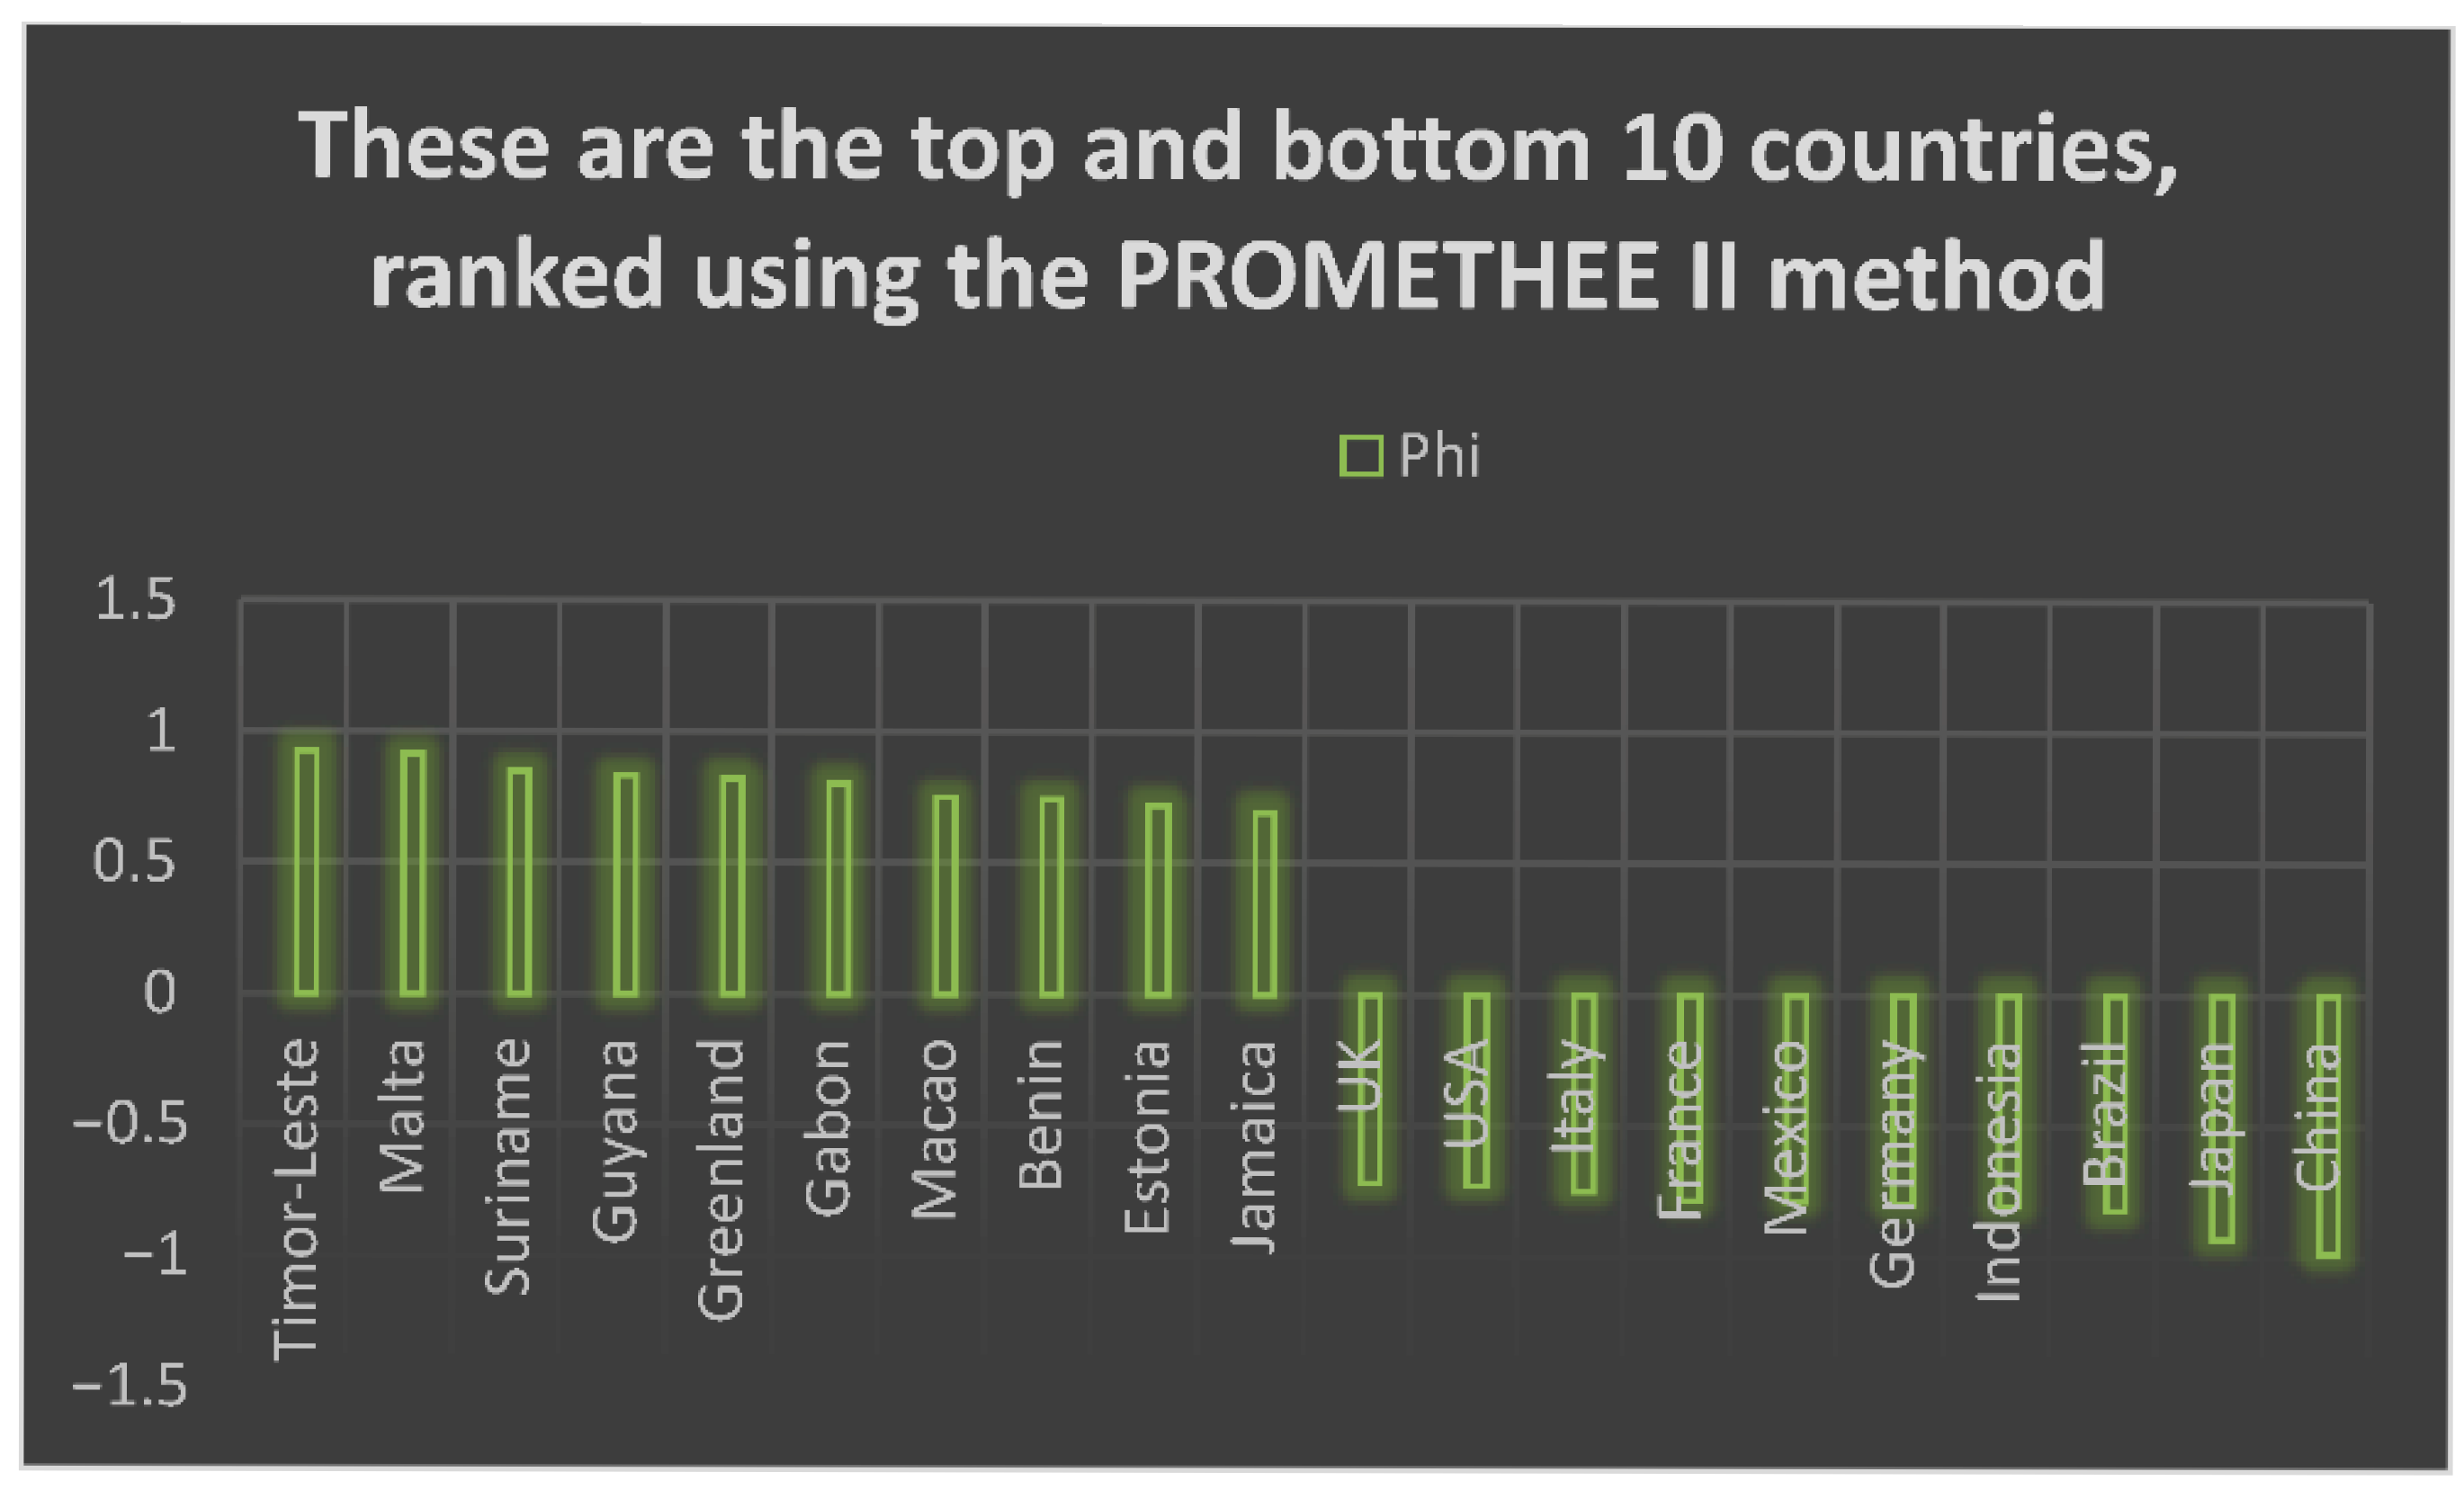
PROMETHEE II is applied to rank the alternatives. In this context, the greater the net outranking flow, the better the performance of the alternative.
a = + a ( a )

4.4. Strengths and Contributions of the Study

The scientific contributions of this study are as follows:
  • Turkiye’s sectoral carbon emission profile has been ranked globally using the PROMETHEE method.
  • The application of the MCDM approach to carbon emission analysis addresses methodological gaps in the existing literature.
  • The study provides up-to-date and reliable analyses based on World Bank data.
Turkiye’s post-Paris Agreement carbon emission trends have been thoroughly evaluated.
In this context, the study presents important findings that support Turkiye’s efforts to achieve its sustainable development goals within the framework of global competition in carbon emissions.

4.5. Why MEREC and PROMETHEE

MEREC is an objective method for determining the weights of criteria. This method is objective. The weights of the criteria are determined by the internal dynamics of the data, independently of the decision-maker’s subjective judgement. PROMETHEE is a ranking method based on preference relations. It is a powerful analytical tool for problems involving a large number of alternatives and criteria. Used together, MEREC and PROMETHEE offer a robust decision-making process, providing objective criteria weights and a logical, preference-based ranking. This is particularly valuable when analyzing environmental, economic, or technical performance. In this context, it can be seen that Zorlu et al. (2023), Hu and Panyadee (2024), Peng (2024), He and Wang (2025), and Mao et al. (2025) employed the MEREC and PROMETHEE methods in their research [13,30,31,32,33].
MEREC is a method that determines the weight of each criterion based entirely on the data itself. It does not rely on the decision-maker’s opinions, which help produce more neutral and unbiased results. Compared to approaches such as AHP that depend heavily on expert judgment, MEREC’s main advantage is that it works without needing any subjective input. PROMETHEE, on the other hand, is a ranking method that compares alternatives based on preferences. While methods such as TOPSIS or VIKOR focus on how close an option is to an ideal solution, PROMETHEE allows for more flexible evaluations based on what decision-makers actually prioritize. It also offers a clear and complete ranking from best to worst, something not all methods can do. When used together, MEREC and PROMETHEE create a solid decision-making setup. MEREC handles data-driven weighting, and PROMETHEE uses that to sort the options in a logical and consistent way. This makes the approach especially useful in areas such as environmental assessments, sustainability planning, or technical evaluations—where objectivity and clarity matter. Recent studies by Zorlu et al. (2023), Hu and Panyadee (2024), Peng (2024), He and Wang (2025), and Mao et al. (2025) also use this combination of methods, which shows how widely accepted and effective it has become [13,30,31,32,33].

4.6. Research Model

Figure 1 shows the ranking of the 76 countries according to their carbon emissions. The MEREC method was used to determine the weighting of the seven criteria. The PROMETHEE method was then employed to rank the alternatives based on these criteria. The decision matrices created during this process were normalized. The results were obtained using the normalized decision matrix.

5. Analyzing

In this study, the decision matrix presented in Table A1 was used. The matrix includes seven criteria, which are listed in Table 1. The criterion weights were calculated using the MEREC method, and the methodological structure of MEREC is explained in Equations (1)–(6). The weight values obtained through MEREC are presented in Table 2. Based on the calculated weights, the alternatives were ranked using the PROMETHEE II method. The ranking results provided in Table A2 list the countries from best to worst according to the selected criteria.
Table 2 presents the weights of the criteria calculated using the MEREC method. According to the results, Criterion 7 and Criterion 1 are identified as the most significant, while Criterion 4 is found to be the least influential.
The weights assigned to the criteria used to evaluate alternatives may differ. For example, in Dang’s (2025) study, the weight assigned to the first criterion was 0.2866, while the weight assigned to the fourth criterion was 0.1851 [34]. As shown in Table 2, the weights assigned to the criteria differ in this study too.
The decision matrix in Table A1 is ranked according to the weightings of the criteria shown in Table 2. The contents of these criteria are shown in Table 1. The ranking in Table A2 is the result of the analysis. Table A2 also provides a ranking of countries according to their carbon emissions and GDP performance.
According to the PROMETHEE II ranking, the countries with the best overall performance in terms of carbon emissions are Timor-Leste, Malta, and Suriname. However, it should be noted that these countries, along with others ranked highly, are either non-industrialized or possess a relatively low level of industrialization. Therefore, this study not only presents the overall ranking, but also places particular emphasis on the performance of industrialized countries. In this context, it is observed that the majority of industrialized countries appear in the lower segments of the ranking.
Based on the PROMETHEE II results across seven criteria, China is identified as the lowest-performing country in terms of carbon emissions. China is followed by Japan, a member of the G7, and then Brazil. Within the G7 group (excluding Canada), Japan ranks the lowest, followed by Germany, France, Italy, the United States, and the United Kingdom. These G7 countries are among the top ten nations contributing most negatively to global carbon emissions. In addition to the G7 countries, China, Brazil, Indonesia, and Mexico also fall within this high-impact group.
As shown in Table A2, countries with a high GDP tend to have higher carbon emissions. This suggests that economically developed countries are causing more environmental damage. Consequently, it could be argued that these countries should take greater responsibility for cleaning up the planet.

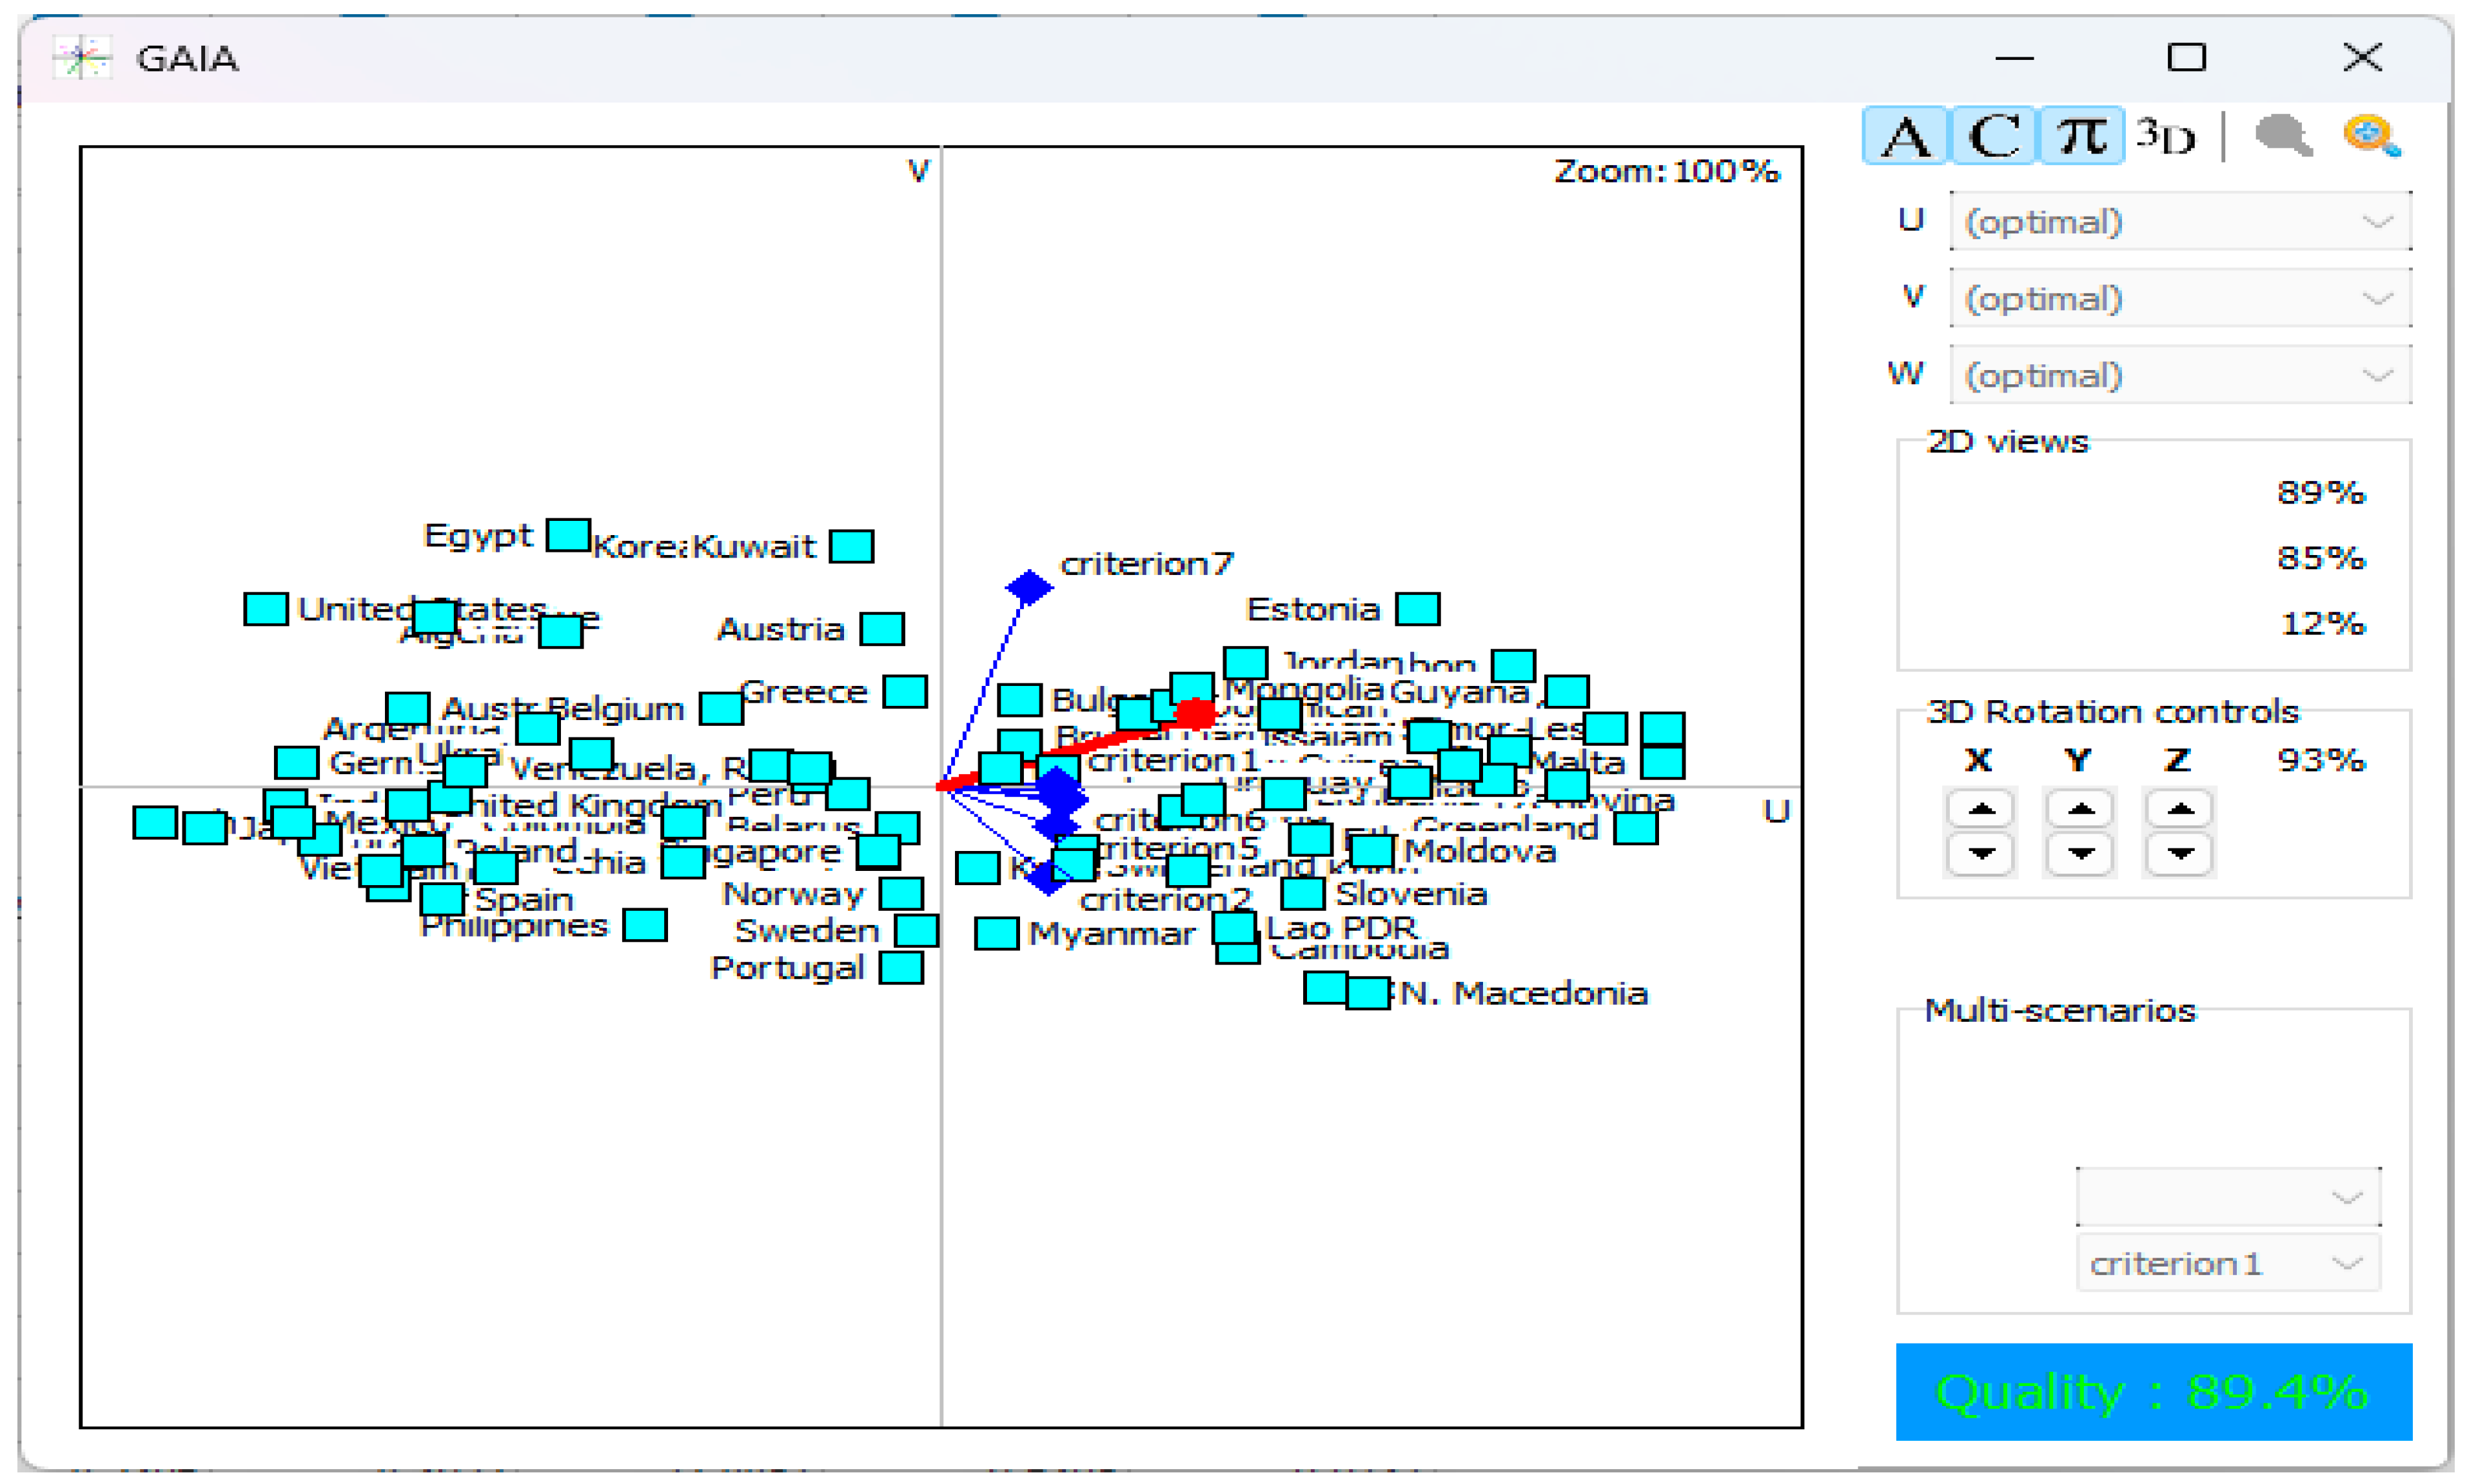
5.1. Analysis Quality

The positions of the alternatives with respect to the criteria, along with the quality graph of the PROMETHEE II analysis summarized above, are presented in Figure 2. According to the results, the analysis quality is 89.4%. A score of over 85% on the GAIA scale is considered reliable [35].

5.2. Sensitivity Analysis

As recommended by the Bošković et al. (2023), a sensitivity analysis was conducted to validate the method [36]. This analysis involved gradually increasing the impact of the most influential criterion while ensuring that the total weight of all criteria remained at 1. (See Table 3).
The results of the sensitivity analysis show that the top 10 rankings have not changed. The rankings of countries such as Timor-Leste, Malta, and Suriname also remain unchanged. However, as the β value increases, the rankings of countries such as Greenland and Gabon change. Nevertheless, these changes are not critical. These results demonstrate the stability of the model.
In summary, the sensitivity analysis suggests that the ranking changes when the weight of the highest criterion is increased, indicating that this criterion is decisive. Overall, it can be concluded that the model effectively differentiates between alternatives. Furthermore, the sensitivity analysis shows that altering the weighting of the most important criterion can result in different alternatives being ranked.

6. Findings and Discussion

This study analyzes the relationship between countries’ carbon emission levels and their degree of economic development using multi-criteria decision-making (MCDM) methods, namely MEREC and PROMETHEE II. Through the MEREC method, the weights of the criteria influencing carbon emissions were determined objectively. Subsequently, the countries were ranked according to their net flow values using the PROMETHEE II method. The findings indicate that carbon emission levels reflect not only environmental performance, but also the development models and structural dynamics of countries. In this context, Figure 3 shows the top 10 countries with the lowest and highest carbon intensity values.
According to the analysis results, countries with low levels of industrialization, such as Timor-Leste, Malta, and Suriname, ranked among the best performers in terms of carbon emissions. Although this finding appears to indicate a favorable environmental outlook at first glance, it must be considered that such low emission levels often stem from limited economic activity and infrastructure deficits. Therefore, rather than indicating environmental success, these results may reflect a lack of development. This highlights the need to evaluate the balance between environmental sustainability and economic development through a multidimensional approach.
On the other hand, the concentration of highly industrialized countries such as Italy, France, Germany, China, Japan, the United States, and the United Kingdom in the lower segment of the ranking clearly reveals the environmental cost of current production and consumption patterns. The presence of a significant portion of G7 countries in this segment highlights the scale of the carbon footprint associated with advanced economies and underscores the sustainability challenges embedded within their development models. However, these countries are also major technology producers and pioneers in developing innovative strategies to reduce carbon emissions. Therefore, evaluations based solely on absolute emission levels fall short of fully capturing their environmental efficiency and capacity for green transformation.
In the case of Turkiye, the findings show that carbon emissions originating from the industrial, transportation, and energy sectors are above the global average. Considering Turkiye’s rapid pace of industrialization and its energy-intensive production structure in recent years, this outcome is not unexpected. What is particularly noteworthy, however, is the lack of effective policy-level transformation addressing the structural causes of rising emissions. Although Turkiye announced ambitious strategic goals, such as the net-zero target for 2053, the sectoral transformations required to meet these targets remain largely at the planning stage and have not yet been sufficiently implemented in practice. When we look at the G20 countries, Turkiye’s carbon intensity seems to resemble that of emerging economies rather than advanced ones. This clearly shows the need for environmental and transition policies that are tailored to Turkiye’s specific conditions.
The weights assigned by the MEREC method reinforce the validity of the analytical framework used in this study. Interestingly, criteria such as waste management and energy use in buildings were given higher weights, suggesting that these areas often treated as secondary may play a more influential role in reducing emissions than traditionally assumed. On the other hand, emissions from industrial processes received relatively lower weights, which could imply a more limited impact in overall carbon output. Still, this does not diminish the sector’s importance in shaping effective environmental strategies.
The use of a multi-criteria decision-making (MCDM) approach allowed for a multi-dimensional evaluation of environmental performance, taking into account not just total emissions, but also the specific sources from which they arise. However, since the scope of the analysis was limited to current emission levels, factors such as national carbon neutrality policies, renewable energy investments, or carbon market participation were not included. This highlights a key limitation and points to the need for future research to incorporate these elements when evaluating sustainability progress.
To sum up, the study’s findings offer more than a snapshot of carbon emissions they point to deeper inconsistencies between prevailing economic growth models and long-term environmental goals. For countries such as Turkiye, there is a growing need to embrace development strategies that reconcile economic ambition with ecological responsibility. Without this shift, ranking improvements may be misleading, offering the illusion of progress without actual transformation. MCDM-based tools, with their ability to handle complex and layered data, should be more widely used to support evidence-based environmental policy-making.

6.1. Policy Implications and Design

This study’s findings offer important lessons for shaping effective and realistic climate policies in Turkiye. While official targets such as net-zero emissions by 2053 mark a positive direction, current emission patterns, particularly in the industrial, transport, and energy sectors, suggest a need for more grounded and sector-focused interventions.
One of the critical gaps lies in Turkiye’s delay in implementing a national emissions trading system (ETS). According to the 2025 Performance Report of the Climate Change Directorate, Turkiye completed its technical preparations for a national ETS, including the development of a monitoring, reporting, and verification (MRV) infrastructure and pilot simulations in energy-intensive sectors [4]. However, the legal and institutional framework necessary for full-scale implementation is still under development. The lack of binding legislation and inter-agency coordination mechanisms continues to delay progress, despite increasing external pressure from the EU CBAM and growing domestic calls for carbon pricing reform.
In light of the European Union’s Carbon Border Adjustment Mechanism (CBAM), which will impose levies on carbon-intensive imports, Turkiye’s export competitiveness may be at risk unless domestic carbon pricing mechanisms are put in place. Establishing an ETS tailored to the emission intensities identified in this study would allow for both internal regulation and international alignment.
Furthermore, the MEREC method revealed that waste management and energy consumption in buildings carry significant weight among emission sources. These findings suggest that climate strategies should go beyond high-emission sectors and incorporate areas traditionally seen as secondary. For instance, strengthening municipal recycling systems and enforcing energy efficiency standards in new and existing buildings could yield considerable environmental gains with relatively lower investment costs.
Equally important is the principle of a just transition. Policies aimed at reducing emissions must also account for their social impact, particularly on vulnerable groups. Introducing progressive carbon taxation, offering targeted support to low-income households, and investing in green job training programs are essential to ensure that environmental goals do not exacerbate existing inequalities.
Methodologically, this research demonstrates the value of integrating multi-criteria decision-making tools into environmental governance. The combined use of PROMETHEE and MEREC not only enhances objectivity in emission assessment, but also provides policymakers with a clear, structured prioritization of sectors and interventions. Embedding such tools into the strategic planning processes of relevant institutions, such as the Climate Change Directorate or the Energy Market Regulatory Authority, would increase the accountability and efficiency of national climate action. Lastly, the cross-country comparisons conducted in this study reveal structural similarities between Turkiye and other emerging economies. These parallels offer opportunities for international collaboration, particularly in areas such as technology transfer, climate finance, and policy coordination. Strengthening South–South cooperation could help Turkiye access practical models for transitioning toward a low-carbon economy.
In short, climate policy in Turkiye must evolve from generic commitments to context-sensitive, evidence-based, and socially inclusive strategies. The analytical framework used in this study serves as a foundation for such progress, offering a pathway toward policies that are not only ambitious on paper, but also implementable and equitable in practice.

6.2. Implications for Policymakers

The potential outputs of this research for policymakers are summarized below:
  • Comparative performance indicator: Ranking countries based on their carbon emissions enables policymakers to compare their own country’s climate performance with that of others. This enables them to identify areas for improvement and develop targeted environmental policies.
  • Awareness of responsibility and accountability: For countries that perform poorly in the rankings, these results can act as a warning to the public and the international community, creating political pressure. This promotes more transparent and accountable environmental policies.
  • Redefining policy priorities: If a country has high carbon emissions but lacks effective policies to address them, this type of analysis can prompt a review of policy priorities. This could result in a reduced reliance on fossil fuels or the introduction of new regulations, such as a carbon tax.
  • The need for international cooperation: Some countries cannot achieve meaningful results alone. This ranking could encourage high-emitting countries to collaborate, thereby strengthening the global effort through technology transfer or joint projects.
  • Gaining public awareness and legitimacy: this type of analysis can help policymakers organize public environmental awareness campaigns and increase the legitimacy of their environmental policies.
  • Alignment with sustainable development goals (SDGs): Monitoring and reducing carbon emissions is directly linked to Goal 13 (Climate Action) of the UN’s SDGs. Such efforts can also help countries assess their alignment with the SDGs.

6.3. Future Research and New Approaches

This research is important because it analyzes countries’ comparative positions in terms of carbon emissions. However, the findings could pave the way for more comprehensive and in-depth research in the future. Firstly, the study’s scope should be expanded to include more countries in the analysis process. In particular, examining low- and middle-income countries would provide a more balanced and inclusive global perspective on carbon emissions. This would enable regional differences and structural inequalities in emissions to be assessed more accurately. Secondly, achieving methodological diversity could be accomplished by replicating the research using different analytical methods. Advanced methods, such as multi-criteria decision-making techniques, cluster analyses, panel data models, and machine learning-based approaches, would allow countries to be evaluated not only on the basis of emission amounts, but also on the basis of the causes, trends, and structural dynamics of emissions. Furthermore, future research should focus on the relationship between carbon emissions, economic growth, energy consumption, the transition to renewable energy, and environmental policies. Such relational studies are important in revealing which policy instruments lead to more effective results. However, time series analysis can be used to monitor changes in countries’ emission performance and evaluate the long-term impact of implemented environmental policies. Such dynamic analyses enable policymakers to make more realistic and effective decisions. When analyzing carbon emissions, it is important to consider the political, social, and cultural contexts as well as the quantitative data. Qualitative or mixed-method studies that consider factors such as public perception, social awareness, the influence of the media, and the role of various stakeholders in environmental policy-making processes can provide a richer, more multidimensional basis for analysis.

7. Conclusions

This study objectively assesses Turkiye’s carbon emission profile at both sectoral and global levels, highlighting the strengths and weaknesses in achieving environmental sustainability goals. Using the PROMETHEE II method, countries’ performances were comparatively evaluated, while the MEREC method enabled data-driven determination of criterion weights. The findings indicate that carbon emissions tend to be significantly higher in industrialized countries, whereas countries with lower levels of industrialization demonstrate relatively better environmental performance. Turkiye, in particular, exhibits carbon emissions above the global average, which points to a structural weakness that conflicts with the country’s sustainable development objectives.
In this context, Turkiye’s strategies for reducing carbon emissions must go beyond general policy declarations and evolve into data-oriented, sector-specific, and long-term transformation policies. The high level of emissions from the industrial, transportation, and energy sectors clearly underscores the urgent need for structural change in these areas. Especially in energy-intensive sectors, transitioning to low-carbon technologies has become essential not only for environmental sustainability, but also for maintaining economic competitiveness.
The top policy priority for decision-makers should be to analyze current emission profiles not only through total emission levels, but also through contextual indicators such as emission intensity (emissions per GDP) and per capita emissions. In doing so, emission performance can be assessed in relation to economic scale, allowing environmental policies to be structured more fairly and proportionally. Furthermore, based on the criterion weights identified through the MEREC method, it becomes evident that greater investment is needed in areas traditionally treated as secondary priorities, such as waste management and energy consumption in buildings.
According to data from the Turkish Statistical Institute (2023), Turkiye’s total carbon emissions reached 523 million tons of CO2 in 2021, with more than 70% of these emissions originating from the energy, industry, and transportation sectors [37].
Successfully achieving Turkiye’s 2053 net-zero emissions target will require not only technical capacity, but also institutional transformation. In this regard, the integration of carbon management decision support systems into public policy-making processes would enhance the objectivity and traceability of environmental governance. The MEREC and PROMETHEE methods applied in this study offer a robust analytical framework for decision-makers in this context.
However, the social impacts of carbon reduction policies should not be overlooked. Low-income groups face a disproportionate risk of being adversely affected by carbon taxes and the costs of energy transition. Therefore, emission reduction strategies must be designed in line with the principles of “just transition”, ensuring that social equity and inclusiveness are embedded within environmental policies.
In conclusion, this study not only evaluates current carbon emission levels, but also proposes a scientifically grounded, multi-criteria, and comparative approach to sustainable development and environmental policy-making. For developing countries such as Turkiye, environmental sustainability should not be seen merely as environmental sensitivity, but rather as a development paradigm that incorporates structural transformation, technological investment, and social justice. Strategic policies developed in this direction will yield long-term benefits both environmentally and economically.
According to Table A2, industrialized and high-income developed countries currently emit more carbon than the rest of the world. This increases their historical responsibilities and future obligations. In this context, the tasks of developed countries can be categorized as follows: These include improving the energy efficiency of buildings, decarbonizing key sectors, such as transport and industry, and ensuring a swift transition to renewable energy sources. Countries that extensively polluted the environment since the First Industrial Revolution must pay for the damage they caused to other countries. Therefore, it is crucial that industrialized countries provide financial support to less economically developed, non-polluting countries, and contribute to efforts for a cleaner world. Furthermore, developed countries must change their consumption habits, implement projects to reduce their carbon footprints, and fully comply with international climate agreements.
According to 2023 data analyzed in terms of ‘carbon intensity of GDP’ (kg CO2e/constant 2015 USD), the average value for many developed countries, including the G7, is found to be between 0.1 and 0.2. However, China stands out with a value of 0.75. This is a very high value. It highlights the urgent need for solutions to ensure a sustainable future.

Author Contributions

İ.P.: conceptualization, introduction, literature review, discussion, and conclusion. İ.İ.A.: data analysis and conclusion. All authors have read and agreed to the published version of the manuscript.

Funding

This work was supported by Research Fund of Çağ University, Project Number: 2024-2-11.

Institutional Review Board Statement

Not applicable.

Informed Consent Statement

Not applicable.

Data Availability Statement

Data sharing is not applicable. No new data were created or analyzed in this study.

Conflicts of Interest

The authors declare that the research was conducted in the absence of any financial relationship.

Appendix A

Table A1. Decision matrix.
CountryCriteria 1Criteria 2Criteria 3Criteria 4Criteria 5Criteria 6Criteria 7
Algeria32.708430.171416.463616.307546.416444.47380.0023
Argentina41.247422.819521.582811.080345.205849.26340.0118
Australia29.75437.000440.496613.9555161.122589.21780.0158
Austria7.94625.710710.39774.877211.05721.19220.0008
Azerbaijan10.23943.19832.24081.6713.87118.06850.0024
Belarus7.27812.86764.73064.392727.44519.63050.0131
Belgium20.86545.559415.95829.366714.838223.11260.0024
Benin0.19360.04570.51030.93990.51434.41490.0004
Bolivia2.83581.21882.221.40873.460811.59080.0026
Bosnia and Herzegovina0.96051.4831.64811.483412.79524.33490.0038
Brazil40.638226.171189.069846.693350.4856212.5770.2995
Brunei Darussalam0.08943.20010.40950.10924.431.20850.0018
Bulgaria1.76732.59644.46264.588226.31939.53640.0016
Cambodia1.27930.00021.07193.60924.20057.18080.0126
Chile7.96652.575214.49373.197729.023131.19850.0085
China609.6716678.11462725.5231472.2676093.126929.08633.5582
Colombia10.4229.275416.75946.119412.425536.09460.0187
Cuba3.1970.37865.00480.522610.55691.16150.0005
Czechia10.6665.604411.6375.280946.722919.31760.0566
Denmark3.71721.76963.79791.58646.053411.15720.001
Dominican Republic1.83550.3484.56492.479312.25517.97740.0005
Ecuador6.1754.94463.38252.14784.629820.43130.0046
Egypt, Arab Rep.17.982919.88631.027634.821287.887752.76760.0004
Estonia0.59373.82110.31450.16885.15872.46020.0001
Ethiopia1.44150.00014.05273.96990.00436.63250.0016
France63.689917.798543.037519.973938.2852123.36962.3177
Gabon0.16753.0610.50530.21191.24590.20310.0003
Germany128.619427.521985.655739.6942229.6395147.70710.0448
Greece6.56923.90614.36184.696917.626117.62150.0019
Greenland0.33170.01110.04460.00010.09180.09540.0011
Guyana0.28450.38230.63250.15460.83711.03110.0001
Honduras0.80770.01790.8530.63813.32014.65890.0326
Hong Kong SAR, China1.46050.23151.73930.62723.36275.19480.0111
Hungary10.80863.47775.94343.19229.310714.68290.0185
Indonesia30.482127.5292141.77548.6038254.6386147.55680.1707
Ireland8.11910.47923.74771.3269.617911.25710.0095
Italy56.91911.884437.924220.1273100.683104.01280.4144
Jamaica0.36160.00711.10010.4532.1512.29550.0007
Japan115.158936.4151165.426569.6834432.8552186.58653.2744
Jordan2.57860.45631.8581.71297.84677.86840.0002
Korea, DPR.10.41760.26129.34512.705712.09734.6020.0111
Korea, Rep.53.14748.315164.541759.36253.7968106.58761.6145
Kuwait0.798720.281216.24956.601950.217915.24470.0004
Lao PDR0.08240.00880.96175.902214.96472.61580.0153
Lithuania1.19051.34331.05741.84141.20076.1020.0022
Macao SAR, China0.36010.14640.35760.00440.72561.32530.0009
North Macedonia0.23610.00351.25290.71723.672.46360.0199
Malaysia8.452435.631636.928119.5656113.006659.25850.0765
Malta0.15570.00170.05970.0110.79140.73970.0003
Mexico27.479358.493840.999857.4252150.3145128.05240.4989
Moldova1.83090.04540.8090.64193.67352.34130.0024
Mongolia3.23541.85242.32410.539915.11252.82520.0009
Myanmar6.20351.0117.39063.01758.44055.19640.0463
New Zealand3.31970.92045.59183.12085.878514.86410.0022
Norway2.380411.78936.35678.58861.641313.73870.0556
Papua New Guinea0.67720.46610.67580.12631.37562.49060.001
Peru5.07443.10237.39665.472311.550423.18080.0095
Philippines13.37680.78413.174211.739675.368834.84750.1508
Poland46.232712.13627.052118.5801143.698867.71510.1974
Portugal3.76111.9835.1853.90118.01316.41970.202
Romania12.10412.879312.56527.704419.120120.74840.0049
Singapore0.72284.636113.43189.72321.17166.03050.0415
Slovenia1.07910.01021.69591.46883.48775.3820.0055
Spain30.357817.8626.961519.497542.874692.93294.0727
Suriname0.5770.03730.10450.02020.96940.83060.0002
Sweden2.04493.7876.52764.13355.931613.61220.156
Switzerland9.96310.41024.40432.58342.55114.44440.0086
Thailand13.087715.349757.814129.281379.287678.88040.0186
Timor-Leste0.08780.06510.0790.00330.14890.32790.0002
Turkiye71.048217.431573.810150.3655128.704790.11470.0019
Ukraine16.311511.856120.516813.650251.460821.78060.0123
United Kingdom80.908225.759332.05611.312368.914107.00330.0558
United States591.1872294.5233451.4372163.51351580.1891699.4280.0034
Uruguay0.91360.3990.95060.37631.46723.97260.0014
Venezuela, RB3.178535.76376.38655.263913.574613.540.0177
Viet Nam15.41581.703488.551653.4234127.955235.04340.0506
Source: Worldbank [38].
Table A2. PROMETHEE II ranking.
Country
Name
PROMETHEE RankGDP
(Current US$)
GDP RankCarbon İntensity of GDP (kg CO2e per Constant 2015 US$ of GDP)
Timor-Leste12,079,916,900.00720.40
Malta222,328,640,241.56610.09
Suriname33,455,146,280.84710.58
Guyana417,159,509,565.47660.17
Greenland5-730.21
Gabon619,388,402,541.67650.30
Macao SAR, China745,803,067,940.41540.07
Benin819,676,049,075.70630.36
Estonia941,291,245,222.19570.41
Jamaica1019,423,355,409.23640.45
Brunei Darussalam1115,128,292,980.86700.74
Papua New Guinea1230,729,242,919.44590.23
Uruguay1377,240,830,877.46480.14
Moldova1416,539,436,547.30671.07
Lao PDR1515,843,155,731.26681.28
Jordan1650,967,475,352.11530.52
North Macedonia1715,763,621,848.12690.75
Cuba18-730.27
Ethiopia19163,697,927,593.98430.15
Lithuania2079,789,877,416.17470.24
Slovenia2169,148,468,417.32510.22
Bosnia and Herzegovina2227,514,782,476.04601.06
Mongolia2320,325,121,393.91621.81
Honduras2434,400,509,852.04580.41
Dominican Republic25121,444,279,313.93440.13
Cambodia2642,335,646,895.80560.49
Hong Kong SAR, China27380,812,234,827.83300.11
Denmark28407,091,920,305.40270.07
Bolivia2945,135,398,008.82550.60
Bulgaria30102,407,653,020.61460.63
Korea, Rep.311,712,792,854,202.37110.33
Kuwait32163,704,878,875.85420.93
New Zealand33252,175,506,110.17370.16
Azerbaijan3472,356,176,470.59490.74
Ireland35551,394,889,339.78200.07
Switzerland36884,940,402,230.41150.04
Greece37243,498,333,237.80390.23
Ecuador38118,844,826,000.00450.41
Singapore39501,427,500,080.06230.15
Austria40511,685,203,845.00220.14
Myanmar4166,757,619,000.00520.52
Belarus4271,857,382,745.61500.91
Korea, Dem. People’s Rep.43-73-
Norway44485,310,823,603.66240.10
Sweden45584,960,475,767.32190.06
Venezuela, RB46-73-
Peru47267,603,248,655.25360.26
Hungary48212,388,906,458.72400.28
Portugal49289,114,289,663.54350.15
Chile50335,533,331,669.22340.30
Romania51350,775,856,415.19320.30
Belgium52644,782,756,682.76180.16
Egypt, Arab Rep.53396,002,496,996.96290.53
Czechia54343,207,874,553.73330.41
Algeria55247,626,161,016.41380.84
Colombia56363,493,841,244.30310.28
Ukraine57178,757,021,965.01411.78
Philippines58437,146,372,729.94250.37
Argentina59646,075,277,525.13170.31
Turkiye601,118,252,964,260.77140.35
Viet Nam61429,716,969,043.57260.98
Thailand62514,968,699,239.01210.60
Malaysia63399,705,169,318.48280.71
Australia641,728,057,316,695.61100.23
Poland65809,200,697,797.09160.45
Spain661,620,090,734,956.89120.16
United Kingdom673,380,854,520,809.5450.09
United States6827,720,709,000,000.0010.21
Italy692,300,941,152,991.8170.15
France703,051,831,611,384.7660.11
Mexico711,789,114,434,843.4690.37
Germany724,525,703,903,627.5330.16
Indonesia731,371,171,152,331.16130.57
Brazil742,173,665,655,937.2780.24
Japan754,204,494,802,431.5540.21
China7617,794,783,039,552.0020.75

References

  1. Stern, N. The Economics of Climate Change; Cambridge University Press: Cambridge, UK, 2022. [Google Scholar]
  2. IPCC. Climate Change 2023: Synthesis Report. 2023. Available online: https://www.ipcc.ch/report/ar6/syr/ (accessed on 7 July 2025).
  3. International Energy Agency. Energy System. 2023. Available online: https://www.iea.org/energy-system (accessed on 7 July 2025).
  4. Climate Change Directorate. 2025 Yılı Performans Programı; T.C. Çevre, Şehircilik ve İklim Değişikliği Bakanlığı: Ankara, Türkiye, 2025. Available online: https://iklim.gov.tr/db/turkce/icerikler/files/Performans%20Program%C4%B1%202025.pdf (accessed on 7 July 2025).
  5. Brans, J.P.; Mareschal, B. Promethee methods. In Multiple Criteria Decision Analysis: State of the Art Surveys; International Series in Operations Research & Management Science; Figueira, J., Greco, S., Ehrgott, M., Eds.; Springer: New York, NY, USA, 2005; Volume 78. [Google Scholar] [CrossRef]
  6. Keshavarz-Ghorabaee, M.; Amiri, M.; Zavadskas, E.K.; Turskis, Z.; Antucheviciene, J. Determination of objective weights using a new method based on the removal effects of criteria (MEREC). Symmetry 2021, 13, 525. [Google Scholar] [CrossRef]
  7. Tighnavard, A.; Balasbaneh, A.; Aldrovandi, S.; Sher, W. A systematic review of implementing multi-criteria decision-making (MCDM) approaches for the circular economy and cost assessment. Sustainability 2025, 17, 5007. [Google Scholar] [CrossRef]
  8. Elsayed, A. Multi-criteria decision-making framework for evaluating green fuels alternatives: A hybrid MEREC-TODIM approach. Neutrosophic Optim. Intell. Syst. 2024, 3, 41–56. [Google Scholar] [CrossRef]
  9. Chen, J.; Li, Z.; Dong, Y.; Song, M.; Shahbaz, M.; Xie, Q. Coupling coordination between carbon emissions and the eco-environment in China. J. Clean. Prod. 2020, 276, 123848. [Google Scholar] [CrossRef]
  10. Behzadian, M.; Kazemzadeh, R.B.; Albadvi, A.; Aghdasi, M. PROMETHEE: A comprehensive literature review on methodologies and applications. Eur. J. Oper. Res. 2010, 200, 198–215. [Google Scholar] [CrossRef]
  11. Mardani, A.; Zavadskas, E.K.; Khalifah, Z.; Jusoh, A.; Nor, K.M. Application of multiple-criteria decision-making techniques and approaches to evaluating of service quality: A systematic review. J. Bus. Econ. Manag. 2015, 16, 1034–1068. [Google Scholar] [CrossRef]
  12. Hezam, I.M.; Mishra, A.R.; Rani, P.; Cavallaro, F.; Saha, A.; Ali, J.; Strielkowski, W.; Štreimikienė, D. A hybrid intuitionistic fuzzy-MEREC-RS-DNMA method for assessing the alternative fuel vehicles with sustainability perspectives. Sustainability 2022, 14, 5463. [Google Scholar] [CrossRef]
  13. Zorlu, K.; Dede, V.; Zorlu, B.Ş.; Serin, S. Quantitative assessment of geoheritage with the GAM and MEREC-based PROMETHEE-GAIA method. Resour. Policy 2023, 84, 103796. [Google Scholar] [CrossRef]
  14. Bertoncini, M.; Boggio, A.; Dell’Anna, F.; Becchio, C.; Bottero, M. An application of the PROMETHEE II method for the comparison of energy requalification strategies to design post-carbon cities. AIMS Energy 2022, 10, 553–581. [Google Scholar] [CrossRef]
  15. Miçooğulları, S.A. The nexus between carbon emissions and economic growth in Türkiye at the 100th anniversary of the Republic: Rolling window causality analysis with historical data. Kent Akad. 2023, 16, 175–188. [Google Scholar] [CrossRef]
  16. Li, T.; Li, A.; Song, Y. Development and utilization of renewable energy based on carbon emission reduction—Evaluation of multiple MCDM methods. Sustainability 2021, 13, 9822. [Google Scholar] [CrossRef]
  17. Saraswat, S.K.; Digalwar, A.K. Evaluation of energy alternatives for sustainable development of energy sector in India: An integrated Shannon’s entropy fuzzy multi-criteria decision approach. Renew. Energy 2021, 171, 58–74. [Google Scholar] [CrossRef]
  18. Esangbedo, M.O.; Tang, M. Evaluation of enterprise decarbonization scheme based on grey-MEREC-MAIRCA hybrid MCDM method. Systems 2023, 11, 397. [Google Scholar] [CrossRef]
  19. Xue, X.; Zhang, Q.; Cai, X.; Ponkratov, V.V. Multi-criteria decision analysis for evaluating the effectiveness of alternative energy sources in China. Sustainability 2023, 15, 8142. [Google Scholar] [CrossRef]
  20. Martins, M.B.; Ferreira, M.F.; Costa, S.G. Combining value-focused thinking and PROMETHEE techniques to support the selection of distributed generation technologies in Brazil. Sustainability 2021, 13, 11091. [Google Scholar] [CrossRef]
  21. Richards, D.; Kumar, A.; Elbeltagi, I.; Zhang, Y. Sustainable solar energy deployment: A multi-criteria decision-making approach for site suitability and greenhouse gas emission reduction. Environ. Sci. Pollut. Res. 2025, 32, 2007–2035. [Google Scholar] [CrossRef]
  22. Soytaş, U.; Sarı, R. Energy consumption, economic growth, and carbon emissions: Challenges faced by an EU candidate member. Ecol. Econ. 2009, 68, 1667–1675. [Google Scholar] [CrossRef]
  23. Ozdemir, B.K.; Koç, K. Türkiye’de karbon emisyonlari, yenilenebilir enerji ve ekonomik büyüme. Ege Strat. Araştırmalar Derg. 2020, 11, 66–86. [Google Scholar] [CrossRef]
  24. Çoban, O. Yenilenebilir enerji tüketimi karbon ve emisyonu ilişkisi: TR örneği. Erciyes Üniversitesi Sos. Bilim. Enstitüsü Derg. 2015, 1, 195–208. [Google Scholar]
  25. European Bank for Reconstruction and Development. Türkiye Ülke Stratejisi 2024–2029. 2023. Available online: https://www.ebrd.com/content/dam/ebrd_dxp/assets/pdfs/country-strategies/t%C3%BCrkiye/Turkiye+Country+Strategy+-+translated_final.pdf (accessed on 7 July 2025).
  26. Avşar, İ.İ.; Ecemiş, O. Yeşil lojistik ve çok kriterli karar verme üzerine inceleme. J. Int. Econ. Financ. Trade 2023, 1, 29–48. [Google Scholar]
  27. Brans, J.P.; Vincke, P. Note—A preference ranking organisation method. Manag. Sci. 1985, 31, 647–656. [Google Scholar] [CrossRef]
  28. Brans, J.P.; Vincke, P.; Mareschal, B. How to select and how to rank projects: The Promethee method. Eur. J. Oper. Res. 1986, 24, 228–238. [Google Scholar] [CrossRef]
  29. Brans, J.P. L’ingénièrie de la décision; Elaboration d’instruments d’aide à la decision, La méthode PROMETHEE. In L’aide à la Décision: Nature, Instruments et Perspectives D’Avenir; Nadeau, R., Landry, M., Eds.; Presses de l’Université Laval: Québec, QC, Canada, 1982; pp. 183–213. [Google Scholar]
  30. Hu, Y.; Panyadee, C. LogTODIM-PROMETHEE technique for development evaluation of school-enterprise cooperation from the perspective of collaborative education based on the probabilistic linguistic group decision-making. Heliyon 2024, 10, e33391. [Google Scholar] [CrossRef] [PubMed]
  31. Peng, D. Comprehensive analysis using probabilistic linguistic group decision-making and MEREC technique with sustainable development evaluation in higher education. Int. J. Decis. Support Syst. Technol. 2024, 16, 24. [Google Scholar] [CrossRef]
  32. He, T.; Wang, Q. Analyzing the service quality evaluation of railway cold chain logistics based on probabilistic linguistic group decision-making. Int. J. Decis. Support Syst. Technol. 2025, 17, 1–20. [Google Scholar] [CrossRef]
  33. Mao, Q.; Fan, J.; Gao, Y. An investment framework for hydro-wind-photovoltaic-hydrogen hybrid power system based on the improved picture fuzzy regret-PROMETHEE model. Int. J. Hydrogen Energy 2025, 106, 565–585. [Google Scholar] [CrossRef]
  34. Dang, Y. Intelligent optimization algorithm for strategic planning in economics with multi-factors assessment: A ME-REC-driven Heronian mean framework. AIMS Math. 2025, 10, 10866–10897. [Google Scholar] [CrossRef]
  35. PROMETHEE-GAIA, Bertrand Mareschal ULB Personal Pages. Available online: https://bertrand.mareschal.web.ulb.be/promethee.html (accessed on 8 April 2025).
  36. Bošković, S.; Švadlenka, L.; Jovčić, L.; Dobrodolac, M.; Simić, V.; Bacanin, N. An alternative ranking order method accounting for two-step normalization (AROMAN)—A case study of the electric vehicle selection problem. IEEE Access 2023, 11, 39496–39507. [Google Scholar] [CrossRef]
  37. Türkiye İstatistik Kurumu. Sera Gazı Emisyon İstatistikleri, 1990–2023 (Haber Bülteni No: 53974). 2024. Available online: https://data.tuik.gov.tr/Bulten/Index?p=Sera-Gazi-Emisyon-Istatistikleri-1990-2023-53974 (accessed on 8 April 2025).
  38. World Bank. World Bank Open Data. Available online: https://data.worldbank.org (accessed on 8 April 2025).
Figure 1. Research model.
Sustainability 17 06527 g001
Figure 2. Position of alternatives according to criteria and analysis quality.
Sustainability 17 06527 g002
Figure 3. The top and bottom 10 countries, ranked using the PROMETHEE II method.
Sustainability 17 06527 g003
Table 1. Description of the criteria.
Criteria NumberBenefit/CostCriteria Description (Mt CO2e)
Criteria 1CostCarbon dioxide (CO2) emissions from building (energy)
Criteria 2CostCarbon dioxide (CO2) emissions from fugitive emissions
Criteria 3CostCarbon dioxide (CO2) emissions from industrial combustion (energy)
Criteria 4CostCarbon dioxide (CO2) emissions from industrial processes
Criteria 5CostCarbon dioxide (CO2) emissions from power industry (energy)
Criteria 6CostCarbon dioxide (CO2) emissions from transport (energy)
Criteria 7CostCarbon dioxide (CO2) emissions from waste
Table 2. Criteria weight.
Criteria 1Criteria 2Criteria 3Criteria 4Criteria 5Criteria 6Criteria 7
Weight0.2257800.0774110.1954520.0262000.0520250.1959950.227138
Table 3. Sensitivity analysis.
Country β = 0.0 β = 0.1 β = 0.2 β = 0.3 β = 0.4 β = 0.5
Timor-Leste111111
Malta222222
Suriname333333
Guyana444444
Greenland556666
Gabon665555
Macao778899
Benin887777
Estonia999988
Jamaica101010101010
Disclaimer/Publisher’s Note: The statements, opinions and data contained in all publications are solely those of the individual author(s) and contributor(s) and not of MDPI and/or the editor(s). MDPI and/or the editor(s) disclaim responsibility for any injury to people or property resulting from any ideas, methods, instructions or products referred to in the content.

