3.1. Climatic Conditions and Atmospheric Precipitation Dynamics
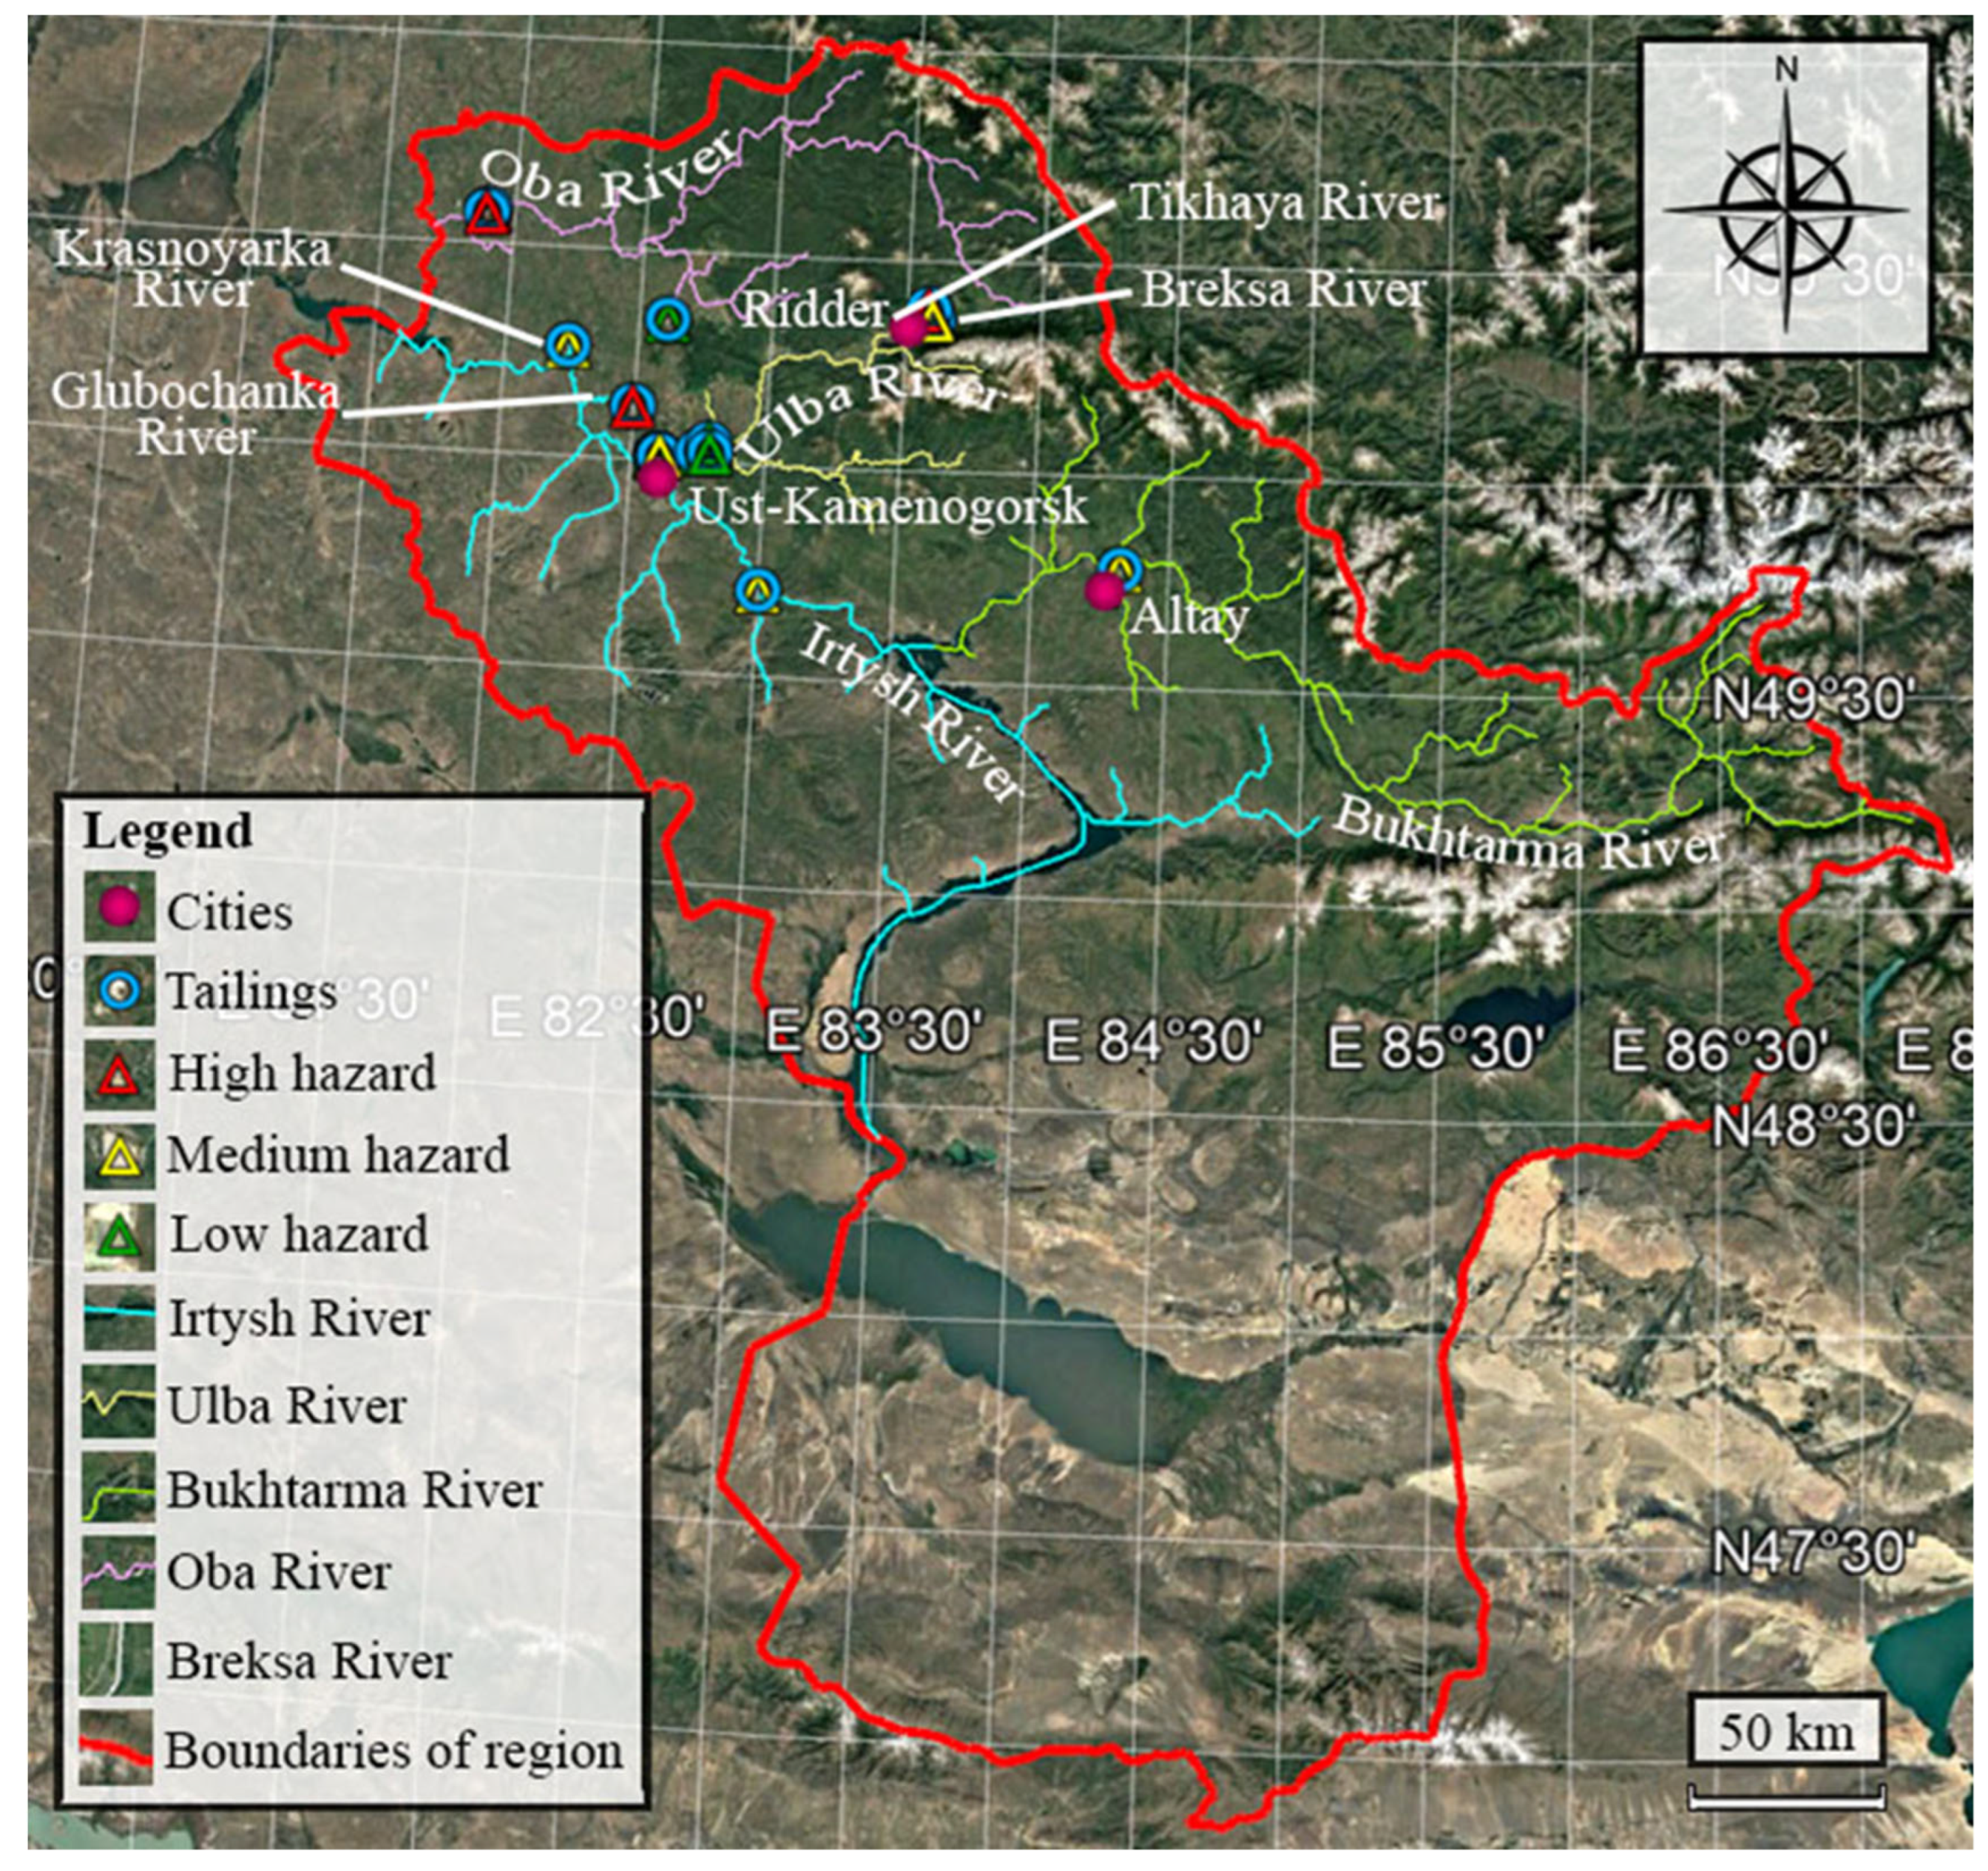
In the present study, the analysis and assessment of surface water pollution in East Kazakhstan Region were conducted in accordance with the unified classification system for six rivers: Breksa, Tikhaya, Ulba, Glubochanka, Krasnoyarka, and Oba (
Figure 1).
Figure 1 illustrates the river basins of the Irtysh, Bukhtarma, Oba, and Ulba, with each basin represented in a distinct color. The Tikhaya and Breksa rivers are tributaries of the upper Ulba River, located upstream of the city of Ridder (
Figure 2). The Glubochanka and Krasnoyarka rivers are small right-bank tributaries of the Irtysh River (
Figure 2). As we can see from the maps presented, it is the small rivers under study that are under the influence of dangerous tailings ponds [
25]. To improve clarity, coordinate grids and scale bars were added to
Figure 1 and
Figure 2. The GIS-based map data illustrate the locations of the studied rivers and the main sources of anthropogenic impact. It should be noted that the distances between sampling points and specific pollution sources are approximate due to map scale limitations and the lack of detailed hydrographic data.
Figure 1 and
Figure 2 show the Tailings Hazard Index according to research on mapping of tailings in Central Asia: high, medium, and low [
25].
In turn, the assignment of the hazard index is based on the Methodology for Training Management Facilities (TMFs) of the UNECE [
26]. According to the methodology, the Tailings Hazard Index (THI) and the Tailings Risk Index (TRI) are assigned to a tailings dump based on the following indicators: used capacity (Mio m
3), material category, toxic substances, substance toxicity (water hazard class), TMF status (closed, active, rehabilitated), flood occurrence (HQ-500 is the estimated flood once every 500 years, H is the height or water level (hydraulic), Q is the flow rate, 500 is the period of recurrence), seismic activity (reference peak ground acceleration (PGA), m/s
2), dam stability (factor of safety (FoS)), settlements at risk, total population at risk, closest surface water body at risk, mean stream flow rate (m
3/s), and lake surface area (km
2).
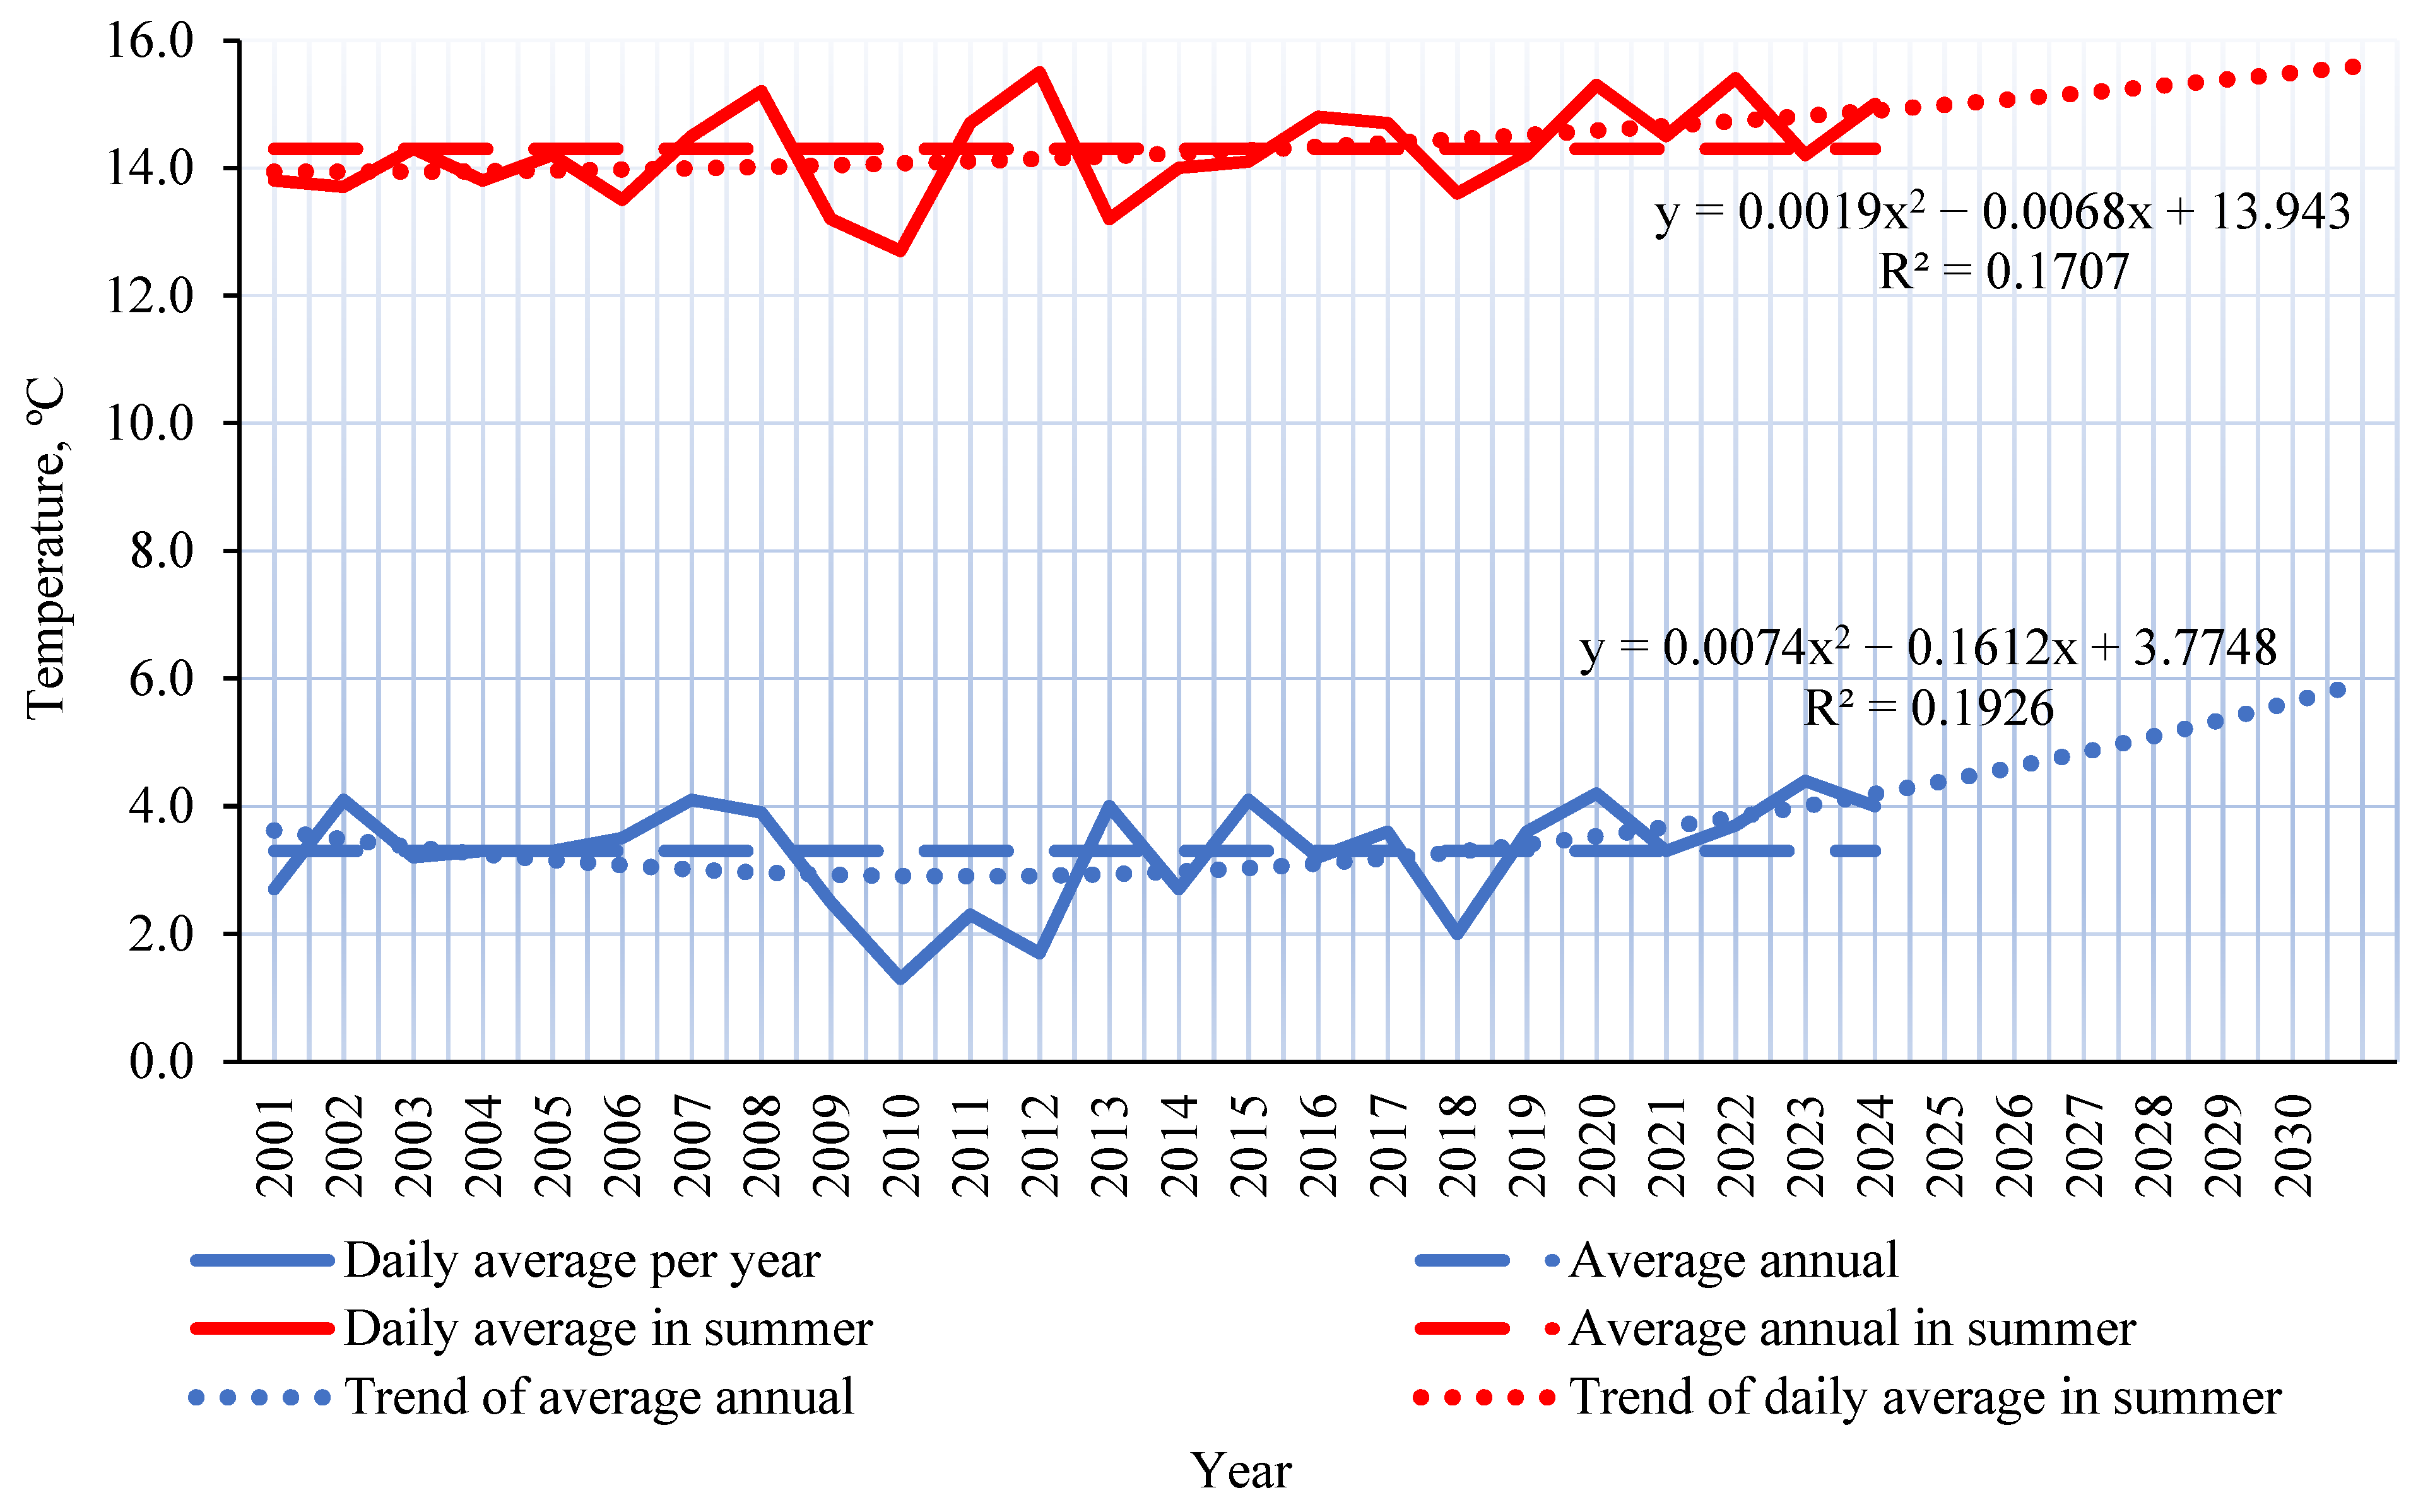
The analysis of weather conditions in East Kazakhstan region was carried out based on long-term data from seven weather stations operated by the National Hydrometeorological Service of Kazakhstan, “Kazhydromet” [
22]. These weather stations are located directly within the study area. The available observation records in digital format cover the period from 2001 to the present; however, digital data has been available for only two weather stations since 2008. This time frame was considered sufficient to assess climatic changes in the region. To evaluate regional climate trends, data were processed using Excel software, and forecasts were generated using second-degree polynomial trendlines.
The analysis of weather data showed that temperature trends align with global patterns and indicate a gradual increase in air temperature in the region (
Figure 3). Despite the lows recorded in 2010 and 2012, the overall trend remains upward. Notably, although the average annual temperature decreased in 2012, the summer of that year was among the hottest. A similar discrepancy between annual and summer temperatures was observed again in 2024. Overall, the years following 2018 have been the warmest in the region throughout the entire observation period. The trend lines plotted in accordance with Equation (2) (R
2 = 0.17) for average annual temperatures and Equation (3) (R
2 = 0.19) for summer temperatures also clearly demonstrate a steady upward trend in temperature throughout the region.
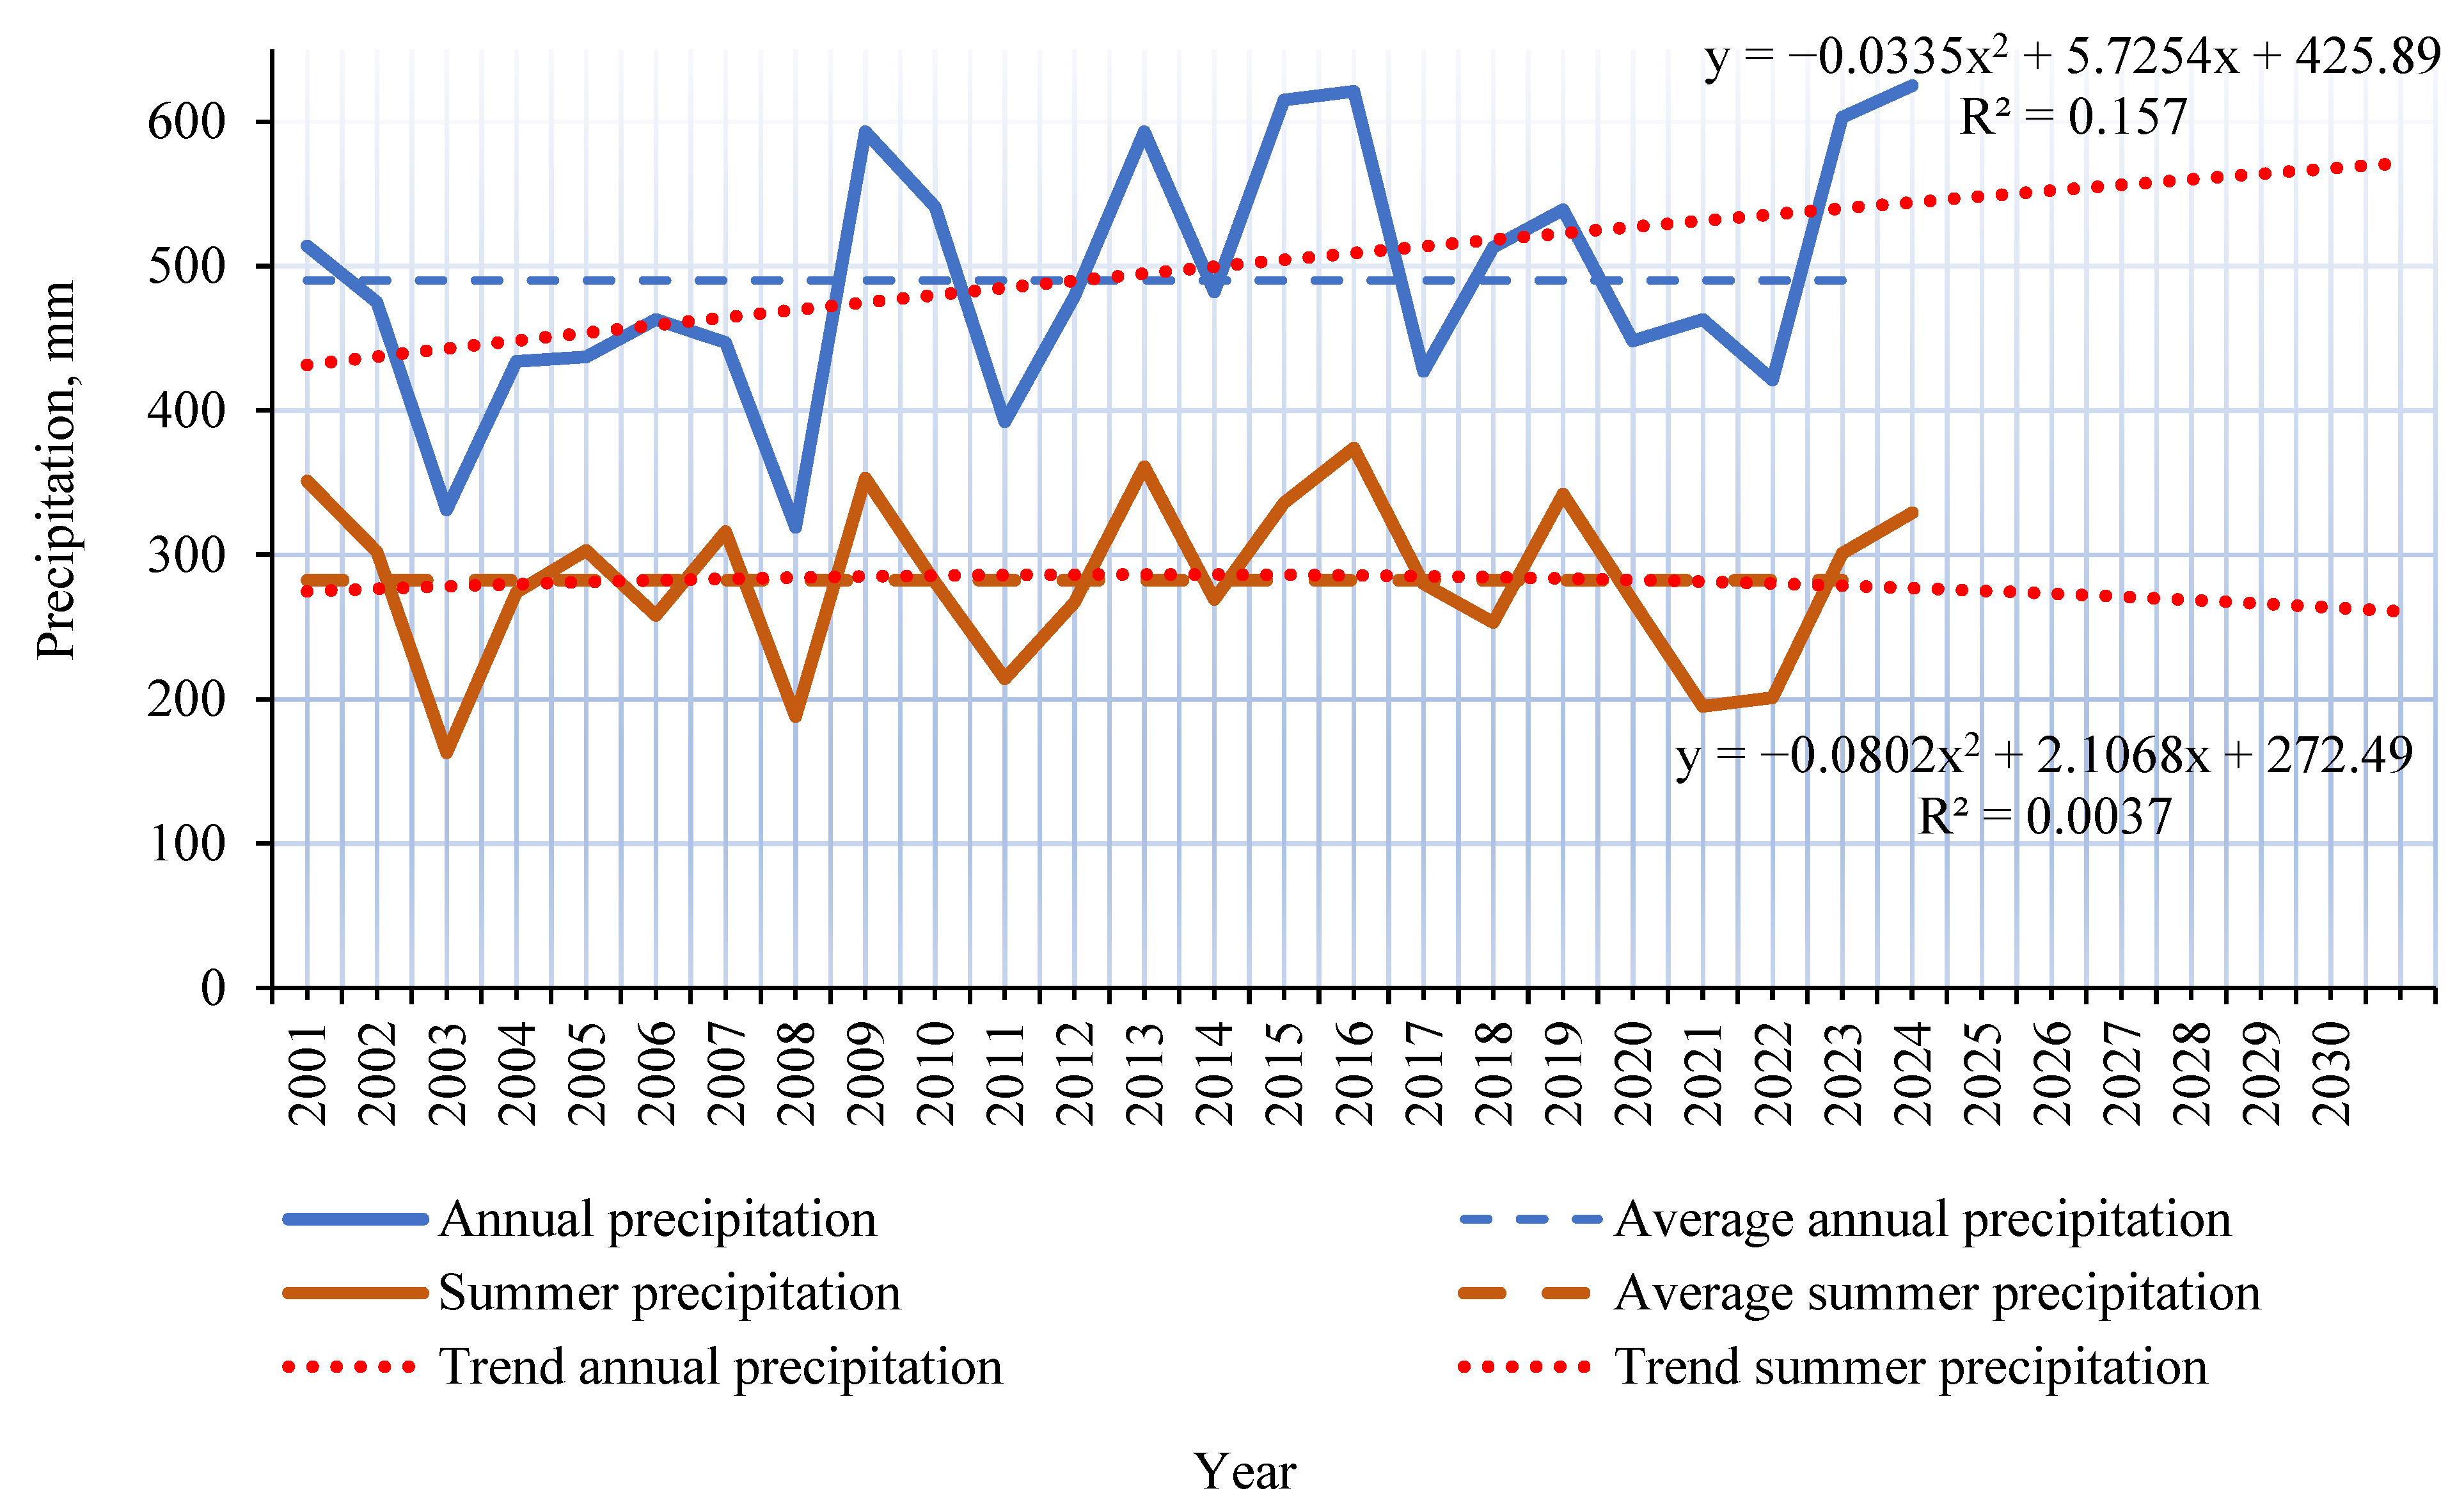
Figure 4 presents data on precipitation levels in the region (annual and summer values). On one hand, the graph indicates a gradual increase in precipitation, with both indicators exceeding the average for the study period since 2009. However, in recent years, starting from 2020, precipitation has been declining. The trend lines were constructed using Equation (4) (R
2 = 0.16) for the annual average and Equation (5) (R
2 = 0.004) for the summer period. The forecast suggests a slight increase in average annual precipitation, while summer precipitation is expected to decrease. In general, this trend correlates with rising temperatures and reflects the broader picture of climate warming—summers in the region are becoming hotter and drier.
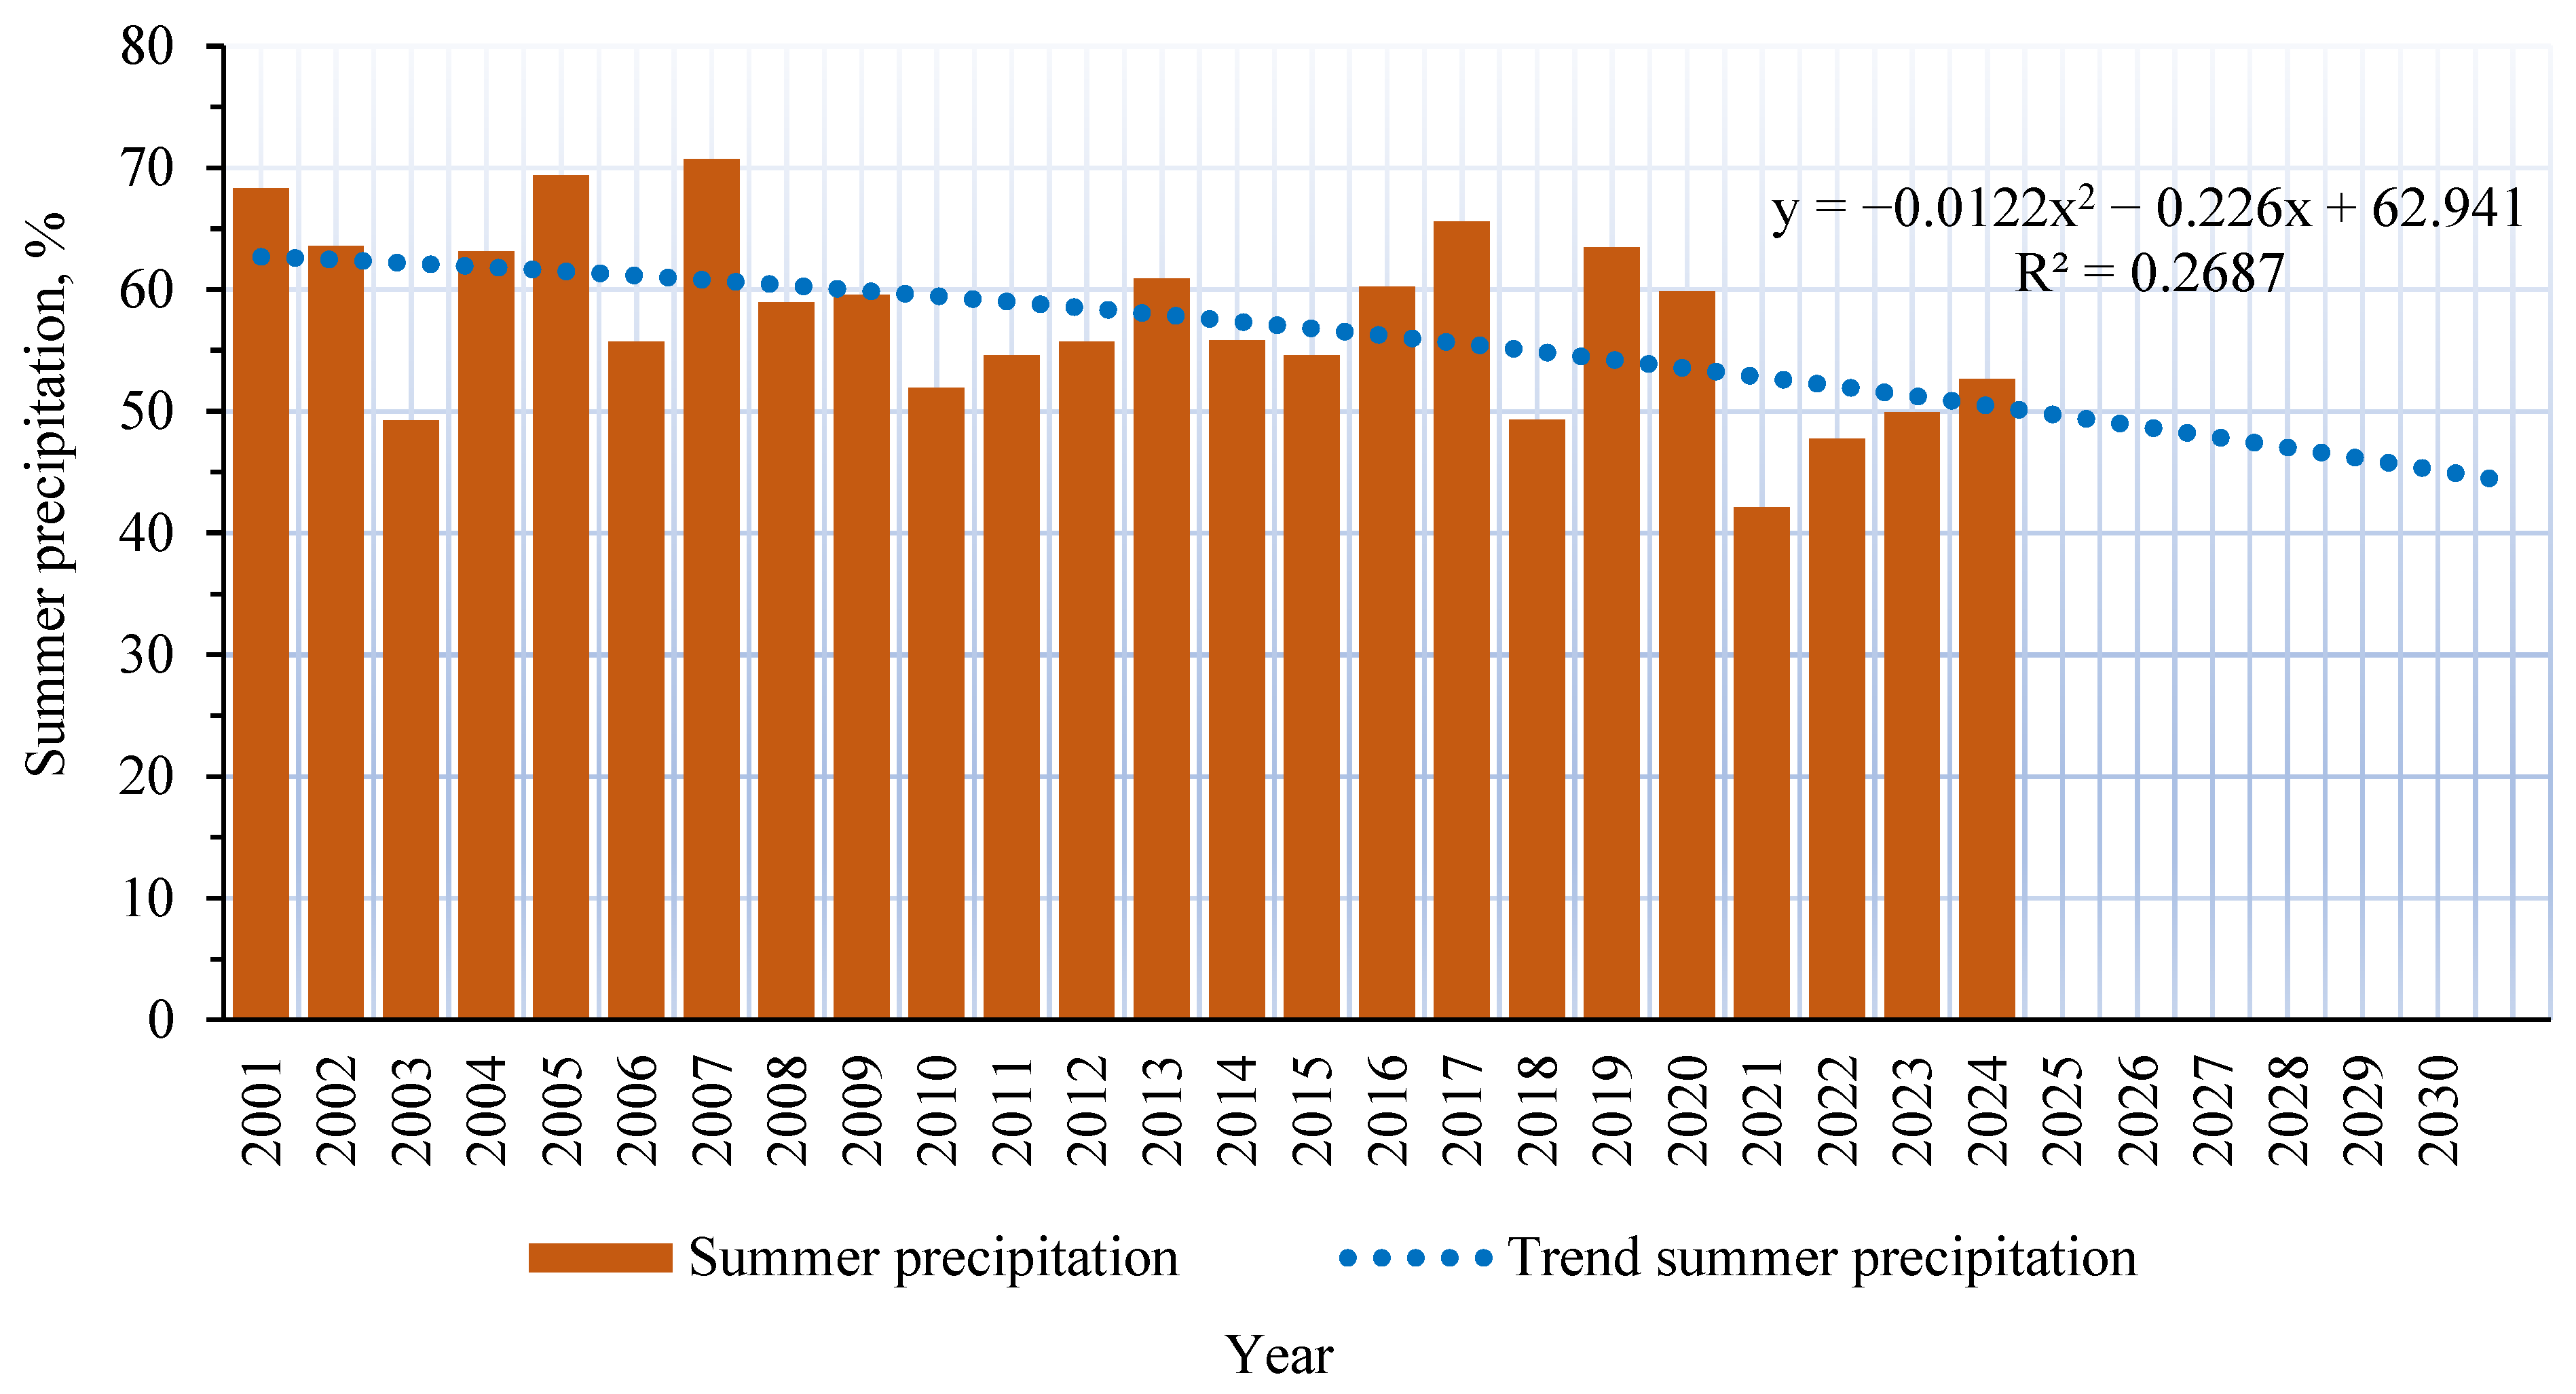
An assessment of long-term climatic trends in the region revealed a significant shift: whereas previously most precipitation in East Kazakhstan occurred in the warm season, there is now a consistent increase in winter precipitation and a decrease during summer (
Figure 5). For the region’s sharply continental climate, this trend indicates increased summer aridity, which can substantially affect the flow of small rivers and the efficiency of natural self-purification processes in aquatic ecosystems. Forecast values derived from trend lines (Equation (6)) confirm this shift (R
2 = 0.269).
Weather conditions, including precipitation and seasonal changes, have a significant impact on the state of water flows in East Kazakhstan. In summer, precipitation plays a key role in recharging rivers, which is especially important in areas with little snow or glacial coverage. Winters in the region are also becoming milder, and the amount of snowfall is decreasing, reducing spring runoff in rivers. At the same time, the rapid melting of snow in spring leads to severe flooding, while in summer, water flows diminish more quickly than usual.
The increase in average annual temperature accelerates evaporation processes, exacerbating water scarcity. This inevitably leads to a decline in water quality, as the concentration of pollutants rises with lower runoff levels.
Thus, climate change in Kazakhstan, manifested by decreasing annual precipitation and overall warming, has a negative impact on the stability of water flows. This is especially critical for small, heavily polluted rivers in the region.
3.2. pH Changes and Acid–Base Dynamics
The pH value is one of the most important indicators of water quality, reflecting the state of acid–base balance in aquatic ecosystems. It plays a crucial role in determining the development and vital functions of aquatic biota, the mobility and chemical form of various elements, as well as the corrosive effects of water on bedrock, metals, and concrete structures. The pH level of surface water is influenced by a complex set of processes, including carbonate equilibrium, the intensity of photosynthesis and decomposition of organic matter, and the concentration of humic substances, among others. The hydrogen ion concentration is subject to seasonal fluctuations: river and lake waters typically exhibit lower pH values in winter compared to summer. During winter, pH values in most rivers range from 6.8 to 7.4, while in summer they increase to 7.4–8.2 [
22]. Comparative pH values for the studied water bodies over the period from 2015 to 2024 are presented in
Table S5.
The pH values of the surface waters of all analyzed sites during the entire study period from 2017 to 2024 were within the range of 6.5–8.5, which meets the requirements for the composition and properties of reservoir water at drinking water intake points and recreational water bodies, as well as reservoirs used for fisheries purposes (
Table S5).
From 2017 to 2024, the pH levels in most rivers of the East Kazakhstan Region remained within the range of a slightly alkaline environment (7.5–8.5), although in recent years, wider fluctuations have been observed, particularly in 2023–2024.
Yearly analysis:
2017–2018: pH levels were stable, averaging 7.5–8.2, indicating consistent water quality.
2019–2020: pH fluctuations were observed throughout the year. Possible causes include seasonal changes, flooding, and anthropogenic influences.
2021–2022: Wide pH ranges were recorded (e.g., in the Tikhaya River—from 7.35 to 8.37), which may indicate localized pollution, runoff, or changes in water composition.
2023–2024: For the first time, values below 7 were recorded (as low as 6.90 and even 6.60), especially in the Ulba and Tikhaya rivers. Episodes of acid contamination are likely, possibly due to wastewater discharge or snowmelt from polluted areas.
In 2023–2024, the pH of surface waters in the Ulba River decreased to 6.60, indicating a possible acidification episode. The precise causes of pH variation are difficult to determine due to the lack of detailed information on wastewater composition and the locations of mines, tailings, and other potential sources of pollution. Possible contributing factors include the discharge of acidic mine waters, surface runoff from contaminated areas, acid precipitation, and seasonal hydrological fluctuations. Given the region’s complex geochemical structure and the presence of numerous polymetallic deposits, further research is needed to identify spatial and temporal patterns of pH variation and determine their sources.
The Tikhaya River showed the widest range of fluctuations in recent years (from 6.90 to 8.40), which requires enhanced and separate monitoring.
The surface waters of the Glubochanka and Krasnoyarka rivers remained the most stable—while some fluctuations occurred, the pH always stayed within the 8.0–8.5 range, likely due to the alkaline nature of soils or limestone in the river basins.
Overall, the rivers of East Kazakhstan Region exhibit an alkaline reaction; however, since 2021, increased instability and instances of pH dropping below neutral have been recorded. The rivers with the highest pH variability are Tikhaya, Ulba, and Breksa. Continuous monitoring and investigation of the causes of these fluctuations—including seasonal discharges, surface runoff, and climate change—are necessary.
Following the general analysis of pH dynamics in surface waters across the region, it is advisable to conduct a more detailed assessment of changes in pH for each river, taking into account spatial and temporal variability.
In 2017–2018, pH values in the surface waters of the Breksa River remained stable, ranging from 7.6 to 7.7, indicating a slightly alkaline environment. In 2019–2020, minor fluctuations were observed, with average values around 7.79, likely due to seasonal changes (spring floods, summer precipitation). Starting in 2021, the pH range widened significantly: in 2023, it ranged from 7.16 to 8.35, and in 2024—from 7.05 to 8.43. The minimum pH value (7.05) was recorded in 2024. These fluctuations may indicate instability in the chemical composition of the water under the influence of external factors—both anthropogenic (agricultural and industrial runoff) and natural (melting of polluted snow, climate change). Despite the wider range, the average pH values remain within the sanitary standard (6.5–8.5); however, the observed extremes warrant further monitoring.
In 2017–2018, pH values in the surface waters of the Tikhaya River remained stable (≈7.5), reflecting a steady hydrochemical environment and a slightly alkaline character. In 2019–2020, slight fluctuations were noted (up to 7.9), while average values increased slightly. Since 2021, the pH range has expanded considerably: in 2021–2023, values fluctuated between 6.90 and 8.45, which may indicate instability of the aquatic environment, episodic contamination, or mixing with acidic or alkaline waters. In 2024, the range narrowed (6.94–7.97), but the average value declined, approaching a neutral or slightly acidic reaction. Possible reasons include the influence of wastewater and meltwater, seasonal processes, low buffer capacity, or potential fertilizer contamination. Although the pH values remain within the acceptable range (6.5–8.5), the emerging trend toward instability calls for continued monitoring.
In 2017–2020, pH values in the Ulba River remained stable (7.6–7.8), indicating a slightly alkaline environment and a low level of pollution. Since 2021, wide fluctuations have been recorded (up to 1.14 units per year), likely related to seasonal flooding, the inflow of contaminated water, or industrial discharges. In 2023, a narrow but abnormally high pH range (8.30–8.54) was observed, possibly reflecting alkaline loading from industrial wastewater. In 2024, the range widened to its maximum for the entire observation period (6.60–8.36), including values approaching acidity. These fluctuations may be due to the mixing of surface water with meltwater or rainwater, alkaline discharges, and changes in the composition of tributaries. The trend toward increasing instability requires enhanced environmental oversight, particularly in view of the recorded episodes of sharp pH declines.
From 2017 to 2020, pH values in the Glubochanka River remained consistently high (approximately 8.2–8.3), with minimal fluctuations, indicating a stable, slightly alkaline environment. Between 2021 and 2024, the pH range expanded slightly (by ~0.5 units), but the average values remained nearly unchanged (≈8.25–8.28), confirming the reservoir’s natural buffering capacity. This stability is likely to be due to the mineral composition of the surrounding soil (e.g., carbonates), good water flow, low anthropogenic impact, and the absence of stagnant zones. Among all the rivers studied, the Glubochanka demonstrates one of the most stable pH regimes. Although continued water quality monitoring is necessary, there are no signs of acidification or abrupt fluctuations.
The Krasnoyarka River also exhibited consistently high pH values throughout the analyzed period. In 2017–2020, pH ranged from 8.1 to 8.3, and in 2021–2024, the range widened slightly, while the average values remained stable—around 8.27–8.29. This reflects a persistently slightly alkaline environment and high buffering capacity. Contributing factors likely include natural mineral composition (carbonate or calcareous deposits), low anthropogenic load, a stable hydrological regime, and possible groundwater inflow from alkaline sources. Compared to other rivers in the East Kazakhstan Region, the Krasnoyarka stands out for its pH stability: values remained above 8.0 with no indications of acid stress.
Between 2017 and 2020, pH values in the Oba River were stable (≈7.8–7.9), indicating a slightly alkaline and chemically balanced environment with no marked influence from pollutants. However, since 2021, the range has broadened significantly: in 2022—up to 0.95 units, in 2023—from 7.45 to 8.52, and in 2024—from 7.09 to 8.83, the widest spread observed over the entire period. These fluctuations may result from diverse influences, such as alkaline discharges, seasonal runoff (autumn and spring), flooding, localized pollution, or limited water exchange. While the average values remain within acceptable limits, the recorded extremes and growing instability in recent years highlight the need for ongoing monitoring.
Thus, between 2017 and 2024, most rivers in the East Kazakhstan Region exhibited a trend toward expanding pH ranges while maintaining average values within sanitary norms (6.5–8.5). The most stable pH indicators were observed in the Krasnoyarka and Glubochanka rivers, likely due to natural buffering capacity and low levels of anthropogenic impact. In contrast, the Tikhaya, Ulba, Breksa, and Oba rivers have shown increasing pH instability, particularly over the past three years, which may be attributed to industrial discharges, seasonal runoff, and shifts in hydrological regimes. These findings underscore the necessity of enhanced monitoring in areas with the most pronounced pH fluctuations.
3.3. General Characteristics of Surface Water Quality
It is well known that the time of year is one of the key factors affecting water quality. The highest levels of water pollution are typically observed during spring. Strong frosts with ice and snow constrict the soil and water resources, making it difficult for harmful substances to penetrate them. However, in spring, rising temperatures and snowmelt lead to the release of accumulated pollutants into nearby water bodies, significantly degrading water quality. Spring is also characterized by increased iron concentrations and the active proliferation of pathogenic microorganisms. At the same time, winter cannot be called a favorable time of year for water, as part of the harmful substances enter the water, due to the increase in air pollution during the heating season. Autumn also has specific features that influence water quality. First and foremost is the frequency of precipitation. In urban areas, high concentrations of carbon dioxide and various nitrogen and sulfur oxides can affect the composition of precipitation. These pollutants may enter water bodies directly, including through the municipal drainage and sewer systems.
In this regard, a comprehensive assessment of changes in surface water quality for the small rivers of the East Kazakhstan region considered in this study, which are of important economic importance and are experiencing significant anthropogenic impact for the period from 2017 to 2024 in the context of the months of the year.
One limitation of this analysis is the absence of data on the fractional composition of heavy metals (e.g., separation into dissolved and particulate forms) in official hydrochemical reports by RSE Kazhydromet. This omission hinders a comprehensive assessment of pollutant bioavailability and their potential effects on aquatic ecosystems. Future monitoring programs should include this classification to enhance the informational and environmental relevance of collected data. Furthermore, this study does not examine the biological effects of detected heavy metal concentrations, such as impacts on aquatic organism health or bioaccumulation. Although beyond the current study’s scope, this represents an important area for future research involving hydrobiological and toxicological data.
Based on comprehensive analysis (
Table S6), it was established that the surface waters of the Breksa River reached a critical level of pollution in 2017 due to the high content of zinc, copper and manganese compounds, the maximum concentrations of which were 9.1 MPC; 5.0 MPC and 5.3 MPC, respectively. The surface water of the Breksa River was consistently classified as having a high level of pollution between 2017 and 2018. A slight improvement in the river’s water quality was observed between 2019 and 2022, from “high level of pollution” to “moderate pollution level”. From 2023 to 2024, a decreasing trend was observed in the contamination of the Breksa River with iron, copper, zinc, and manganese compounds. The improvement in the surface water quality of the Breksa River persisted in 2024, corresponding to water quality class 2. By 2024, a significant reduction in nitrite nitrogen and ammonium salt concentrations was recorded in the surface waters of the Breksa River, with average annual levels remaining within MPCs limits. The characteristic pollutants of Breksa River water in 2024 still included iron and manganese compounds, the average annual concentrations of which were 3 MPC and 2.9 MPC, respectively. The content of dissolved oxygen in water for the whole study period, from 2017 to 2024, was within MPCs, and in 2024 did not decrease below 5.95 mg/dm
3.
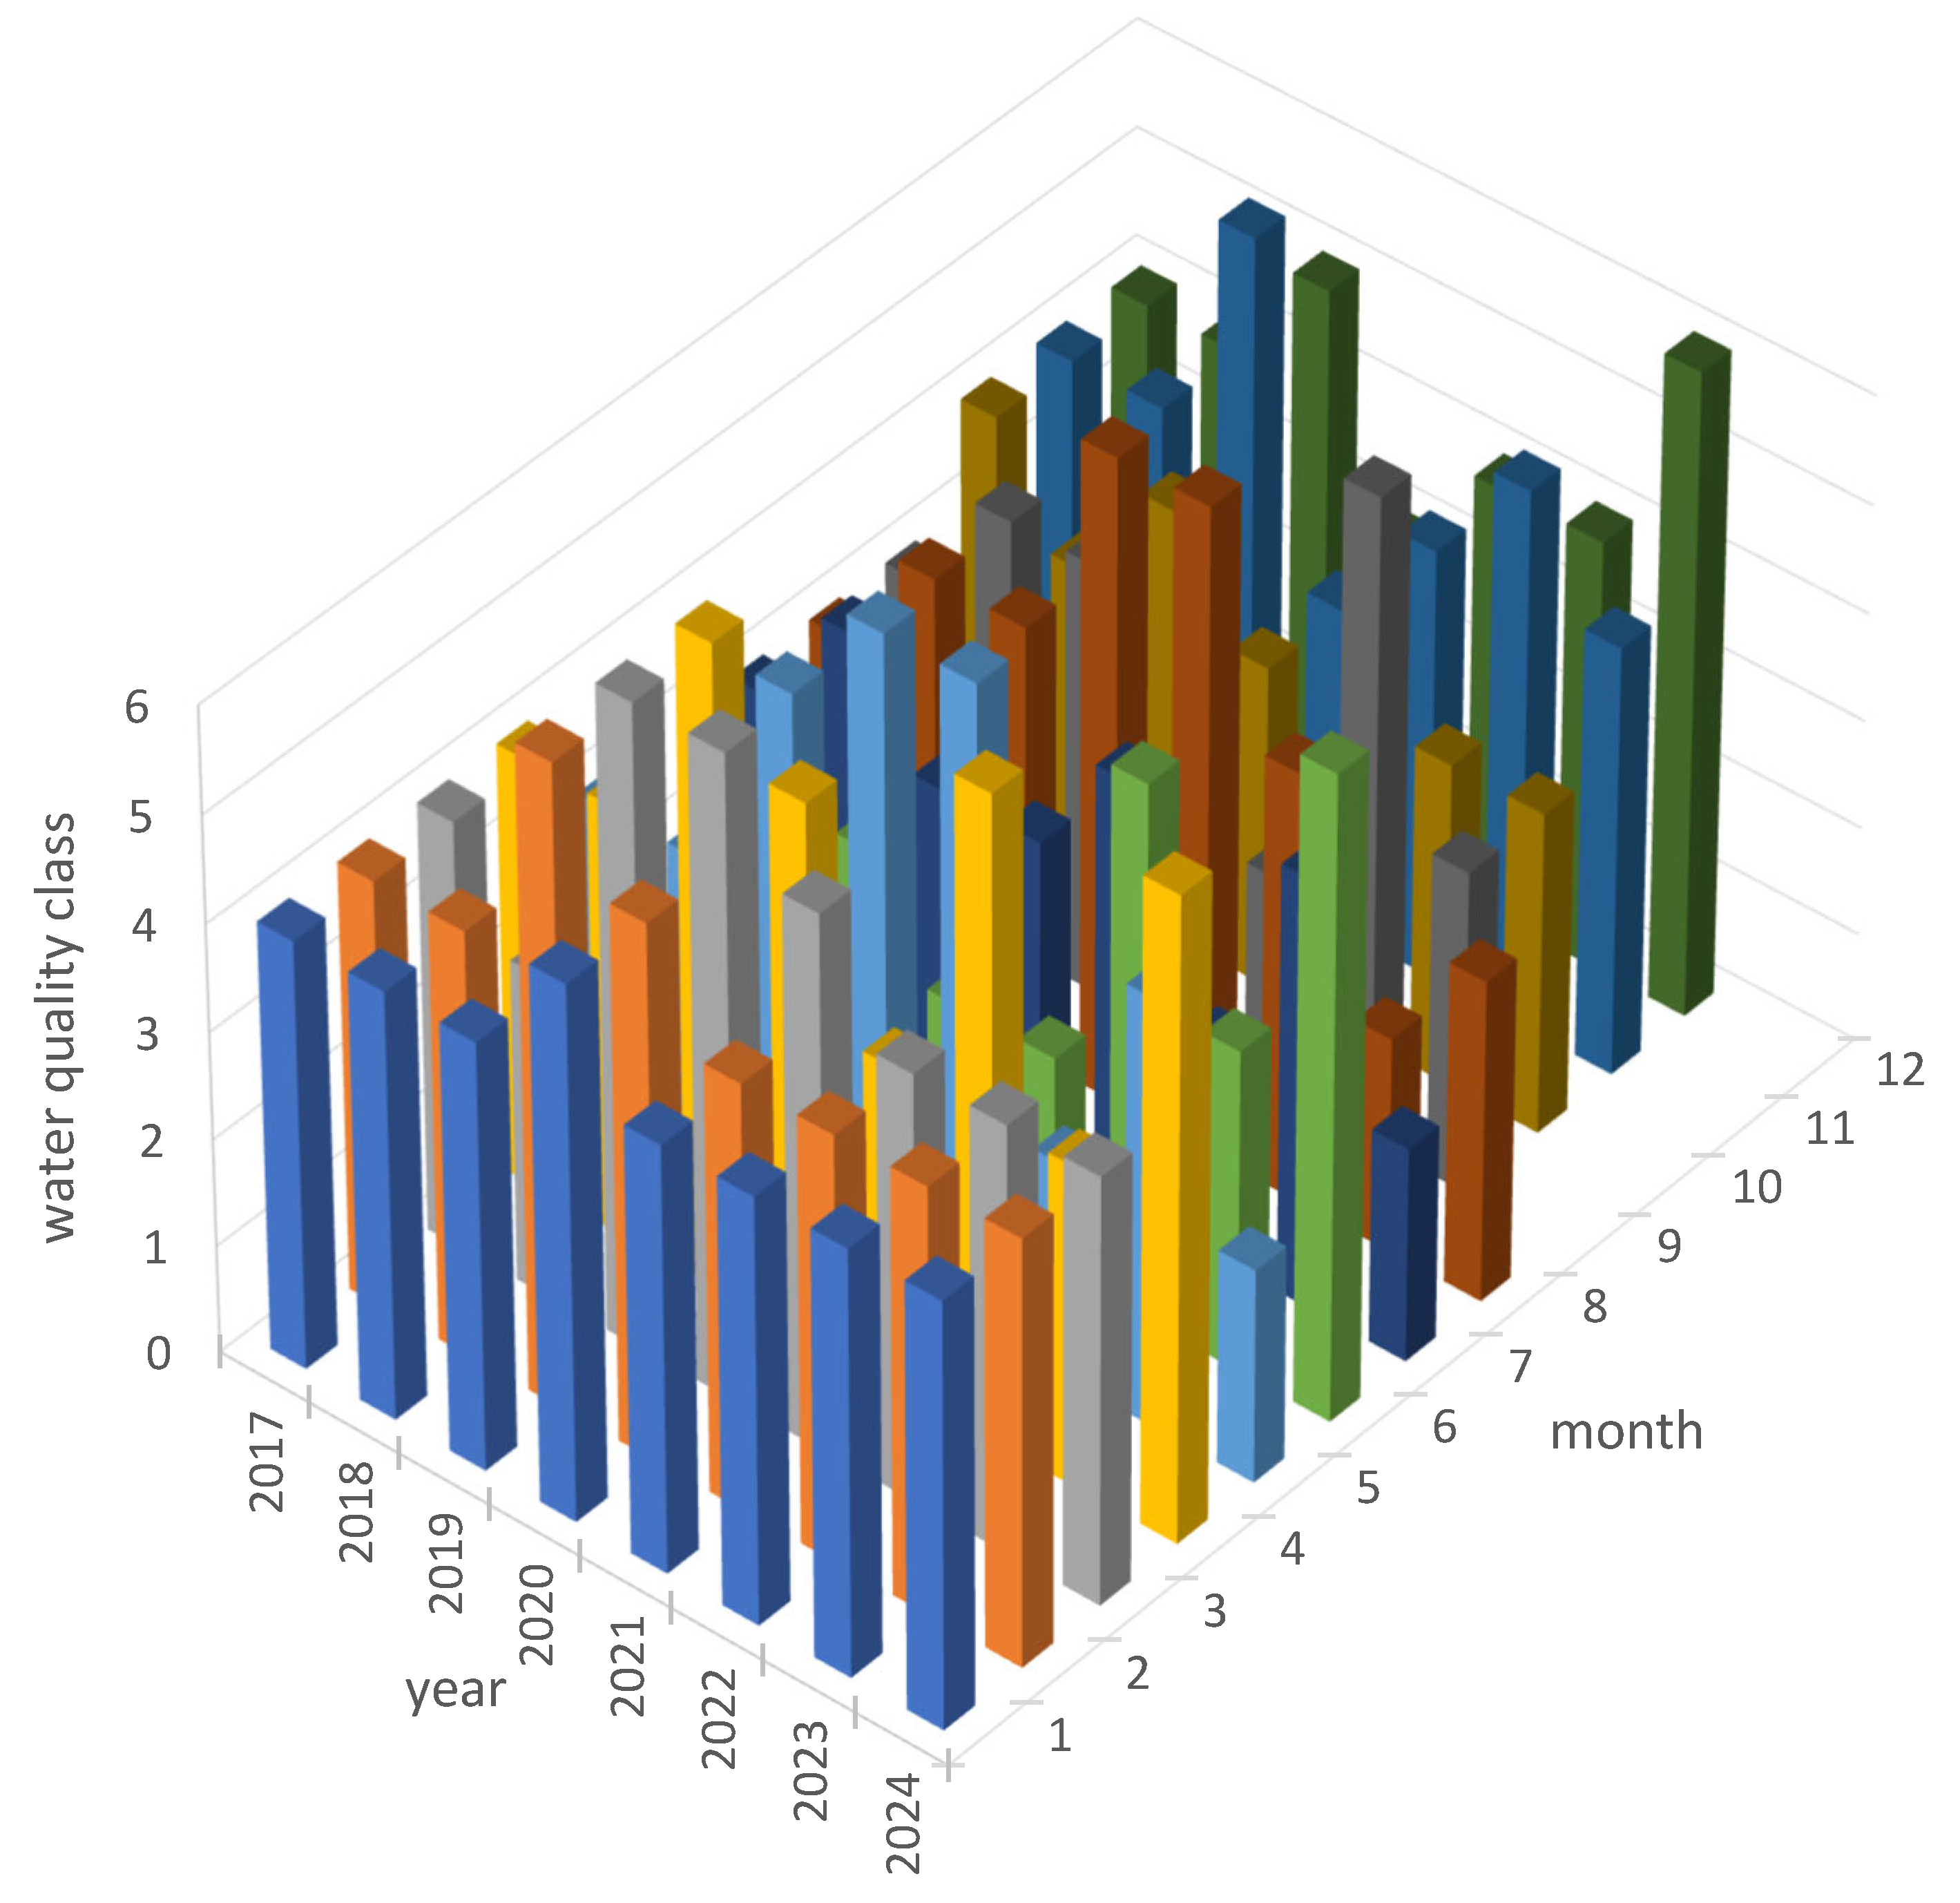
In the Breksa River, relative improvements in surface water quality—reaching Class 2—were observed in January, July, and August during the period from 2017 to 2024. The remaining months, over an eight-year period, show consistently high levels of surface water pollution (
Figure 6).
In 2024, compared to the previous period, the water quality of the Tikhaya River has improved, from water quality class 4 to 3 (
Table S6). By 2024, a slight decrease in the concentrations of ammonium salt compounds and cadmium was observed. The concentrations of several pollutants—suspended solids, nitrite nitrogen, and compounds of zinc, copper, iron, and manganese—decreased in the river water, with annual average concentrations below or within MPCs. In 2024, no more than two of the assessed pollutants exceeded threshold levels in the integrated water quality assessment. Cadmium compounds remained the characteristic pollutant, while the presence of ammonium nitrogen was stable, with average annual concentrations of 0.0019 mg/dm
3 and 0.72 mg/dm
3, respectively. The regime of dissolved oxygen in Tikhaya River water for the period from 2017 to 2024 was favorable; the minimum concentration did not decrease below 6.84 mg/dm
3 (2024).
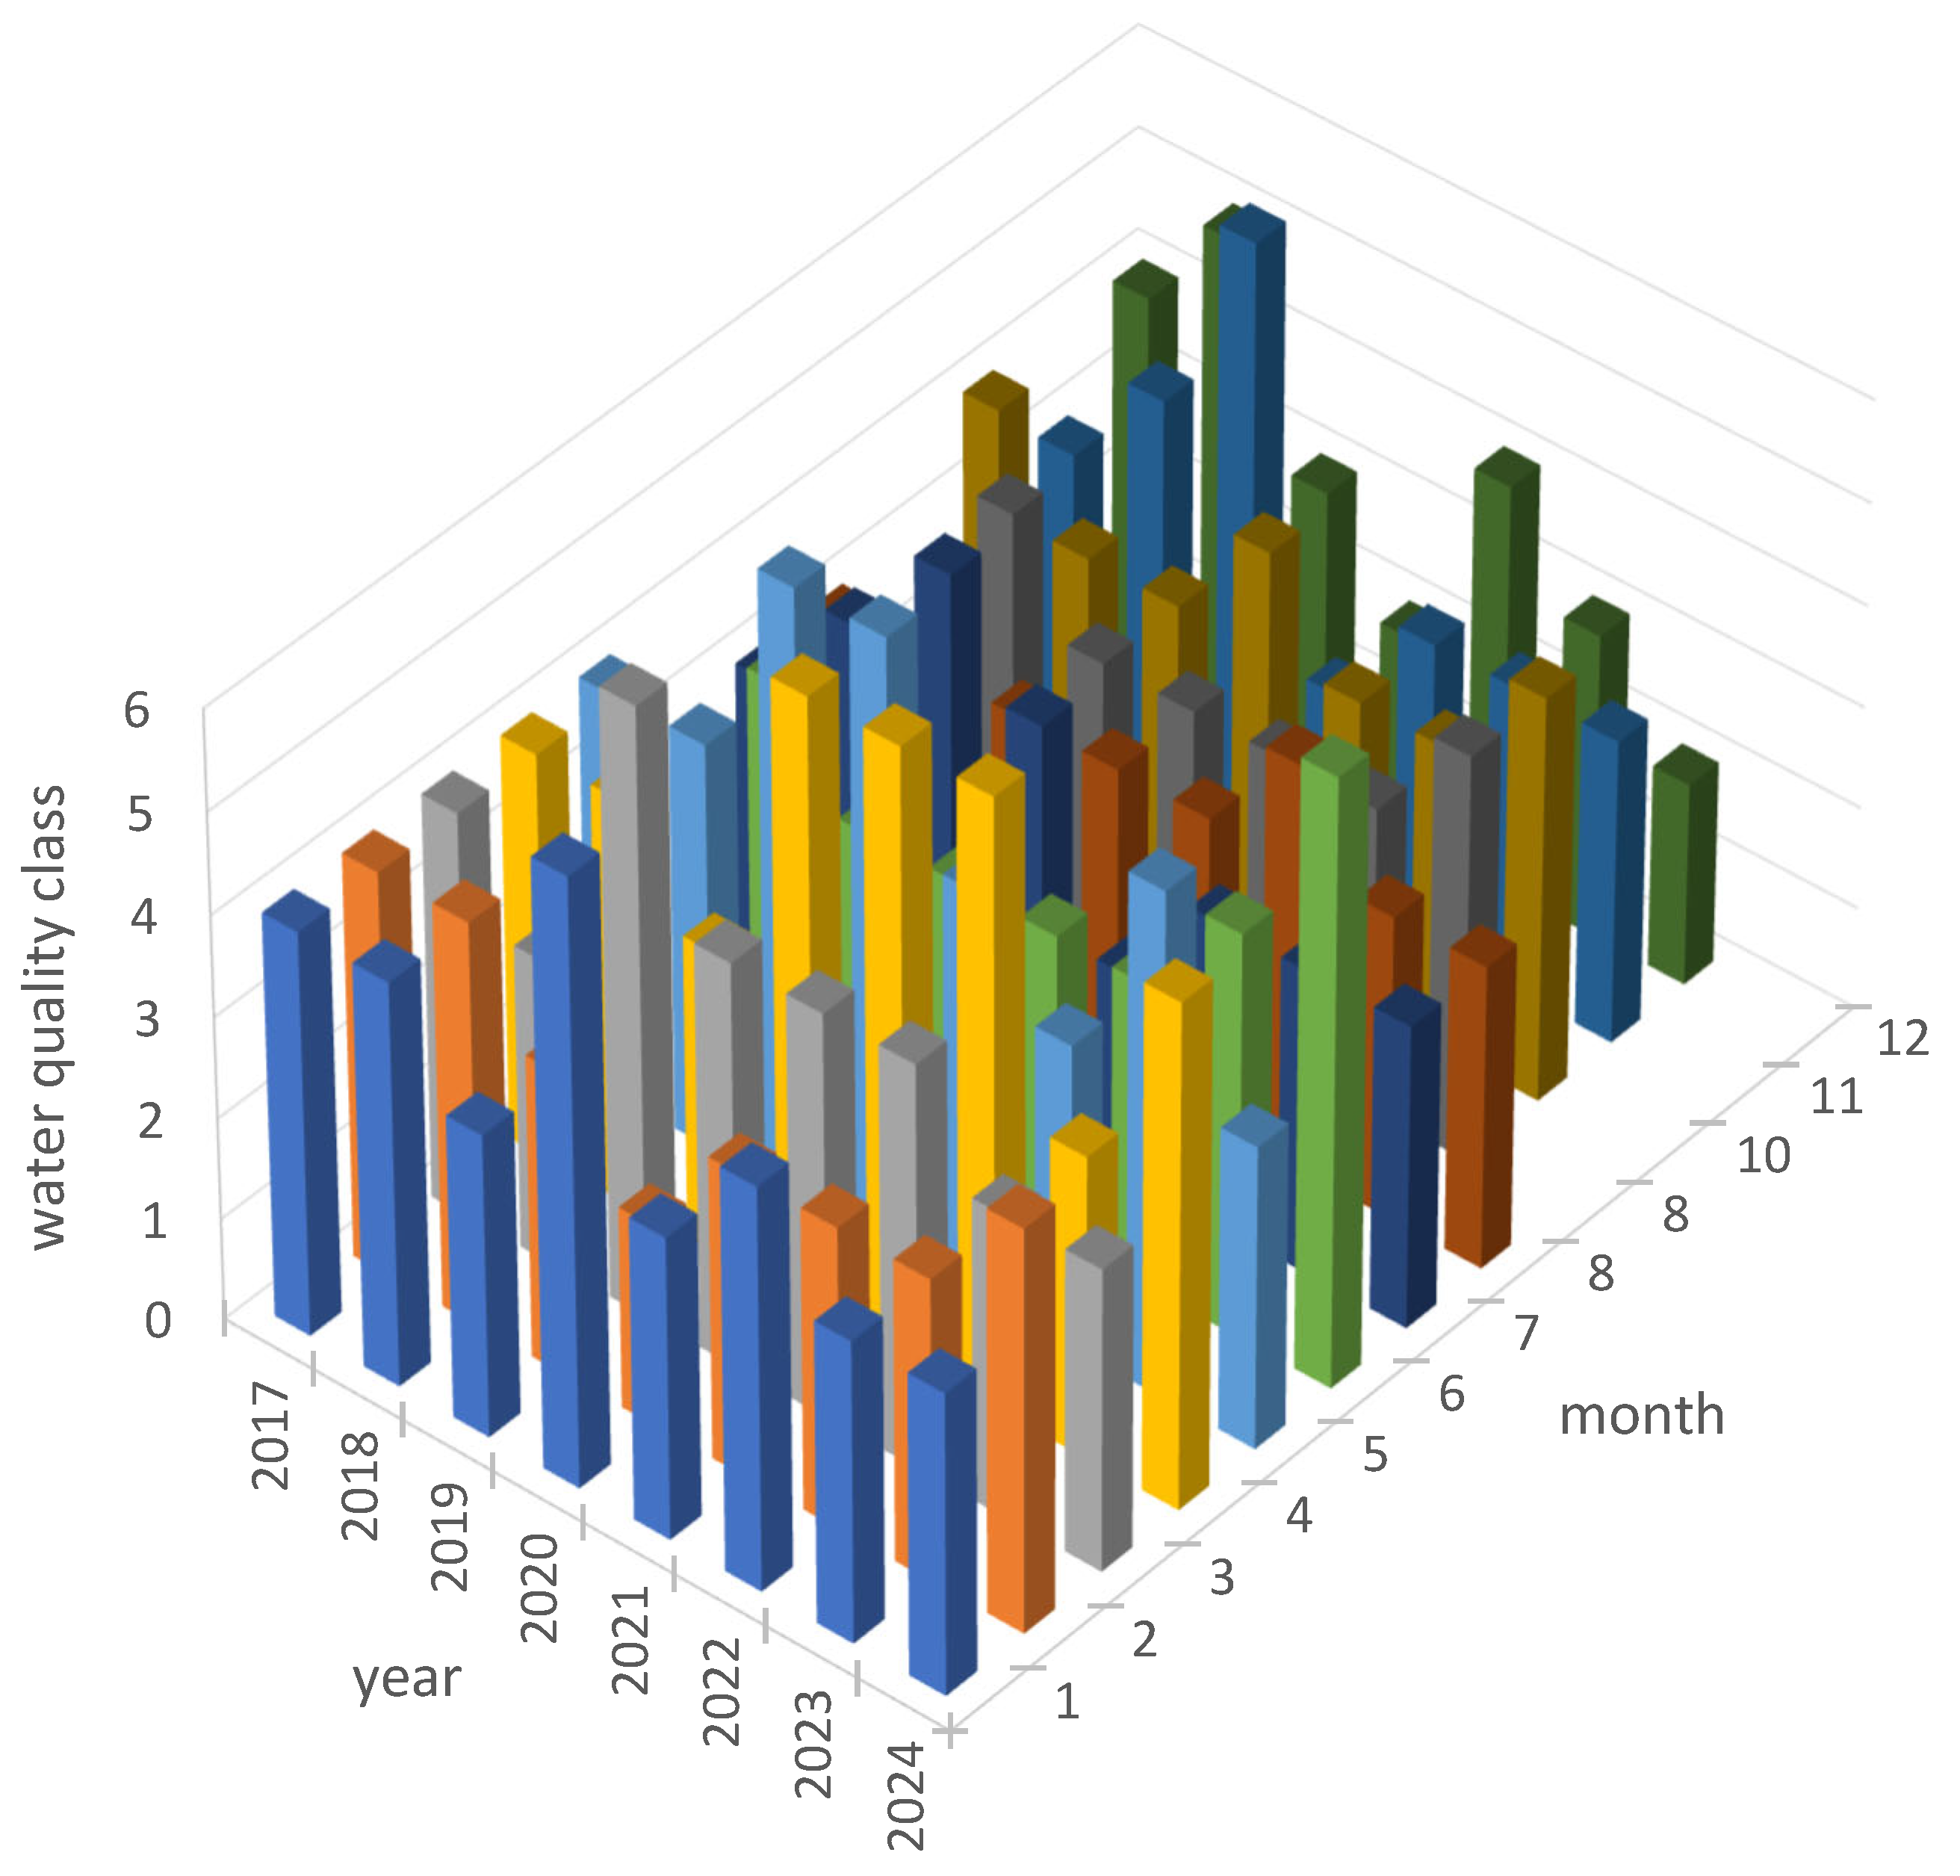
The assessment of the surface water quality of the Tikhaya River has shown consistently low water quality indicators throughout all months over the past eight years (
Figure 7).
Comparable levels of pollution have been observed in other industrial regions worldwide. For instance, a study conducted near Mosul (northern Iraq) reported average heavy metal concentrations in the Tigris River of 8.78 ppm (Co), 30.42 ppm (Cu), 0.179 ppm (Cd), 12.04 ppm (Pb), 75.53 ppm (Zn), and 144.75 ppm (Ni)—all of which significantly exceed international water quality standards, indicating a high level of anthropogenic contamination [
27]. Similar exceedances for cadmium, copper, and zinc were recorded in the Tikhaya River, particularly in its lower reaches, where the influence of industrial effluents is most pronounced.
The surface waters of the Ulba River in 2024 were characterized by quality class 3. In the Ulba River there is a stable content of cadmium compounds in the water. Five indicators contributed to the river’s pollution as identified in the integrated water quality assessment. These included compounds of iron, zinc, copper, manganese, and cadmium, which were identified as characteristic pollutants. The maximum concentrations of iron, zinc, copper, and manganese compounds reached the level of 1.5 MPC (in 2017), 15.1 MPC (in 2018), 3.5 MPC (in 2017), and 6.4 MPC (in 2018), respectively. The dissolved oxygen content in the surface waters of the Ulba River over the past eight years has not dropped below 6.12 mg/dm
3 (in 2021) (
Table S6).
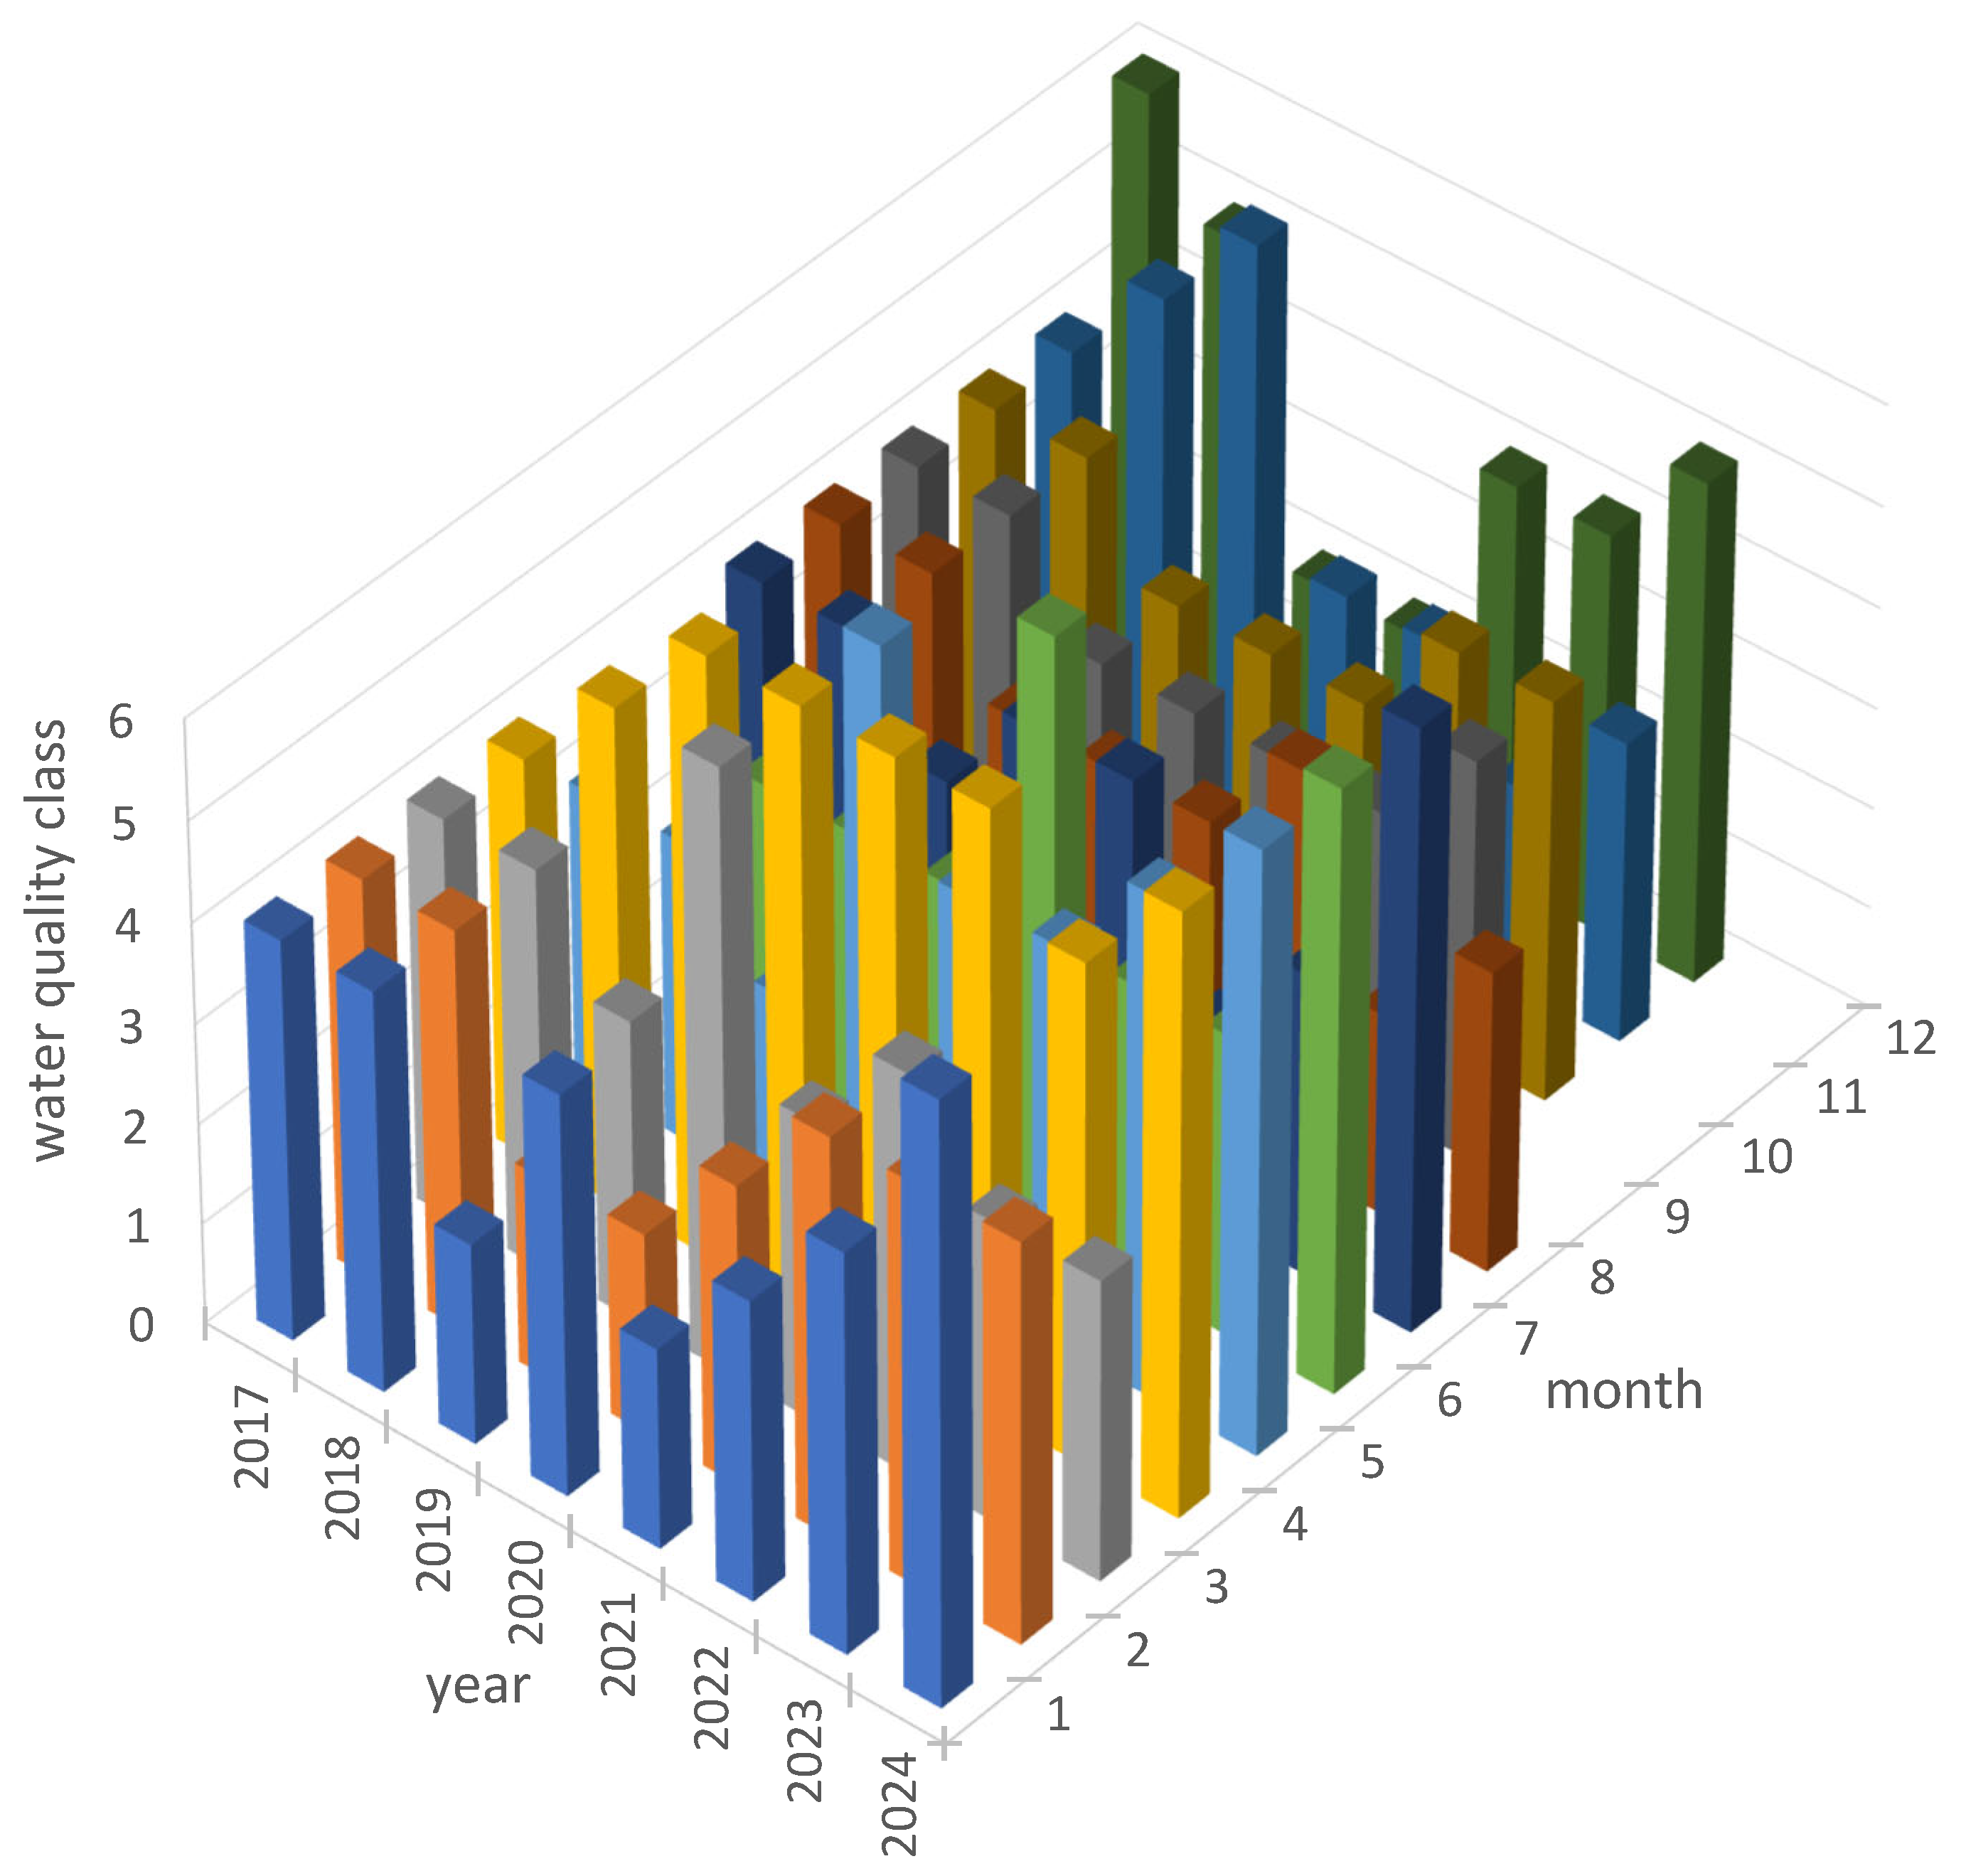
Monthly analysis of surface water quality showed a slight improvement in the Ulba River during July, August, and September over the past eight years. In other months, particularly in spring and early summer (April, May, and June), surface water quality remained at low levels (
Figure 8).
Likewise, a study of the Narmada River in India [
28] reported elevated concentrations of heavy metals (Al, Cr, Mn, Fe, Ni, Cu, Zn, Cd, Pb) in zones subject to intensive industrial activity. Our data on the Ulba River—which shows exceedances of maximum permissible concentrations (MPCs) for Zn, Cd, and Cu—confirm the global nature of water pollution resulting from mining activities.
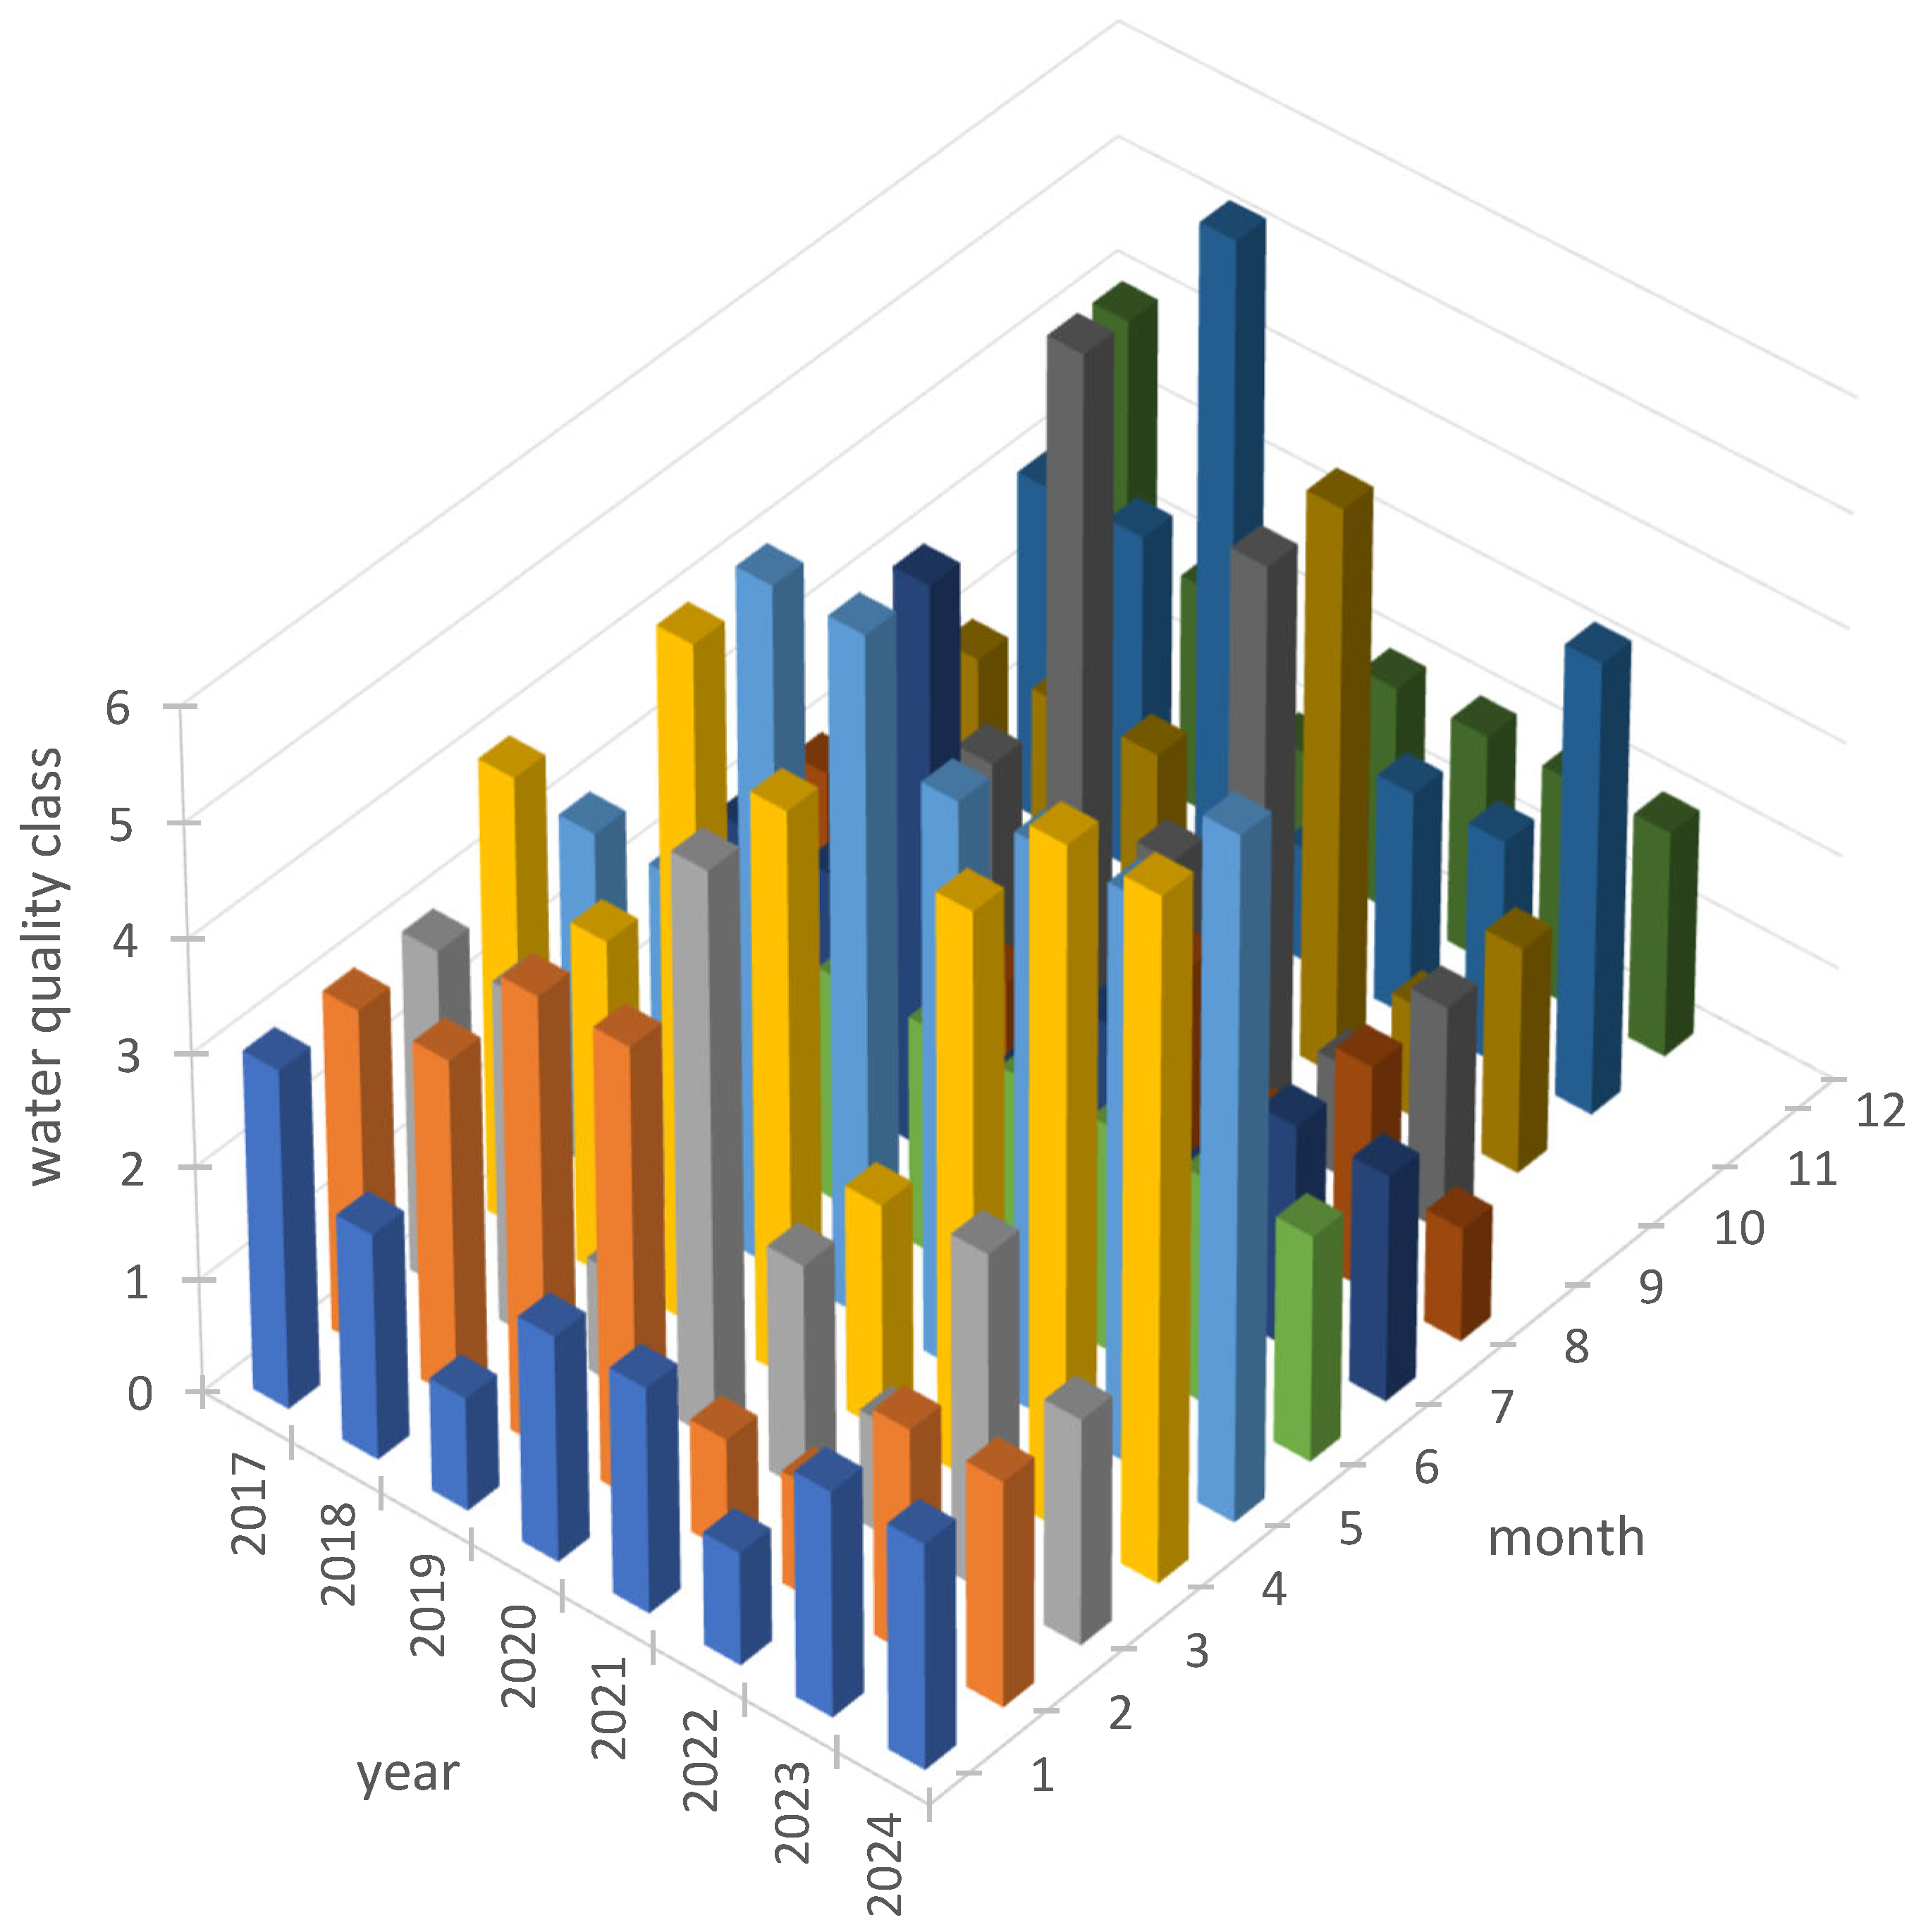
An analysis of changes in the content of the main pollutants in the water of the Glubochanka River showed that in 2024, the highest average annual concentrations were observed for magnesium compounds. In 2024, the water quality of the Glubochanka River remained unchanged compared to the previous five years, and the river’s water still belongs to the third quality class (
Table S6). Over the past eight years, a consistently high level of surface water pollution has been observed in the Glubochanka River throughout all months (
Figure 9).
An analysis of long-term surface water quality observations by month shows that in April, surface water quality indicators are critically low (>class 5—not standardized) compared to other months of the year.
In 2024, the water quality of the Krasnoyarka River declined due to an increase in cadmium content to 0.0035 mg/dm
3. As a result, the water moved from the “third quality class” to the “fourth quality class” category (
Table S6). A comparative analysis of the surface water quality class of the Krasnoyarka River by month for the period 2017–2024 showed that throughout the entire study period, surface water quality remained poor in all months, with a noticeable deterioration observed in 2024.
An analysis of the monthly surface water quality of the Krasnoyarka River in recent years showed that, as with the Glubochanka River, significantly higher levels of surface water pollution are observed in April (
Figure 10).
In 2024, the water quality of the Oba River improved to the second quality class compared to previous years (2019–2020). A critical level of water pollution by iron, zinc, manganese, and copper compounds was observed from 2017 to 2018, with maximum concentrations reaching 2.2, 1.9, 2.2, and 3.6 MPC, respectively (
Table S6). In 2019–2020, water pollution remained noticeable but low, largely due to the high content of suspended solids in the Oba River. In 2024, a decrease in the concentrations of iron and manganese was recorded. The dissolved oxygen regime in the Oba River was satisfactory throughout the observation period, with the minimum concentration not falling below 7.11 mg/dm
3 (in 2021).
Unlike the Glubochanka and Krasnoyarka rivers, the Oba River appears to be more vulnerable to external influences, especially in recent years.
At the same time, in recent years, a relative improvement in surface water quality (up to classes 1–2) was noted in February, July, September, October, and December. However, in April, May, and November, a high level of surface water pollution was recorded (
Figure 11).
It should also be noted that this study does not seek to establish direct causal relationships between changes in pH and specific pollution sources. However, based on the observed spatial and temporal dynamics, and considering both natural and anthropogenic conditions in East Kazakhstan, plausible assumptions have been made regarding potential influencing factors. These include seasonal snowmelt, flood and rain runoff, dry periods, and possible industrial or municipal discharges. Such interpretations aim to improve understanding of the mechanisms behind water quality changes and require further targeted research involving instrumental monitoring and a broader set of indicators.
The comprehensive assessment of surface water quality dynamics for six water bodies indicates seasonal and multi-year fluctuations in the chemical composition of surface waters, associated not only with the influence of anthropogenic factors (industrial, domestic, and agricultural runoff), but also with seasonal phases of the hydrological regime and interannual variability in water availability (
Figure 12).
Additionally, although the study relies on official hydrochemical data provided by RSE Kazhydromet, information on river discharge (flow rate) is not consistently available. This limits the ability to perform quantitative analysis of pollutant dilution or concentration over time. Hydrological factors such as spring floods, summer rainfall, or droughts can significantly affect pollutant concentrations. However, without regular flow data, such effects can only be qualitatively estimated. To improve the accuracy of environmental assessments of water bodies in East Kazakhstan, it is necessary to integrate hydrochemical and hydrological monitoring, including systematic flow measurements.
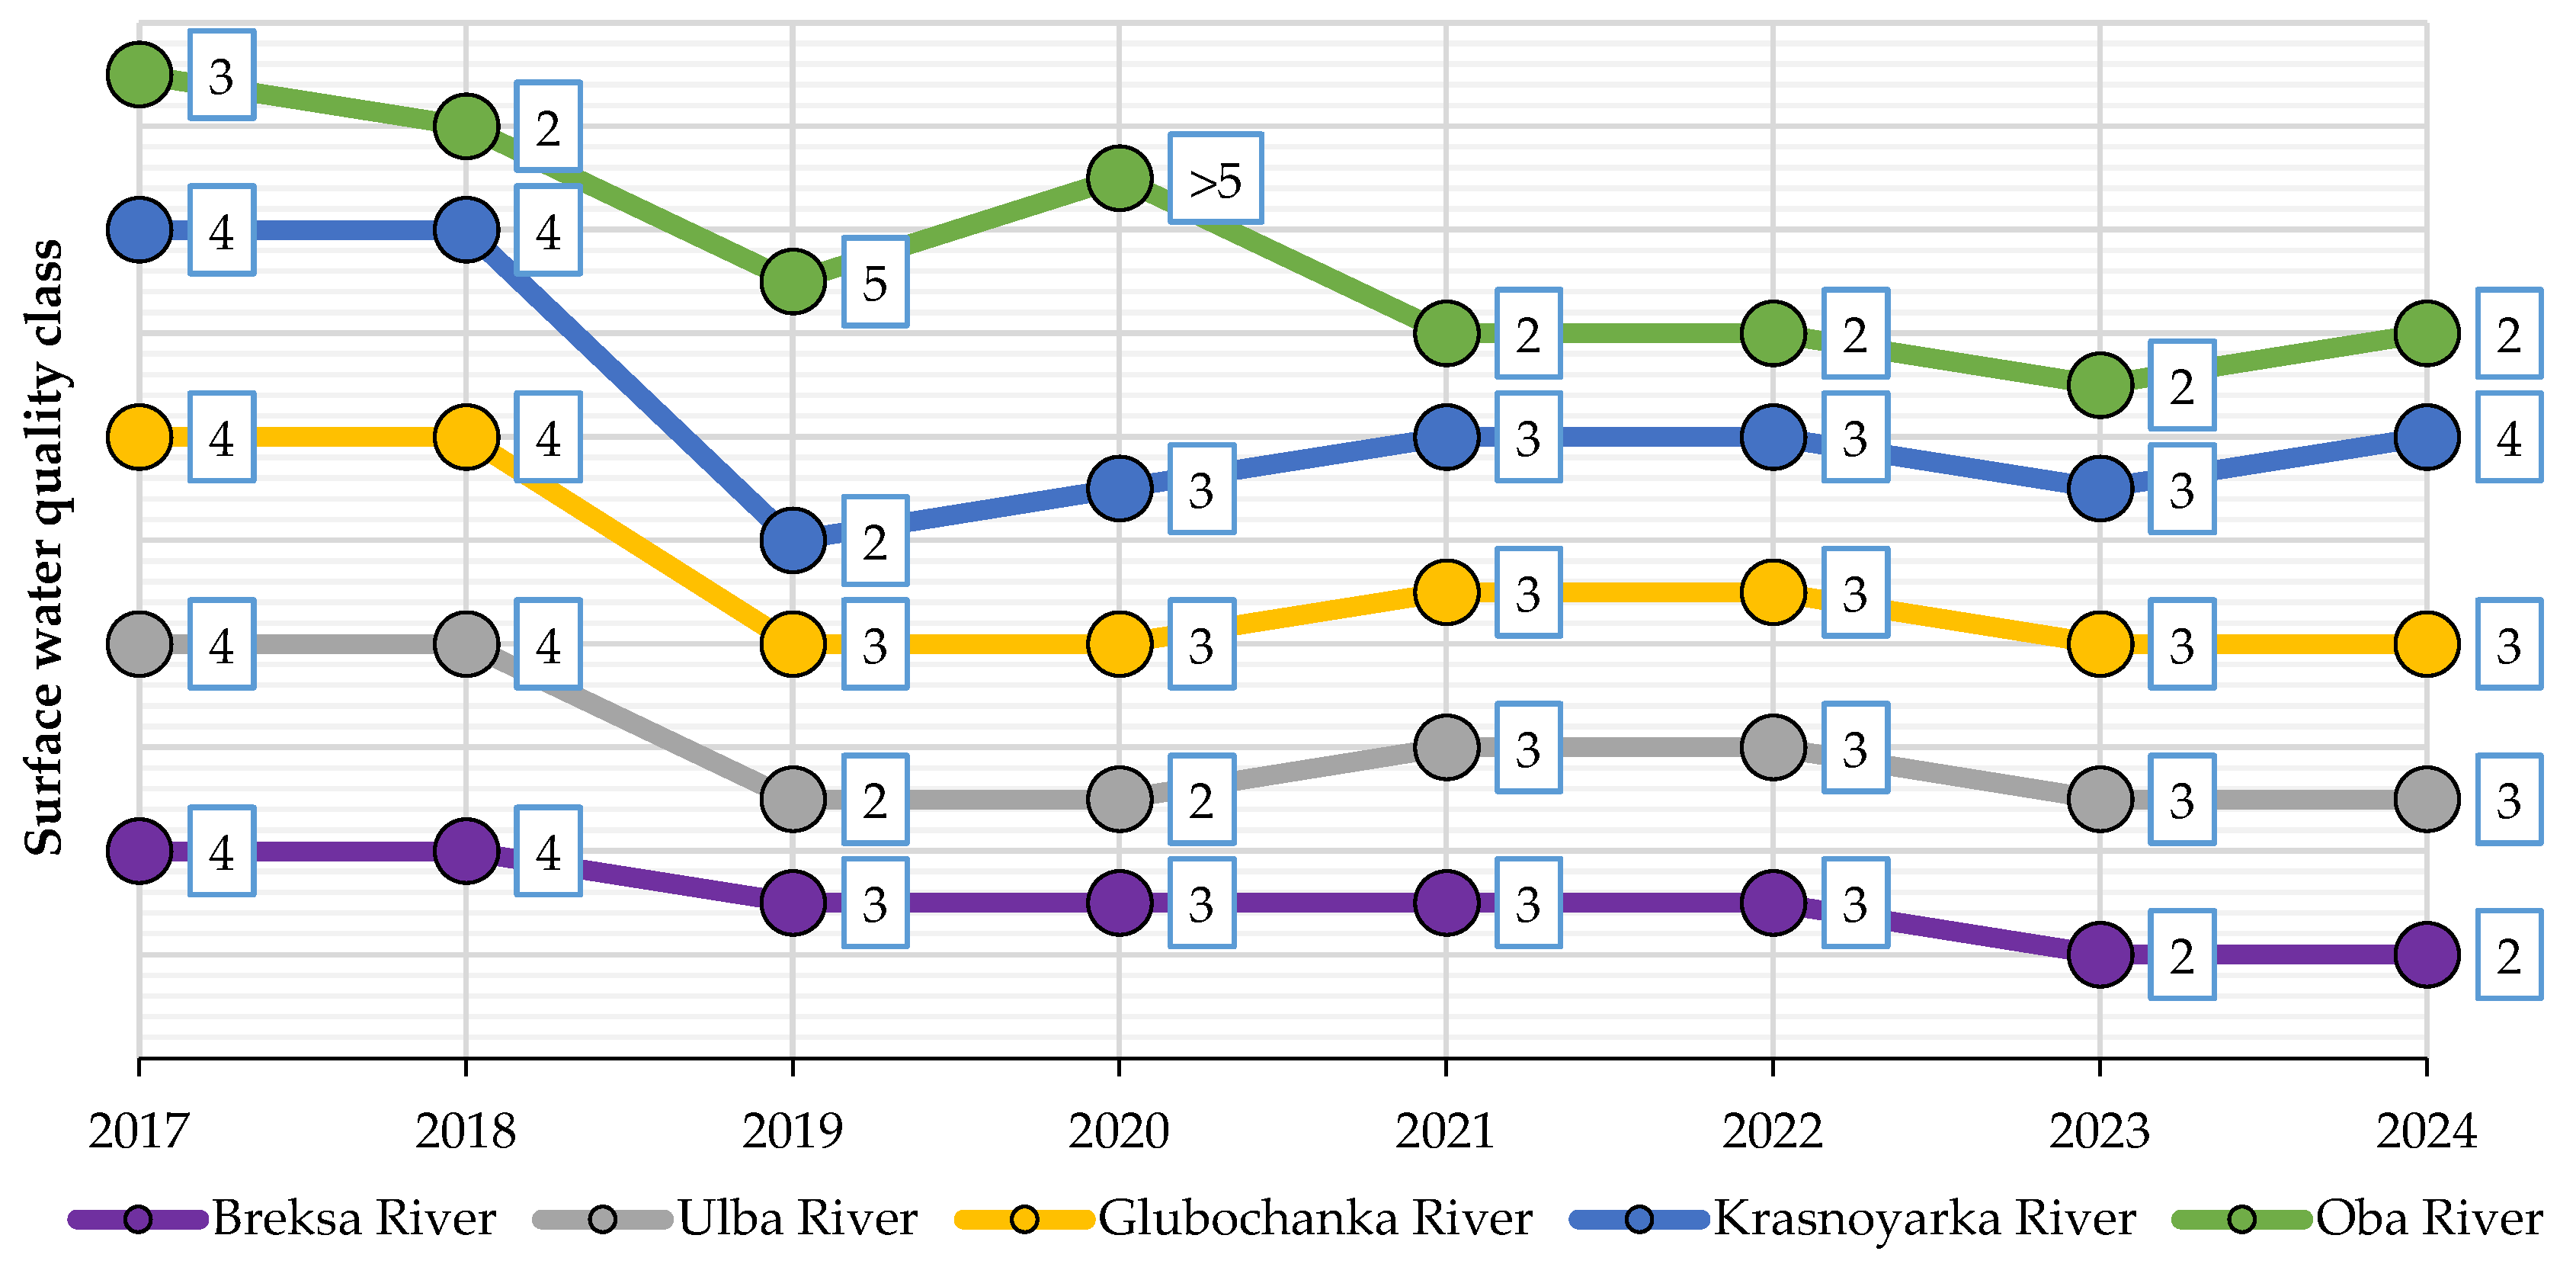
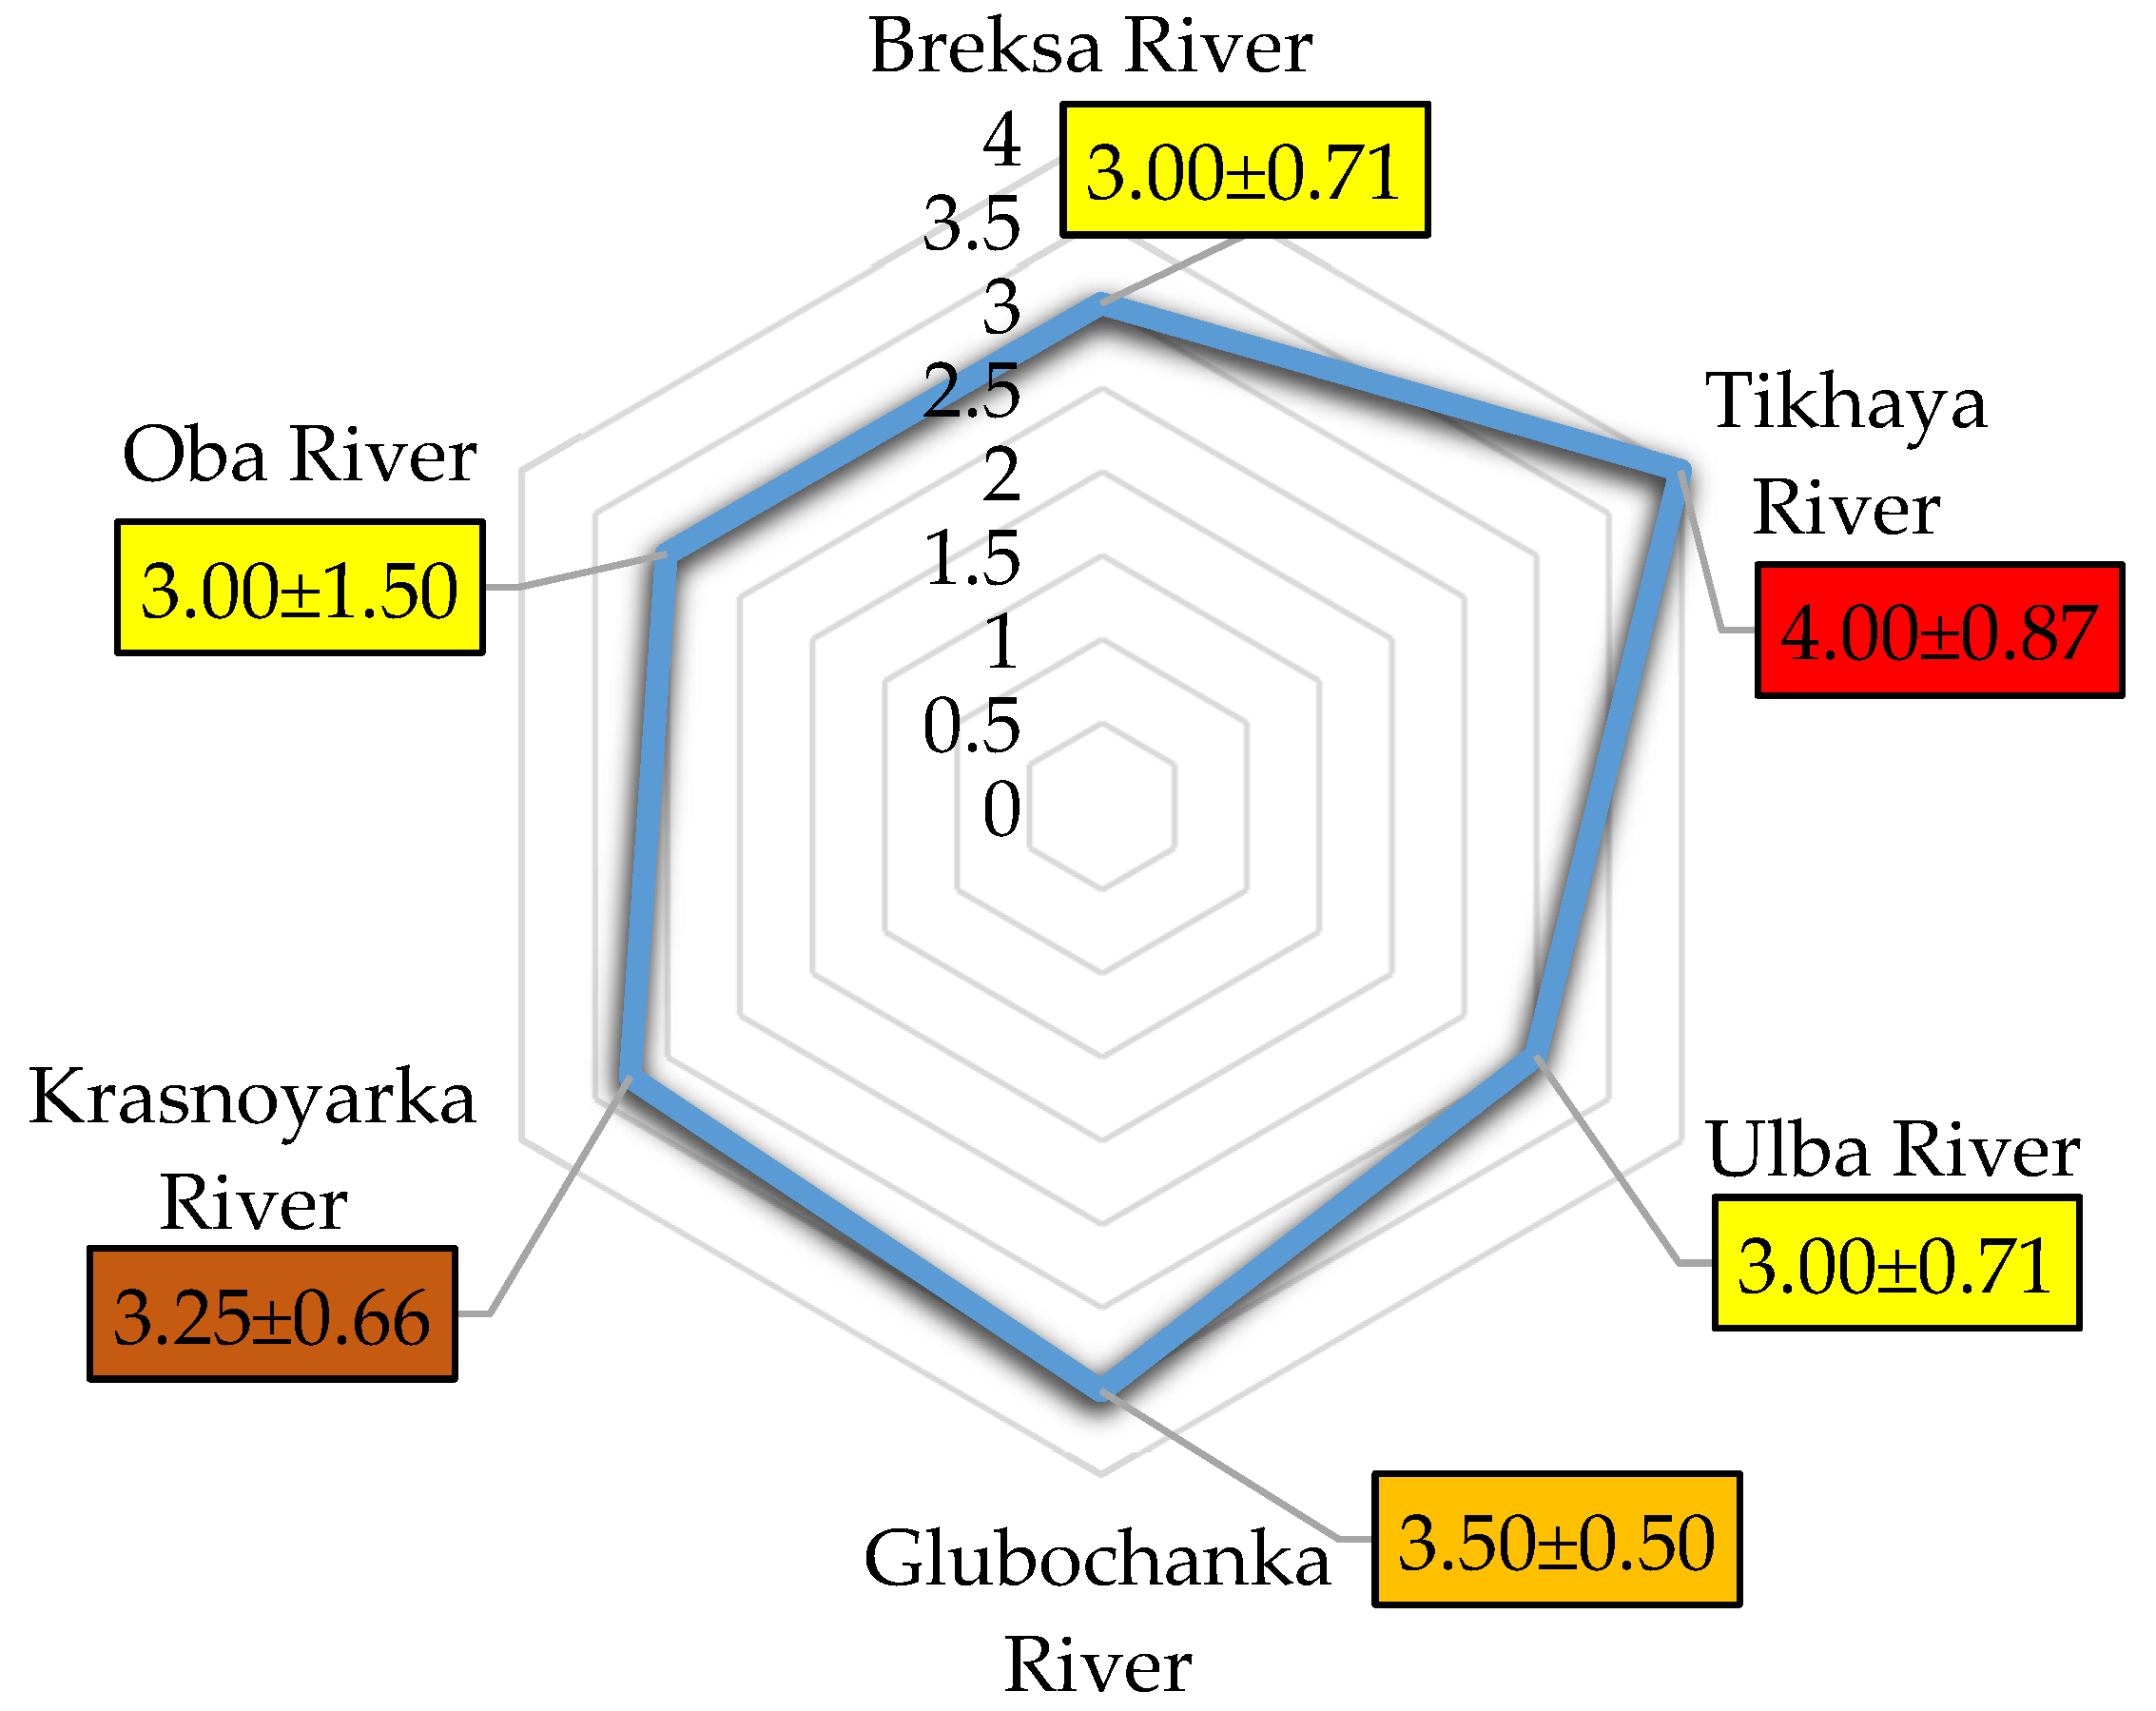
A comparative assessment of the surface water quality class of small rivers in the East Kazakhstan Region (
Figure 13), based on the average composite relative indicator of surface water contamination (i.e., the average quality class for the period 2017–2024), showed that the Tikhaya River (average quality class: 4.0) exhibits the highest level of pollution. A significant simultaneous presence of various pollutants and correspondingly low surface water quality is also characteristic of the Glubochanka (3.5), Krasnoyarka (3.25), Ulba (3.0), and Breksa (3.0) rivers.
Over the past four years (2021–2024), the surface water quality of the Oba River has improved, now corresponding to Class 2 (moderate pollution level). However, considering the entire study period, the average water quality class remains at Level 3. This is primarily due to lower quality indicators observed in earlier years. Nonetheless, the data reveal a positive trend in water quality, indicating a gradual reduction in pollution levels in recent years.
Between 2017 and 2024, the surface waters of the small Ulba, Glubochanka, and Krasnoyarka rivers consistently exhibited quality corresponding to pollution classes 3–4. This indicates the ongoing influence of anthropogenic factors and the limited effectiveness of natural self-purification processes.
At the same time, over the past two years (2023–2024), a relative improvement in water quality has been observed in the Breksa and Tikhaya rivers, likely due to both natural variability and changes in the character of anthropogenic pressure within their respective catchments.
The Oba River warrants special attention: over the past four years (2021–2024), it has consistently maintained high water quality, classified within pollution class 2. This suggests that active self-purification processes are preserved, even under moderate anthropogenic impact.
It has been established that activities related to the development of natural resources exert both direct and indirect effects on the quality of surface waters. Direct impacts occur through the discharge of industrial, municipal, and other types of wastewaters. Indirect impacts arise from the runoff of polluted surface effluents from agricultural, urbanized, and other areas, which alter surface runoff formation conditions.
Significant anthropogenic pressure reduces the influence of natural factors in shaping the hydrochemical regime of rivers. Therefore, a transition is needed toward a more integrated assessment of water bodies and their catchments, based on comprehensive hydrological, hydrochemical, and hydrobiological studies. Priority tasks include improving water monitoring systems, regularly updating water quality databases, and developing measures to reduce anthropogenic stress to ensure sustainable water resource management.
The analysis revealed that zinc (Zn), cadmium (Cd), and copper (Cu) compounds, which repeatedly exceeded MPCs, are the primary contributors to contamination of surface waters in small rivers of the East Kazakhstan Region. These elements serve as key indicators of anthropogenic pressure associated with the region’s mining and metallurgical sector. Additionally, pH values in some rivers showed notable seasonal fluctuations, including episodes of decline to as low as 6.60, potentially reflecting the effects of acid runoff. As such, these parameters were selected as the main reference indicators for interpreting the ecological status of water bodies.
A comparison of these findings with similar studies conducted in other regions of Kazakhstan [
5,
9,
10,
12,
13,
14,
15,
16,
17,
18] suggests that anthropogenic pollution of water bodies—particularly related to mining, metallurgical activities, and industrial impacts—is a widespread issue affecting major river basins across the country. Research in the Irtysh, Ural, and Ili River basins shows similar trends in heavy metal concentrations and biochemical indicators, underscoring the importance of comprehensive monitoring, especially of smaller rivers in the East Kazakhstan region. This study contributes to existing knowledge by incorporating long-term hydrochemical monitoring, climate data, and geographic information, providing a more complete assessment of the state of regional water bodies.
International studies confirm the widespread spatial and temporal variability of pollution in industrial river basins. For example, in the Han River basin (South Korea), a direct link has been established between industrial activity and elevated concentrations of heavy metals (Cr, As, Hg), as well as organic pollutants (carbofuran, bisphenol A, quinoline) [
29]. Peak values were recorded near industrial zones, similar to sections of rivers in the East Kazakhstan Region, especially those adjacent to mining and metallurgical facilities. However, unlike the Han River, where organic contaminants are prominent, heavy metals constitute the primary concern in East Kazakhstan’s rivers, while organic pollution is detected only sporadically. This underscores both common anthropogenic drivers and regional differences in pollutant profiles.
Other urbanized river basins also demonstrate a multicomponent structure of anthropogenic impact. For instance, a study of the Fenghe River (China) identified tourism (42.0%), urban development (36.8%), transportation (11.7%), and industry (9.4%) as the main contributors to heavy metal pollution [
30]. These findings highlight the importance of assessing diverse pollution sources. In the case of East Kazakhstan, mining and metallurgical activities remain the dominant contributors, although inputs from domestic, transport, and municipal sources are also evident. Unlike the Fenghe basin, where diffuse and infrastructure-related runoff predominates, pollution in East Kazakhstan is more clearly linked to point-source discharges from industrial facilities—necessitating different strategies for environmental control.
In addition to the multifactorial nature of pollution, international studies emphasize the spatial gradients of contamination around mining areas. For example, in the vicinity of the Daxing polymetallic sulfide deposit (Guangxi, China), heavy metal concentrations sharply decreased with distance from the source: Zn dropped from 1857.0 to 0.9 mg/L and Cd from 0.16 to 0.001 mg/L within just 4 km downstream [
31]. These results confirm the importance of spatial analysis in evaluating the environmental impact of mining activities. Although our study lacks linear spatial observations, similar patterns are evident in temporal dynamics. For example, the Breksa River showed a significant widening of the pH range during 2021–2024, likely reflecting episodic pollutant inputs influenced by seasonal hydrology and runoff from industrial areas.
Comparable trends are observed in other regions with active sulfide ore mining. In the Sierra Minera de Cartagena-La Unión area (Spain), where lead-zinc and iron ores are exploited, elevated concentrations of heavy metals—including Pb, Cd, Zn, Cu, As, and Mn—have been reported [
32]. These findings, along with data from China, demonstrate that sulfide ore mining consistently results in severe anthropogenic pollution of aquatic ecosystems. Our observations in the Breksa, Ulba, and Tikhaya rivers, which showed exceedances of maximum permissible concentrations for Cd, Zn, and Cu, confirm similar patterns in East Kazakhstan and underscore the necessity of continuous monitoring near mining and metallurgical facilities.
The technological specifics of ore processing also significantly influence wastewater composition. At the Sarcheshmeh copper-molybdenum complex (Iran), for example, it was found that Cu–Mo flotation in an alkaline medium led to elevated molybdenum levels and an increase in wastewater pH, while reducing concentrations of aluminum, manganese, iron, copper, and cadmium [
33]. The oxidation of sulfides also results in the formation of secondary minerals and sulfate salts, which alter water chemistry. Such mechanisms may help explain the abnormal pH values observed in our study during 2023–2024—particularly in the Ulba and Oba rivers—where fluctuations in alkalinity coincided with signs of anthropogenic contamination. Although molybdenum was not measured in our analysis, the chemical processes described remain highly relevant in regions with active ore flotation within MMC operations.
Thus, our findings from East Kazakhstan align with international studies, confirming that regions with intensive mining and metallurgical activity are characterized by high levels of anthropogenic pollution and complex geochemical conditions. Data from the Sierra Minera (Spain) further demonstrate that prolonged sulfide ore mining is accompanied by acid mine drainage, accumulation of heavy metals (Zn, Cd, Pb, Cu, As, Fe), and a dominance of sulfate compounds in bottom sediments [
34]. Similar processes have been identified in East Kazakhstan, especially near tailings storage facilities and landfills, where changes in acidity and the persistent accumulation of toxic elements are observed. These results highlight the need for integrated monitoring approaches that account for both anthropogenic and geogenic sources of pollution. This study contributes to global knowledge by providing a spatial and temporal assessment of pollution patterns and underscores the importance of region-specific strategies for evaluating water quality in mining-affected environments.
3.4. Correlation and Regression Analysis
To identify the influence of climatic factors on the surface water quality of small rivers in the East Kazakhstan Region, a correlation analysis was conducted between average annual precipitation and the water quality class of six rivers for the period from 2017 to 2024.
The Pearson correlation coefficient (r) was used to quantify the relationship, making it possible to assess both the strength and direction of the linear dependence between the two quantitative variables. The results of the analysis revealed varying strengths and directions of the correlation between precipitation and water quality across the studied rivers.
The analysis showed a very weak negative correlation (−0.18) between the amount of precipitation and the water quality class in the Breksa River (
Table S7). This indicates that an increase or decrease in precipitation has virtually no systemic effect on water quality. It is likely that the water quality in the Breksa River is determined mainly by local factors, such as the nature of runoff, the presence of pollutants in the catchment area, or the hydrological features of the watercourse.
The three-dimensional model (
Figure 14) shows that for the Breksa River, an increase in precipitation contributes to an improvement in water quality. There is a positive trend over time, which may indicate a decrease in the anthropogenic load or the successful implementation of environmental protection measures.
Based on the graphical relationship, a model was developed to describe the combined effect of precipitation and time on the water quality class in the Breksa River for the period 2017–2024. The model is expressed by the following Equation (7):
where z is the predicted water quality class, x is the year of observation, and y is the annual precipitation (in mm).
Negative coefficients for both variables indicate that increases in precipitation and the passage of time both contribute to a decrease in the z-value, i.e., an improvement in water quality. This may be due to higher water levels facilitating pollutant dilution, as well as the implementation of water protection measures. The model enables a quantitative assessment of the impact of climatic conditions on water quality and can be used to forecast the ecological state of the Breksa River in the future. The coefficient of determination was R2 = 0.903, indicating a high degree of model fit and confirming the reliability of the established relationships.
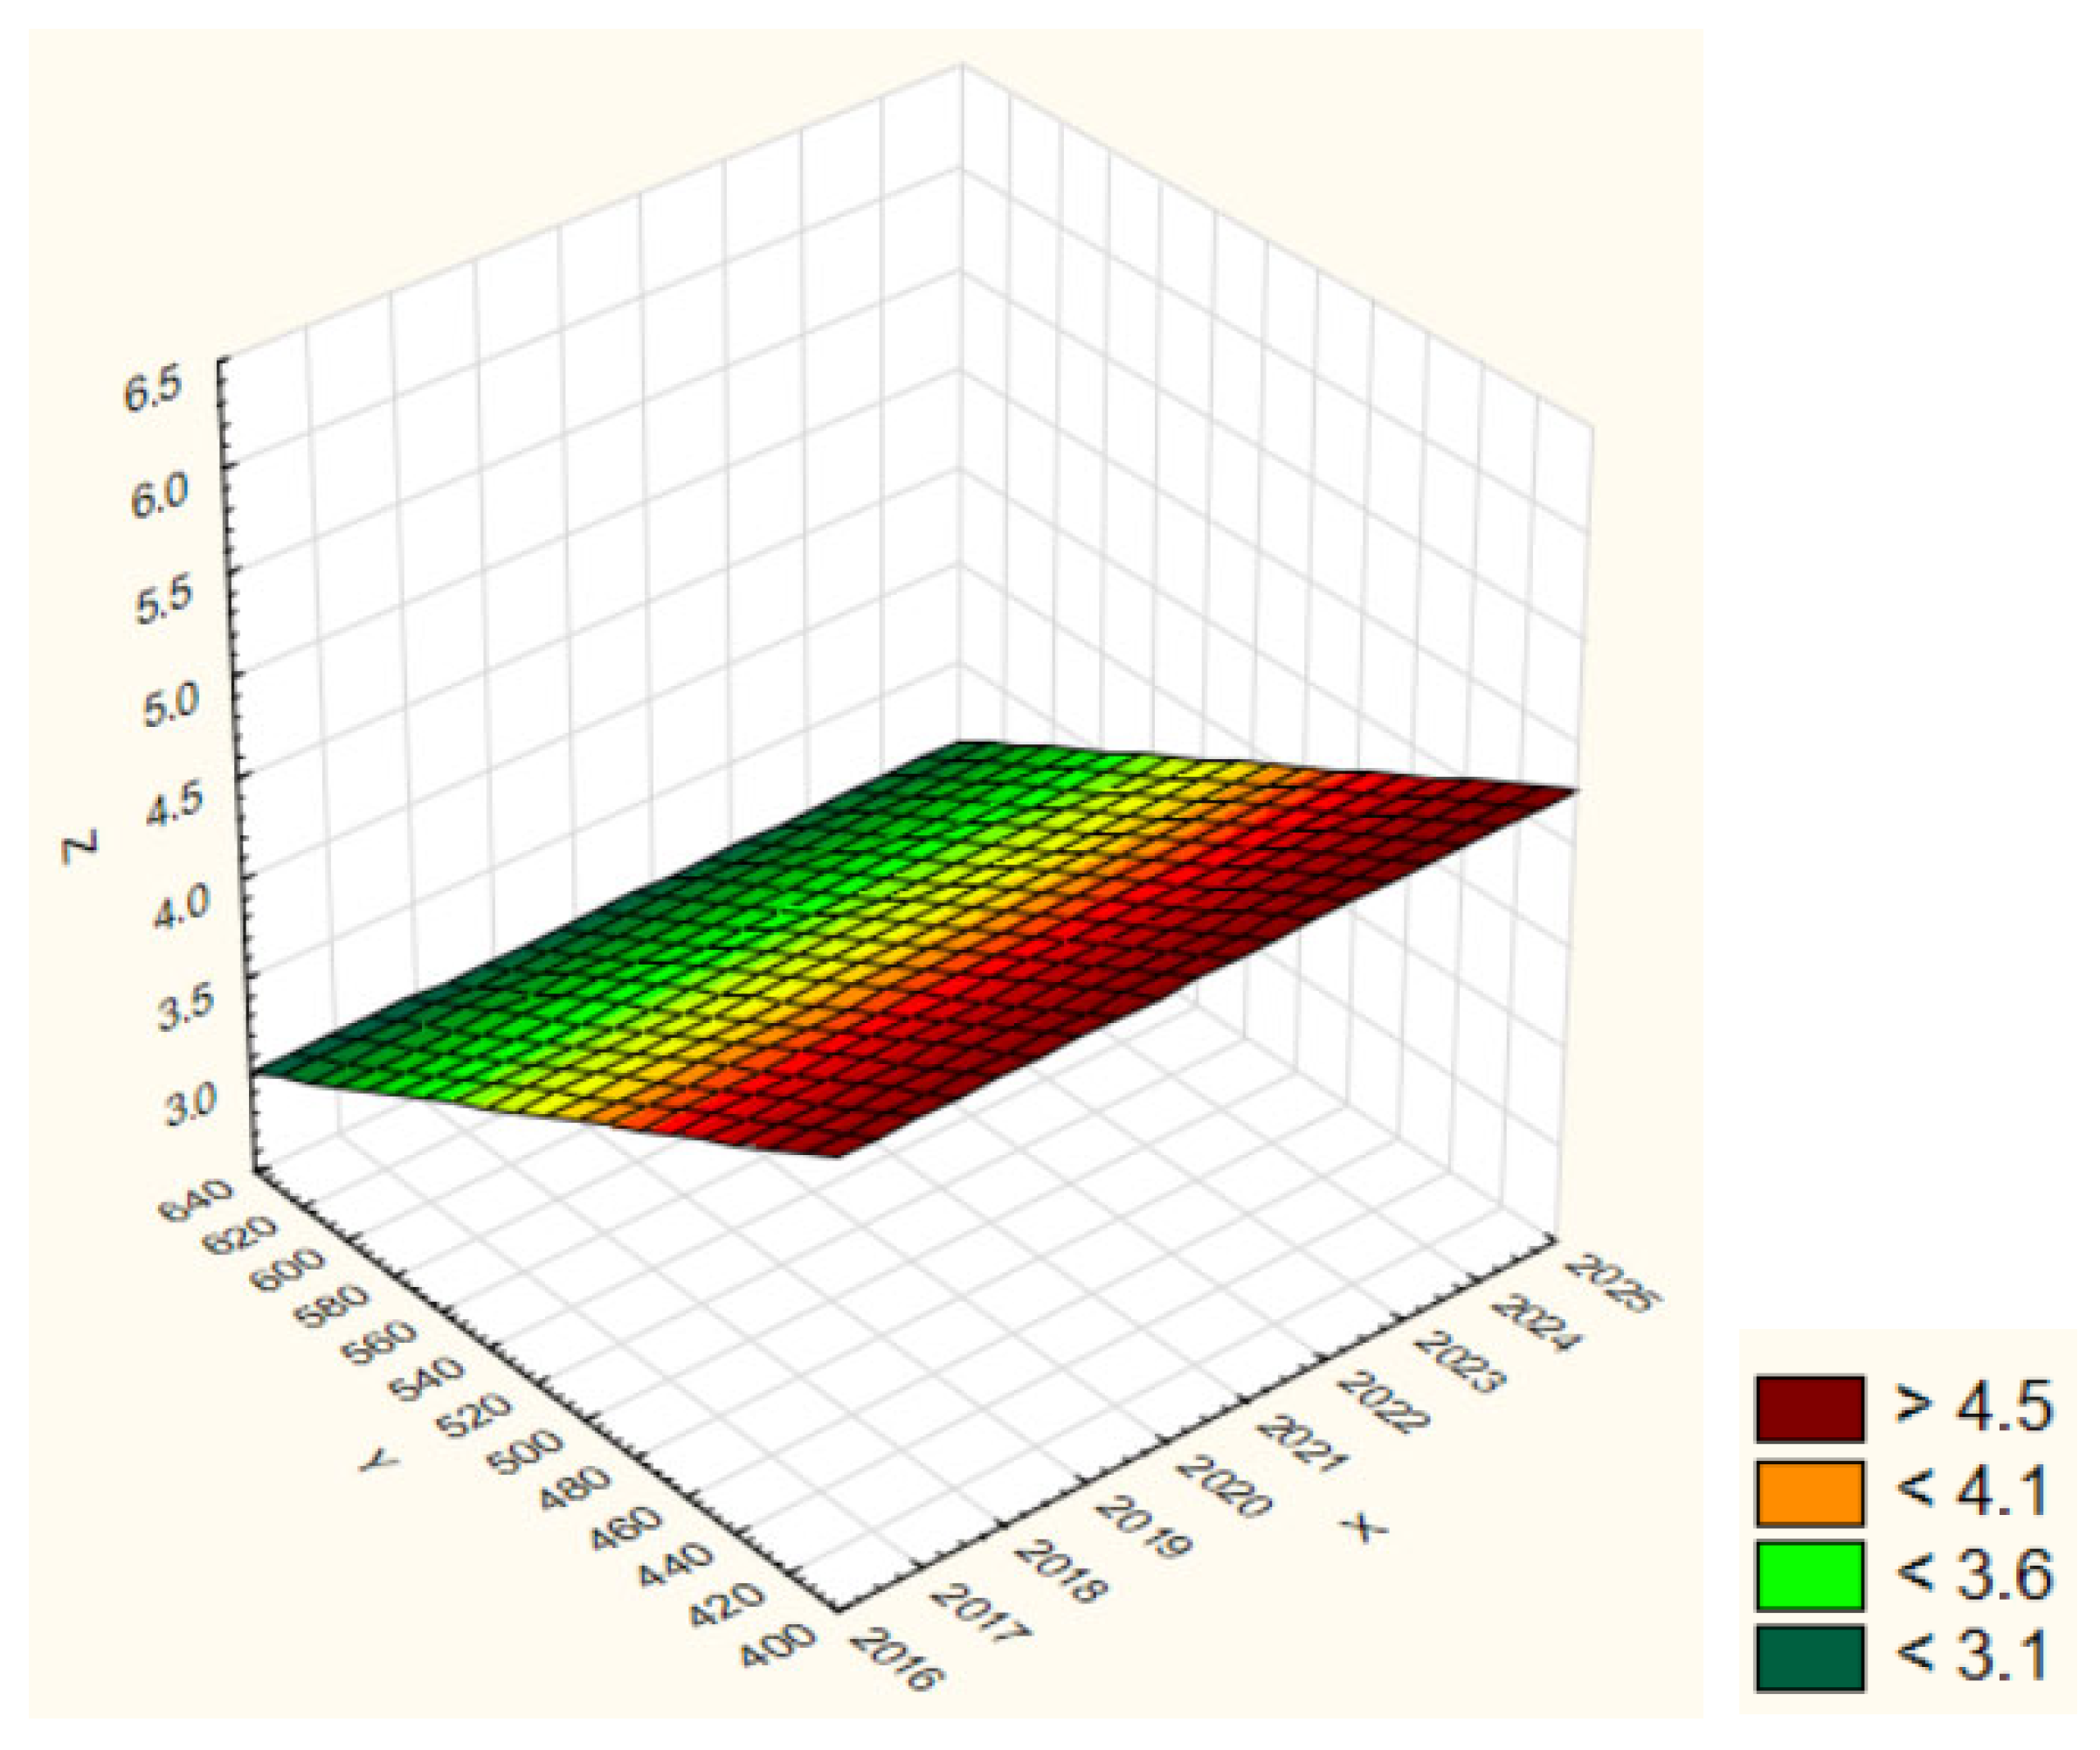
A weak negative correlation (r = −0.49) between precipitation and water quality was identified for the Tikhaya River (
Table S7). This suggests that increasing precipitation is associated with a slight improvement in water quality (i.e., a decrease in the water quality class). This relationship may result from the dilution effect: increased runoff lowers the concentration of pollutants. However, due to the weak strength of the correlation, this process is unstable and may be offset by other pollution sources.
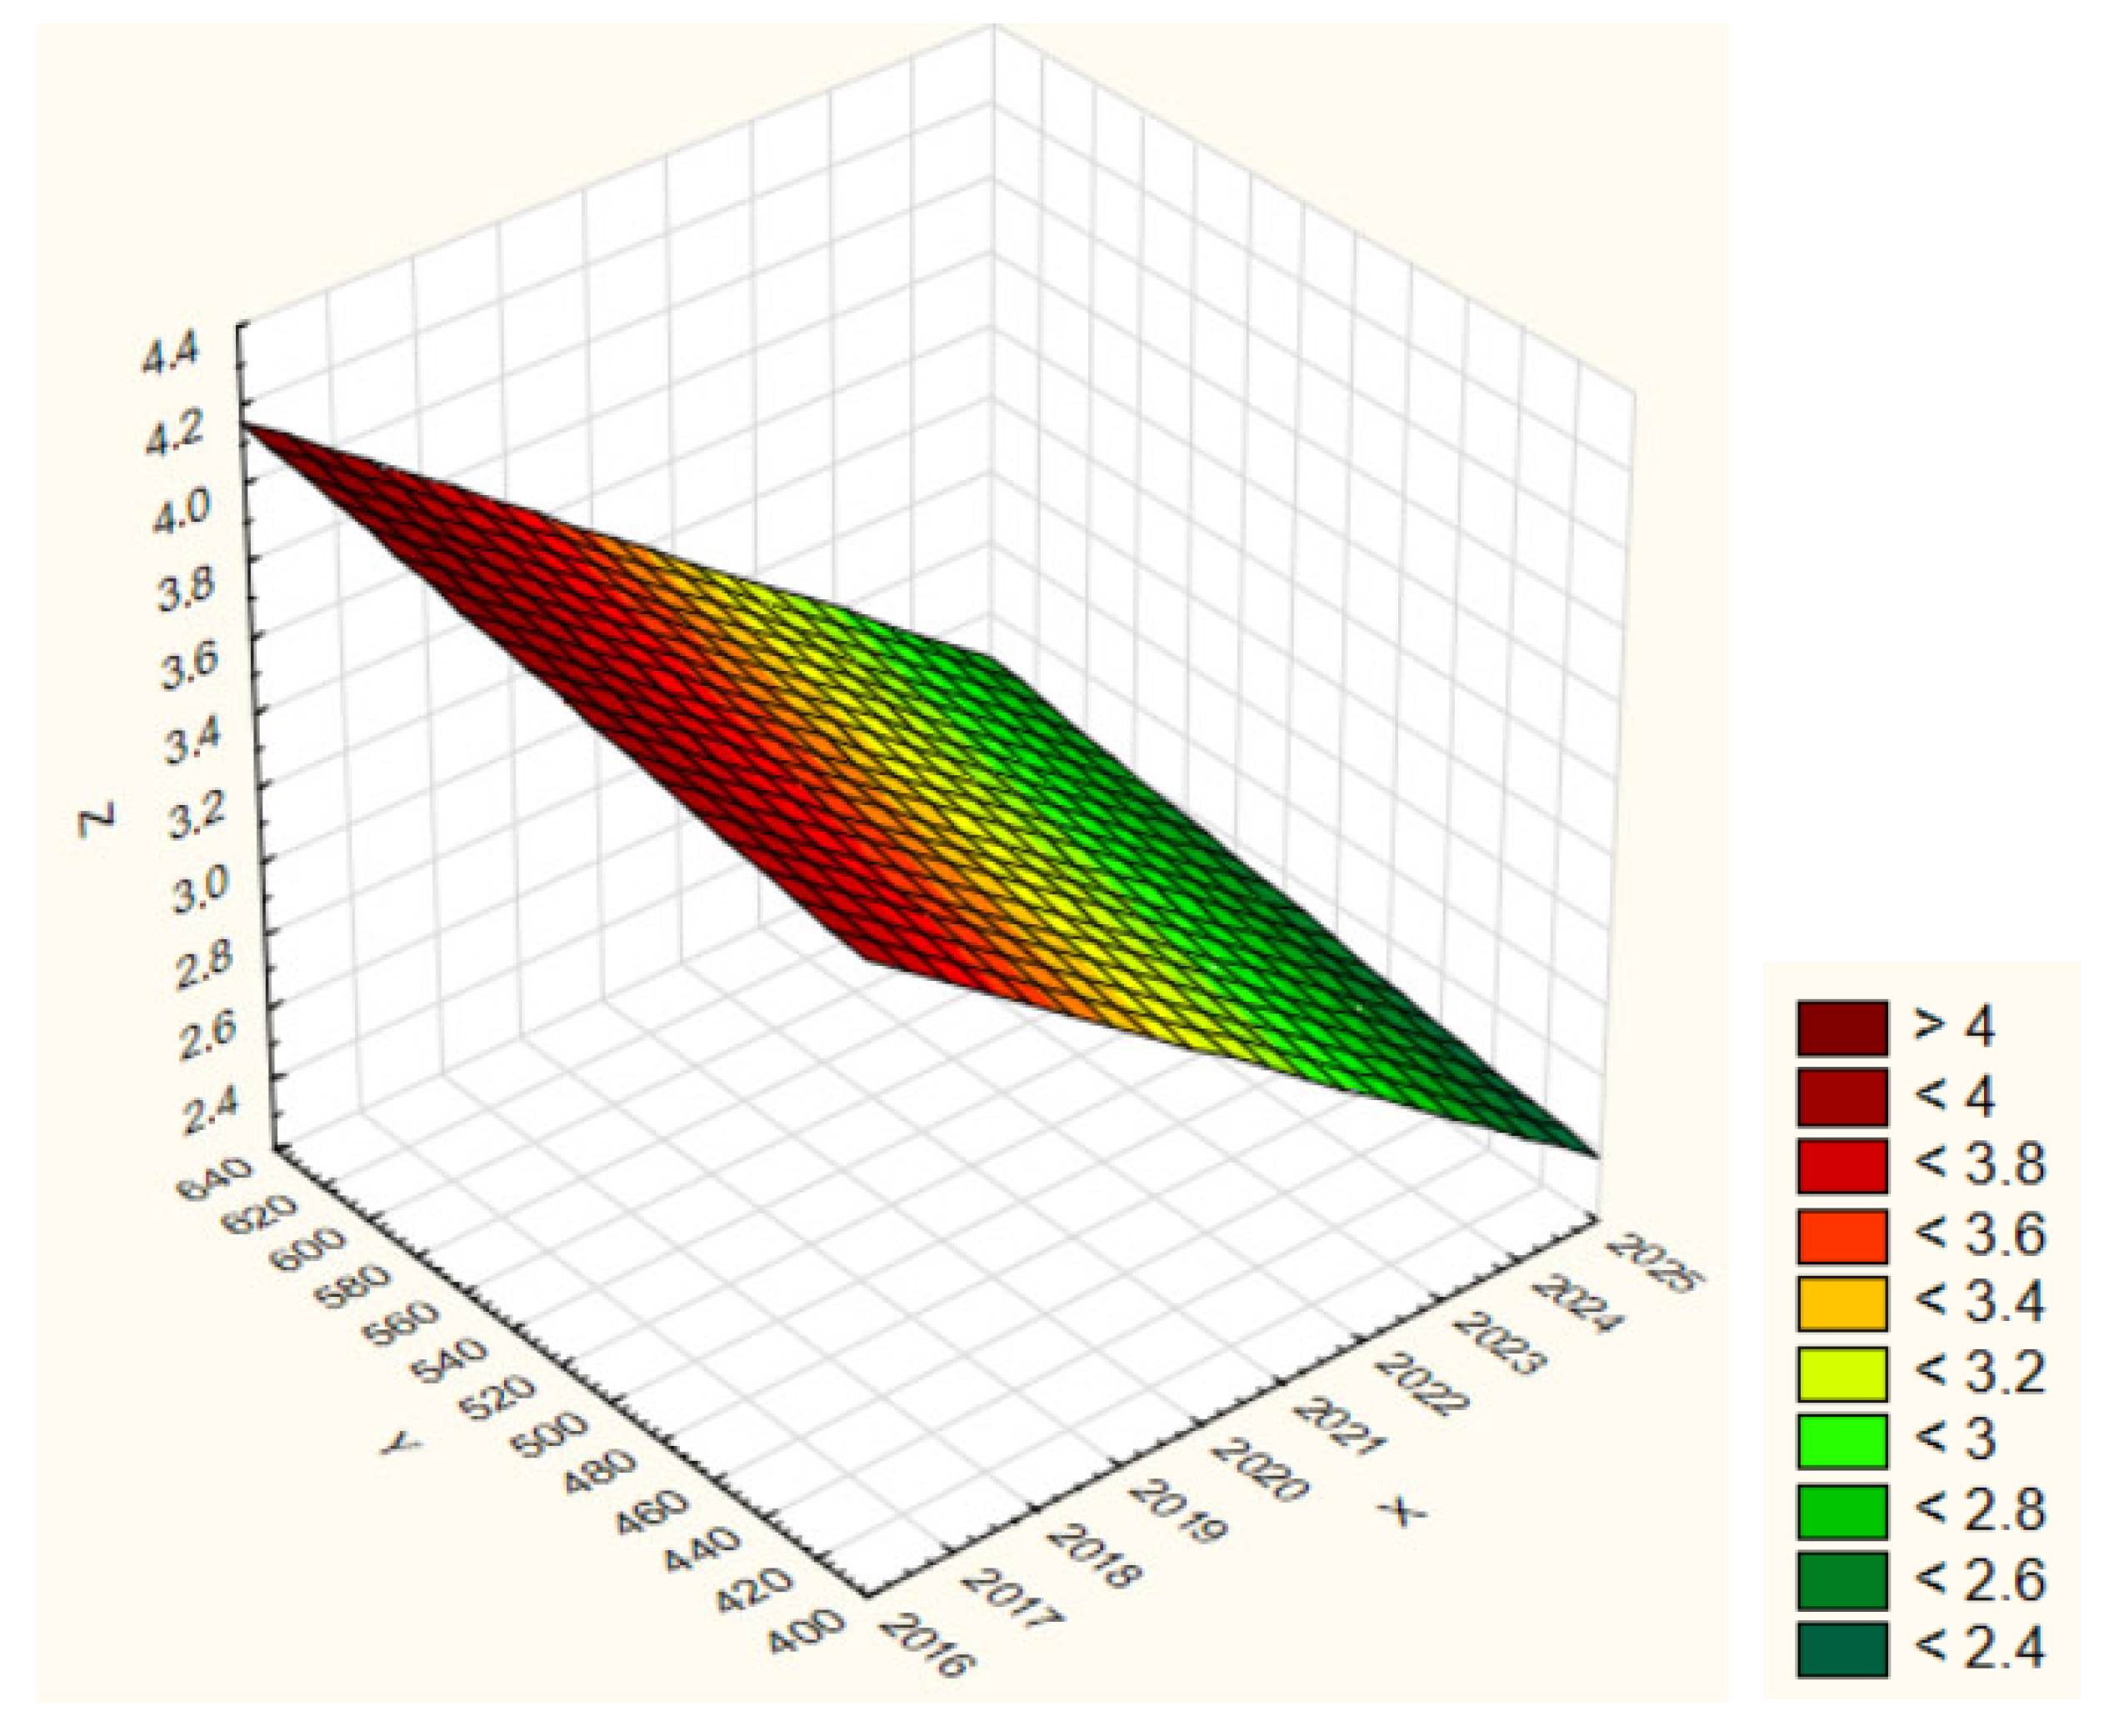
An analysis of the three-dimensional relationship between water quality class, precipitation, and time (2017–2024) for the Tikhaya River (
Figure 15) revealed that greater total precipitation is associated with consistent improvement in water quality. Under low-precipitation conditions (400–460 mm), higher water quality classes are recorded, indicating poorer conditions—up to polluted and heavily polluted. When precipitation exceeds 600 mm, the water quality class decreases, corresponding to satisfactory or good water conditions. At the same time, a gradual deterioration in water quality over time has been observed under constant precipitation levels, suggesting the influence of anthropogenic factors. Therefore, the amount of precipitation can be considered a significant natural regulator of the surface water quality class of the Tikhaya River.
Based on the graphical relationship, a model was developed to describe the combined effect of precipitation and time on the water quality class in the Tikhaya River. The model is expressed by the following Equation (8):
According to the equation, an increase in precipitation (y) leads to an improvement in water quality (i.e., a decrease in the quality class), which is reflected by a negative coefficient. At the same time, over the course of time (x), the z-value tends to increase, indicating a deterioration in water quality. This may be attributed to growing anthropogenic pressure and overall environmental stress on the river system. The developed model allows for a quantitative assessment of the impact of climatic conditions on surface water quality and can be used to forecast the ecological state of the river under various precipitation scenarios. The coefficient of determination R2 = 0.555, indicating an average degree of model fit.
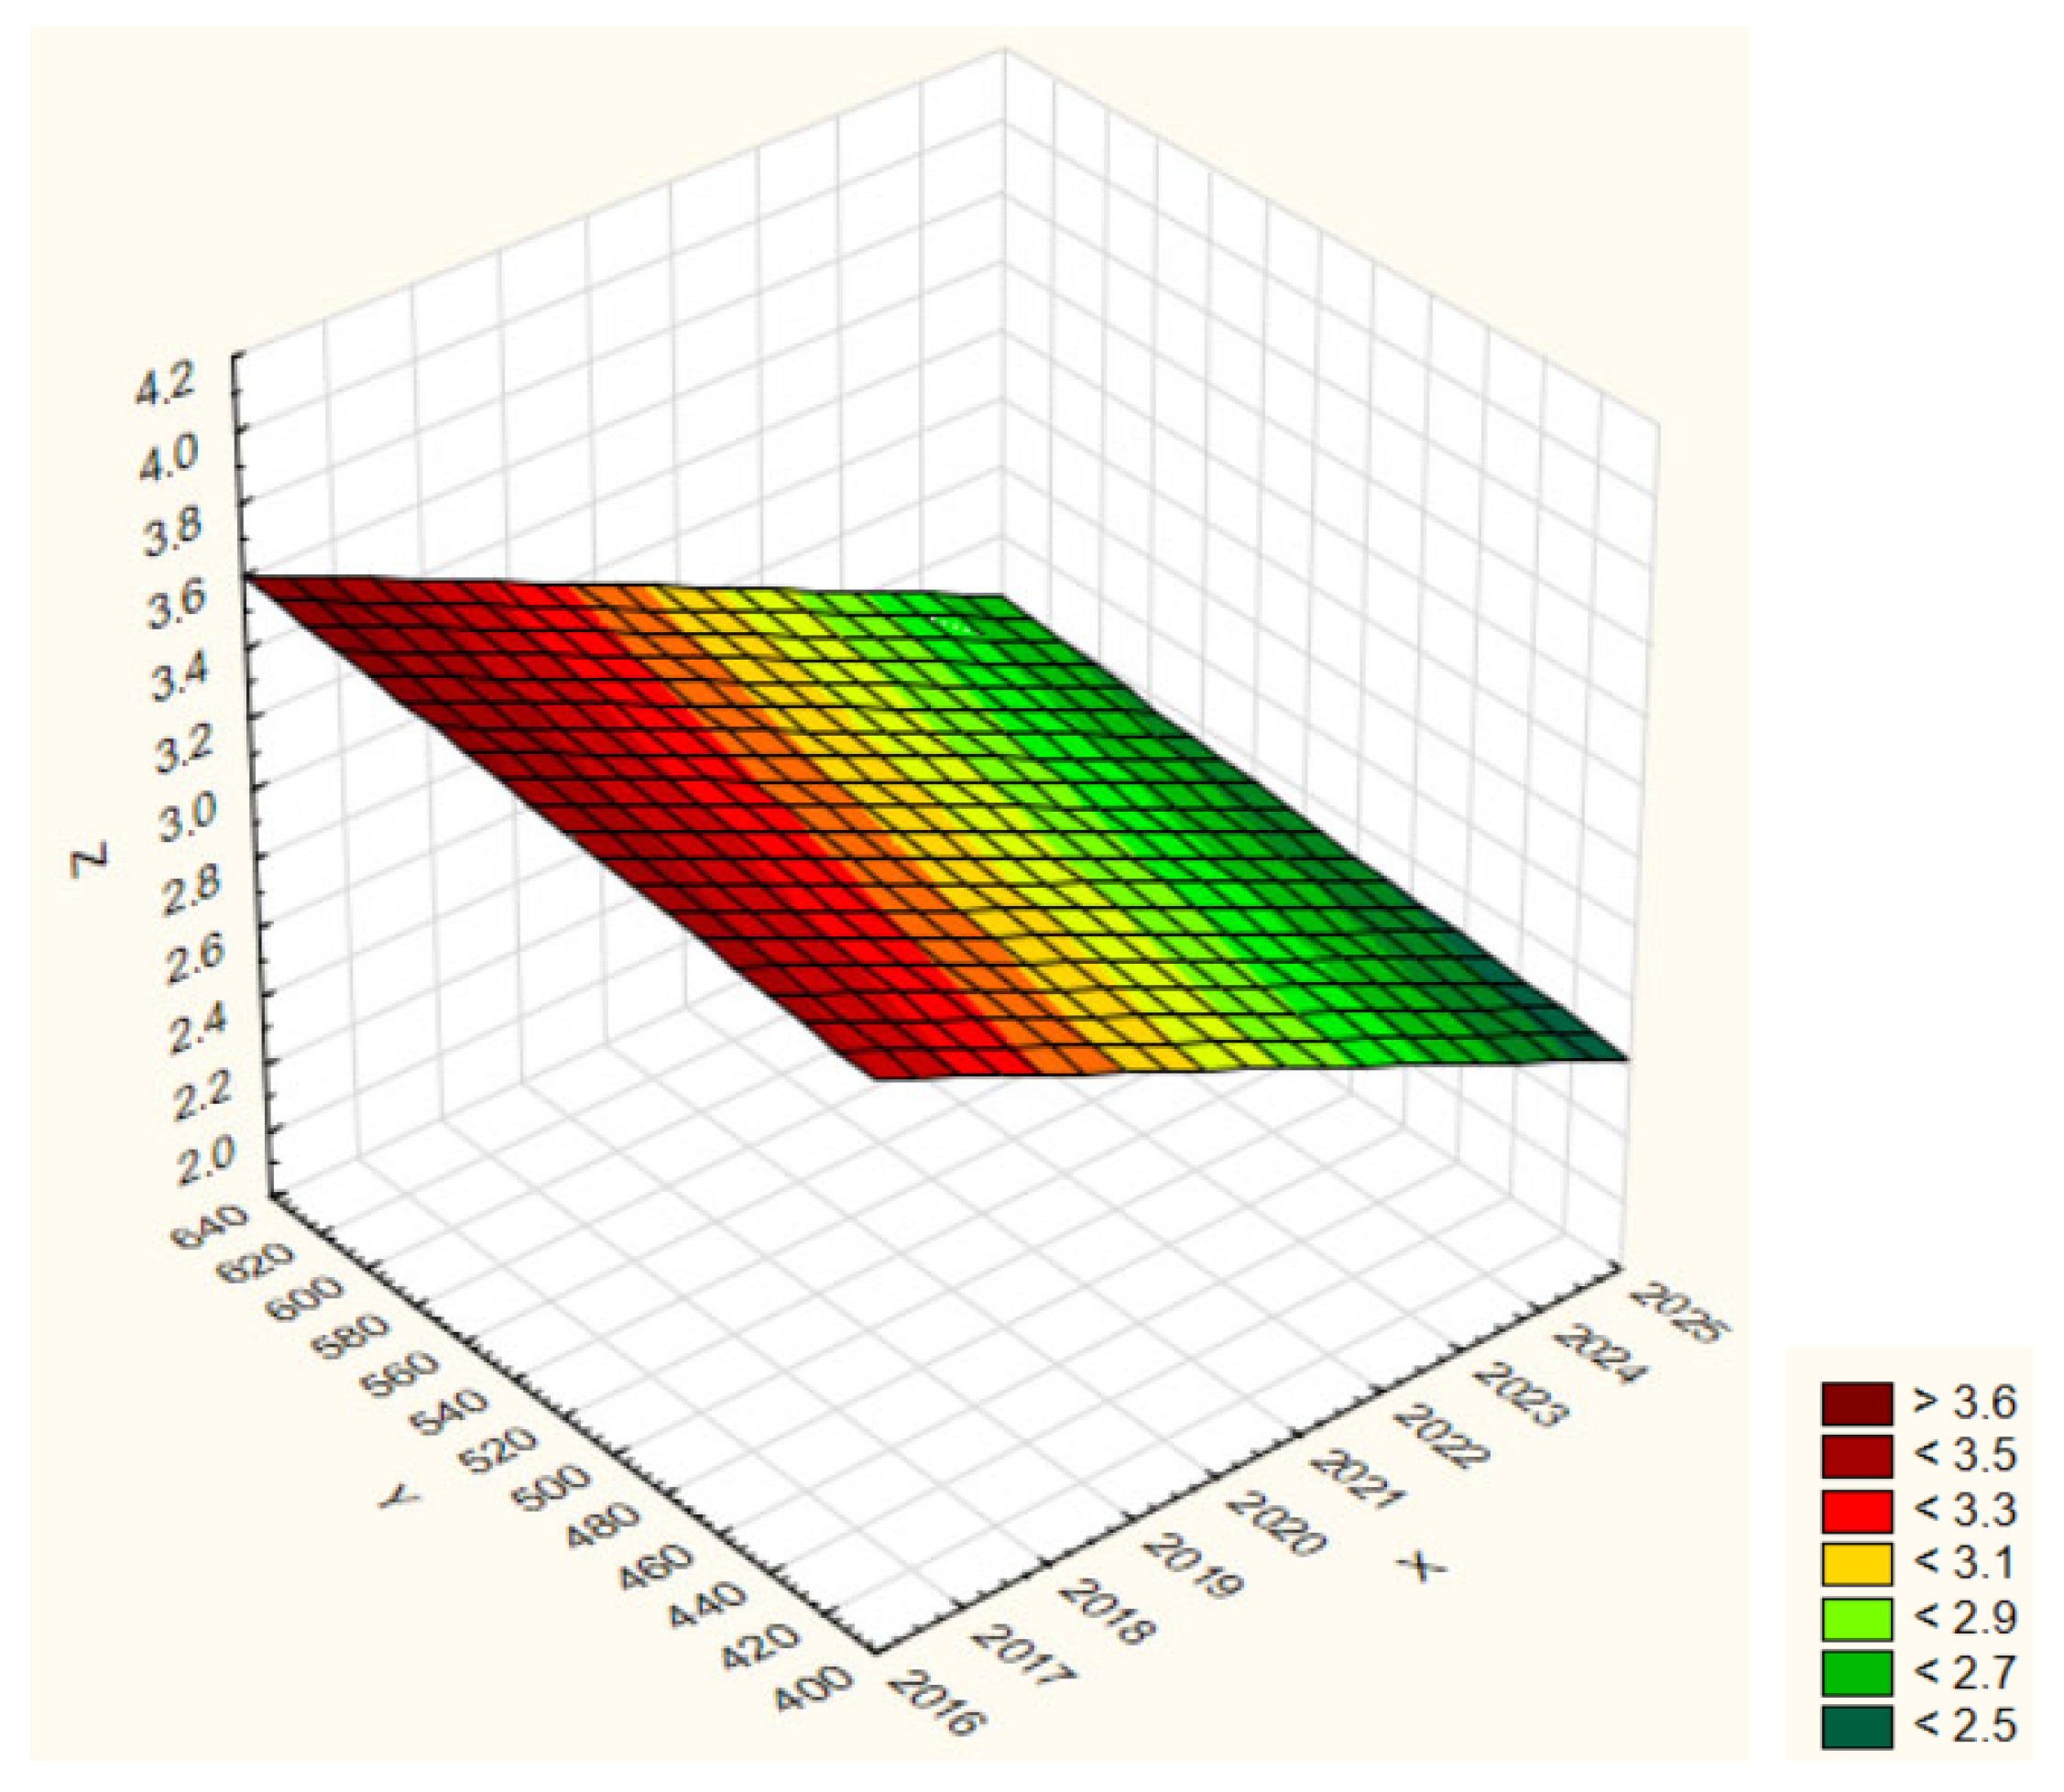
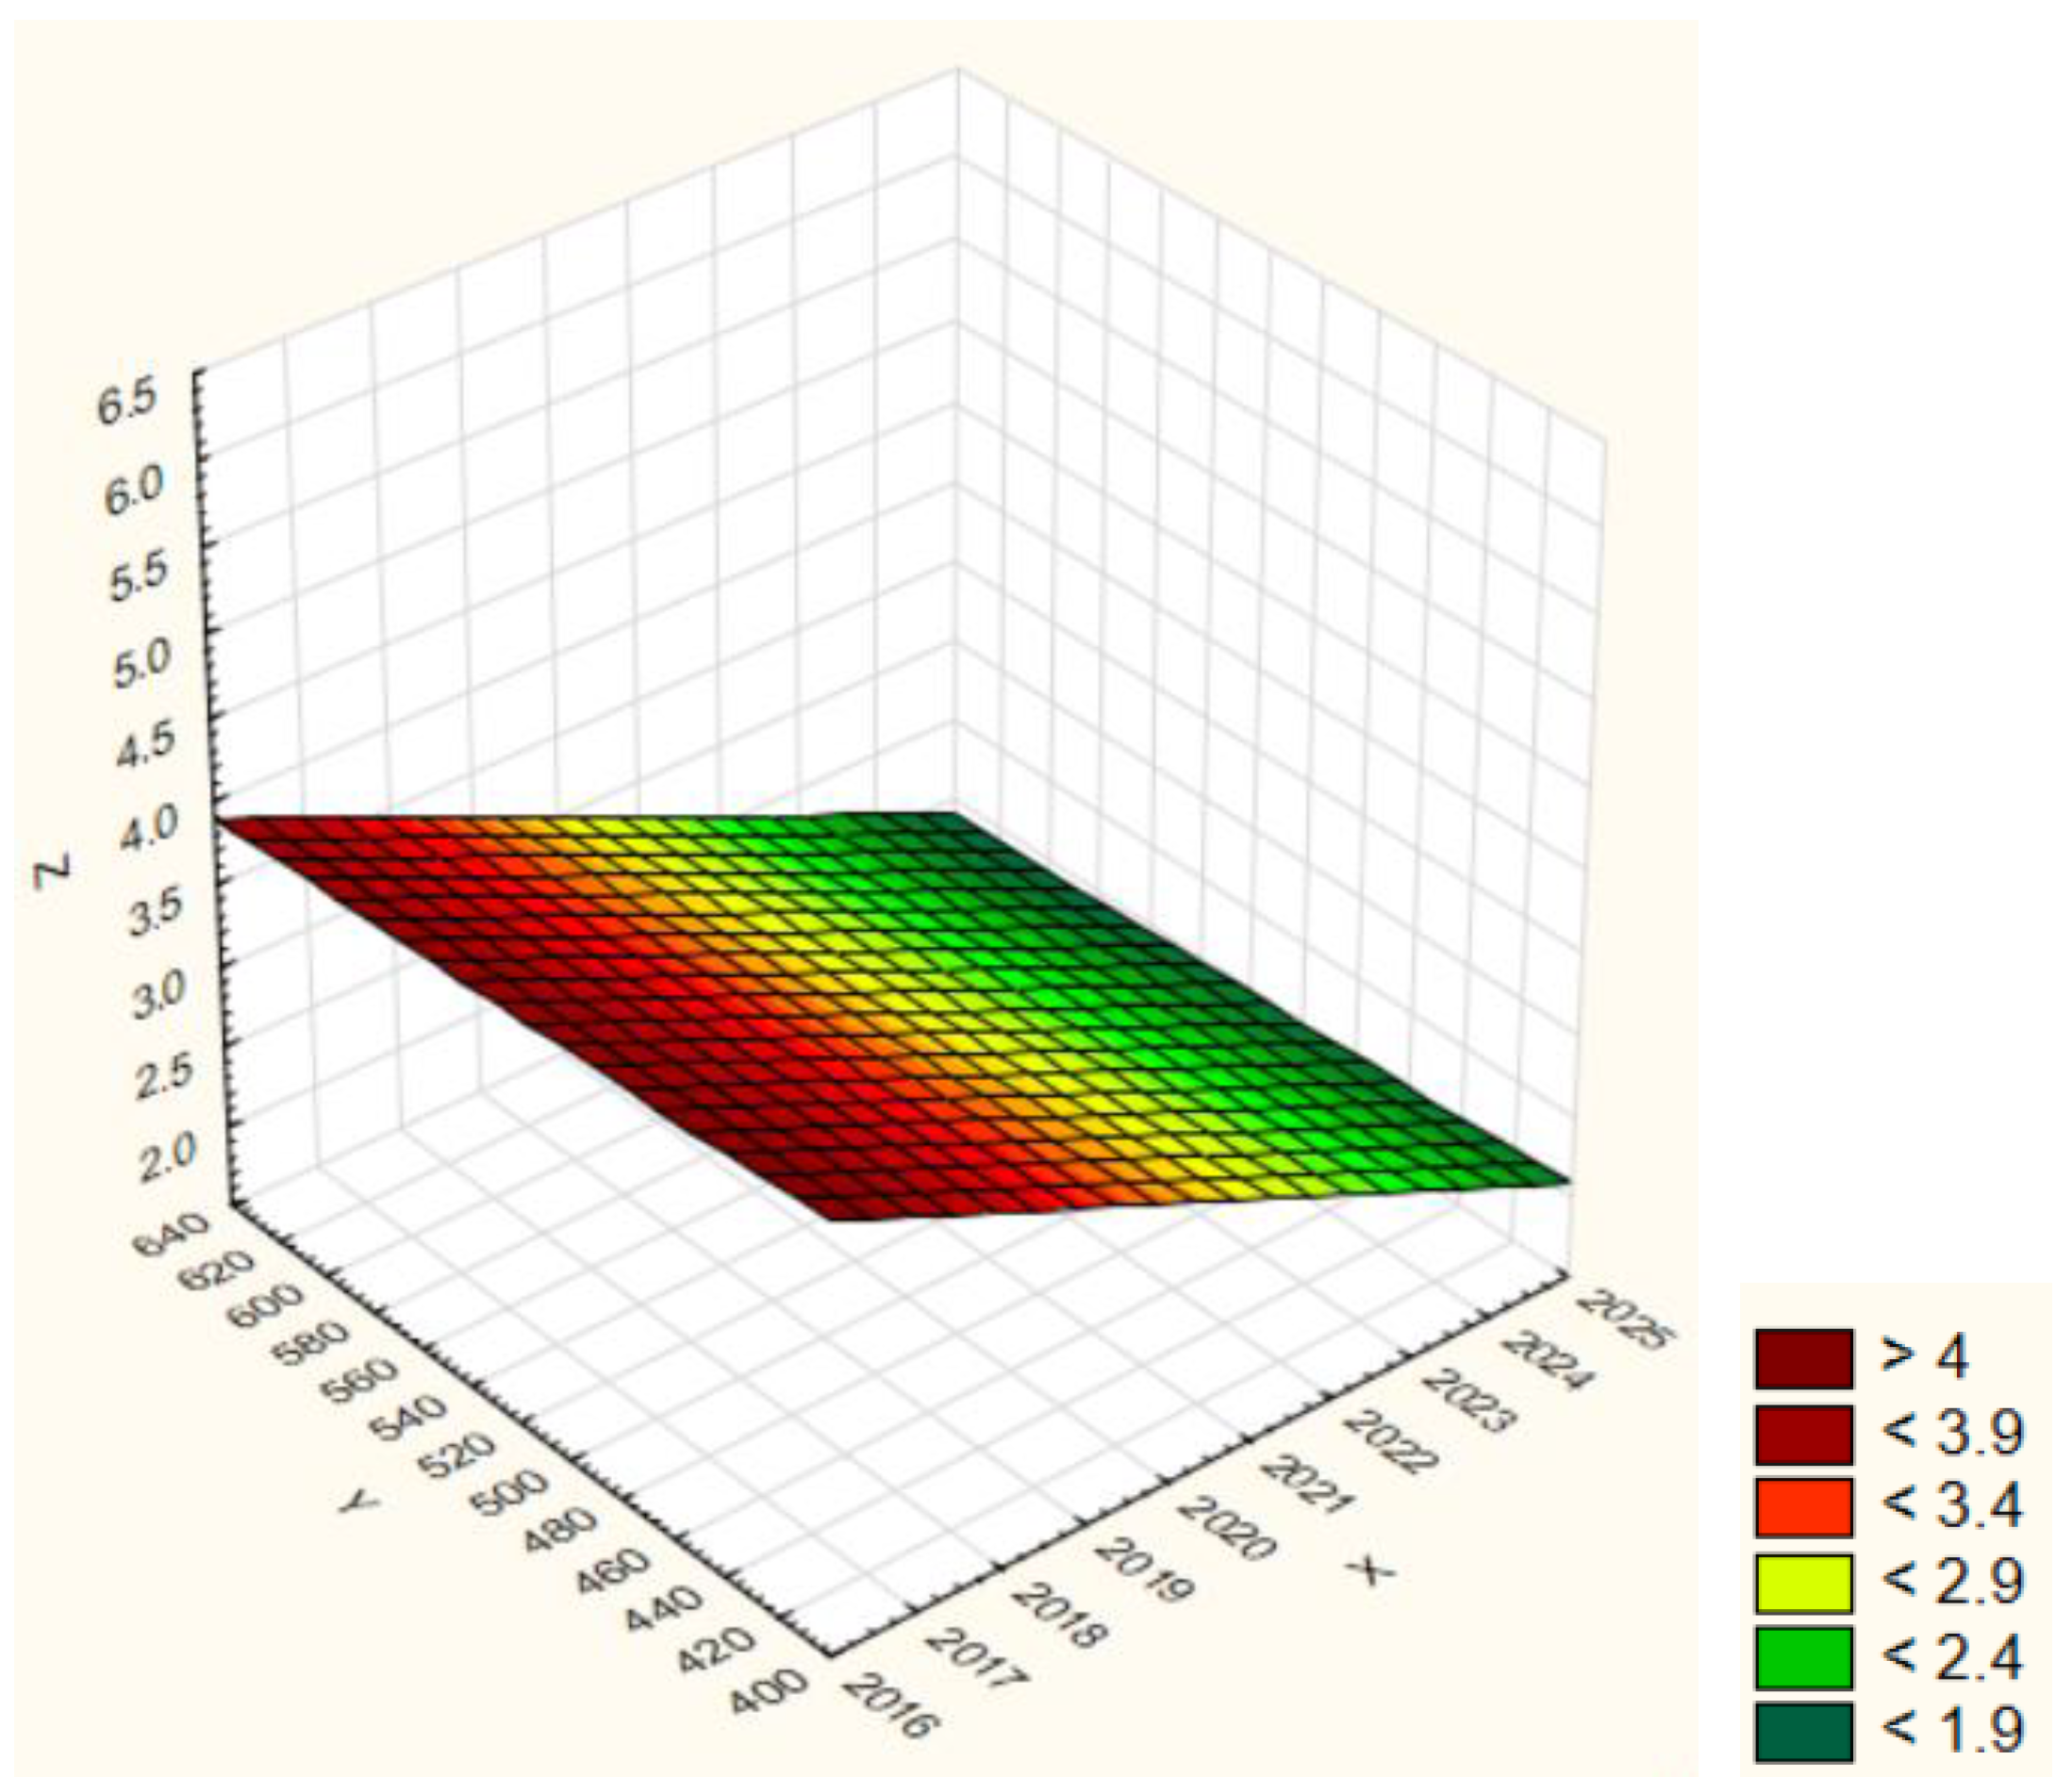
A weak positive correlation (r = +0.22) was identified for the Ulba River (
Table S7), indicating no strong linear relationship between precipitation and water quality. The slight upward trend may be due to increased pollutant input from surface runoff during periods of heavy rainfall; however, the relationship is not sufficiently strong to draw firm conclusions. Anthropogenic impacts in the river basin likely play a dominant role.
An analysis of the three-dimensional relationship between water quality class, precipitation, and time (2017–2024) for the Ulba River (
Figure 16) showed a consistent trend toward improved water quality with increasing precipitation. Under conditions of low precipitation (400–460 mm), higher z-values were recorded, corresponding to lower water quality—ranging from polluted to heavily polluted classes. As precipitation levels exceed 600 mm, the quality class decreases, indicating satisfactory to good water quality. Simultaneously, a clear temporal trend of water quality deterioration was observed: even with consistent precipitation levels, the pollution class tends to rise in later years. This suggests the influence of anthropogenic factors such as urbanization, wastewater discharge, and changes in the hydrological regime. Thus, while precipitation remains an important natural regulator of water quality in the Ulba River, the progressive increase in pollution over time highlights the need for additional environmental control measures.
Based on the graphical relationship, a model was developed to describe the combined effect of precipitation and time on the water quality class in the Ulba River. The model is expressed by the following Equation (9):
The obtained equation coefficients reflect the multidirectional influence of the studied factors. A negative value for the time variable (−0.1096) indicates a tendency toward improving water quality over time, which may result from effective environmental protection measures or changes in the hydrological regime. Conversely, the positive coefficient for precipitation (+0.0008) suggests a slight deterioration in water quality with increased water availability, possibly due to the flushing of pollutants from the catchment surface. Nevertheless, the dominant influence of the time variable indicates a generally positive long-term trend in the condition of the water body. The coefficient of determination was R2 = 0.10, indicating a low degree of explanation for variations in water quality class. Nevertheless, the model may still be useful for preliminary assessments of the influence of temporal and climatic factors on the river’s ecological status.
The Glubochanka River exhibits a very weak positive correlation (r = +0.17), suggesting no clear relationship between precipitation and changes in water quality (
Table S7,
Figure 17). A slight deterioration in quality during periods of increased precipitation may be attributed to polluted surface runoff, but the relationship is statistically insignificant. It is more likely that water quality is driven by local pollution sources or seasonal variations in water exchange.
Based on the graphical relationship, a model was developed to describe the combined effect of precipitation and time on the water quality class in the Glubochanka River. The model is expressed by the following Equation (10):
The model also demonstrates a clear temporal trend: the negative coefficient for the variable x (–0.1649) indicates a consistent decrease in z values, corresponding to improving water quality over the study period. The positive dependence on precipitation (+0.0012) indicates a slight degradation in water quality with increased rainfall, potentially due to surface runoff carrying pollutants from the catchment. Overall, the model reveals a positive long-term trend in water quality and highlights the importance of considering both climatic and anthropogenic factors in water quality management. The coefficient of determination was R2 = 0.602, suggesting a reasonably good explanation of variations in water quality based on the included variables. This model reflects a positive long-term trend and highlights the importance of considering both climatic and anthropogenic influences in water quality management.
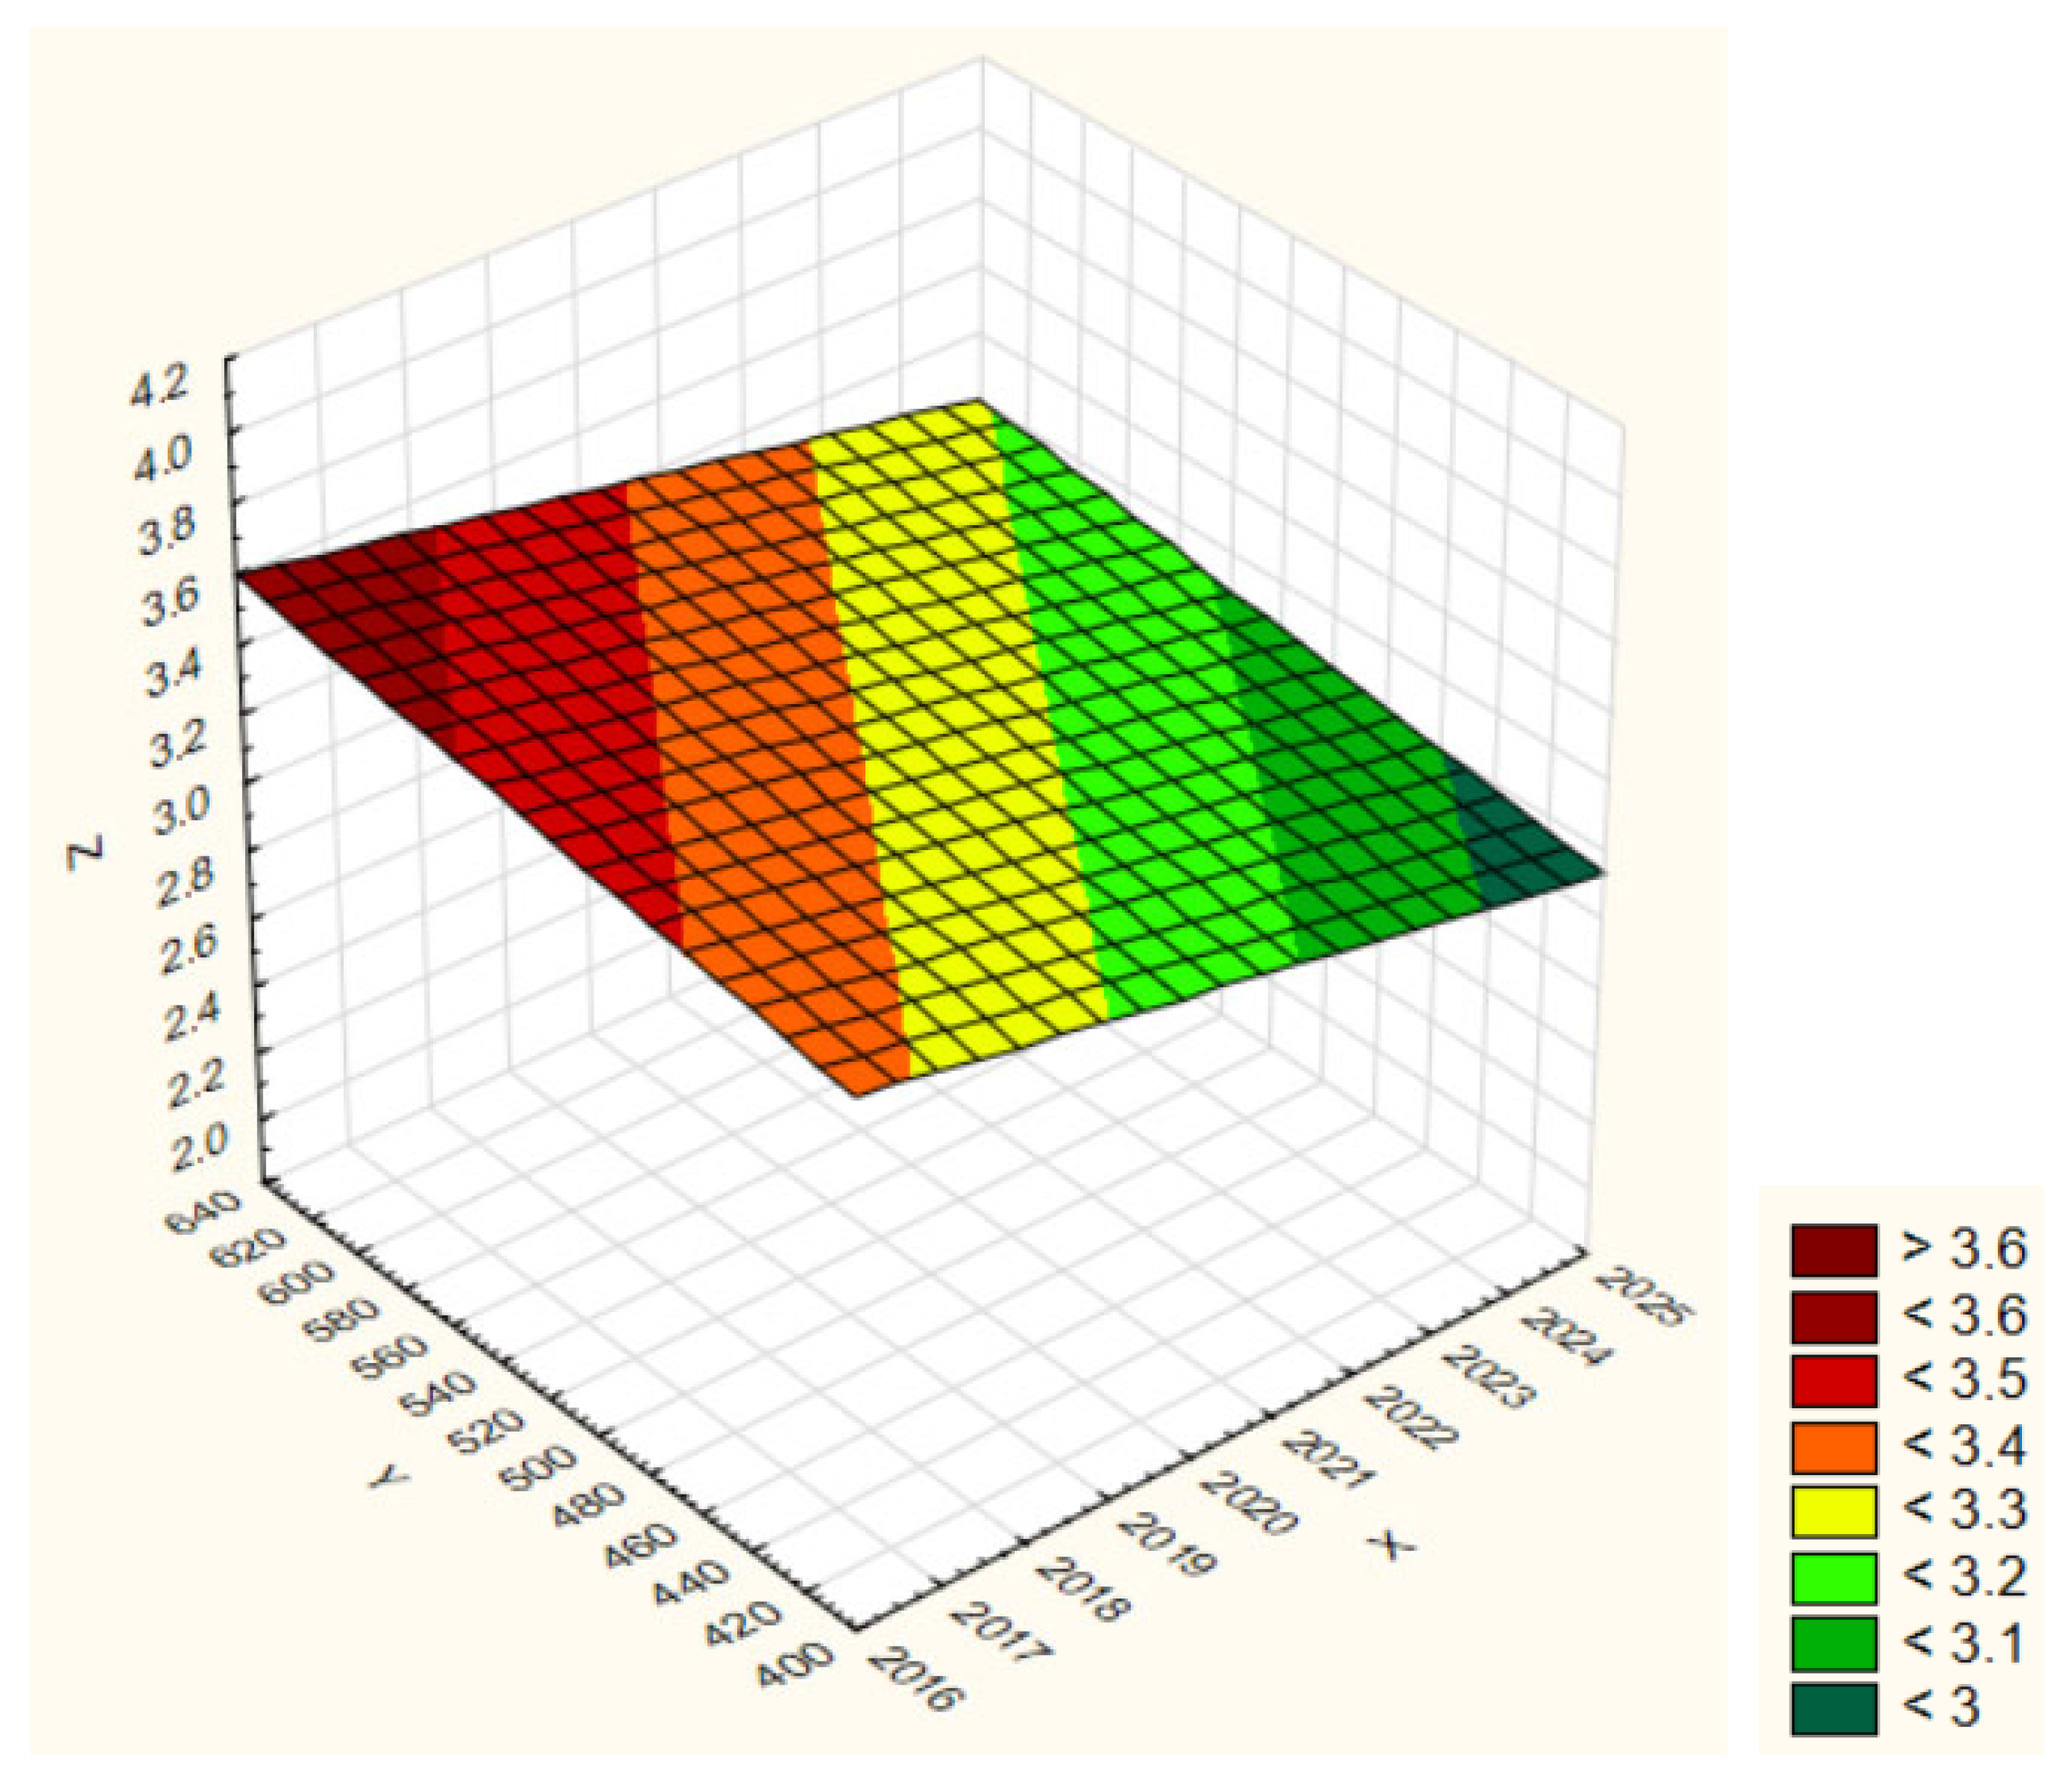
A weak positive correlation (r = +0.37) was found in the Krasnoyarka River between precipitation and water quality deterioration (
Table S7,
Figure 18). This may indicate that during periods of heavy rainfall, increased runoff from agricultural or industrial areas leads to a rise in pollutant concentrations in the river. Although the correlation is weak, the result is noteworthy and should be considered when designing water protection strategies for the river basin.
Based on the graphical relationship, a model was developed to describe the combined effect of precipitation and time on the water quality class in the Krasnoyarka River. The model is expressed by the following Equation (11):
The analysis of the model showed that the coefficient for the variable x is negative, which indicates a tendency to decrease the value of the water quality class, that is, to improve the condition of surface waters over time. A positive value of the coefficient at y may indicate the potential negative impact of increased precipitation due to the removal of pollutants from the catchment area. However, the model is characterized by low explanatory power: the coefficient of determination R2 is 0.018, which indicates the statistical insignificance of regression at the selected significance level. Thus, the results obtained should be interpreted with caution as a preliminary trend that requires confirmation on an expanded data set or using more complex models.
A weak negative correlation (r = −0.19) between precipitation and water quality was observed for the Oba River (
Table S7,
Figure 19), suggesting no clear linear relationship. Although increased precipitation may partially improve water quality through dilution, the trend is weak and possibly incidental. Water quality is likely more influenced by local catchment conditions and anthropogenic factors.
Based on the graphical relationship, a model was developed to describe the combined effect of precipitation and time on the water quality class in the Oba River. The model is expressed by the following Equation (12):
The negative value of the coefficient for variable x (−0.2234) indicates a tendency to decrease the quality class of surface waters over time, which may be due to a gradual improvement in the state of the river ecosystem or the results of environmental protection measures. The negative value of the coefficient at y (−0.0008) indicates that an increase in precipitation has a weak positive effect on water quality, possibly due to dilution of pollutants and improvement of the hydrological regime of the river.
However, the statistical evaluation of the model showed a coefficient of determination of R2 = 0.133. Moreover, both coefficients for variables x and y were statistically insignificant (p > 0.5), indicating a high likelihood that the observed relationships are due to random variation. Therefore, despite the suggested influence of temporal and climatic factors, the model demonstrates limited predictive capacity. This underscores the necessity of incorporating additional explanatory variables, such as pollution levels, hydrological indicators, and anthropogenic pressures. Nevertheless, the current findings may serve as a preliminary foundation for hypothesis development and the construction of more robust predictive models in future research.
An analysis of data from 2001 to 2024 (
Figure 4) showed that average annual precipitation in the study region ranged from 421 mm to 625 mm, with no clear trend toward either increase or decrease. The highest values were recorded in 2015, 2016, 2023, and 2024, which may reflect early signs of increased climatic variability.
A comparison of precipitation levels with changes in surface water quality classes revealed different types of relationships across the rivers studied. Most rivers (Breksa, Tikhaya, and Oba) showed weak or no correlation between precipitation and water quality, suggesting that annual water availability has a limited effect on water quality, particularly in the presence of localized pollution sources. A weak positive correlation was observed in the Krasnoyarka River, and partially in the Ulba and Glubochanka rivers, indicating potential water quality deterioration with increased precipitation—likely due to enhanced surface runoff from polluted areas.
When comparing precipitation patterns with the dynamics of surface water quality classes, various types of interrelationships were observed across individual rivers. For most rivers, such as the Breksa, Tikhaya, and Oba, there is a weak or no linear correlation between annual precipitation and water quality, as confirmed by correlation analysis. This suggests that hydrochemical parameters are only marginally influenced by annual water availability, particularly in settings where local pollution sources dominate. In contrast, a weak positive correlation was identified for the Krasnoyarka, Ulba, and, to a lesser extent, the Glubochanka rivers, likely due to increased surface runoff from contaminated areas during periods of high precipitation.
It is important to note that despite the weak linear relationships identified through Pearson correlation, three-dimensional visualizations (
Figure 14,
Figure 15,
Figure 16,
Figure 17,
Figure 18 and
Figure 19) reveal more nuanced, nonlinear spatial and temporal trends—especially in regions experiencing extreme precipitation or abrupt changes in water quality. These visual patterns do not contradict the statistical findings; rather, they enrich interpretation by highlighting the complex, multifactorial nature of climatic influences on small river systems. Thus, the integration of both quantitative and visual analytical methods offers a more comprehensive understanding of environmental processes.
Given current trends, and assuming precipitation levels remain stable, the following scenarios can be proposed:
By 2030, no significant changes in regional water availability are expected. If economic activity remains at current levels, water quality in most rivers will likely remain stable, with short-term deterioration possible during periods of intense rainfall.
By 2050, under projected intensification of climate change (e.g., more frequent extreme weather events), both increased precipitation variability and stronger impacts from surface runoff are anticipated. Under these conditions, water quality may decline, especially in rivers that already exhibit a positive correlation between precipitation and water quality deterioration (Krasnoyarka, Ulba).
Thus, in the long term, changes in precipitation may become a significant risk factor for the ecological status of small rivers in the region. However, the extent of this impact will largely depend on the level of anthropogenic pressure, the efficiency of wastewater treatment systems, and the effectiveness of catchment protection measures.


 ,
, 
