3.2. Results Analysis
The model was solved using Python 3.8 integrated with the Gurobi 11.0.3 solver on a computer with a 2.5 GHz CPU and 16.0 GB of RAM. The computation yielded a lower bound for the total supply chain cost of 30,661,325.50 CNY, with a corresponding total demand fulfillment rate of 80.1%.
To evaluate the performance of the proposed model in handling supply chain disruptions, a comparative analysis was conducted against traditional models. The study examined variations in total cost and demand fulfillment rate under three scenarios: exceptionally severe disruptions, normal conditions, and an integrated scenario combining all three disruption levels. In the model,
= 0.5 indicating an equal importance assigned to both expected total cost and demand fulfillment rate. Let
,
denote the total supply chain cost required to achieve a 100% demand fulfillment rate. The computational results are presented in
Table 8.
Under exceptionally severe disruption scenarios, the traditional model achieves only a 63.42% total demand fulfillment rate, failing to meet the minimum requirement, whereas the proposed model attains a significantly higher rate of 95.14%. To achieve a 100% demand fulfillment rate, the traditional model requires an additional cost of 62.18%, which is 56.60% higher than the cost increase needed for the proposed model. These results demonstrate that traditional models struggle to effectively mitigate risks under major disruptions, and the substantial cost escalation poses a critical barrier to sustainable corporate operations.
Under normal conditions, the proposed model incurs a 22.5% higher total cost compared to the traditional model, while improving the demand fulfillment rate by only 4.95%. However, in the traditional model, manufacturers rely solely on a single supplier for components, with no alternative suppliers or safety stock reserves. When disruptions occur, information asymmetry [
28] and market complexity make it extremely difficult for manufacturers to quickly identify alternative suppliers that meet production requirements. Consequently, restoring normal supply chain operations would entail significantly higher costs than the baseline 22,946,936.15 CNY and the total demand fulfillment rate may fail to meet minimum requirements.
Under combining all three scenarios, the traditional model demonstrates only a 1.58% reduction in cost overrun rate compared to the proposed model, while exhibiting a 15.43% lower total demand fulfillment rate. To achieve 100% demand fulfillment rate, the traditional model requires a 23.80% increase in total cost, whereas the proposed model necessitates only a 4.66% cost increment. Further comparison is made between normal conditions and combining all three scenarios. The proposed model achieves a 10.66% improvement in demand fulfillment rate with a 14.31% increase in total cost. The traditional model yields a mere 0.18% demand fulfillment rate improvement despite a substantial 37.96% cost escalation.
The analysis demonstrates that while the proposed model incurs higher initial costs, it exhibits superior performance in both overall cost control and risk resilience. Particularly under extreme disruption scenarios, the model significantly mitigates adverse impacts, demonstrating strong economic viability and competitive advantage for sustainable supply chain management.
- 2.
Comparative Analysis of Individual and Combined Strategy Implementation.
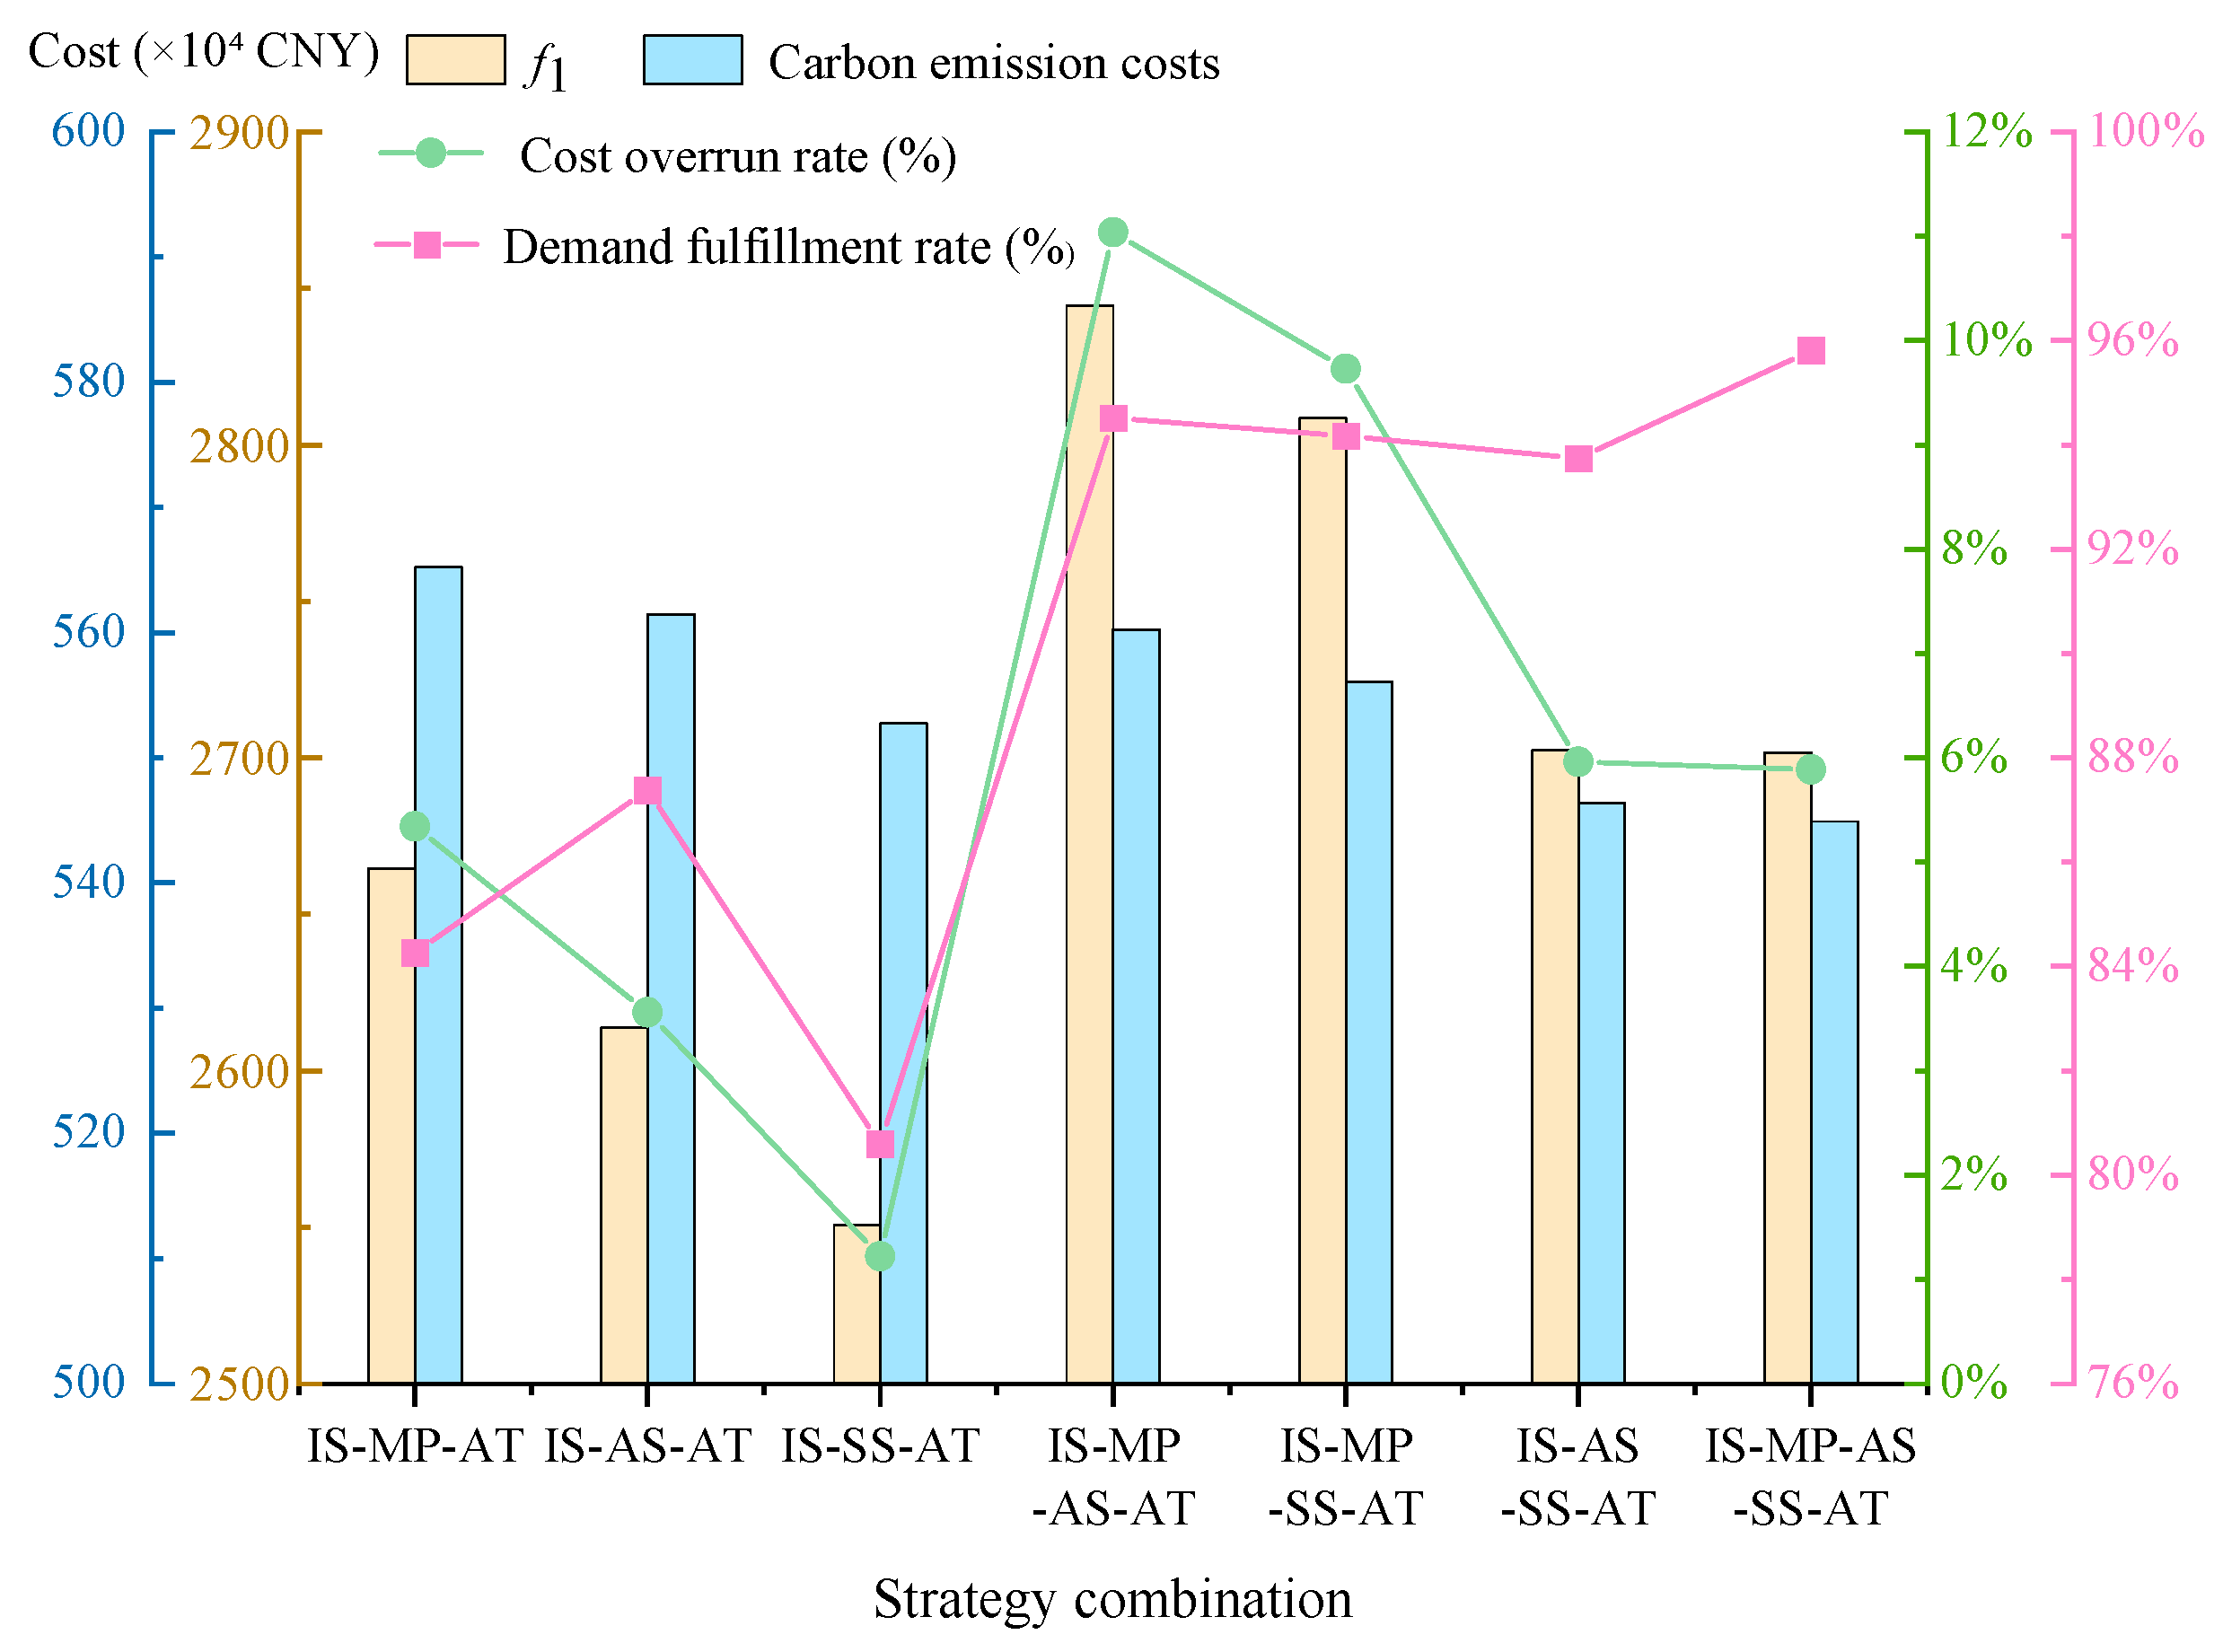
The information sharing system and alternative transportation plans primarily address information coordination and transportation disruptions, while multi-sourcing, alternative suppliers and safety stock optimize resource allocation to achieve optimal performance. To assist decision-makers in better understanding the effectiveness of these strategies, we examine variations in total supply chain costs and demand fulfillment rates when these three resilience enhancement strategies are implemented individually or in combination. With
= 0.5, the comparative results of strategy implementation are presented in
Figure 1.
Among the single-strategy approaches, the multi-sourcing strategy demonstrates a 5.34% cost overrun rate (higher than the 3.56% of the alternative supplier strategy) while achieving an 84.26% demand fulfillment rate (lower than the 87.39% of the alternative supplier strategy). In contrast, the safety stock strategy exhibits the lowest cost overrun rate (1.22%) with an 80.6% demand fulfillment rate that meets minimum requirements, representing the most cost-effective solution for maintaining stable supply chain operations. Notably, the safety stock strategy also generates the lowest carbon emission costs, contributing to sustainable supply chain development and aligning with current environmental trends. Under normal conditions or temporary disruptions, the safety stock strategy proves optimal. However, when preparing for severe or catastrophic disruptions, the alternative supplier strategy becomes the preferred approach. Although this entails higher costs, safety stock alone cannot fully mitigate major disruptions. The alternative supplier strategy ensures production stability under such circumstances while achieving higher total demand fulfillment rates compared to multi-sourcing strategies.
In practice, a multi-sourcing strategy proves optimal for mitigating high-frequency, predictable risks by dynamically allocating orders to reduce reliance on any single supplier while leveraging supplier competition to drive down costs—particularly effective for enterprises operating in transparent supply markets with abundant alternatives. Conversely, an alternative supplier strategy demonstrates superior effectiveness against low-frequency, high-impact disruptions, offering rapid response capabilities and contractual flexibility. This approach is especially critical for industries with highly concentrated supply chains and prohibitive switching costs.
For dual-strategy combinations, the observed cost overrun rates were 11.04%, 9.73%, and 5.96%, with corresponding demand fulfillment rates of 94.52%, 94.17%, and 93.74%, respectively. While all dual-strategy combinations achieved comparable demand fulfillment performance, the alternative supplier plus safety stock combination have significantly lower cost overruns and the lowest carbon emission costs, the combination has optimal operational efficiency. The combined alternative supplier and safety stock strategy proves effective across all scenarios—from normal operations to catastrophic disruptions—while maintaining lower cost investments that benefit enterprise development. The full-strategy combination achieved lower total supply chain costs, higher demand fulfillment rates, and reduced carbon emissions. Therefore, the full-strategy implementation model demonstrates superior performance across all critical metrics.
Overall, while the full-strategy combination incurs higher total costs compared to individual strategies, it significantly improves the total demand fulfillment rate. More importantly, the full-strategy combination demonstrates stronger risk resilience and remains applicable across all scenarios.
- 3.
Sensitivity Analysis.
(1) Impact of Weight on , and .
The weight
reflects the decision-making preference between total supply chain cost and demand fulfillment rate. Holding other parameters constant, we examine the variation trends of
,
, and
as
increases from 0 to 1 in 0.1 increments, as illustrated in
Figure 2.
Figure 2 demonstrates that as the weight coefficient
increases,
continuously decreases while
continuously increases. When
< 0.2, marginal
reductions lead to the significant increase of
, making values below this threshold inadvisable. Within the 0.2 ≤
≤ 0.6 range, the
and
reduction rate gradually attenuates while
maintains stable growth at modest levels. Beyond
> 0.6,
increases significantly and tends to stabilize, while
and
decrease slowly. Within the 0.4 ≤
≤ 0.6 range, the model simultaneously maintains all metrics at competitively low levels, achieving an optimal balance between total supply chain cost and demand fulfillment rate. Therefore, the value of weight
can be set according to the decision-making needs.
(2) Impact of Scenario Probabilities on , and .
The study examines the impact of disruption probability scenarios on
,
, and
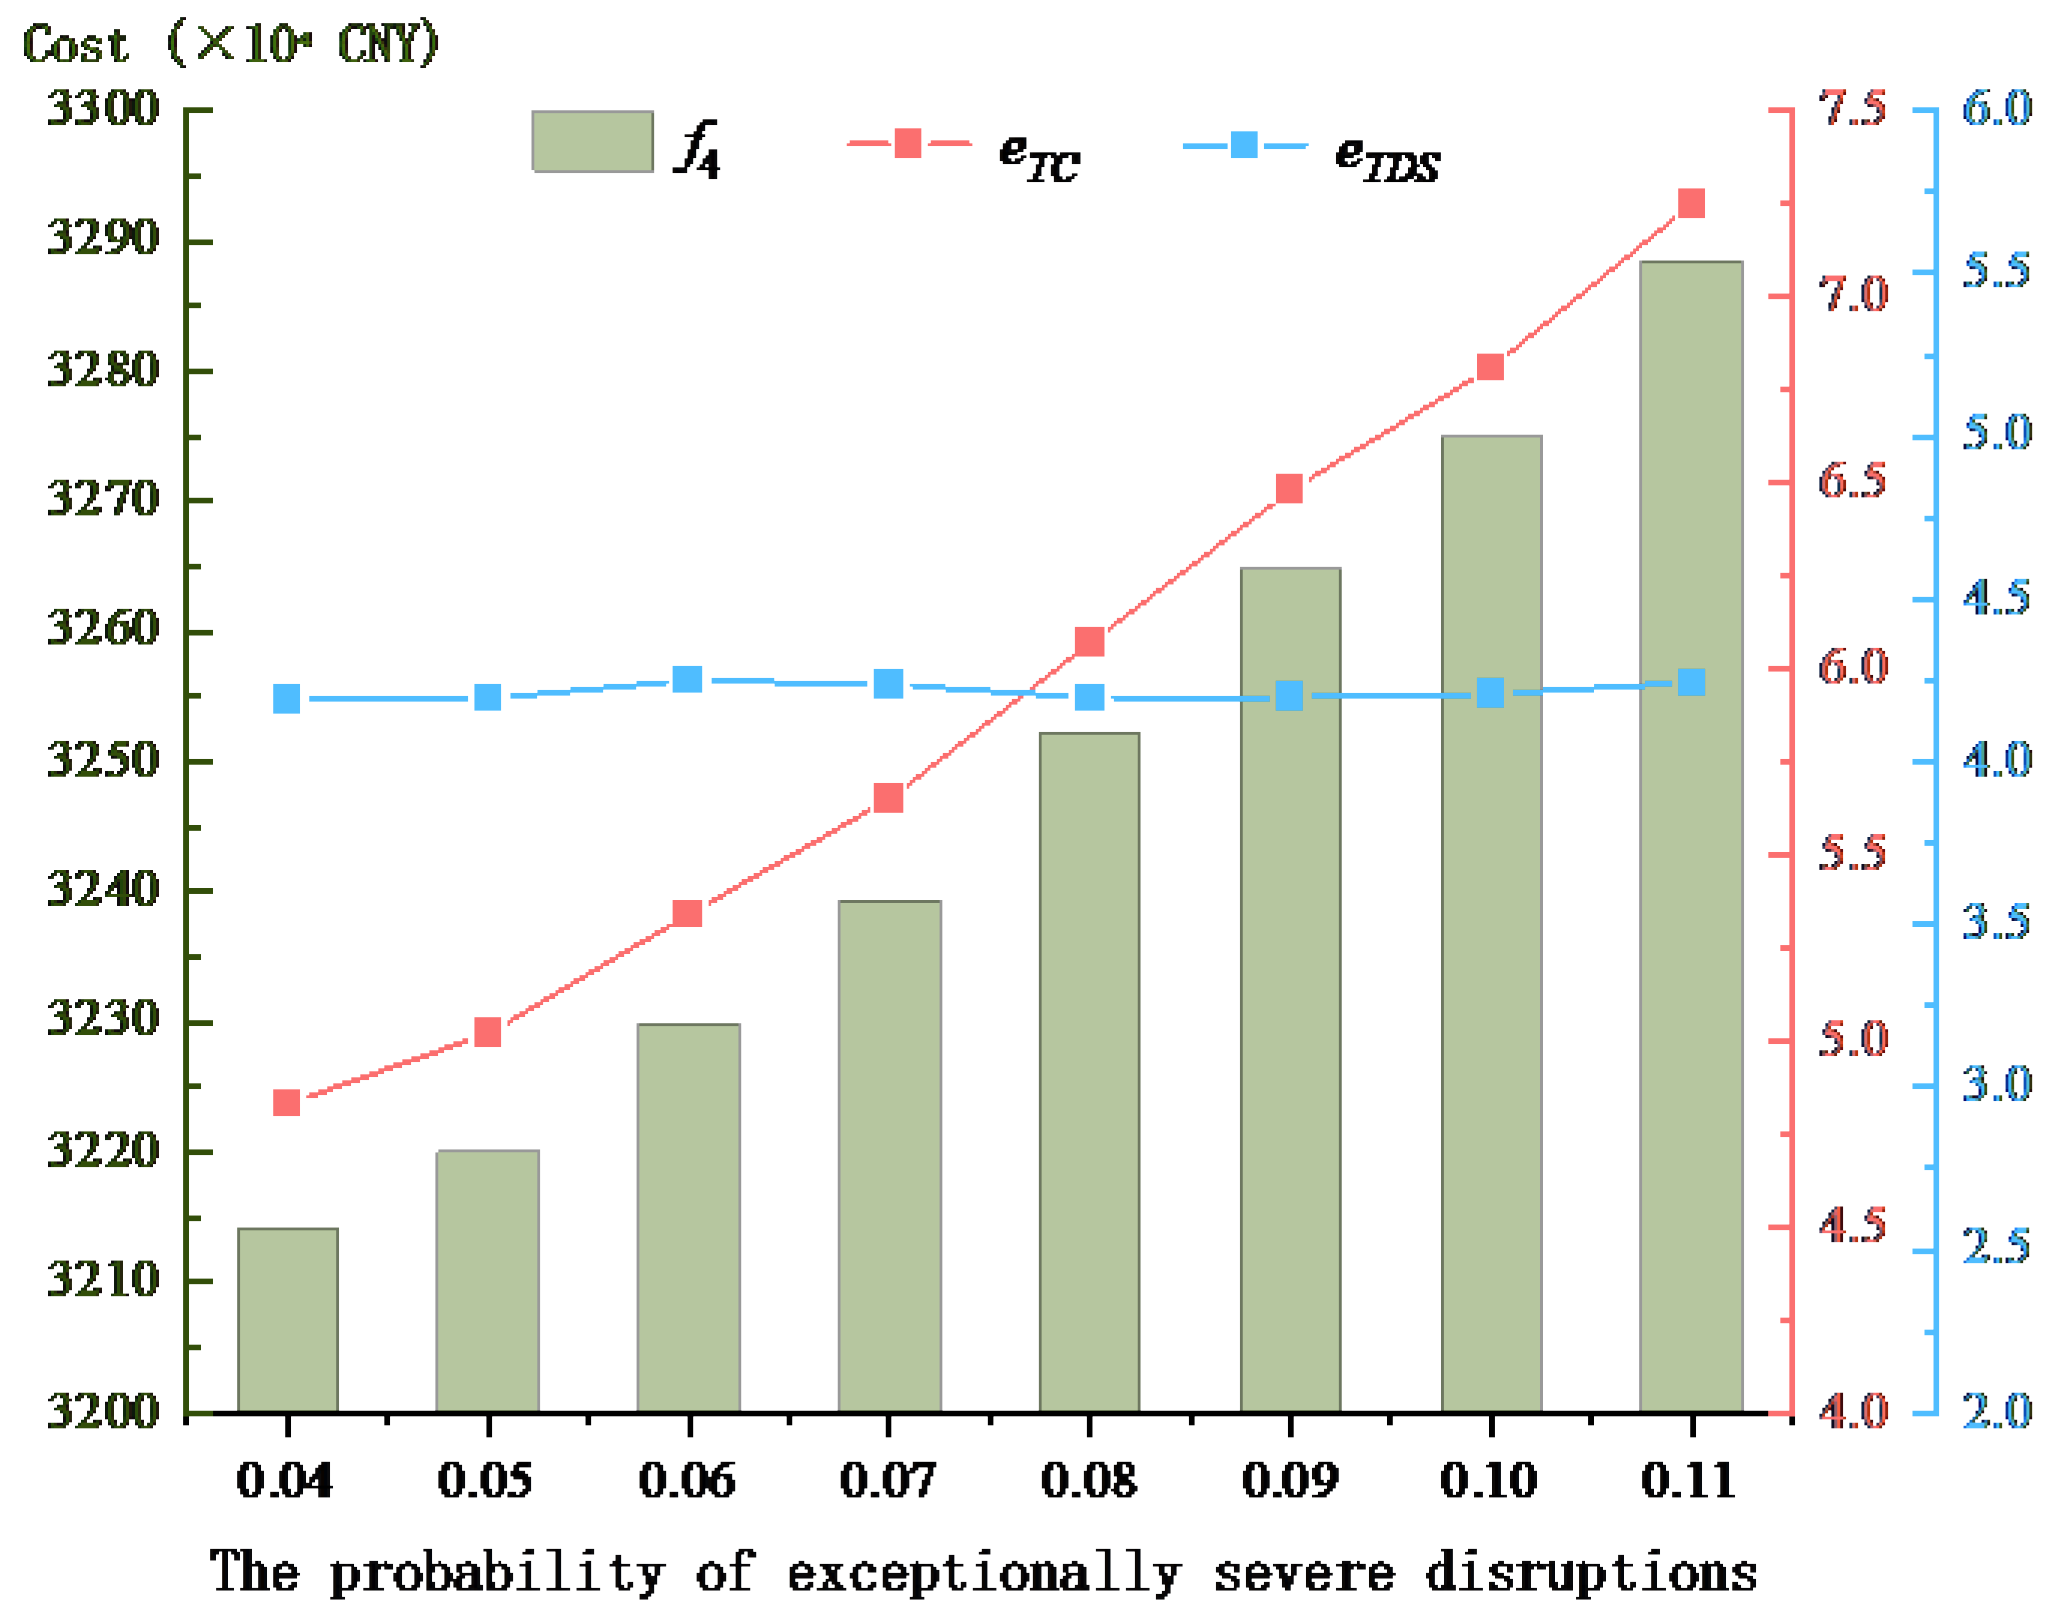
by systematically varying the probability of exceptionally severe disruptions from 0.04 to 0.11 in 0.01 increments, while correspondingly decreasing the probabilities of normal conditions and moderately severe disruptions by 0.005 each to maintain probability conservation, with all other parameters held constant as shown in
Figure 3.
Figure 3 reveals that
fluctuates within a narrow range of 0.06%, demonstrating relatively low sensitivity to probability variations, while both
and
exhibit a strong positive correlation with increasing disruption probabilities. This pattern indicates that higher probabilities of exceptionally severe disruptions directly lead to greater supply chain costs and more significant cost overrun rates, a finding that aligns perfectly with real-world operational scenarios.
(3) Impact of Demand Uncertainty on , and SS.
To investigate the impact of varying demand fluctuation levels on the proposed model, we conducted a systematic analysis by sampling
in the range [0, 1] with 0.1 increments. The study specifically examines how maximum demand deviations of 5%, 10%, 15%, and 20% from nominal values affect three critical performance indicators:
,
, and SS levels, as illustrated in
Figure 4.
The results demonstrate that as and demand variability increases, both and SS levels exhibit linear growth patterns, while maintains stable fluctuations around 95%. Although addressing demand fluctuations requires additional operational costs and significant safety stock investments, the proposed supply chain model effectively contains these increases within manageable thresholds—with growth not exceeding 15% and variations limited to under 6%. The results demonstrate that the proposed supply chain model can effectively handle demand uncertainty fluctuations.


