Article

Decision Optimization of Manufacturing Supply Chain Based on Resilience

School of Mechatronics Engineering, Henan University of Science and Technology, Luoyang 471003, China
*
Author to whom correspondence should be addressed.
Sustainability 2025, 17(14), 6519; https://doi.org/10.3390/su17146519
Submission received: 12 June 2025 / Revised: 12 July 2025 / Accepted: 14 July 2025 / Published: 16 July 2025
(This article belongs to the Special Issue Decision-Making in Sustainable Management)

Abstract

Manufacturing serves as a vital indicator of a nation’s economic strength, technological advancement, and comprehensive competitiveness. In the context of the VUCA (Volatility, Uncertainty, Complexity, Ambiguity) business environment and globalization, uncertain market demand has intensified supply chain disruption risks, necessitating resilience strategies to enhance supply chain stability. This study proposes five resilience strategies—establishing an information sharing system, multi-sourcing, alternative suppliers, safety stock, and alternative transportation plans—while integrating sustainability requirements. A multi-objective mixed-integer optimization model was developed to balance cost efficiency, resilience, and environmental sustainability. Comparative analysis reveals that the resilience-embedded model outperforms traditional approaches in both cost control and risk mitigation capabilities. The impact of parameter variations on the model results was examined through sensitivity analysis. The findings demonstrate that the proposed optimization model effectively enhances supply chain resilience—mitigating cost fluctuations while maintaining robust demand fulfillment under uncertainties.

1. Introduction

Manufacturing, as a pillar industry of the national economy, plays a critical role in maintaining the healthy development of the entire economic system, with the stability and resilience of its supply chains being of paramount importance. However, in the context of an increasingly complex global economy and heightened uncertainties, manufacturing supply chains face numerous challenges [1]. Sudden health incidents, geopolitical conflicts, and natural disasters have further exacerbated the complexity and vulnerability of supply chains [2]. Traditional non-resilient supply chains, characterized by single sourcing and a lack of diversity and flexibility in their structures [3], make manufacturing industries highly vulnerable to external shocks, leading to supply–demand imbalances and production disruptions. For instance, General Motors suspended production in 2015 due to raw material shortages from Japanese suppliers (The Huffington Post), Nissan faced ¥26.1 billion in quarterly losses from Wuhan supply hub disruptions in early 2020, the 2021 semiconductor shortage caused over 1.7 million units of global production cuts during demand recovery, while recent rare earth material shortages have forced multiple automakers to modify electric vehicle production plans. These cases demonstrate that the manufacturing supply chain faces three critical challenges: overdependence on single sourcing coupled with demand–supply imbalances triggered by market volatility; external disruption risks stemming from natural disasters and geopolitical conflicts; and information asymmetry and coordination failures across upstream and downstream operations.
Supply chain resilience is an effective strategy for addressing disruption risks [4]. The introduction of the resilience concept is specifically designed to systematically address these challenges. Through the pioneering efforts of Christopher and Peck [5], the concept of “resilience” first emerged in supply chain management research. Sheffi and Rice [6] defined supply chain resilience as “the ability of a supply chain to absorb the impact of a disruption and recover promptly.” Since then, scholars have developed a deeper and more comprehensive understanding of supply chain resilience. Hohenstein et al. [7] further defined it as “the ability of a supply chain to prepare for unexpected risk events, rapidly respond to and recover from potential disruptions, either returning to its original state or evolving into a new, more desirable state to enhance customer service, market share and financial performance.” The definition proposed by Hohenstein et al. is congruent with our study’s conceptual framework of resilience. The definition demonstrates that supply chain resilience plays a critical role in maintaining stable operational performance for enterprises during disruption events [8]. Enhancing the resilience of manufacturing supply chains to better withstand various risks has become a shared focus of both academia and industry [9].
Against the backdrop of increasing global resource scarcity, there has been considerable academic interest in supply chain resilience [10]. Han et al. [11] summarized 11 resilience-influencing factors across three dimensions as follows: preparedness, response, and recovery. Vimal et al. [12] identified 13 factors including procurement priority conflicts and lack of transparency and trust. Nabil et al. [13] identified 36 key factors including assessing the impact of key suppliers, which were categorized as supply chain adaptability, efficiency, and evolution. In order to enhance supply chain resilience, Liu et al. [14] constructed a multi-layer institutional collaboration network, employing link prediction to identify suitable and reliable partners. Luo et al. [15] employed a quality function deployment framework to analyze the resilience of large passenger aircraft supply chains, constructing an optimization model of the resilience strategy considering the stochastic disturbance faced by supply chains. Sawik [16] proposed a novel scenario-based stochastic mixed-integer programming model to optimize cost and service performance in multi-echelon supply chains facing pandemic-related disruptions. Liu S. et al. [17] found that supply chain platforms facilitate knowledge sharing, and the sharing economy [18] enhances supply chain performance. Wang et al. [19] constructed a resilient supply chain optimization model incorporating manufacturers’ raw material mitigation inventory, preferences for temporary distribution center locations and product design changes to maximize expected profits. Xu et al. [20] adopted an adaptive fuzzy double-feedback adjustment control structure to optimize the two-stage container logistics supply chain system, and to enhance the response and resilience performance. Gholizadeh et al. [21] integrated a simulation-optimization approach with response surface methodology to determine optimal resource capacities and batch sizes, enhancing system reconfigurability, resilience, and responsiveness to market shifts. Gabellini et al. [22] integrates machine learning-based predictions of supplier delivery delays into a linear programming model for a multi-period supplier selection and order allocation, effectively reducing prediction errors and total costs.
This study proposes the following five strategies to enhance supply chain resilience: information sharing system (IS), multi-sourcing (MP), alternative suppliers (AS), safety stock (SS), and alternative transportation plans (AT). Furthermore, in the dual context of peak carbon dioxide emissions and carbon neutrality, this study holistically considers carbon emissions across all supply chain stages, integrating economic benefits with environmental objectives [23]. We develop a multi-objective mixed-integer optimization model that holistically balances cost efficiency, resilience levels, and environmental sustainability. Multi-objective decision-making methods serve as an effective tool for addressing uncertainty [24], providing a scientific foundation for resilience-oriented decision optimization in manufacturing supply chains. The main contributions of this study are as follows:
(1)
Construction of a multi-objective optimization model that simultaneously quantifies and integrates five resilience strategies.
(2)
Development of an integrated analytical framework that combines resilience strategy evaluation with carbon footprint assessment, enabling concurrent optimization of both supply chain operational stability and ecological impact mitigation.
This paper is organized as follows: Section 2 introduces five resilience-enhancing strategies and develops a multi-objective mixed-integer programming model, which is then processed through robust optimization and normalization techniques to formulate the final objective function. Section 3 presents empirical case evaluations of the model, utilizing comparative approaches and sensitivity analyses to provide comprehensive insights into the results. The concluding section (Section 4) summarizes key findings while addressing research limitations and suggesting promising avenues for future work.

2. Materials and Methods

2.1. Problem Description

The manufacturing supply chain studied in this paper consists of a three-tier supply network comprising multiple suppliers, manufacturers, and demand markets. Suppliers produce and provide critical components to manufacturers, who then manufacture products and distribute them to demand markets. The demand markets receive the products while simultaneously generating corresponding order data.
Addressing the problem of unpredictable demand fluctuations, this study employs a robust optimization approach to mitigate supply chain uncertainties [25]. To effectively mitigate risks from unexpected disruptions while maintaining supply chain stability and demand fulfillment rates under diverse scenarios, this study proposes the following resilience enhancement strategies based on a synthesis of influential academic research on supply chain resilience determinants:
(1)
Improved Supply Chain Visibility
Enhancing visibility enables enterprises to integrate real-time data flows, mitigating potential risks arising from information asymmetry. Concurrently, it facilitates the establishment of more effective risk early-warning mechanisms and strengthens emergency response capabilities.
(2)
Supply Network Diversification
Network diversification reduces the systemic impact of single-node failures, thereby improving crisis resilience across the supply network. This approach ensures reliable access to raw materials and critical components.
(3)
Proactive Risk Prevention and Redundancy Optimization
Strengthening preventive risk controls through strategic redundancy serves as a buffer against demand volatility and other uncertainties, representing a proactive approach to disruption mitigation.
(4)
Transportation Disruption Preparedness
As a prevalent disruption vector, transportation failures caused by external shocks (e.g., natural disasters) may trigger logistics abnormalities or complete halts, ultimately compromising operational efficiency and customer satisfaction.
Based on these principles, we formally propose five actionable supply chain recovery strategies to address the challenges and risks threatening supply chain stability. Notably, the implementation of these strategies incurs associated costs.
(1)
Information Sharing System: An integrated real-time data network connects upstream and downstream supply chain partners, enabling dynamic risk monitoring and proactive disruption prediction. This strategy is applicable to manufacturers, suppliers, and demand markets. Supply chain visibility is typically driven by the core enterprise.
(2)
Multi-Sourcing: Supplier diversification reduces manufacturers’ reliance on individual suppliers, mitigates ripple effects of supplier disruptions, and ensures uninterrupted component supply. This strategy is applicable to manufacturers and demand markets, because procurement authority typically resides with downstream decision-makers.
(3)
Alternative Suppliers: Pre-qualified alternative suppliers (with zero probability of disruption) are contracted to provide emergency component allocations when primary suppliers fail. This strategy is applicable to manufacturers, who employ this strategy to prepare for potential risks in advance and ensure production capacity stability.
(4)
Safety Stock: Manufacturers maintain buffer inventories of critical components to absorb supply disruptions. This strategy is applicable to manufacturers, who bear most inventory costs.
(5)
Alternative Transportation Plans: Pre-arranged emergency logistics protocols (with limited but guaranteed capacity) restore partial supply chain flows during transportation failures. This strategy is applicable to both suppliers and manufacturers, with upstream enterprises responsible for product delivery.

2.2. Fundamental Assumptions

(1)
All components are critical parts, while other materials remain sufficiently available.
(2)
Suppliers are mutually independent with uniform procurement pricing.
(3)
Manufacturers produce and supply only a single product type.
(4)
The fixed transportation cost increment when implementing alternative transportation plans is identical for both suppliers and manufacturers.
(5)
The capacity reduction ratio during disruptions is equivalent for suppliers and manufacturers.
(6)
Carbon emissions are emitted across all stages of component and product manufacturing and transportation.
(7)
The model considers a single order cycle.

2.3. Model Formulation

2.3.1. Notation Description

The model formulation employs mathematical notations whose definitions are organized as follows: Table 1 details all sets and parameters, whereas Table 2 provides the complete description of decision variables.

2.3.2. Model Formula

This study develops a multi-objective mixed-integer optimization model that holistically balances cost efficiency, resilience level, and environmental sustainability. The total supply chain cost comprises two components: normal operational decision costs and resilience enhancement strategy costs, as presented in Equation (1). The resilience level of the supply chain is measured by the total demand fulfillment rate, as presented in Equation (2). To achieve green and sustainable development, this study quantifies the supply chain’s environmental impact through two key carbon emission dimensions: production and processing activities and inter-facility transportation. Carbon emissions generated during product storage are not considered in this study, as detailed in Equation (3).
min f 1 = w S P w i L , m M I S x i 1 + x i 2 + y m + i L 1 P S C x i 1 + i L 2 A S C S c i μ x i 2 + i L , m M S p i T Q i m w + m M M p m M Q m w y m + m M M I S m I U m w + m M M I H m I R m w + i L θ i A T C x i 1 + x i 2 + m M θ m A T C y m + i L u w , m M F i m d i m T P i m T Q i m w + m M u w , j J F m j d m j T P m j T Q m j w + i L d w , m M 1 i w + i w 1 + β d i m T P i m T Q i m w + m M d w , j J 1 m w + m w 1 + β d m j T P m j T Q m j w + m M , j J L P m U j w
max f 2 = m M , j J , w S T Q m j w D ˜ j w
min f 3 = w S P w i L C i S Q i w + m M C m M Q m w + i L , m M T i m d i m T Q i m w + m M , j J T m J d m J T Q m J w

2.3.3. Constraints

Constraints (4) and (5) impose multi-sourcing procurement policies; each manufacturer must procure from at least two suppliers (Equation (4)) and each demand market must receive products from at least two manufacturers (Equation (5)).
i L F i m 2 , m M
m M F m j 2 , j J
Constraint (6) prevents duplicate contracting with suppliers.
x i 1 + x i 2 1 , i L
Constraint (7) ensures that manufacturers can only procure components from contracted suppliers.
m M T Q i m w Z x i 1 + x i 2 , w S , i L
Constraints (8)–(11) limit component procurement quantities under different disruption scenarios.
M Q i m M T Q i m w S c i , w S , i L u 1 w
m M T Q i m w μ S c i , w S , i L u 2 w
m M T Q i m w 1 i w + i w τ θ i 1 ρ i w α S c i , w S , i L u 1 w
m M T Q i m w 1 i w + i w τ θ i 1 ρ i w α μ S c i , w S , i L u 2 w
Constraints (12)–(15) ensure that material flows exist only between facilities with established supply relationships.
F i m x i 1 + x i 2 , F i m y m , i L , m M
F m j y m , m M , j J
T Q i m w Z F i m , w S , i L , m M
T Q m j w Z F m j , w S , m M , j J
Constraints (16) and (17) require that each supplier or manufacturer must serve at least one downstream facility or market.
x i 1 + x i 2 m M F i m , i L
F i m j J F m j , i L , m M
Constraints (18) and (19) impose limits on safety stock levels and their utilization.
I min I m I max , m M
I U m w I m , w S , m M
Constraint (20) represents supplier production capacity limitations.
S Q i w S c i x i 1 + x i 2 , w S , i L
Constraint (21) governs supplier transportation volume constraints.
m M T Q i m w S Q i w , w S , i L
Constraint (20) represents manufacturer production capacity limitations.
M Q m w M c m y m , w S , m M
Constraint (21) governs manufacturer transportation volume constraints.
j J T Q m j w = I U m w + M Q m w , w S , m M
Constraints (24) and (25) are limits on total supply quantities.
m M , j J T Q m j w + U j w D ˜ j w , w S
m d f D ˜ j w m M , j J T Q m j w D ˜ j w , w S
Constraint (26) defines the domain of decision variables.
μ 0 , 1
Constraint (27) imposes binary (0–1) constraints on the associated decision variables.
x i 1 , x i 2 , y m , F i m , F m j , θ i , θ m 0 , 1 , i L , m M , j J
Constraint (28) ensures non-negativity for associated decision variables.
T Q i m w , T Q m j w , S Q i w , M Q m w , I m , I U m w , I R m w , U j w 0 , w S , i L , m M , j J

2.4. Model Processing

To address demand fluctuation uncertainty, the study employs the set-based robust optimization approach proposed by Bertsimas and Sim [26], assuming that the total demand D ˜ j w in the demand market serves as the baseline uncertainty set Ω, as presented in Equation (29).
Ω = D ˜ j w D ˜ j w D ¯ j w D ^ j w Γ j w , w S , j J
The parameters D ¯ j w and D ^ j w denote the nominal value of product demand and maximum deviation from the nominal value, respectively. The robustness budget parameter Γ j w ∈ [0, 1] governs the demand uncertainty level. Through Γ j w -adaptation, the model regulates admissible demand fluctuations and controls the robustness–conservatism trade-off. Γ j w = 0, the problem corresponds to deterministic demand. As Γ j w increases, the model enhances robustness against demand fluctuations and generates progressively more conservative solutions. Γ j w = 1, the solution is the most conservative. Consequently, Constraint (24) can be reformulated as constraint (30) to incorporate this robustness mechanism.
m M T Q m j w + U j w D ¯ j w + Γ j w D ^ j w , w S , j J
To reduce model complexity, the two objective functions are consolidated. Converting supply chain emissions into monetary terms using carbon tax pricing [27] and incorporating the environmental impact objective into the total cost minimization framework, as presented in Equation (31).
min f 4 = w S P w i L , m M I S x i 1 + x i 2 + y m + i L 1 P S C x i 1 + i L 2 A S C S c i μ x i 2 + i L , m M S p i T Q i m w + m M M p m M Q m w y m + m M M I S m I U m w + m M M I H m I R m w + i L θ i A T C x i 1 + x i 2 + m M θ m A T C y m + i L u w , m M F i m d i m T P i m T Q i m w + m M u w , j J F m j d m j T P m j T Q m j w + i L d w , m M 1 i w + i w 1 + β d i m T P i m T Q i m w + m M d w , j J 1 m w + m w 1 + β d m j T P m j T Q m j w + m M , j J L P m U j w + φ i L C i S Q i w + m M C m M Q m w + i L , m M T i m d i m T Q i m w + m M , j J T m j d m j T Q m j w
This study employs the weighted sum method to integrate the multi-objective functions f 2 , f 4 , with the following implementation [26].
Step 1: The min-max normalization method is used for the objective function.
e T C = f 4 L c L c × 100 %
e T D S = U R f 2 U R × 100 %
where L c is the lower bound of the total supply chain cost; U R is the upper bound of the total supply chain demand fulfillment rate, i.e., U R = 1. e T C is the cost overrun rate and e T D S is the unfulfillment demand rate.
Step 2: The normalized objective functions are weighted using coefficients ε .
min f = ε e T C + 1 ε e T D S
0 ε 1 , e T C 0 , 0 e T D S 1
The weights are determined by the relative priorities of different objective functions or the preferences of decision-makers. The composite objective function is given in Equation (34) and the corresponding parameter constraints are defined in Equation (35).

3. Case Study Analysis

3.1. Parameter Settings

The supply chain consists of four primary suppliers from five different regions, one alternative supplier, four manufacturers, and four demand markets. It is assumed that the probabilities of the supply chain experiencing normal conditions, moderately severe disruptions, and exceptionally severe disruptions are given by P w = (0.85, 0.11, 0.04), respectively. Under these three scenarios, the demand D ˜ j w in the demand markets follows uniform distributions of [6000, 7000], [5000, 6000], and [4000, 5000], respectively. The implementation cost for the information-sharing system was determined to be 200,000 CNY, based on empirical data collected from Enterprise G. The range of safety stock for manufacturers is [200, 1000]. Based on survey results and data from relevant literature, parameters in the case study are assigned values, with some parameters set using random values, as detailed in Table 3, Table 4, Table 5, Table 6 and Table 7. To cover a broader range of potential risks, the residual capacity range of suppliers and manufacturers after disruptions is set at [0, 0.8], where a residual capacity of 0 indicates an inability to supply materials and a residual capacity of 0.8 means the ability to supply materials at 80% of normal capacity.

3.2. Results Analysis

The model was solved using Python 3.8 integrated with the Gurobi 11.0.3 solver on a computer with a 2.5 GHz CPU and 16.0 GB of RAM. The computation yielded a lower bound for the total supply chain cost of 30,661,325.50 CNY, with a corresponding total demand fulfillment rate of 80.1%.
  • Comparison Between the Proposed Model and Traditional Models.
To evaluate the performance of the proposed model in handling supply chain disruptions, a comparative analysis was conducted against traditional models. The study examined variations in total cost and demand fulfillment rate under three scenarios: exceptionally severe disruptions, normal conditions, and an integrated scenario combining all three disruption levels. In the model, ε = 0.5 indicating an equal importance assigned to both expected total cost and demand fulfillment rate. Let N R = f 4 / f 2 , N R denote the total supply chain cost required to achieve a 100% demand fulfillment rate. The computational results are presented in Table 8.
Under exceptionally severe disruption scenarios, the traditional model achieves only a 63.42% total demand fulfillment rate, failing to meet the minimum requirement, whereas the proposed model attains a significantly higher rate of 95.14%. To achieve a 100% demand fulfillment rate, the traditional model requires an additional cost of 62.18%, which is 56.60% higher than the cost increase needed for the proposed model. These results demonstrate that traditional models struggle to effectively mitigate risks under major disruptions, and the substantial cost escalation poses a critical barrier to sustainable corporate operations.
Under normal conditions, the proposed model incurs a 22.5% higher total cost compared to the traditional model, while improving the demand fulfillment rate by only 4.95%. However, in the traditional model, manufacturers rely solely on a single supplier for components, with no alternative suppliers or safety stock reserves. When disruptions occur, information asymmetry [28] and market complexity make it extremely difficult for manufacturers to quickly identify alternative suppliers that meet production requirements. Consequently, restoring normal supply chain operations would entail significantly higher costs than the baseline 22,946,936.15 CNY and the total demand fulfillment rate may fail to meet minimum requirements.
Under combining all three scenarios, the traditional model demonstrates only a 1.58% reduction in cost overrun rate compared to the proposed model, while exhibiting a 15.43% lower total demand fulfillment rate. To achieve 100% demand fulfillment rate, the traditional model requires a 23.80% increase in total cost, whereas the proposed model necessitates only a 4.66% cost increment. Further comparison is made between normal conditions and combining all three scenarios. The proposed model achieves a 10.66% improvement in demand fulfillment rate with a 14.31% increase in total cost. The traditional model yields a mere 0.18% demand fulfillment rate improvement despite a substantial 37.96% cost escalation.
The analysis demonstrates that while the proposed model incurs higher initial costs, it exhibits superior performance in both overall cost control and risk resilience. Particularly under extreme disruption scenarios, the model significantly mitigates adverse impacts, demonstrating strong economic viability and competitive advantage for sustainable supply chain management.
2.
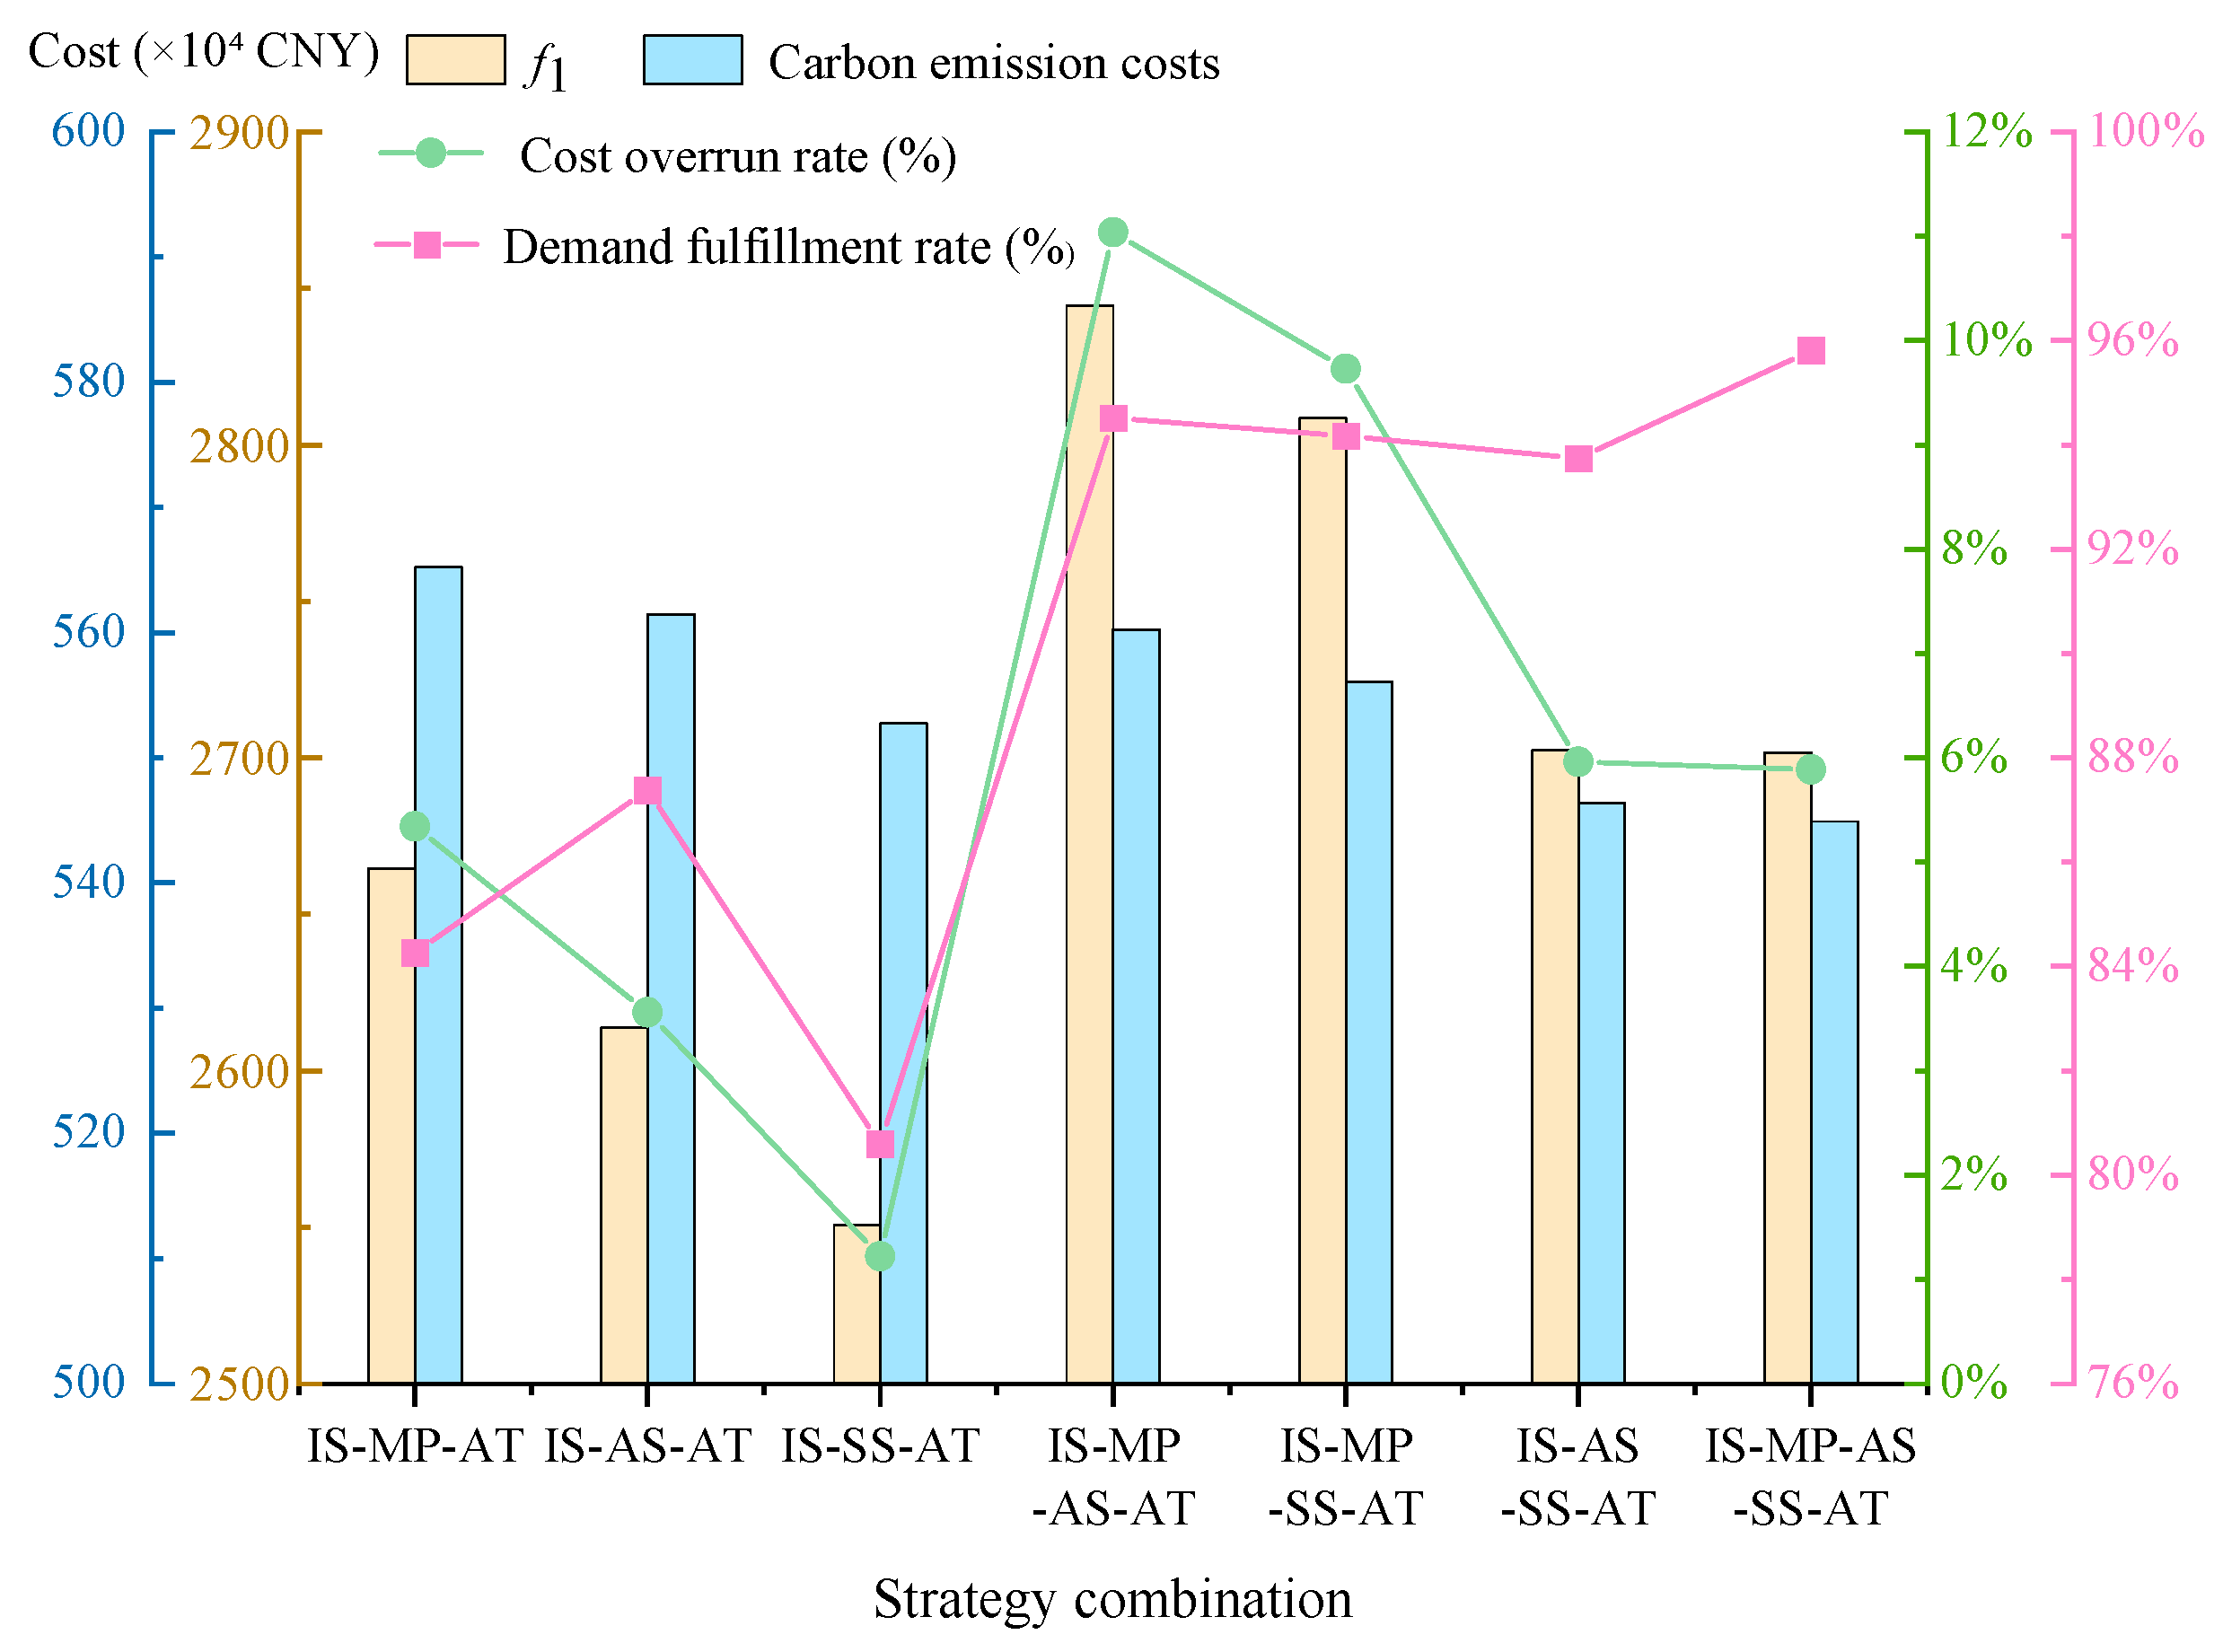
Comparative Analysis of Individual and Combined Strategy Implementation.
The information sharing system and alternative transportation plans primarily address information coordination and transportation disruptions, while multi-sourcing, alternative suppliers and safety stock optimize resource allocation to achieve optimal performance. To assist decision-makers in better understanding the effectiveness of these strategies, we examine variations in total supply chain costs and demand fulfillment rates when these three resilience enhancement strategies are implemented individually or in combination. With ε = 0.5, the comparative results of strategy implementation are presented in Figure 1.
Among the single-strategy approaches, the multi-sourcing strategy demonstrates a 5.34% cost overrun rate (higher than the 3.56% of the alternative supplier strategy) while achieving an 84.26% demand fulfillment rate (lower than the 87.39% of the alternative supplier strategy). In contrast, the safety stock strategy exhibits the lowest cost overrun rate (1.22%) with an 80.6% demand fulfillment rate that meets minimum requirements, representing the most cost-effective solution for maintaining stable supply chain operations. Notably, the safety stock strategy also generates the lowest carbon emission costs, contributing to sustainable supply chain development and aligning with current environmental trends. Under normal conditions or temporary disruptions, the safety stock strategy proves optimal. However, when preparing for severe or catastrophic disruptions, the alternative supplier strategy becomes the preferred approach. Although this entails higher costs, safety stock alone cannot fully mitigate major disruptions. The alternative supplier strategy ensures production stability under such circumstances while achieving higher total demand fulfillment rates compared to multi-sourcing strategies.
In practice, a multi-sourcing strategy proves optimal for mitigating high-frequency, predictable risks by dynamically allocating orders to reduce reliance on any single supplier while leveraging supplier competition to drive down costs—particularly effective for enterprises operating in transparent supply markets with abundant alternatives. Conversely, an alternative supplier strategy demonstrates superior effectiveness against low-frequency, high-impact disruptions, offering rapid response capabilities and contractual flexibility. This approach is especially critical for industries with highly concentrated supply chains and prohibitive switching costs.
For dual-strategy combinations, the observed cost overrun rates were 11.04%, 9.73%, and 5.96%, with corresponding demand fulfillment rates of 94.52%, 94.17%, and 93.74%, respectively. While all dual-strategy combinations achieved comparable demand fulfillment performance, the alternative supplier plus safety stock combination have significantly lower cost overruns and the lowest carbon emission costs, the combination has optimal operational efficiency. The combined alternative supplier and safety stock strategy proves effective across all scenarios—from normal operations to catastrophic disruptions—while maintaining lower cost investments that benefit enterprise development. The full-strategy combination achieved lower total supply chain costs, higher demand fulfillment rates, and reduced carbon emissions. Therefore, the full-strategy implementation model demonstrates superior performance across all critical metrics.
Overall, while the full-strategy combination incurs higher total costs compared to individual strategies, it significantly improves the total demand fulfillment rate. More importantly, the full-strategy combination demonstrates stronger risk resilience and remains applicable across all scenarios.
3.
Sensitivity Analysis.
(1) Impact of Weight ε on f 4 , e T C and e T D S .
The weight ε reflects the decision-making preference between total supply chain cost and demand fulfillment rate. Holding other parameters constant, we examine the variation trends of f 4 , e T C , and e T D S as ε increases from 0 to 1 in 0.1 increments, as illustrated in Figure 2.
Figure 2 demonstrates that as the weight coefficient ε increases, e T C continuously decreases while e T D S continuously increases. When ε < 0.2, marginal e T D S reductions lead to the significant increase of f 4 , making values below this threshold inadvisable. Within the 0.2 ≤ ε ≤ 0.6 range, the f 4 and e T C reduction rate gradually attenuates while e T D S maintains stable growth at modest levels. Beyond ε > 0.6, e T D S increases significantly and tends to stabilize, while f 4 and e T C decrease slowly. Within the 0.4 ≤ ε ≤ 0.6 range, the model simultaneously maintains all metrics at competitively low levels, achieving an optimal balance between total supply chain cost and demand fulfillment rate. Therefore, the value of weight ε can be set according to the decision-making needs.
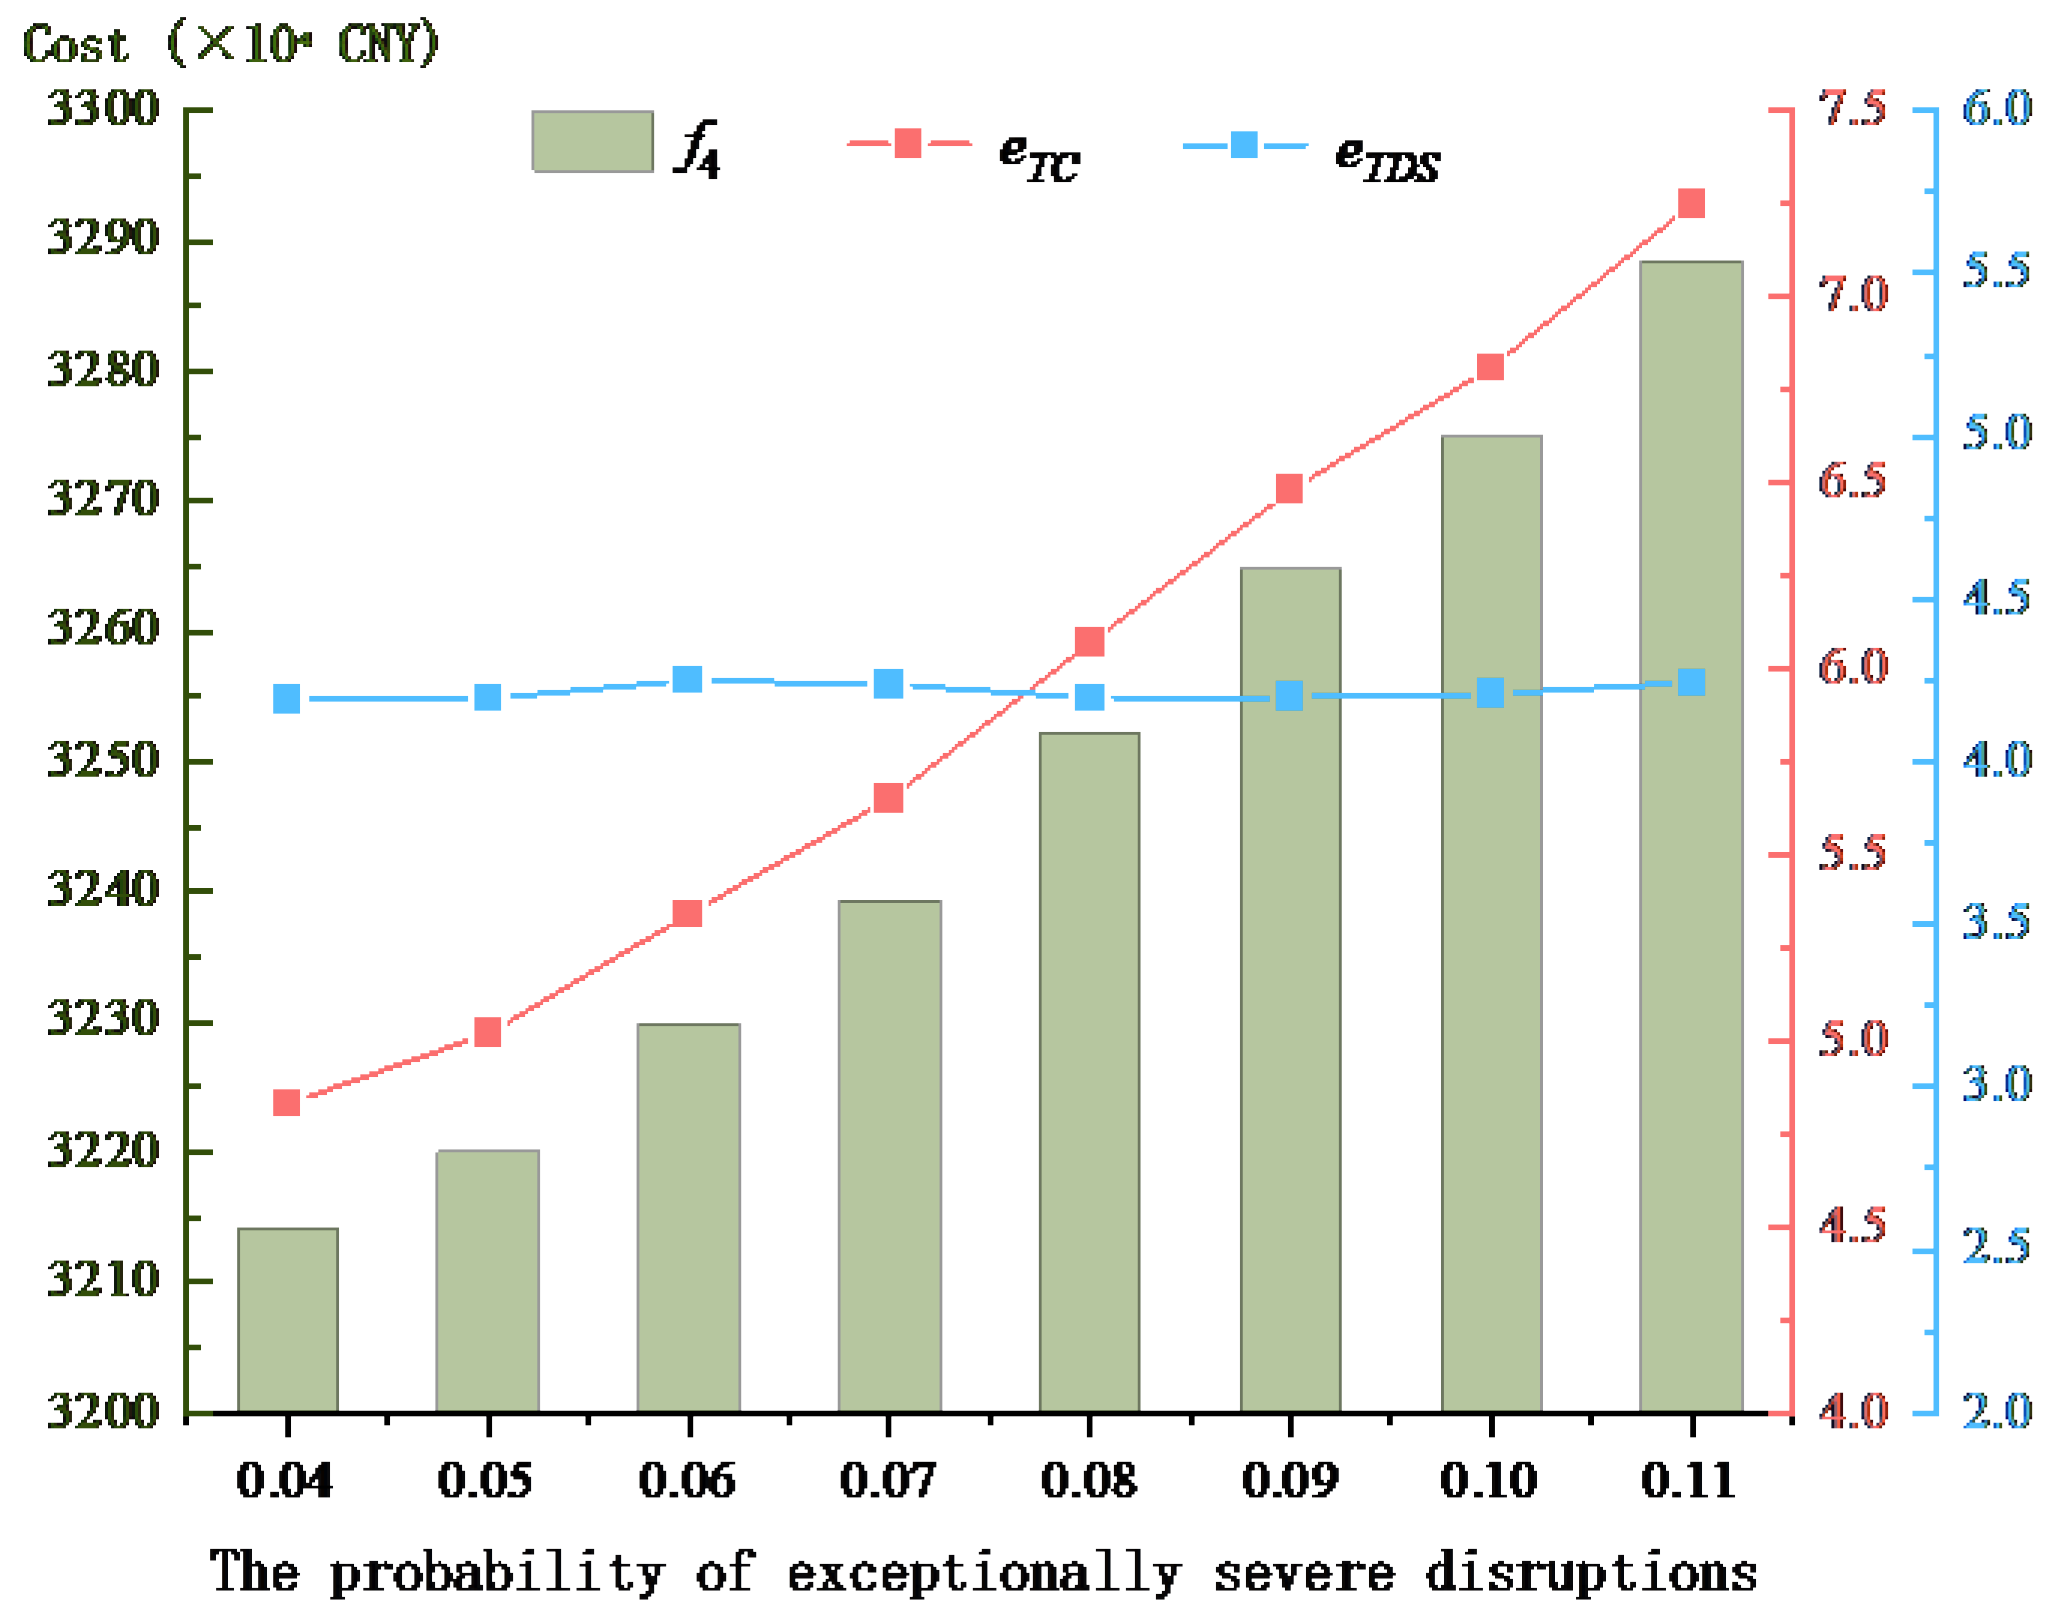
(2) Impact of Scenario Probabilities P w on f 4 , e T C and e T D S .
The study examines the impact of disruption probability scenarios on f 4 , e T C , and e T D S by systematically varying the probability of exceptionally severe disruptions from 0.04 to 0.11 in 0.01 increments, while correspondingly decreasing the probabilities of normal conditions and moderately severe disruptions by 0.005 each to maintain probability conservation, with all other parameters held constant as shown in Figure 3.
Figure 3 reveals that e T D S fluctuates within a narrow range of 0.06%, demonstrating relatively low sensitivity to probability variations, while both f 4 and e T C exhibit a strong positive correlation with increasing disruption probabilities. This pattern indicates that higher probabilities of exceptionally severe disruptions directly lead to greater supply chain costs and more significant cost overrun rates, a finding that aligns perfectly with real-world operational scenarios.
(3) Impact of Demand Uncertainty on f 4 , f 2 and SS.
To investigate the impact of varying demand fluctuation levels on the proposed model, we conducted a systematic analysis by sampling Γ j w in the range [0, 1] with 0.1 increments. The study specifically examines how maximum demand deviations of 5%, 10%, 15%, and 20% from nominal values affect three critical performance indicators: f 4 , f 2 , and SS levels, as illustrated in Figure 4.
The results demonstrate that as Γ j w and demand variability increases, both f 4 and SS levels exhibit linear growth patterns, while f 2 maintains stable fluctuations around 95%. Although addressing demand fluctuations requires additional operational costs and significant safety stock investments, the proposed supply chain model effectively contains these increases within manageable thresholds—with f 4 growth not exceeding 15% and f 2 variations limited to under 6%. The results demonstrate that the proposed supply chain model can effectively handle demand uncertainty fluctuations.

4. Conclusions

This study develops a multi-objective decision optimization model for manufacturing supply chains that balances cost efficiency, resilience, and environmental sustainability. A comparative analysis was conducted between the proposed model and traditional models, evaluating total costs and demand fulfillment rates under three scenarios: exceptionally severe disruptions, normal conditions, and combining all three scenarios. The results demonstrate that the proposed model significantly enhances supply chain stability, outperforming traditional models in both cost control and disruption resilience. Further analysis of individual versus combined resilience strategies revealed that the full strategy yields the highest overall benefits. While the safety stock-only strategy achieved the lowest total cost and maintained a demand fulfillment rate above the 80% benchmark, its effectiveness is inherently limited by finite storage capacity. Safety stock primarily serves as a short-term buffer and proves insufficient for mitigating severe disruptions, necessitating complementary resilience measures for robust risk management. This study underscores the critical role of multi-strategy integration in optimizing supply chain sustainability, ensuring both economic efficiency and operational reliability under varying disruption intensities.
The sensitivity analysis reveals that the proposed optimization model achieves optimal performance in both total supply chain cost and demand fulfillment rate when the weights of multiple objectives remain undefined. With the increasing probability of severe disruptions, total costs rise while demand fulfillment exhibits minimal fluctuations (within 0.06%), demonstrating strong operational stability. Furthermore, when the robustness control parameter varies within the range of [0, 1], the model maintains cost fluctuations within 15% and demand variations below 6%, underscoring its resilience against uncertainty. These findings indicate that the proposed model effectively enhances supply chain elasticity, mitigating cost volatility while ensuring stable demand satisfaction even under highly uncertain conditions. This study provides valuable decision-making insights for manufacturing managers, facilitating the adoption of resilient and cost-effective supply chain strategies in dynamic operating environments.
The key assumptions of this study, while helping to focus on core issues, introduce several limitations. Homogeneity assumption obscures the heterogeneity of real-world supply chains, potentially undervaluing the benefits of differentiated management. Single-product single-period framework fails to capture multi-product synergies and dynamic cumulative effects. The fixed carbon tax price fails to reflect policy dynamics, leading the model to underestimate long-term costs and reduce firms’ strategic flexibility in responding to price fluctuations. Additionally, computational constraints emerge when the model’s complexity exceeds the memory capacity of the Gurobi solver, preventing exact solutions.
While this study has made notable progress in manufacturing supply chain resilience and decision optimization, the proposed model still has room for improvement. Future research could extend and deepen the work in the following directions:
(1)
Gradual Relaxation of Assumptions: enhance the model’s real-world applicability by hierarchically relaxing assumptions—first extending to multi-product scenarios, then incorporating dynamic pricing.
(2)
Dynamic Carbon Tax Integration: incorporation of warehouse emissions and dynamic carbon taxation to evaluate sustainability-driven decisions under real-time policy environments.
(3)
Recovery Time Integration: the integration of disruption recovery duration as a model constraint/optimization objective could substantially improve supply chain resilience in manufacturing systems while minimizing disruption-induced losses.
(4)
Endogenous Resilience Strategies: investigate how manufacturers’ inherent recovery capabilities influence managerial decision-making as a resilience-enhancing strategy.
(5)
Optimization Algorithm Enhancement: improve computational efficiency and solution accuracy by integrating more advanced optimization techniques.

Author Contributions

Conceptualization, F.L. (Feng Lyu); methodology, F.L. (Feng Lyu) and J.Z.; software, J.Z.; validation, F.L. (Feng Lyu), J.Z., F.L. (Fen Liu) and H.C.; formal analysis, J.Z.; investigation, J.Z.; data curation, F.L. (Feng Lyu), J.Z. and F.L. (Fen Liu); writing—original draft preparation, F.L. (Feng Lyu) and J.Z.; writing—review and editing, F.L. (Feng Lyu) and J.Z.; visualization, J.Z.; supervision, F.L. (Feng Lyu); project administration, F.L. (Feng Lyu); funding acquisition, F.L. (Feng Lyu). All authors have read and agreed to the published version of the manuscript.

Funding

This research was funded by “National Key Research and Development Program Projects of China, grant number 2020YFB1713500”.

Institutional Review Board Statement

Not applicable.

Informed Consent Statement

Not applicable.

Data Availability Statement

The data supporting the findings of this study are available within the manuscript.

Acknowledgments

The authors gratefully acknowledge the support of the Foundation Program and the helpful comments and suggestions of the reviewers, which improved the presentation.

Conflicts of Interest

The authors declare no conflicts of interest.

Abbreviations

The following abbreviations are used in this manuscript:
VUCAVolatility, Uncertainty, Complexity, Ambiguity
ISInformation Sharing System
MPMulti-Sourcing
ASAlternative Suppliers
SSSafety Stock
ATAlternative Transportation Plans

References

  1. Zhang, J.; Miao, X.M.; Shang, T.T. Impact mechanism of digital transformation on supply chain resilience. Fi-Nanc. Res. Lett. 2025, 76, 106993. [Google Scholar] [CrossRef]
  2. Katsaliaki, K.; Galetsi, P.; Kumar, S. Supply chain disruptions and resilience: A major review and future research agenda. Ann. Oper. Res. 2022, 319, 965–1002. [Google Scholar] [CrossRef] [PubMed]
  3. Sharma, S.K.; Routroy, S.; Singh, R.K.; Nag, U. Analysis of supply chain vulnerability factors in manufacturing enterprises: A fuzzy DEMATEL approach. Int. J. Logist-Res. Appl. 2022, 27, 814–841. [Google Scholar] [CrossRef]
  4. Gao, Y.; Leng, Y.B.; Shan, B.A. Control Supply Chain Risks in Digital Transformation: A New Way to Improve Supply Chain Resilience. J. Organ. End User Comput. JOEUC 2022, 34, 18. [Google Scholar] [CrossRef]
  5. Christopher, M.; Peck, H. Building the Resilient Supply Chain. Int. J. Logist. Manag. 2004, 15, 1–14. [Google Scholar] [CrossRef]
  6. Sheffi, Y.; Rice, J.J. A Supply Chain View of the Resilient Enterprise. Mit. Sloan Manag. Rev. 2005, 46, 41–48. [Google Scholar]
  7. Hohenstein, N.O.; Feisel, E.; Hartmann, E.; Giunipero, L. Research on the phenomenon of supply chain resilience: A systematic review and paths for further investigation. Int. J. Phys. Distr. Log. 2015, 45, 90–117. [Google Scholar] [CrossRef]
  8. Majd, O. The Impact of Supply Chain Integration via Mediator—Supply Chain Resilience—On Improvement in the Performance of Manufacturing Sectors. Int. Rev. Manag. Mark. 2025, 15, 157–170. [Google Scholar]
  9. Spieske, A.; Birkel, H. Improving supply chain resilience through industry 4.0: A systematic literature review under the impressions of the COVID-19 pandemic. Comput. Ind. Eng 2021, 158, 107452. [Google Scholar] [CrossRef] [PubMed]
  10. Tukamuhabwa, B.R.; Stevenson, M.; Busby, J.; Zorzini, M. Supply chain resilience: Definition, review and theoretical foundations for further study. Int. J. Prod. Res 2015, 53, 5592–5623. [Google Scholar] [CrossRef]
  11. Han, Y.; Chong, W.K.; Li, D. A systematic literature review of the capabilities and performance metrics of supply chain resilience. Int. J. Prod. Res 2020, 58, 4541–4566. [Google Scholar] [CrossRef]
  12. Vimal, K.E.K.; Kumar, A.; Sunil, S.M.; Suresh, G.; Sanjeev, N.; Kandasamy, J. Analysing the challenges in building resilient net zero carbon supply chains using Influential Network Relationship Mapping. J. Clean. Prod. 2022, 379, 134635. [Google Scholar] [CrossRef]
  13. Nabil, D.H.; Amin, M.A.; Baldacci, R. Enhancing resilience in transnational E-commerce supply chains: Critical factors, perspectives and strategic action plan. Heliyon 2024, 10, e31274. [Google Scholar] [CrossRef] [PubMed]
  14. Liu, Z.F.; Wang, Y.N.; Feng, J. Identifying supply chain R&D partners via multilayer institutional cooperation network and tailored link prediction. Comput. Ind. Eng. 2025, 201, 110887. [Google Scholar] [CrossRef]
  15. Luo, Y.; Zhu, J.J. Resilience Strategy Optimization for Large Aircraft Supply Chain Based on Probabilistic Language QFD. Int. J. Inf. Syst. Suppl. 2020, 13, 23–46. [Google Scholar] [CrossRef]
  16. Sawik, T. Stochastic optimization of supply chain resilience under ripple effect: A COVID-19 pandemic related study. Omega 2022, 109, 102596. [Google Scholar] [CrossRef]
  17. Liu, S.; Chen, Y.X.; Yang, D.; Chang, Z. How does knowledge sharing create business value in the supply chain platform ecosystem? Unveiling its mediating role in governance mechanisms. J. Knowl. Manag. 2025. [Google Scholar] [CrossRef]
  18. Cheng, Y.K.; Deng, X.T.; Li, Y.H.; Yan, X. Tight incentive analysis of Sybil attacks against the market equilibrium of resource exchange over general networks. Game Econ. Behav. 2024, 148, 566–610. [Google Scholar] [CrossRef]
  19. Wang, N.; Chen, J.Z.; Wang, H.F. Resilient Supply Chain Optimization Considering Alternative Supplier Selection and Temporary Distribution Center Location. Mathematics 2023, 11, 2227–7390. [Google Scholar] [CrossRef]
  20. Xu, B.W.; Liu, W.T.; Li, J.J.; Yang, Y.S.; Wen, F.R.; Song, H.T. Resilience Measurement and Dynamic Optimization of Container Logistics Supply Chain under Adverse Events. Comput. Ind. Eng 2023, 180, 109202. [Google Scholar] [CrossRef]
  21. Gholizadeh, H.; Pasha, A.; Hejazi, T.H.; Jahani, H. Reconfigurable and Resilient Closed-Loop Supply Chain Design: A Simulation–Optimization Approach. Glob. J. Flex. Syst. Manag. 2025, 26, 85–113. [Google Scholar] [CrossRef]
  22. Gabellini, M.; Mark, S.; Schoepf, S.; Brintrup, A.; Regattieri, A. A continuous training approach for risk informed supplier selection and order allocation. Prod. Manuf. Res. 2025, 13, 2447035. [Google Scholar] [CrossRef]
  23. Haseli, G.; Nazarian-Jashnabadi, J.; Shirazi, B.; Hajiaghaei-Keshteli, M.; Moslem, S. Sustainable strategies based on the social responsibility of the beverage industry companies for the circular supply chain. Eng. Appl. Artif. Intell. 2024, 133, 108253. [Google Scholar] [CrossRef]
  24. Haseli, G.; Torkayesh, A.E.; Hajiaghaei-Keshteli, M.; Venghaus, S. Sustainable resilient recycling partner selection for urban waste management: Consolidating perspectives of decision-makers and experts. Appl. Soft Comput. 2023, 137, 110120. [Google Scholar] [CrossRef]
  25. Zhu, J.P.; Huang, Y.; Lu, S.; Shen, M.Y.; Yuan, y. Incorporating local uncertainty management into distribution system planning: An adaptive robust optimization approach. Appl. Energ. 2024, 363, 123103. [Google Scholar] [CrossRef]
  26. Bertsimas, D.; Sim, M. The Price of Robustness. Oper Res. 2004, 52, 35–53. [Google Scholar] [CrossRef]
  27. Jauhari, W.A.; Ramadhany, S.C.N.; Rosyidi, C.N.; Mishra, U.; Hishamuddin, H. Pricing and green inventory decisions for a supply chain system with green investment and carbon tax regulation. J. Clean. Prod. 2023, 425, 138897. [Google Scholar] [CrossRef]
  28. Phillips, W.; Roehrich, J.K.; Kapletia, D. Responding to information asymmetry in crisis situations: Innovation in the time of the COVID-19 pandemic. Public Manag. Rev. 2021, 25, 175–198. [Google Scholar] [CrossRef]
Figure 1. The comparative results of strategy implementation.
Sustainability 17 06519 g001
Figure 2. Trends in f 4 , e T C , and e T D S with ε .
Sustainability 17 06519 g002
Figure 3. Trends in f 4 , e T C , and e T D S with P w .
Sustainability 17 06519 g003
Figure 4. Trends in f 4 , f 2 and SS with Γ j w and degree of demand deviation.
Sustainability 17 06519 g004
Table 1. Sets and parameters.
NotationDefinitionNotationDefinition
SScenario set, S = {1, 2, 3, …, w} d m j Transportation distance from manufacturer m to demand market j
LSupplier set, L = {1, 2, 3, …, i}, where L 1 denotes primary suppliers and L 2 denotes alternative suppliers T P m j Unit transportation cost of products from manufacturer m to demand market j
MManufacturer set, M = {1, 2, 3, …, m} i w 1 if supplier i experiences transportation disruption under scenario w, 0 otherwise
JDemand market set, J = {1, 2, 3, …, j} β Increased cost ratio when using alternative transportation plans
L u 1 w Set of primary suppliers without disruptions under scenario w m w 1 if manufacturer m experiences transportation disruption under scenario w, 0 otherwise
L u 2 w Set of alternative suppliers without disruptions under scenario w L P m Unit shortage cost of manufacturer m
L d 1 w Set of disrupted primary suppliers under scenario w D ˜ h w Total demand received by market j under scenario w
L d 2 w Set of disrupted alternative suppliers under scenario w C i Carbon emissions per unit of component manufacturing (kgCO2e/unit)
M u w Set of manufacturers without disruptions under scenario w C m Carbon emissions per unit of product manufacturing (kgCO2e/unit)
M d w Set of disrupted manufacturers under scenario w T i m carbon emission factor (kgCO2e/(kg·km)) for component transport from supplier i to manufacturer m
P w Probability of scenario w T m j carbon emission factor (kgCO2e/(kg·km)) for product transport from manufacturer m to demand market j
ISCost of establishing the information sharing systemZSufficiently large positive integer
PSCFixed contract cost with primary suppliers M Q i Minimum order quantity of supplier i
ASCAdditional per-unit ordering cost for alternative suppliers τ Capacity of alternative transportation plans
S c i Production capacity limit of supplier i p i w 1 if supplier i experiences production disruption under scenario w, 0 otherwise
S p i Unit purchasing price of components from supplier i α Capacity reduction ratio during disruptions
M p m Unit production cost of manufacturer m I min Minimum safety stock level
M I S m Unit inventory supply cost of manufacturer m I max Maximum safety stock level
M I H m Unit inventory storage cost of manufacturer m M c m Production capacity limit of manufacturer m
ATCFixed cost of activating alternative transportation plans φ Carbon tax price
d i m Transportation distance from supplier i to manufacturer mmdfMinimum demand fulfillment rate across the supply chain
T P i m Unit transportation cost from supplier i to manufacturer m
Table 2. Decision variables.
NotationDefinitionNotationDefinition
x i 1 1 if supplier i is selected as the primary supplier, 0 otherwise θ i 1 if supplier i has alternative transportation plans, 0 otherwise
x i 2 1 if supplier i is selected as the alternative supplier, 0 otherwise θ m 1 if manufacturer m has alternative transportation plans, 0 otherwise
y m 1 if manufacturer m is established, 0 otherwise F i m 1 if a supply relationship exists between supplier i and manufacturer m, 0 otherwise
μ Proportion of components procured from alternative supplier i F m j 1 if a supply relationship exists between manufacturer m and demand market j, 0 otherwise
T Q i m w Quantity of components transported from supplier i to manufacturer m under scenario w T Q m j w Quantity of products transported from manufacturer m to demand market j under scenario w
M Q m w Production quantity of manufacturer m under scenario w U j w Unfulfilled demand at market j under scenario w
I U m w Quantity of safety stock utilized by manufacturer m under scenario w S Q i w Production quantity of supplier i under scenario w
I R m w Remaining safety stock of manufacturer m under scenario w I m Safety stock level held by manufacturer m
Table 3. Supplier-related parameters.
SupplierContract Signing Cost (CNY)Additional Order Cost (CNY/Set)Minimum Order Quantity (Sets)Per-Unit Purchasing Price (CNY/Set)Production Carbon Emission (kg CO2e/Set)
1100,000-5002430
2120,000-5002330
3100,000-5002530
4120,000-5002330
5-5-3030
Table 4. Manufacturer-related parameters.
ManufacturerPer-Unit Production Cost (CNY)Per-Unit Inventory Cost (CNY)Safety Stock Replenishment Cost (CNY/Unit)Production Capacity Limit (Sets)Production Carbon Emission (kg CO2e/Set)
1175615[8000, 9000]65
2190713[7000, 8000] 65
3185715[6000, 7000]65
4200813[5000, 6000]65
Table 5. Transport distance from supplier to manufacturer.
SupplierDistance to Manufacturer ( d i m /km)
1234
120149111921612
29175843011006
31069280641868
445512089171193
511291573124372
Table 6. Transport distance from manufacturer to demand market.
ManufacturerDistance to Demand Market ( d m h /km)
1234
1217764983933
211881224970382
394589087270
4163341422611086
Table 7. Other parameter settings.
Parameter L P m m d f β τ α T P i m T P m j φ Γ j w
Setting5000.8[0.25, 0.35][0.35, 0.75][0, 0.8]0.51.2100[0, 1]
Table 8. Model comparison results.
Scenario ClassificationTotal Cost (CNY)Cost Overrun Rate (%)Demand Fulfillment Rate (%) N R (CNY)
Exceptionally severe disruptionsThe proposed model42,048,941.7237.1495.1444,395,272.67
The traditional model38,259,201.9624.7863.4262,048,773.65
Normal conditionsThe proposed model28,119,501.80−8.2985.1532,618,622.09
The traditional model22,946,936.15−25.1680.2027,765,792.74
Combining all three scenariosThe proposed model32,142,267.524.8395.8133,640,097.19
The traditional model31,658,570.433.2580.3839,193,310.22
Disclaimer/Publisher’s Note: The statements, opinions and data contained in all publications are solely those of the individual author(s) and contributor(s) and not of MDPI and/or the editor(s). MDPI and/or the editor(s) disclaim responsibility for any injury to people or property resulting from any ideas, methods, instructions or products referred to in the content.

