Article

Green Port Collection and Distribution System in Low-Carbon Development: Scenario-Based System Dynamics

1
Department of Transportation, Hebei University of Technology, Tianjin 300401, China
2
Sifang College, Shijiazhuang Tiedao University, Shijiazhuang 050000, China
*
Author to whom correspondence should be addressed.
Sustainability 2025, 17(14), 6516; https://doi.org/10.3390/su17146516
Submission received: 7 April 2025 / Revised: 19 June 2025 / Accepted: 11 July 2025 / Published: 16 July 2025

Abstract

This study aims to explore the factors and mechanisms influencing the low-carbon development of Green Port Collection and Distribution Systems (GPCDSs) and to identify effective pathways and policy approaches to promote such development. Given the limited prior research integrating low-carbon policies, energy structure, and transportation systems, this study combines these three dimensions into a unified analytical framework. A scenario-based system dynamics model of GPCDS low-carbon development is established, incorporating factors such as low-carbon policies, energy structure, and transportation structure. The control variable method is employed to examine system behavior under 13 scenarios. The results indicate that freight subsidy policies and the internalization of carbon emission costs make the most substantial contributions to low-carbon development in GPCDS, yielding CO2 emission reductions of 14.3% and 15.7%, respectively. Additionally, improvements in port railway infrastructure contribute to a 6.4% reduction in CO2 emissions. In contrast, carbon taxes and energy structure adjustments have relatively limited effects, likely due to the delayed responsiveness of fossil fuel-dependent transportation sectors to pricing signals and the inherent inertia in transitioning energy systems.

1. Introduction

China’s Green Port Collection and Distribution System (GPCDS) primarily relies on road transportation, contributing to traffic congestion, accidents, and substantial environmental pollution from diesel truck emissions. China is home to seven of the world’s ten largest container ports, whose rapid growth has led to significant increases in carbon emissions [1,2]. Green port development, officially initiated at Tianjin Port in 2007, focuses on implementing environmental protection measures and technological innovations [3]. This effort aims to mitigate ecological impacts, improve energy and resource efficiency, and promote the harmonious integration of ports with the surrounding ecosystem. Driven by globalization and growing trade volumes, containerized cargo throughput has surged, resulting in rising energy use and greenhouse gas emissions [4,5,6]. This underscores the urgency of adopting low-carbon practices for sustainable port development. Within the GPCDS, numerous controllable processes can be optimized to support low-carbon transitions. Given the complexity and diversity of influencing factors, a scenario-based analytical approach is needed to effectively assess real-world applications.
Previous studies have primarily focused on emissions from vessels and terminal yard operations, while emissions from port-related transportation remain underexplored. Reducing emissions in this domain through green port construction is considered an effective strategy [7,8]. Davarzani et al. emphasized that green port initiatives have become a strategic priority in global maritime governance, addressing port-related decarbonization challenges through systematic emission reduction protocols and climate resilience frameworks [9]. Wan et al. and Zhang et al. proposed measures such as infrastructure upgrades, modal shift strategies, and cleaner energy adoption to improve low-carbon performance [10,11]. Effective governance also requires comprehensive monitoring and sound policy frameworks [12,13]. Therefore, this study emphasizes the need to address emissions from port transportation activities within an integrated system framework.
The low-carbon performance of the GPCDS is jointly shaped by transportation structure, energy structure, and low-carbon policy instruments. Transportation structure directly affects modal choices and determines the carbon intensity of port-related logistics operations. Energy structure determines the type of fuels used in port collection and distribution processes. Cleaner energy sources are critical to reducing emissions from mobile sources. Low-carbon policy instruments influence behavioral and economic decisions of shippers and carriers, and thus shape the adoption of cleaner technologies or more sustainable transport modes. Therefore, this study develops a scenario-based system dynamics model to analyze the dynamic behavior of the GPCDS, integrating factors, such as transportation structure, energy structure, governance framework, and low-carbon policies. Using Shanghai’s Yangshan Port as a case study, the model evaluates system performance under 13 policy scenarios to identify key drivers, mechanisms, and effective strategies for promoting low-carbon development. To this end, the main contributions of this study are as follows: (1) it develops an integrated SD modeling framework that simultaneously incorporates transportation structure, energy structure, and policy instruments, extending beyond previous single-factor approaches; (2) it designs 13 practical policy scenarios aligned with national strategies to evaluate the effects of different interventions; (3) it provides comparative simulation results to assess the relative impacts of various measures, offering guidance for low-carbon policy optimization in port logistics.

2. Literature Review

2.1. Green Port Collection and Distribution System in Low-Carbon Development

The Green Port Collection and Distribution System (GPCDS) refers to the transportation network connecting ports with inland urban areas. It comprises key infrastructure and operational systems that enable the use of green technologies and low- or zero-carbon alternatives to conventional fuels [13,14]. Wang et al. identified major sources of emissions within the GPCDS, including docked vessels, cargo-handling machinery, and inland transportation modes such as trucks, trains, and barges [2]. As port activities expand, energy consumption and carbon emissions from collection and distribution operations have become pressing environmental concerns [15,16].
Efforts to optimize the energy structure focus on minimizing fossil fuel use and promoting cleaner alternatives such as liquefied natural gas (LNG) and electricity [17]. Moya et al. proposed replacing diesel-powered yard tractors with LNG-fueled vehicles as a means to reduce emissions [18]. Alamoush et al. demonstrated the benefits of transitioning port handling equipment to cleaner power sources and advanced technologies [19]. These interventions show the importance of energy structure optimization in advancing green port development.
In parallel with energy-related interventions, optimizing the transportation structure also plays a vital role in reducing port-related emissions. Currently, in the field of maritime cargo transportation, research on reducing carbon emissions by optimizing transportation structures primarily focuses on container ships during terminal operations. The vast demand for container transportation requires high-frequency scheduling of equipment such as cranes, inland trucks, and automated guided vehicles. By improving the performance of Rubber Tired Gantry (RTG) cranes and optimizing the scheduling of yard crane operations, significant improvements in terminal operational efficiency can be achieved, thereby reducing carbon emissions [20].
However, most existing research emphasizes terminal-level emissions, with limited attention to the inland collection and distribution segment, which can generate greater carbon emissions over long distances [21]. This study therefore adopts a system-level perspective to investigate the emission mechanisms of the full GPCDS, examining how energy and transport structures affect low-carbon transitions.

2.2. Influence Factors for a GPCDS Scenario-Based System Dynamics Model

In Chinese port logistics, inland container transport is still dominated by road, with rail accounting for less than 2% of port container evacuation [22,23]. From a sustainability perspective, rail is the most energy-efficient and least carbon-intensive mode per ton-kilometer, making the shift from road to rail a promising strategy for emission reduction [24,25]. To this end, the Nine Sectors’ Guiding Opinions on the Construction of World-Class Ports calls for full rail coverage in key port areas by 2035 and expanded rail–water intermodal transport [26]. A series of incentives provided by China are actively guiding the modal shift of port cargo from road to rail, in support of the national strategy for energy conservation and emission reduction.
In addition to modal shifts, adopting clean fuels is essential for enhancing both economic efficiency and environmental sustainability [27]. However, maritime transport still relies heavily on oil-based fuels, which power over 90% of global trade freight [28]. This continued reliance exacerbates environmental pressures and underscores the urgent need to accelerate the adoption of low-emission energy sources. In response, China’s Ministry of Transport has issued policies promoting LNG, aiming for it to exceed 10% of river–sea and inland vessel fuel use by 2025 [29]. LNG is widely regarded as a transitional low-carbon fuel, supported by growing investment in LNG vessels and bunkering infrastructure [30,31]. Electricity, especially from renewables, also offers potential. Notably, electricity is categorized as an indirect emission and is typically excluded from transport-related carbon accounting, further enhancing its attractiveness in low-carbon transition strategies. Collectively, the adoption of LNG-powered transport, the expansion of electrified rail infrastructure, and the reduction of diesel-based fuel usage represent essential components of China’s broader effort to decarbonize the GPCDS.
Simultaneously, market-based policy tools such as emissions trading schemes (ETSs) and carbon taxes (CTs) are increasingly deployed to promote emission reduction. China’s national ETS became fully operational in 2021, with pilot regions reporting significant cuts in energy consumption and carbon emissions [32,33]. As a complementary tool, carbon tax is widely regarded as an effective way to reduce carbon emissions [34,35]. Carbon taxes, by internalizing the social cost of emissions, encourage greener choices and are widely used in countries like Sweden, Canada, and the UK [36,37,38]. Carbon pricing policies complement carbon taxes by internalizing the social cost of emissions into transportation expenses, aligning operational costs with environmental impact to support low-carbon development [39]. In the GPCDS, such pricing can shift freight from high-emission road transport to rail [40,41]. In response, several provincial governments in China have introduced rail freight subsidies and infrastructure optimization policies to promote such transitions [42].
However, structural and operational barriers remain, notably limited rail connectivity and longer delivery times between ports and hinterland hubs. Moreover, rail transport often suffers from operational disadvantages, such as longer delivery times compared to road freight. Addressing these requires targeted investment and policy action to enhance the competitiveness and service reliability of rail-based transport.

2.3. Summary and Research Gap

Existing studies have made significant contributions to understanding carbon reduction strategies within the GPCDS, particularly by examining individual transportation modes and policy instruments. However, there remains a lack of comprehensive analysis on the dynamic interactions between multiple influencing factors—such as rail evacuation rates, carbon pricing mechanisms, and energy structure reforms—and their combined effects on the low-carbon development of GPCDS. To address this gap, this study develops a system dynamics (SD) model that integrates these key variables within a unified framework. By simulating 13 targeted policy scenarios, the model assesses the relative effectiveness of strategies such as freight subsidies and carbon cost internalization in reducing emissions and energy use in port logistics. The findings contribute to the literature by highlighting the importance of multi-lever coordination in policy design and offer practical guidance for stakeholders aiming to advance sustainable port development.

3. Methods

System dynamics (SD) is a system-based quantitative modeling approach designed to address complex, nonlinear, and dynamic problems involving time delays and multiple feedback loops. Drawing upon feedback control theory and simulation techniques, SD identifies the causal relationships among system components and simulates system behavior over time. It integrates both qualitative insights and quantitative data to evaluate long-term development trajectories. SD has been widely applied in port transportation studies. For instance, a scenario-based system dynamics approach was used to model governance in the Pearl River, investigating the impact of various investment structures on the development of its waterway system under two scenarios [43]. A cyclical system dynamics approach was applied to forecast container freight indexes and analyze market cycles [44]. Given that the GPCDS is a highly integrated and dynamic system involving economic, environmental, and infrastructural components, characterized by time-varying behavior, feedback loops, and nonlinearity, SD is particularly well-suited to model its low-carbon development. This method allows for a comprehensive analysis of system evolution, the identification of key influencing factors, and the evaluation of policy effects under different scenarios.
Accordingly, this study adopts the Shanghai Yangshan Port as a representative case to investigate the low-carbon transition of the GPCDS using a system dynamic modeling framework. The model simulation relies on data from multiple authoritative sources, including the Shanghai Municipal Bureau of Statistics, the Intergovernmental Panel on Climate Change (IPCC), and the National Bureau of Statistics of China. Primary data references include the Shanghai Statistical Yearbook, China Port Yearbook, China Energy Statistical Yearbook, General Rules for Calculating Comprehensive Energy Consumption, and the 95,306 official railway platform. These data sources provide the basis for variable selection, parameter estimation, model calibration, and scenario design.
Building on the collected data, a system dynamics model was developed to investigate the low-carbon development of the GPCDS. It considered four subsystems as the foundational framework and clearly defined appropriate model boundaries. Based on the relationships among the variables, 12 equations were established within the model, which comprises 102 variables in total. The study examined the correlation between the internal feedback structure and the system’s dynamic behavior, identifying key countermeasures for promoting low-carbon development.

3.1. System Dynamic Model

The system dynamics model was developed and simulated using Vensim DSS (version 8.2.1; Ventana Systems, Inc., Harvard, MA, USA), a dedicated modeling platform by Ventana Systems that supports stock–flow structures, delay functions, and built-in unit consistency checks. Simulations were performed on a Windows 10 workstation (Microsoft Corp., Redmond, WA, USA) equipped with an Intel Core i7 processor (3.6 GHz; Intel Corp., Santa Clara, CA, USA) and 16 GB RAM.

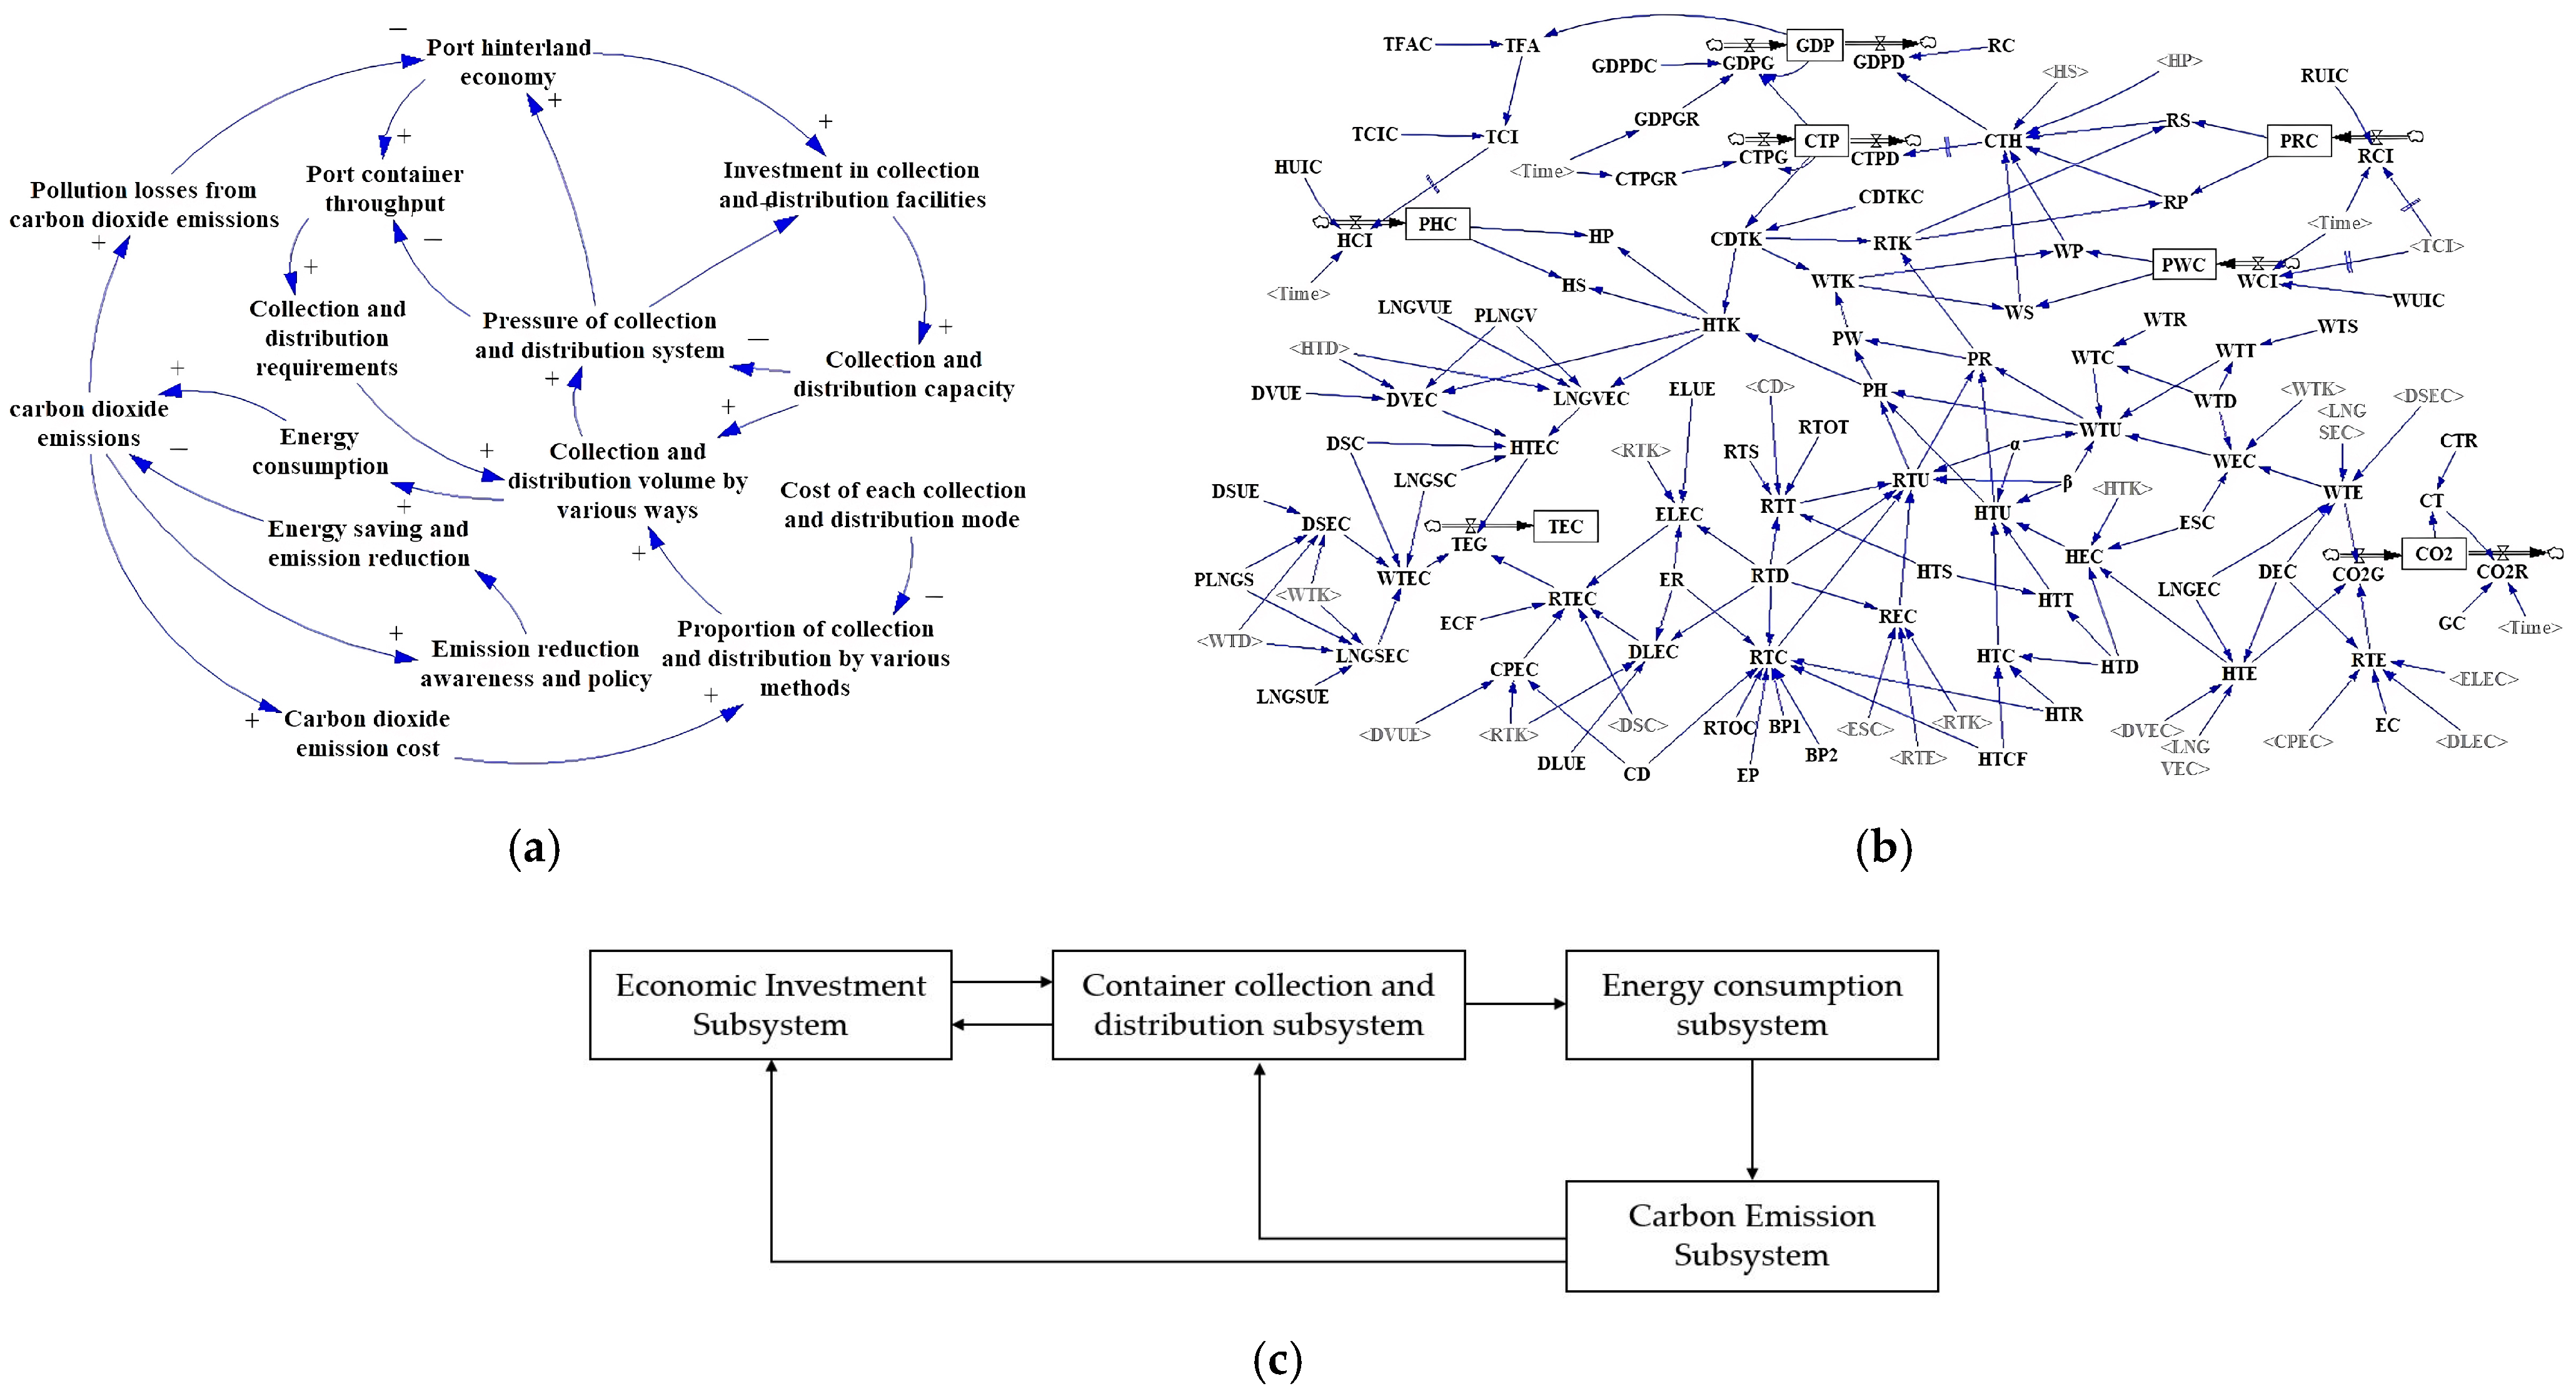
3.1.1. Causal Logic and Structural Representation of the GPCDS Model

A comprehensive analysis was conducted of key factors influencing the GPCDS, including economic development, infrastructure, technology, transport structure, energy use, low-carbon strategies, and policy governance. Based on this, the model’s system boundary centers on four areas most directly related to low-carbon development: economic input, transport structure, energy consumption, and carbon emissions. Accordingly, the GPCDS framework comprises four core subsystems—economic investment, containerized transport, energy consumption, and carbon emissions—which together form the model’s causal loop diagram. Figure 1a presents the primary feedback relationships in the causal loop diagram, where the arrowheads indicate causes, arrows signify effects, and positive and negative symbols indicate beneficial and adverse impacts, respectively [45]. It includes six main key feedback loops: (1) Economic–Environmental Negative Feedback: Economic growth drives throughput and emissions, which in turn harm the environment and constrain growth. (2) Economic–Logistics Positive Feedback: Economic development boosts logistics investment, enhancing capacity and further supporting growth. (3) Capacity Regulation Negative Feedback: Rising system pressure triggers infrastructure expansion, which relieves pressure. (4) Demand–Congestion Negative Feedback: Increased throughput strains the system; insufficient capacity then limits future throughput. (5) Emission Cost–Mode Shift Positive Feedback: Internalizing carbon costs shifts mode choices toward low-carbon options. (6) Policy–Emission Reduction Negative Feedback: Higher emissions prompt policy responses and behavioral change, reducing emissions. Model variables and auxiliary variables were identified based on the influencing factors of GPCDS low-carbon development, as derived from the system’s feedback structure. On this basis, a system flow diagram for the GPCDS was constructed to facilitate the quantitative analysis of low-carbon development at Shanghai Yangshan Port, as in Figure 1b. The explanatory table of variables included in Figure 1b is shown in Table A1 in Appendix A. Figure 1c illustrates the internal logic linking the four subsystems. Economic investment improves transport infrastructure, boosting the capacity of the container collection and distribution system. This drives economic growth and increases throughput, leading to higher energy consumption and, consequently, greater carbon emissions. The resulting environmental degradation and economic costs feed back negatively on both investment and transport, forming a closed-loop system.

3.1.2. Simulation Equations

This involves identifying the quantitative relationships among components within each subsystem and formulating the corresponding simulation equations. Due to space limitations, only the main equations are presented in this study.
(1)
Economic Investment Subsystem
In the economic investment subsystem, economic growth in the port’s hinterland cities plays a key role in promoting port operations, driving investment in GPCDS construction, and sustaining operational efficiency. This subsystem utilizes the hinterland city’s GDP, GDP growth (GDPG), and GDP dampener (GDPD) as variable rates. The simulation equation among these variables is formulated as follows:
G D P t = G D P t 1 + t 1 t ( G D P G t G D P D t ) d t G D P G t = G D P t 1 × G D P G R t + G D P D C t × C T P t G D P D t = C T H t × P C
The first row in Equation (1) is a state equation that represents the cumulative GDP of the hinterland region at time t. The GDP in year t is determined by the combined effects of GDPG and GDPD in the same year. The second and third rows are rate equations related to GDP. Specifically, the second row indicates that GDPG in year t is influenced by the GDP in year t − 1 and the GDP growth rate (GDPGR) at time t. The effect of port development on urban GDP, as well as the coefficient variable GDPGR, is defined using a lookup table function with respect to the time variable. The third row indicates that GDPD in year t is determined by container transport hindrance (CTH) and restraint considerations (RC).
(2)
Container Collection and Distribution Subsystem
The container collection and distribution subsystem constitutes the core of the system dynamics model and maintains feedback relationships with the other three subsystems. Its development can stimulate the economic growth of hinterland cities, while infrastructure construction within the subsystem is influenced by economic investment. To ensure efficient containerized transportation and high-quality service delivery, the development of the GPCDS must remain dynamically aligned with the evolving demand for collection and distribution.
This subsystem employs container throughput (CTP) as a state variable, with CTP growth (CTPG) and CTP dampening (CTPD) as rate variables, to represent and evaluate the performance of the container collection and distribution subsystem.
C T P t = C T P t 1 + t 1 t ( C T P G t C T P D t ) d t C T P G t = C T P t 1 × C T P G R C T P D t = D E L A Y 1 ( C T H t 1 , 1 )
This subsystem is used to forecast future port container throughput. Container volume is influenced by various factors, including national economic trends, policy planning, and the economic conditions of hinterland regions. Incorporating all of these elements into the model would result in an overly complex structure, making it difficult to ensure prediction accuracy. Therefore, the model adopts an exogenous forecasting approach based on projected container throughput, wherein the container throughput growth rate (CTPGR) is directly input into the model using a table function. The first row in Equation (2) represents the state equation, which reflects the change in container throughput at time t. The second row indicates that the increase in container throughput is determined by its growth rate. The third row shows that if a hindrance to container transportation exists in year t − 1, then container transport hindrance (CTH) exerts a suppressive effect on container throughput in year t.
(3)
Energy Consumption Subsystem
The energy consumption subsystem is closely linked to both the transportation and carbon emission subsystems. Energy consumption is primarily influenced by transport volume and the energy intensities of various transportation modes, which are determined by factors such as modal share, port transport capacity, and related operational conditions. Energy intensity, in turn, is shaped by the unit energy consumption of different transportation modes and vehicles, which depends on engine efficiency and the technical characteristics of the transport equipment. As a major driver of the system’s carbon emission profile, energy consumption plays an essential role in shaping overall system dynamics.
Transport energy consumption (TEC) serves as the primary state variable in this subsystem, while transport energy growth (TEG) functions as the rate variable, used to compute the overall energy consumption of the GPCDS.
T E C t = T E C t 1 + t 1 t ( T E C t 1 ) d t T E G t = S U M ( H T E C t ! ) + S U M ( W T E C t ! ) + S U M ( R T E C t ! )
The first row of Equation (3) represents the state equation, which defines the current value of transport energy consumption (TEC) in the collection system as the cumulative result over time. The second row is the corresponding rate equation, which determines transport energy growth (TEG) by summing the energy consumption from highway transport (HTEC), waterway transport (WTEC), and railway transport (RTEC).
(4)
Carbon Emission Subsystem
The carbon emission subsystem functions as both an outcome and a constraint module within the model, used to calculate and assess the emissions and emission reduction outcomes of the entire system. Although various pollutants are produced during the transportation process, this study focuses on carbon emissions, which are selected as the evaluation metric for the carbon emission subsystem. Indirect emissions arising from electricity consumption and production during rail-based container transportation are excluded, as the study primarily concentrates on direct carbon emissions generated during port-based container transportation.
This subsystem uses carbon dioxide emissions (CO2) as a state variable to represent the accumulation of CO2 in the system, CO2 growth (CO2G) and CO2 reductions (CO2R) as the rate variables of the subsystem, and the CT and CT rate (CTR) as auxiliary variables to study the GPCDS carbon emissions.
C O 2 t = C O 2 t 1 + t 1 t ( C O 2 G t 1 C O 2 R t 1 ) d t C O 2 G t = S U M ( H T E t ! ) + S U M ( W T E t ! ) + S U M ( R T E t ! ) C O 2 R t = D E L A Y 1 ( C T t 2 × G C , 2 ) C T t = C O 2 G t × C T R
In Equation (4), the first row is the state equation for carbon emissions, which represents the current value of the accumulation of CO2 in the GPCDS, i.e., the result obtained by adding up the changes with time t. The second row is the rate equation for carbon emissions, which represents the CO2G in the system, which is equal to the sum of highway transport emissions (HTEs), waterway transport emissions (WTEs), and railway transport emissions (RTEs). The third row is a rate equation for carbon emissions, representing CO2R, which captures the delayed effect of CTs on emission reduction using the DELAY1 function—indicating that CTs have a lagged impact on CO2 mitigation. The fourth row indicates that the CT is determined by the product of the CTR and CO2G.

3.1.3. Parameter Estimation

Model parameters were sourced from multiple authoritative references, including the China Statistical Yearbook, Shanghai Statistical Yearbook, China Energy Statistical Yearbook, the National Comprehensive Transportation Network Plan, and the IPCC Guidelines for National Greenhouse Gas Inventories. Additional data were drawn from academic literature and government planning documents. Where data were unavailable or inconsistent, values were estimated through expert judgment or calibrated using baseline simulations.
Table 1 provides a summary of some key parameters. (The unit Dmnl is the abbreviation for Dimensionless in system dynamics simulation software). It should be noted that certain data, such as transport distances, are specific to the Shanghai Yangshan Port case. Transportation costs and average speeds for different modes were obtained from official freight rate schedules and related government documents.

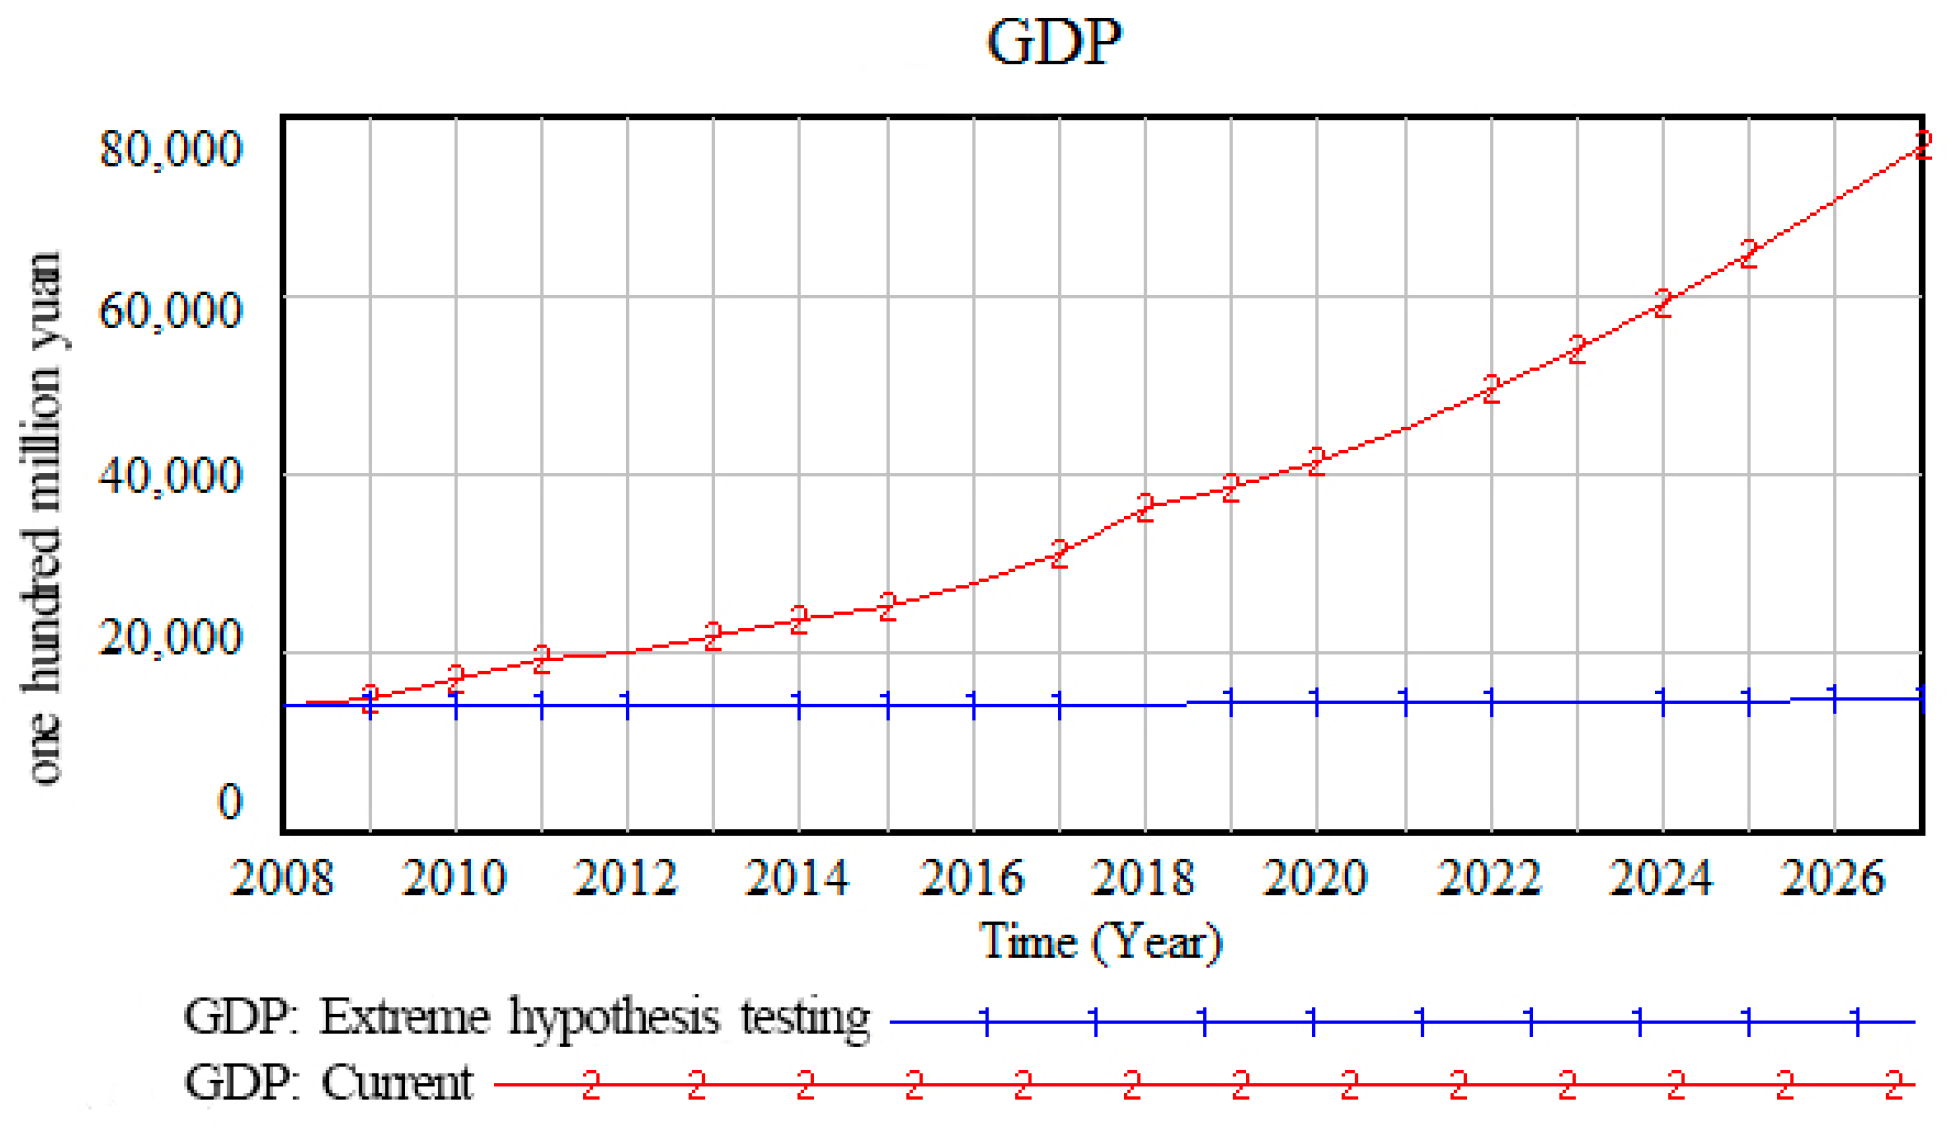
3.1.4. Model Validation

Extreme hypothesis testing is employed to evaluate the stability of state equations and ensure their validity under extreme conditions. This method involves assigning extreme values (e.g., zero or infinity) to specific model variables and assessing whether the resulting outputs are consistent with real-world expectations. In this study, the GDP equation was selected as a representative state variable for extreme testing. By setting the GDP growth rate to zero, an economic stagnation scenario was simulated. In this case, GDP is no longer driven by endogenous growth but depends solely on port infrastructure development and CO2 emissions. As expected, the simulated GDP curve closely matches real-world behavior but flattens noticeably, indicating slowed economic activity. The model also reflects a weakened feedback loop: lower GDP growth reduces investment, slows transport volume expansion, and leads to lower emissions. As shown in Figure 2, the simulation output is stable and plausible, with no divergence or unrealistic overshoot. The test supports the model’s internal logical consistency and reinforces its suitability for policy simulation under diverse scenario conditions.
The actual consistency test involves conducting a historical validation of the model by comparing its simulated outputs with corresponding historical data, thereby evaluating the degree of deviation between the two. To assess the empirical validity of the model, historical validation was conducted by comparing simulated outputs with actual data for key indicators over the period 2008–2019. Historical data were obtained from official statistical yearbooks, while simulations were run using baseline parameters without policy interventions. The comparison results are presented in Table 2. With the exception of fixed asset investment in 2015, the absolute error for all selected test indicators remains within 5%, which falls within an acceptable range. This indicates that the model’s performance aligns well with historical trends, confirming its effectiveness and suitability for simulation purposes.

3.2. Scenario Simulation

Based on the current development status of the GPCDS and in alignment with medium and long-term plans and policy proposals issued by relevant authorities, the scenarios outlined in Table 3 are established. This study explores the low-carbon development of the GPCDS using the control variable method in conjunction with a system dynamics model. By analyzing CO2 emission outputs under different simulation scenarios, the study examines system variations and trends to identify effective pathways for achieving low-carbon development in the GPCDS.

4. Results

4.1. Model Prediction Results

The model was evaluated using relevant data from Shanghai Yangshan Port spanning the period from 2008 to 2019. The relevant parameters were entered for debugging and testing. A simulation of the GPCDS low-carbon development was conducted without altering any parameters. The simulation covered the period from 2020 to 2027, aligning with China’s medium-term planning horizon. The simulation outputs for carbon emissions, energy consumption, and container throughput in 2027 are presented as the baseline scenario and are summarized in Table 4.
The simulation results reveal that increases in container throughput at Shanghai Yangshan Port are accompanied by corresponding rises in carbon emissions and energy consumption within the GPCDS. This trend poses significant challenges to the pursuit of sustainable and low-carbon development in the transportation sector. Therefore, the implementation of targeted policy measures is essential to support the GPCDS low-carbon transition.

4.2. Scenario Simulation Results

4.2.1. Extension of Railroads to Connect Port Terminals

Current: The transportation structure evolves naturally, without any policy or investment interventions, and reflects the existing conditions.
Scenario 1: The railway line is extended to the port terminal, resulting in a zero-distance connection between the port yard and the railway container center station.
The simulation results corresponding to the above scenarios were generated by inputting the respective parameters into the system dynamics model, as shown in Figure 3. In the figure, the red curve represents the baseline scenario, while the blue curve corresponds to Scenario 1.
The system simulation outputs indicate that extending the port rail line to the port yard results in a 6.4% reduction in the total carbon emissions of the system by 2027 compared to the baseline scenario while reducing energy consumption by 6.22%. Additionally, port container throughput increases by 10.3%, and the GDP of hinterland cities rises by 0.0074%. These results demonstrate that extending the railway to the port storage yard—by eliminating connection delays and distances—can effectively reduce transportation costs and improve the efficiency of containerized rail transport. This approach holds substantial potential for advancing low-carbon and sustainable development in the GPCDS, while also contributing to regional economic growth. These results illustrate how modifying transport distances—particularly at mode transfer points—can systematically alter both energy consumption and emissions within the GPCDS framework.

4.2.2. Energy Structure Adjustment

Scenario 2: Increases of 10% in the proportion of electric locomotives and 5% in the proportion of LNG vehicles and vessels are implemented.
Scenario 3: Increases of 10% in the proportion of electric locomotives and 10% in the proportion of LNG vehicles and vessels are implemented.
Following the input of these scenario parameters into the simulation system, the corresponding projection results are presented in Figure 4. In the figure, the green curve represents the baseline scenario, while the red and blue curves correspond to Scenarios 2 and 3, respectively.
The system model outputs indicate that adjusting the energy structure under Scenario 2 leads to reductions in carbon emissions and energy consumption by 2.01% and 1.39%, respectively, compared to the baseline scenario. Scenario 3 results in greater reductions of 3.59% and 3.97%, respectively. These outcomes demonstrate that increasing the share of LNG-powered vehicles and vessels, along with the electrification of railroads, reduces the diesel consumption and associated emissions of diesel-fueled transport modes. While the short-term impact of energy structure adjustments remains modest, their long-term mitigation potential is substantia. The cost advantage of LNG and its lower environmental impact suggest substantial greenhouse gas mitigation opportunities in the transport sector through the replacement of conventional fossil fuels.

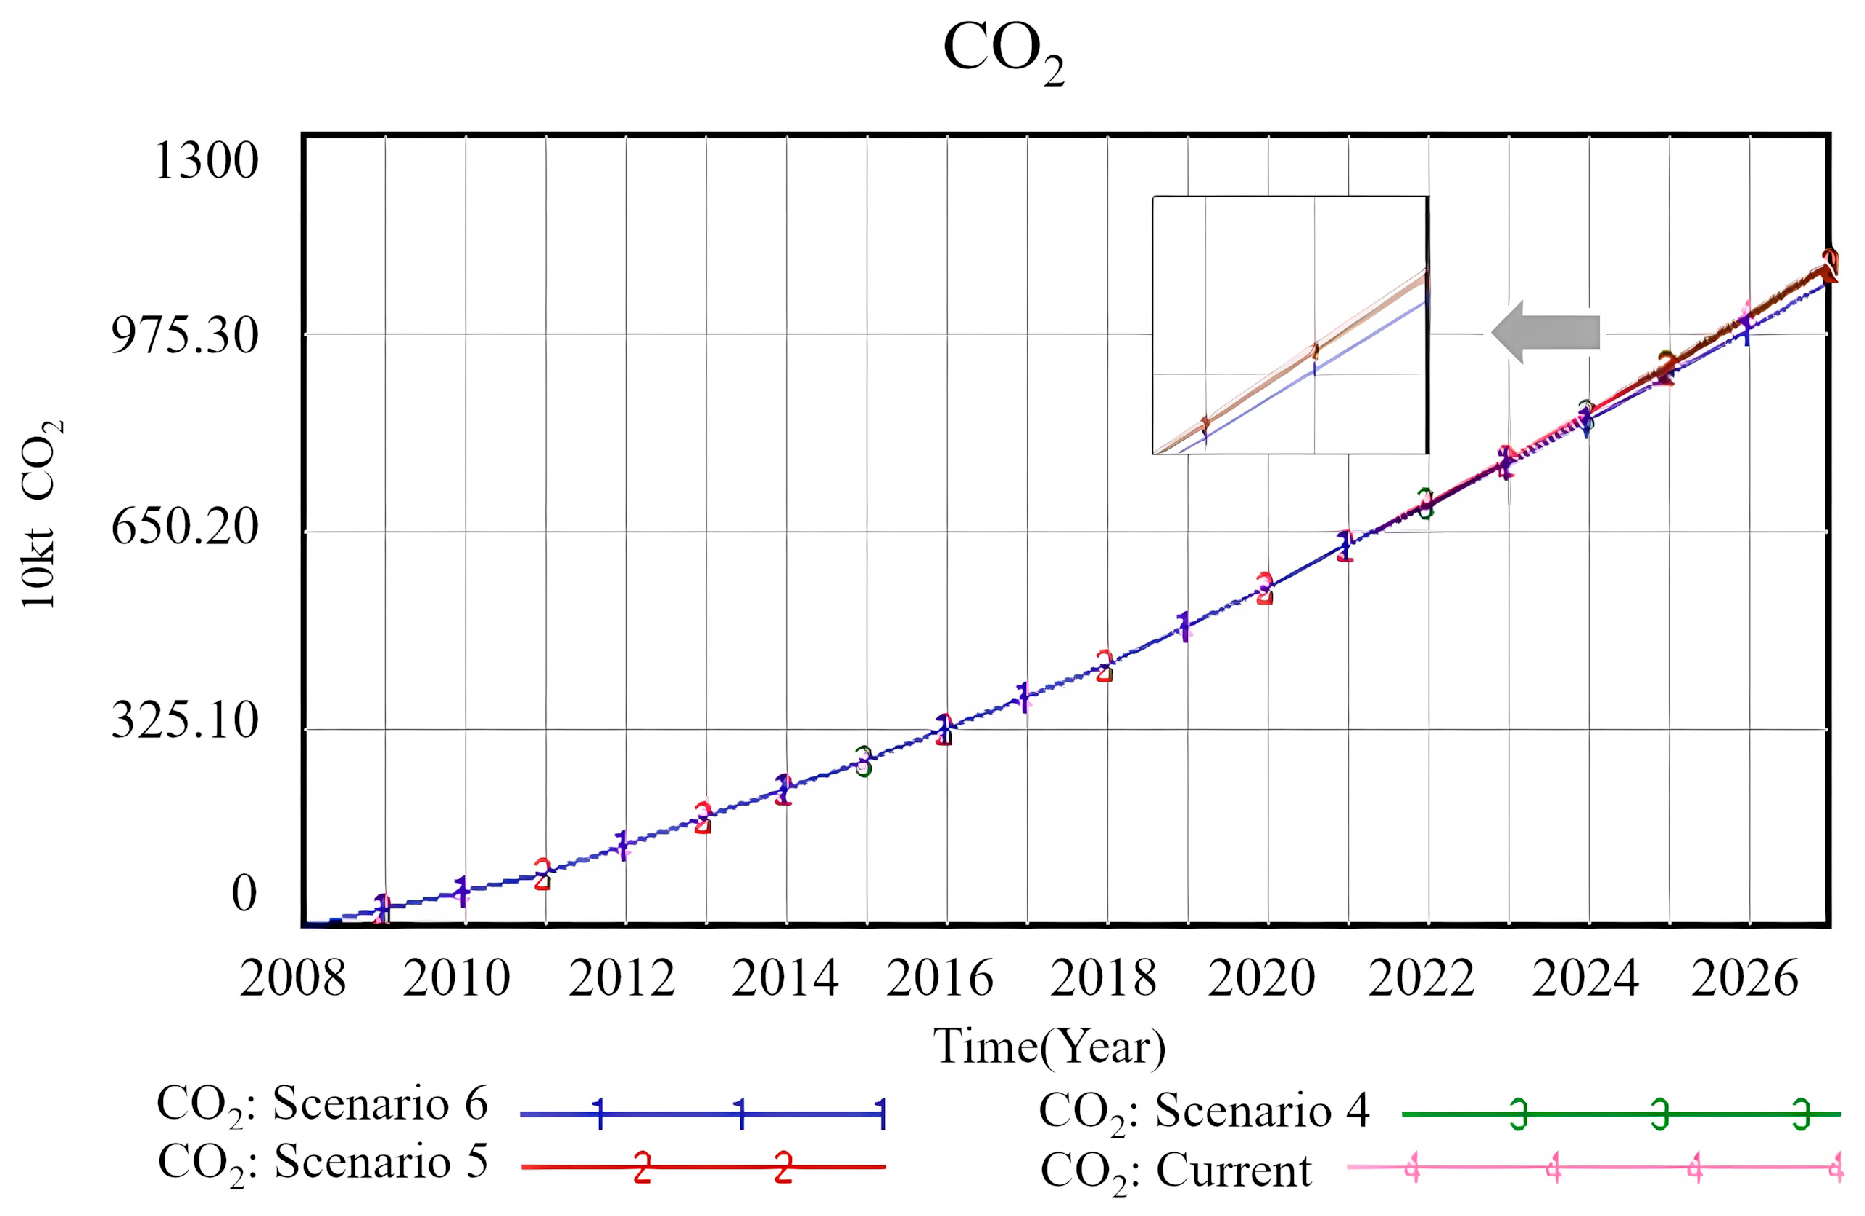
4.2.3. Improving the Policy Management System

(1)
Carbon Tax
Scenario 4: A CT is levied at a rate of RMB 30/tCO2.
Scenario 5: A CT is levied at a rate of RMB 50/tCO2.
Scenario 6: A CT is levied at a rate of RMB 150/tCO2.
The prediction results generated by inputting the above scenario parameters into the simulation system are presented in Figure 5. In the figure, the pink curve represents the baseline scenario, the green curve corresponds to Scenario 4, the red curve to Scenario 5, and the blue curve to Scenario 6.
The system simulation results indicate that the introduction of a carbon tax positively contributes to the low-carbon development of the system. Higher tax rates yield more substantial benefits. Specifically, Scenarios 4, 5, and 6 achieve reductions in carbon emissions of 0.64%, 1.09%, and 3.38%, respectively, compared to the baseline scenario. The increased cost and price of both coal and petroleum fuels following the imposition of a CT on transportation leads to a reduction in the demand and supply of these two energy sources, resulting in a decrease in the share of road transportation and a shift to other modes of transportation.
(2)
Emission Costs Incorporated into Transportation Costs
Scenario 7: The carbon pricing level is taken as RMB 300/tCO2.
Scenario 8: The carbon pricing level is taken as RMB 900/tCO2.
Scenario 9: The carbon pricing level is taken as RMB 1500/tCO2.
Substituting the above scenario parameters into the simulation system, the corresponding prediction results were obtained, as shown in Figure 6. The blue curve in the figure indicates the baseline scenario, the pink curve indicates scenario 7, the green curve indicates scenario 8, and the red curve indicates scenario 9.
The simulation results indicate that, compared to the baseline scenario, Scenario 7 reduces carbon emissions by 4.75%, container throughput by 5.56%, and the GDP of hinterland cities by 0.03%. Scenario 8 results in reductions of 10.6% in carbon emissions, 9.3% in container throughput, and 0.051% in hinterland city GDP. Scenario 9 achieves the largest reductions, with carbon emissions decreasing by 15.7%, container throughput by 14.2%, and hinterland city GDP by 0.078%. The adoption of carbon pricing to internalize the social cost of carbon emissions has a clear positive impact on the low-carbon development of a system. However, this also results in the suppression of container throughput, which can negatively affect the economic development of port cities. The higher the level of carbon pricing, the greater the impact on the three metrics described above and the more obvious the disincentives. Therefore, setting a reasonable level of carbon pricing is particularly important.
(3)
Tariff Subsidy Policy
Scenario 10: Subsidize RMB 150/TEU for containerized transport by rail.
Scenario 11: Subsidize RMB 250/TEU for containerized transport by rail.
Using the above scenario parameters, prediction results are shown in Figure 7a,b. The green curve in this figure represents the baseline scenario, the red curve represents Scenario 10, and the blue curve represents Scenario 11.
Scenario 12: A subsidy of RMB 150/TEU is provided for containerized transport via rail and waterways.
Scenario 13: A subsidy of RMB 250/TEU is provided for containerized transport via rail and waterways.
The projection results corresponding to the scenarios above are presented in Figure 7c,d. The green curve represents the baseline scenario, the red curve represents Scenario 12, and the blue curve represents Scenario 13.
The simulation results show that Scenario 10 reduces carbon emissions by 5.48% and energy consumption by 5.41% compared to the baseline scenario. Scenario 11 achieves reductions of 7.86% in carbon emissions and 7.67% in energy consumption. Scenario 12 results in a 10.18% decrease in carbon emissions and a 10.23% decrease in energy consumption. Finally, Scenario 13 yields the most significant reductions, with carbon emissions decreasing by 14.3% and energy consumption by 14.15% relative to the baseline scenario. Transportation cost is a critical factor influencing the choice of containerized transport modes. Variations in container tariffs directly affect the total transportation cost, thereby influencing mode selection. As transportation costs decline, the share of low-carbon transport modes—such as rail and waterway—increases. Thus, container volumes for these modes are negatively correlated with their respective transportation costs.

5. Discussion

5.1. Optimize Transportation Structure

Road transport is the dominant mode of freight transportation in port hinterlands, accounting for approximately 60% of global domestic freight and contributing to around 70% of emissions [22]. Rail is widely recognized as a cleaner alternative to road freight, emitting 7.89 to 10.45 times less CO2 per unit [46]. In countries like Japan and Germany, rail is already the primary freight mode, while road remains dominant in many developing countries, leading to congestion and energy inefficiency [47]. Studies show that shifting freight from road to rail or waterways offers both environmental and logistical benefits for ports [48].
Currently, rail transport in China accounts for a relatively small proportion of total freight, and its supporting infrastructure remains underdeveloped. Our scenario-based simulation further quantifies this issue: extending railway access directly to port terminals—eliminating road transfer stages—results in a projected 6.4% reduction in total CO2 emissions and a 6.22% reduction in energy consumption by 2027 compared to the baseline. This finding underscores the importance of improving rail access in China’s port logistics system. Rail freight offers operational efficiency that road networks often cannot achieve. Extending railways directly to port terminals—thereby eliminating road interconnections—can significantly reduce transportation time and cost [49,50]. It is important to note that the observed reductions in energy use (6.22%) and emissions (6.4%) in Scenario 1 are directly linked to the elimination of the intermodal connection distance. This confirms that transport distances act as a critical structural factor in determining system-wide carbon and energy outcomes. Therefore, optimizing infrastructure layout to reduce such distances offers a practical pathway to enhance the low-carbon performance of the GPCDS [51].

5.2. Energy Structure Transition Analysis

Since 2009, China has been the world’s largest consumer of energy. Rapid economic growth and urbanization have led to a substantial rise in energy consumption within the transportation sector over recent decades [52]. To meet growing demand, reduce CO2 emissions and combat air pollution, it is essential to adjust the energy structure of the transportation system and promote low-carbon alternatives [53]. However, despite its strategic importance, the system-wide impact of energy structure adjustment remains limited under current conditions. Our simulation results show that, although energy structure adjustments contribute to carbon and energy reduction, their overall system-wide effects remain relatively modest. For example, increasing the share of electric locomotives in rail transport by 10% yields an 18.4% emission reduction within the rail-based subsystem, but has a limited impact at the GPCDS system level due to the currently low share of rail transport.
At present, the adoption of alternative fuels has already contributed to significant carbon reductions in freight transport. Natural gas, in particular, is considered a promising fuel for heavy-duty trucks due to its ability to enhance energy security, reduce operating costs and noise, and lower greenhouse gas and air pollutant emissions [54]. Compared to electric locomotives and renewables, LNG offers moderate but more readily scalable benefits for road transport [55]. It delivers higher energy efficiency, lower carbon intensity, and emits only 50% of the CO2 per unit energy compared to coal, without producing wastewater [56].
According to the International Energy Agency (IEA), natural gas consumption experienced its largest annual increase in 2020, accounting for 16% of Total Energy Consumption (TEC). In comparison, coal represented 10% and oil remained the leading energy source, comprising 40% of TEC [57]. Although LNG adoption in China is gradually rising, its current market share remains limited—reflecting a slower pace of structural energy transition [58]. This aligns with our scenario results, which show that LNG-driven energy structure adjustment contributes to carbon reduction but lags behind pricing-based strategies such as carbon cost internalization. Consequently, the impact of energy structure adjustments on low-carbon development is not yet immediately evident. Nonetheless, with continued policy support and active promotion of natural gas technologies in transportation, the long-term effects are expected to become increasingly significant [59,60].

5.3. Policy Implications

The Chinese government has implemented a series of energy conservation and emission reduction policies. However, most are standalone measures lacking sufficient synergy, making it challenging to address complex issues such as the low-carbon transformation of port logistics [61]. For instance, carbon pricing policies, as typical instruments, face a dual dilemma: excessively high prices may hinder economic growth, while lower levels (e.g., RMB 30–50/tCO2) are insufficient to drive behavioral change in the GPCDS. Our simulation results support this dilemma: when the carbon price is raised to RMB 150/tCO2, CO2 emissions are reduced by 15.7%, significantly outperforming the outcomes under lower price settings. However, such pricing levels may increase freight costs, weakening port competitiveness and throughput. A tiered carbon pricing strategy—starting at 30 CNY/tCO2 and gradually advancing to 150—may offer a pragmatic path forward. This phased approach balances the need for climate ambition with the economic resilience of regional logistics systems.
Carbon taxes (CTs) serve as a fiscal instrument to internalize environmental costs and incentivize reductions in greenhouse gas emissions. When a CT increases the price of energy products, the demand for energy products is reduced, leading to a decrease in carbon emissions [62,63]. In our model, carbon taxes are implemented through a carbon cost internalization mechanism, which effectively redirects freight flow from high-emission modes (road) toward rail and waterway. However, the effectiveness of this policy hinges on infrastructure readiness. In many regions, poor connectivity or low rail frequency significantly dampens the substitution effect. This is also evident in our model scenarios: even under carbon pricing conditions, the modal shift effect is constrained when rail or waterway infrastructure is insufficient or disconnected from terminals. To maximize impact, carbon pricing must be coupled with infrastructure upgrades and service improvements.
The internalization of the social cost of carbon emissions accurately reflects the negative externalities associated with various modes of transportation. Compared to rail and waterway transport, road transportation has a higher carbon emission intensity [64]. Our simulation shows that internalizing these costs leads to behavioral changes among shippers and a rebalancing of modal shares in favor of lower-emission transport. However, in many regions, rail and waterway infrastructure remains underdeveloped, with poor connections to ports, which may also reduce shippers’ willingness to switch modes despite price adjustments.
A subsidy policy is a commonly used strategy in European countries and has been found to be effective at promoting low-carbon development. Model results indicate that rail and waterway subsidies can reduce emissions by 14.3%, making them one of the most impactful standalone measures in the GPCDS framework. However, subsidies exhibit diminishing marginal returns. Therefore, it is essential to identify the optimal level of subsidies for transportation costs. The key challenge for the government is to determine the optimal subsidy level (i.e., the cost per ton of emissions reduced through the implementation of the subsidy policy) that maximizes environmental and social benefits while effectively utilizing limited resources [65].
Beyond pricing and infrastructure, behavioral inertia and institutional fragmentation may hinder implementation. Operators and logistics firms may resist change due to uncertainty or misaligned incentives. To address this, our study recommends combining economic measures with soft policy tools—such as pilot programs, awareness campaigns, and training initiatives—to support stakeholder transition and enhance policy uptake.

6. Conclusions

This study employs a scenario-based system dynamics approach to investigate the factors influencing the GPCDS low-carbon development, as well as potential development paths, by synthesizing existing studies and relevant theories from domestic and international sources. The SD model is developed for the low-carbon development of GPCDS, and simulations are conducted to analyze its performance. The impact of various factors on the low-carbon development of the system is investigated, and effective strategies for achieving GPCDS low-carbon development are proposed. The findings provide both theoretical insights and practical policy recommendations to facilitate the green, low-carbon, and sustainable development of GPCDS. The main conclusions are as follows:
(i)
Transport structure optimization—Extending rail lines to port terminals and improving GPCDS infrastructure reduces carbon emissions by 6.4%, mainly by enhancing rail efficiency and encouraging a modal shift from road to rail.
(ii)
Energy structure adjustment—Energy restructuring yields a modest emission reduction of approximately 3.5%. This limited effect is primarily due to the low adoption rate of LNG-fueled transport and the small share of container volumes handled via rail.
(iii)
Carbon pricing and subsidies—A carbon tax of RMB 150/tCO2 reduces emissions by 3.38%, while raising it to RMB 1500/tCO2 boosts the effect to 15.7%, though at potential cost to throughput. Tariff subsidies (up to RMB 250/container) can achieve a 14.3% reduction by improving the cost competitiveness of rail and waterway transport. A combined approach for pricing and subsidies is essential to drive effective modal shifts.
Based on the scenario simulation outcomes, several countermeasures are proposed to guide the low-carbon development of GPCDS: First, adjustments to both the transportation and energy structures should be prioritized. Special emphasis should be placed on extending rail lines to port terminals, enabling railway-dominated consolidation and distribution networks. Simultaneously, the application of electricity and natural gas in port and freight transport should be actively promoted to advance a cleaner and more sustainable energy structure. Second, reasonable and phased low-carbon policies should be implemented. A transitional carbon tax rate of RMB 30–50/tCO2 is recommended, with a gradual increase to RMB 150/tCO2 to maximize effectiveness while minimizing economic disruption. In parallel, targeted subsidies should be allocated to waterway and railway transport modes to enhance their competitiveness relative to road transport.
Future research can consider the following aspects. Firstly, the study did not account for energy consumption and CO2 emissions from fixed port sources, such as loading and auxiliary equipment, and only considered CO2 emissions from mobile sources, which resulted in certain calculation errors. In the future, the calculation of carbon emissions can be further refined to consider all the emissions during transport operations, and the model accuracy can be improved based on the existing research. In addition, while CO2 emissions were not directly validated due to data limitations, future work will incorporate empirical sources—such as fuel-use records or satellite estimates—to improve the accuracy and credibility of emission simulations. Secondly, the current carbon tax rate is at a low to medium level, can serve as a short-term transition rate, gradually increasing to a higher level; the subsidy policy exhibits diminishing marginal returns, so the subsidy amount should be thoroughly researched and evaluated to determine the optimal policy for achieving the best low-carbon development effect for GPCDS. Thirdly, in the long run, we should also explore the synergistic effects of comprehensive policy measures. How to organically combine transportation structure adjustment, energy structure adjustment and different policies to achieve the best emission reduction effect is also an issue worthy of study.

Author Contributions

Conceptualization, Q.W. and M.L.; methodology, Q.W.; software, M.L.; validation, Q.W., M.L. and Y.Z.; formal analysis, Y.K.; investigation, M.L.; resources, Q.W.; data curation, M.L.; writing—original draft preparation, Q.W.; writing—review and editing, M.L.; visualization, Y.Z.; supervision, Y.K. All authors have read and agreed to the published version of the manuscript.

Funding

This research received no external funding.

Institutional Review Board Statement

Not applicable.

Informed Consent Statement

Not applicable.

Data Availability Statement

Data will be made available on request.

Conflicts of Interest

The authors declare no conflicts of interest.

Abbreviations

The following abbreviations are used in this manuscript:
GPCDSGreen port collection and distribution system
LNGLiquefied natural gas
CTCarbon taxes
SDSystem dynamics
GDPGGDP growth
GDPDGDP dampener
GDPGRGDP growth rate
CTHContainer transport hindrance
RCRestraint considerations
CTPContainer throughput
CTPGCTP growth
CTPDCTP dampening
CTPGRContainer throughput growth rate
TECTransport energy consumption
TEGTransport energy growth
HTECHighway transport energy consumption
WTECWaterway transport energy consumption
RTECRailway transport energy consumption
CO2GCO2 growth
CO2RCO2 reductions

Appendix A

In the variable type, the state variable (Level Variable) is represented by the letter L, the rate variable (Rate Variable) is represented by the letter R, the auxiliary variable (Auxiliary Variable) is represented by the letter A, and the constant is represented by the letter C.
Table A1. System model variable description.
No.Variable NameDescriptionVariable TypeUnit
1GDPGDP of hinterland cityL100 million RMB
2GDPGGDP growthR100 million RMB
3GDPDGDP reduction due to constraintsR100 million RMB
4RCConstraint factorA100 million RMB/10,000 TEU
5GDPGRGDP growth rateADmnl
6TFAFixed asset investmentA100 million RMB
7TFACFixed asset investment coefficientC Dmnl
8TCITransport construction investmentA100 million RMB
9TCICTransport investment coefficientCDmnl
10CTPContainer throughputL10,000 TEU
11CTPGThroughput growthR10,000 TEU
12CTPDThroughput constraintR10,000 TEU
13CTPGRThroughput growth rateADmnl
14HUICHighway capacity per unit investmentC10,000 TEU/100 million RMB
15HCIHighway capacity incrementR10,000 TEU
16RUICRail capacity per unit investmentC10,000 TEU/100 million RMB
17RCIRail capacity incrementR10,000 TEU
18WUICWaterway capacity per unit investmentC10,000 TEU/100 million RMB
19WCIWaterway capacity incrementR10,000 TEU
20PHCPort highway capacityL10,000 TEU
21PRCPort railway capacityL10,000 TEU
22PWCPort waterway capacityL10,000 TEU
23GDPDCGDP driver coefficient from portC100 million RMB/10,000 TEU
24CDTKCollection and distribution demandA10,000 TEU
25CDTKCDemand coefficientCDmnl
26HTKRoad transport volumeA10,000 TEU
27RTKRail transport volumeA10,000 TEU
28WTKWaterway transport volumeA10,000 TEU
29PHRoad transport shareADmnl
30PRRail transport shareADmnl
31PWWaterway transport shareADmnl
32CTHTransport constraints (total)A10,000 TEU
33HPRoad transport pressureADmnl
34HSRoad transport capacity shortfallA10,000 TEU
35RPRail transport pressureADmnl
36RSRail capacity shortfallA10,000 TEU
37WPWaterway transport pressureADmnl
38WSWaterway capacity shortfallA10,000 TEU
39HTURoad transport utilityADmnl
40HTCRoad transport costARMB/TEU
41HTDRoad transport distanceCkm
42HTSRoad vehicle speedCkm/h
43HTTRoad transport timeAh
44HTRRoad freight rateCRMB/(TEU·km)
45HTCFRoad transport fee per boxCRMB/TEU
46RTURail transport utilityADmnl
47RTCRail transport costARMB/TEU
48BP1Base price 1CRMB/TEU
49BP2Base price 2CRMB/(TEU·km)
50RTOCRail other costARMB/TEU
51RTDRail transport distanceCkm
52RTSRail speedCkm/h
53RTTRail transport timeAh
54RTOTRail transfer timeCh
55CDIntermodal connection distanceCkm
56WTUWaterway transport utilityADmnl
57WTCWaterway transport costARMB/TEU
58WTRWaterway freight rateARMB/(TEU·km)
59WTTWaterway transport timeAh
60WTDWaterway transport distanceCkm
61WTSShip speedCkm/h
62PLNGVLNG truck proportionCDmnl
63PLNGSLNG ship proportionCDmnl
64ERElectrification rateCDmnl
65EPElectrification cost rateCRMB/(TEU·km)
66DVUEUnit energy use of diesel trucksCkg/(TEU·km)
67LNGVUEUnit energy use of LNG trucksCkgLNG/(TEU·km)
68DSUEUnit energy use of diesel shipsCkg/(TEU·km)
69LNGSUEUnit energy use of LNG shipsCkgLNG/(TEU·km)
70ELUEUnit energy use of electric locomotivesCkWh/(TEU·km)
71DLUEUnit energy use of diesel locomotivesCkg/(TEU·km)
72DSCDiesel conversion factor to standard coalCkgce/kg
73LNGSCLNG conversion factor to standard coalCkgce/kgLNG
74ECFElectricity conversion factor to coalCkgce/kWh
75DVECDiesel truck energy consumptionA10,000 tce
76LNGVECLNG truck energy consumptionA10,000 tce
77DSECDiesel ship energy consumptionA10,000 tce
78LNGSECLNG ship energy consumptionA10,000 tce
79ELECElectric locomotive energy consumptionA10,000 tce
80DLECDiesel locomotive energy consumptionA10,000 tce
81CPECRail connection energy consumptionA10,000 tce
82HTECRoad transport energy consumptionA10,000 tce
83WTECWaterway transport energy consumptionA10,000 tce
84RTECRail transport energy consumptionA10,000 tce
85TEGEnergy increaseR10,000 tce
86TECTotal energy consumptionL10,000 tce
87DECDiesel emission factorCkgCO2/kg
88LNGECLNG emission factorCkgCO2/kgLNG
89ECElectricity emission factorCkgCO2/kWh
90HTERoad transport emissionsA10,000 tCO2
91RTERail transport emissionsA10,000 tCO2
92WTEWaterway transport emissionsA10,000 tCO2
93CO2GCO2 growthR10,000 tCO2
94CO2RCO2 reductionR10,000 tCO2
95CO2CO2 stock in the systemL10,000 tCO2
96CTCarbon tax amountARMB
97CTRCarbon tax rateCRMB/tCO2
98GCGovernance coefficientC10,000 tCO2/100 million RMB
99ESCSocial cost per unit CO2CRMB/tCO2
100HECRoad emission costARMB/(TEU·km)
101RECRail emission costARMB/(TEU·km)
102WECWaterway emission costARMB/(TEU·km)

References

  1. Huang, X.; Liu, G.; Zheng, P. Dynamic Analysis of a Low-Carbon Maritime Supply Chain Considering Government Policies and Social Preferences. Ocean Coast. Manag. 2023, 239, 106564. [Google Scholar] [CrossRef]
  2. Wang, Y.; Song, J.; Yang, W.; Fang, K.; Duan, H. Seeking Spatiotemporal Patterns and Driving Mechanism of Atmospheric Pollutant Emissions from Road Transportation in China. Resour. Conserv. Recycl. 2020, 162, 105032. [Google Scholar] [CrossRef]
  3. Bulletin of the State of China’s Ecological Environment. Available online: https://www.mee.gov.cn/hjzl/sthjzk/zghjzkgb/202006/P020200602509464172096.pdf (accessed on 3 July 2023).
  4. Huang, W.; Wang, Q.; Li, H.; Fan, H.; Qian, Y.; Klemes, J.J. Review of Recent Progress of Emission Trading Policy in China. J. Clean. Prod. 2022, 349, 131480. [Google Scholar] [CrossRef]
  5. Sun, L.; Liu, X.; Hu, Z.; Zhang, J.; Ducruet, C.; Zhang, W. Does Just Transition Increase Social and Environmental Risks? Evidence from Global Port Cities Development. Environ. Impact Assess. Rev. 2024, 105, 107370. [Google Scholar] [CrossRef]
  6. Wang, B.; Liu, Q.; Wang, L.; Chen, Y.; Wang, J. A Review of the Port Carbon Emission Sources and Related Emission Reduction Technical Measures. Environ. Pollut. 2023, 320, 121000. [Google Scholar] [CrossRef] [PubMed]
  7. Budiyanto, M.A.; Habibie, M.R.; Shinoda, T. Estimation of CO2 Emissions for Ship Activities at Container Port as an Effort Towards a Green Port Index. Energy Rep. 2022, 8, 229–236. [Google Scholar] [CrossRef]
  8. Jiang, X.; Zhong, M.; Shi, J.; Li, W. Optimization of Integrated Scheduling of Restricted Channels, Berths, and Yards in Bulk Cargo Ports Considering Carbon Emissions. Expert Syst. Appl. 2024, 255, 124604. [Google Scholar] [CrossRef]
  9. Davarzani, H.; Fahimnia, B.; Bell, M.; Sarkis, J. Greening Ports and Maritime Logistics: A Review. Transp. Res. Part Transp. Environ. 2016, 48, 473–487. [Google Scholar] [CrossRef]
  10. Wan, C.; Zhang, D.; Yan, X.; Yang, Z. A Novel Model for the Quantitative Evaluation of Green Port Development—A Case Study of Major Ports in China. Transp. Res. Part Transp. Environ. 2018, 61, 431–443. [Google Scholar] [CrossRef]
  11. Zhang, X.; Liao, Q.; Wang, Q.; Wang, L.; Qiu, R.; Liang, Y.; Zhang, H. How to Promote Zero-Carbon Oilfield Target? A Technical-Economic Model to Analyze the Economic and Environmental Benefits of Recycle-Ccs-Eor Project. Energy 2021, 225, 120297. [Google Scholar] [CrossRef]
  12. Zhang, X.; Yin, S.; Lu, X.; Liu, Y.; Wang, T.; Zhang, B.; Li, Z.; Wang, W.; Kong, M.; Chen, K. Establish of Air Pollutants and Greenhouse Gases Emission Inventory and Co-Benefits of Their Reduction of Transportation Sector in Central China. J. Environ. Sci. 2025, 150, 604–621. [Google Scholar] [CrossRef] [PubMed]
  13. Qu, Y.; Kong, Y.; Li, Z.; Zhu, E. Pursue the Coordinated Development of Port-City Economic Construction and Ecological Environment: A Case of the Eight Major Ports in China. Ocean Coast. Manag. 2023, 242, 106694. [Google Scholar] [CrossRef]
  14. Zhang, Z.; Song, C.; Zhang, J.; Chen, Z.; Liu, M.; Aziz, F.; Kurniawan, T.A.; Yap, P.-S. Digitalization and Innovation in Green Ports: A Review of Current Issues, Contributions and the Way Forward in Promoting Sustainable Ports and Maritime Logistics. Sci. Total Environ. 2024, 912, 169075. [Google Scholar] [CrossRef] [PubMed]
  15. Pirhadi, M.; Krasowsky, T.S.; Gatt, G.; Quiros, D.C. Criteria Pollutant and Greenhouse Gas Emissions from Cargo Handling Equipment Operating at the Ports of Los Angeles and Long Beach. Sci. Total Environ. 2024, 927, 172084. [Google Scholar] [CrossRef] [PubMed]
  16. Xie, B.; Zhang, X.; Lu, J.; Liu, F.; Fan, Y. Research on Ecological Evaluation of Shanghai Port Logistics Based on Emergy Ecological Footprint Models. Ecol. Indic. 2022, 139, 108916. [Google Scholar] [CrossRef]
  17. Chai, S.; Huo, W.; Li, Q.; Ji, Q.; Shi, X. Effects of Carbon Tax on Energy Transition, Emissions and Economy Amid Technological Progress. Appl. Energy 2025, 377, 124578. [Google Scholar] [CrossRef]
  18. Martínez-Moya, J.; Vazquez-Paja, B.; Gimenez Maldonado, J.A. Energy Efficiency and CO2 Emissions of Port Container Terminal Equipment: Evidence from the Port of Valencia. Energy Policy 2019, 131, 312–319. [Google Scholar] [CrossRef]
  19. Alamoush, A.S.; Ballini, F.; Ölçer, A.I. Ports’ Technical and Operational Measures to Reduce Greenhouse Gas Emission and Improve Energy Efficiency: A Review. Mar. Pollut. Bull. 2020, 160, 111508. [Google Scholar] [CrossRef] [PubMed]
  20. Hou, L.; Xu, Y.; Dong, J.; Chong, H.-Y.; Ren, R.; Chen, Z. Reshaping Port-City Relationships through Underground Logistics System: A Mixed Qualitative Approach. Cities 2024, 154, 105395. [Google Scholar] [CrossRef]
  21. Zhou, X.; Xu, Z.; Xi, Y. Energy Conservation and Emission Reduction (Ecer): System Construction and Policy Combination Simulation. J. Clean. Prod. 2020, 267, 121969. [Google Scholar] [CrossRef]
  22. Kurtuluş, E.; Çetin, İ.B. Analysis of Modal Shift Potential Towards Intermodal Transportation in Short-Distance Inland Container Transport. Transp. Policy 2020, 89, 24–37. [Google Scholar] [CrossRef]
  23. Li, S.; Wu, J.; Jiang, Y.; Yang, X. Impacts of the Sea-Rail Intermodal Transport Policy on Carbon Emission Reduction: The China Case Study. Transp. Policy 2024, 158, 211–223. [Google Scholar] [CrossRef]
  24. Zuo, D.; Liang, Q.; Huang, R. Will China Complete the 4.79-Billion-Ton Railway Freight Transportation Goal: An Incremental Potential Research from the Supply Side. J. Rail Transp. Plan. Manag. 2023, 26, 100385. [Google Scholar] [CrossRef]
  25. Tao, X.; Wu, Q.; Zhu, L. Mitigation Potential of CO2 Emissions from Modal Shift Induced by Subsidy in Hinterland Container Transport. Energy Policy 2017, 101, 265–273. [Google Scholar] [CrossRef]
  26. Li, L.; Zhang, X. Reducing CO2 Emissions through Pricing, Planning, and Subsidizing Rail Freight. Transp. Res. Part D Transp. Environ. 2020, 87, 102483. [Google Scholar] [CrossRef]
  27. Tsoi, K.H.; Loo, B.P.Y.; Tal, G.; Sperling, D. Pioneers of Electric Mobility: Lessons About Transport Decarbonisation from Two Bay Areas. J. Clean. Prod. 2022, 330, 129866. [Google Scholar] [CrossRef]
  28. Urban, F.; Nurdiawati, A.; Harahap, F. Sector Coupling for Decarbonization and Sustainable Energy Transitions in Maritime Shipping in Sweden. Energy Res. Soc. Sci. 2024, 107, 103366. [Google Scholar] [CrossRef]
  29. Deng, J.; Wang, X.; Wei, Z.; Wang, L.; Wang, C.; Chen, Z. A Review of Nox and Sox Emission Reduction Technologies for Marine Diesel Engines and the Potential Evaluation of Liquefied Natural Gas Fuelled Vessels. Sci. Total Environ. 2021, 766, 144319. [Google Scholar] [CrossRef] [PubMed]
  30. Wang, L.; Yu, H.; Wei, X.; Liu, H. Applications—Transportation Applications|Ships—Fuel Cells and Batteries, 2nd ed.; Elsevier: Amsterdam, The Netherlands, 2025; Volume 7, pp. 280–300. [Google Scholar]
  31. Chu Van, T.; Ramirez, J.; Rainey, T.; Ristovski, Z.; Brown, R.J. Global Impacts of Recent Imo Regulations on Marine Fuel Oil Refining Processes and Ship Emissions. Transp. Res. Part D Transp. Environ. 2019, 70, 123–134. [Google Scholar] [CrossRef]
  32. Wang, X.-Q.; Su, C.-W.; Lobonţ, O.-R.; Li, H.; Nicoleta-Claudia, M. Is China’s Carbon Trading Market Efficient? Evidence from Emissions Trading Scheme Pilots. Energy 2022, 245, 123240. [Google Scholar] [CrossRef]
  33. Hu, Y.; Ren, S.; Wang, Y.; Chen, X. Can Carbon Emission Trading Scheme Achieve Energy Conservation and Emission Reduction? Evidence from the Industrial Sector in China. Energy Econ. 2020, 85, 104590. [Google Scholar] [CrossRef]
  34. Jia, Z.; Lin, B. Rethinking the Choice of Carbon Tax and Carbon Trading in China. Technol. Forecast. Soc. Change 2020, 159, 120187. [Google Scholar] [CrossRef]
  35. Jia, Z.; Wen, S.; Wu, R. Synergistic Effect of Emission Trading Scheme and Carbon Tax: A Cge Model-Based Study in China. Environ. Impact Assess. Rev. 2025, 110, 107699. [Google Scholar] [CrossRef]
  36. Distefano, T.; D’Alessandro, S. Introduction of the Carbon Tax in Italy: Is There Room for a Quadruple-Dividend Effect? Energy Econ. 2023, 120, 106578. [Google Scholar] [CrossRef]
  37. Elaouzy, Y.; El Fadar, A. Role of Carbon Tax in the Widespread Integration of Sustainable Strategies in Buildings. Build. Environ. 2023, 234, 110182. [Google Scholar] [CrossRef]
  38. Gugler, K.; Haxhimusa, A.; Liebensteiner, M. Carbon Pricing and Emissions: Causal Effects of Britain’s Carbon Tax. Energy Econ. 2023, 121, 106655. [Google Scholar] [CrossRef]
  39. Adão, B.; Narajabad, B.; Temzelides, T. Renewable Technology Adoption Costs and Economic Growth. Energy Econ. 2024, 129, 107255. [Google Scholar] [CrossRef]
  40. Weng, Y.; Zhang, J.; Yang, C.; Ramzan, M. Intermodal Travel Planning and Decision Support Integrated with Transportation and Energy Systems. Heliyon 2024, 10, e31577. [Google Scholar] [CrossRef] [PubMed]
  41. Hu, Q.; Gu, W.; Wang, S. Optimal Subsidy Scheme Design for Promoting Intermodal Freight Transport. Transp. Res. Part E Logist. Transp. Rev. 2022, 157, 102561. [Google Scholar] [CrossRef]
  42. Yin, C.; Zhang, Z.-A.; Fu, X.; Ge, Y.-E. A Low-Carbon Transportation Network: Collaborative Effects of a Rail Freight Subsidy and Carbon Trading Mechanism. Transp. Res. Part A Policy Pract. 2024, 184, 104066. [Google Scholar] [CrossRef]
  43. Jiang, Y.; Lu, J.; Cai, Y.; Zeng, Q. Analysis of the Impacts of Different Modes of Governance on Inland Waterway Transport Development on the Pearl River: The Yangtze River Mode Vs. The Pearl River Mode. J. Transp. Geogr. 2018, 71, 235–252. [Google Scholar] [CrossRef]
  44. Han, S.W.; Kwak, D.H.; Byeon, G.-w.; Woo, J.H. Forecasting Shipbuilding Demand Using Shipping Market Modeling: A Case Study of Lngc. Int. J. Nav. Archit. Ocean Eng. 2024, 16, 100616. [Google Scholar] [CrossRef]
  45. Zhang, W.; Zhang, M.; Wu, S.; Liu, F. A Complex Path Model for Low-Carbon Sustainable Development of Enterprise Based on System Dynamics. J. Clean. Prod. 2021, 321, 128934. [Google Scholar] [CrossRef]
  46. Lin, B.; Liu, C.; Wang, H.; Lin, R. Modeling the Railway Network Design Problem: A Novel Approach to Considering Carbon Emissions Reduction. Transp. Res. Part D Transp. Environ. 2017, 56, 95–109. [Google Scholar] [CrossRef]
  47. The Future of Rail. Available online: https://www.iea.org/reports/the-future-of-rail/ (accessed on 26 December 2024).
  48. Li, L.; Zhang, X. Integrated Optimization of Railway Freight Operation Planning and Pricing Based on Carbon Emission Reduction Policies. J. Clean. Prod. 2020, 263, 121316. [Google Scholar] [CrossRef]
  49. Alotaibi, S.; Quddus, M.; Morton, C.; Imprialou, M. Transport Investment, Railway Accessibility and Their Dynamic Impacts on Regional Economic Growth. Res. Transp. Bus. Manag. 2022, 43, 100702. [Google Scholar] [CrossRef]
  50. Isler, C.A.; Blumenfeld, M.; Roberts, C. Assessment of Railway Infrastructure Improvements: Valuation of Costs, Energy Consumption and Emissions. Sustain. Energy Technol. Assess. 2022, 52, 102179. [Google Scholar] [CrossRef]
  51. Wen, L.; Song, Q. Simulation Study on Carbon Emission of China’s Freight System under the Target of Carbon Peaking. Sci. Total Environ. 2022, 812, 152600. [Google Scholar] [CrossRef] [PubMed]
  52. Deng, H.-M.; Zhang, Y.-P.; Li, J.; Guo, W.-T.; Bu, C.-J. Research on Energy Saving Potential and Countermeasures in China’s Transport Sector. Energy Rep. 2022, 8, 300–311. [Google Scholar] [CrossRef]
  53. Lin, J.; Mou, D. Analysis of the Optimal Spatial Distribution of Natural Gas under ‘Transition from Coal to Gas’ in China. Resour. Energy Econ. 2021, 66, 101259. [Google Scholar] [CrossRef]
  54. Stettler, M.E.J.; Woo, M.; Ainalis, D.; Achurra-Gonzalez, P.; Speirs, J.; Cooper, J.; Lim, D.-H.; Brandon, N.; Hawkes, A. Review of Well-to-Wheel Lifecycle Emissions of Liquefied Natural Gas Heavy Goods Vehicles. Appl. Energy 2023, 333, 120511. [Google Scholar] [CrossRef]
  55. Bugaje, A.-A.B.; Dioha, M.O.; Abraham-Dukuma, M.C.; Wakil, M. Rethinking the Position of Natural Gas in a Low-Carbon Energy Transition. Energy Res. Soc. Sci. 2022, 90, 102604. [Google Scholar] [CrossRef]
  56. Wei, N.; Bai, R.; Zhao, J.; Zhang, Y.; Xue, J. The Prospect of Natural Gas Hydrate (Ngh) under the Vision of Peak Carbon Dioxide Emissions in China. Petroleum 2021, 7, 357–363. [Google Scholar] [CrossRef]
  57. CO2 Emissions from Fuel Combustion. Available online: https://www.iea.org/reports/world-energy-outlook-2020 (accessed on 6 July 2023).
  58. Li, X.; Yu, B. Peaking CO2 Emissions for China’s Urban Passenger Transport Sector. Energy Policy 2019, 133, 110913. [Google Scholar] [CrossRef]
  59. Hoang, A.T.; Foley, A.M.; Nižetić, S.; Huang, Z.; Ong, H.C.; Ölçer, A.I.; Pham, V.V.; Nguyen, X.P. Energy-Related Approach for Reduction of CO2 Emissions: A Critical Strategy on the Port-to-Ship Pathway. J. Clean. Prod. 2022, 355, 131772. [Google Scholar] [CrossRef]
  60. Iris, Ç.; Lam, J.S.L. A Review of Energy Efficiency in Ports: Operational Strategies, Technologies and Energy Management Systems. Renew. Sustain. Energy Rev. 2019, 112, 170–182. [Google Scholar] [CrossRef]
  61. Bhardwaj, C.; Axsen, J.; Kern, F.; McCollum, D. Why Have Multiple Climate Policies for Light-Duty Vehicles? Policy Mix Rationales, Interactions and Research Gaps. Transp. Res. Part A Policy Pract. 2020, 135, 309–326. [Google Scholar] [CrossRef]
  62. Qiu, R.; Xu, J.; Zeng, Z.; Chen, X.; Wang, Y. Carbon Tax Policy-Induced Air Travel Carbon Emission Reduction and Biofuel Usage in China. J. Air Transp. Manag. 2022, 103, 102241. [Google Scholar] [CrossRef]
  63. Hansmann, R.; Binder, C.R. Reducing Personal Air-Travel: Restrictions, Options and the Role of Justifications. Transp. Res. Part D Transp. Environ. 2021, 96, 102859. [Google Scholar] [CrossRef]
  64. Li, X.; Yao, X. Can Energy Supply-Side and Demand-Side Policies for Energy Saving and Emission Reduction Be Synergistic?—A Simulated Study on China’s Coal Capacity Cut and Carbon Tax. Energy Policy 2020, 138, 111232. [Google Scholar] [CrossRef]
  65. Huang, Z.; Fan, H. Responsibility-Sharing Subsidy Policy for Reducing Diesel Emissions from in-Use Off-Road Construction Equipment. Appl. Energy 2022, 320, 119301. [Google Scholar] [CrossRef]
Figure 1. (a) Causality diagram of GPCDS low-Carbon development; (b) System Flow Diagram of the GPCDS; (c) Logical interaction among the four core subsystems in the GPCDS model.
Sustainability 17 06516 g001
Figure 2. Extreme hypothesis testing.
Sustainability 17 06516 g002
Figure 3. (a) Impact of railway line extension to the port on carbon emissions from the system; (b) Impact of railway line extension to the port on system energy consumption; (c) Impact of railway line extension to the port on system throughput.
Sustainability 17 06516 g003
Figure 4. (a) Impact of energy structure adjustment on system carbon emissions; (b) Impact of energy structure adjustment on system energy consumption.
Sustainability 17 06516 g004
Figure 5. Impact of CT on system carbon emissions.
Sustainability 17 06516 g005
Figure 6. (a) Impact of the internalization of emission costs on system carbon emissions; (b) Impact of the internalization of emission costs on system throughput.
Sustainability 17 06516 g006
Figure 7. (a) Impact of the implementation of railway collection and distribution container subsidies on carbon emissions; (b) Impact of the implementation of railway collection and distribution container subsidies on energy consumption; (c) Impact of the implementation of railway and waterway collection and distribution container subsidies on carbon emissions; (d) Impact of the implementation of railway and waterway collection and distribution container subsidies on energy consumption.
Sustainability 17 06516 g007
Table 1. Key Model Parameters.
ParameterValue/RangeUnit
Carbon emission factor (diesel)0.074kg CO2/MJ
Carbon emission factor (LNG)0.056kg CO2/MJ
Initial modal share (Road)63%%
Initial modal share (Rail)30%%
Initial modal share (Waterway)7%%
Road energy intensity1.65–2.10MJ/ton-km
Rail energy intensity0.33–0.55MJ/ton-km
Waterway energy intensity0.27–0.45MJ/ton-km
Road transport distance101km
Rail transport distance167km
Waterway transport distance192km
ER72.8%Dmnl
TCIC0.09Dmnl
GDPDC0.02CNY 100 million/10,000 TEU
Table 2. Historical verification of the system model.
YearGDPContainer ThroughputFixed Asset Investment
Simulated Value/
Hundred Million
Actual Value/
Hundred Million
Error/%Simulated Value/Ten Thousand TEUActual Value/Ten Thousand TEUError/%Simulated Value/
Hundred Million
Actual Value/
Hundred Million
Error/%
200814,06914,0690.008238230.00468948292.91
200915,10115,0460.36789784.80.54502652734.69
201017,18717,1660.12100210100.79521453181.95
201119,27119,1960.3913091309.80.06493050672.71
201220,18720,1010.43143914151.70516152541.78
201321,79221,6020.8814551436.41.29567256480.43
201423,74223,5680.7415571520.22.42597760160.66
201525,71325,1232.3516141540.74.76681563537.28
201627,73527,4660.9815991561.62.39698967563.45
201731,04230,6331.3416801655.21.50740872472.23
201836,28036,0120.7418771842.21.89776176231.80
201938,67238,1551.3519551980.81.30820380122.38
Table 3. Scenario Setting.
ScenarioNumberRegulation Parameters
Extension of railroads to connect port terminalsScenario 1The railway line is extended to the port terminal, resulting in zero connection distance between the port yard and the railroad container center station.
Energy Structure AdjustmentScenario 2An increase of 10% in the proportion of electric locomotives and 5% in the proportion of LNG vehicles and vessels is implemented.
Scenario 3An increase of 10% in the proportion of electric locomotives and 10% in the proportion of LNG vehicles and vessels is implemented.
Carbon taxScenario 4A carbon tax is levied at a rate of RMB 30/tCO2.
Scenario 5A carbon tax is levied at a rate of RMB 50/tCO2.
Scenario 6A carbon tax is levied at a rate of RMB 150/tCO2.
Emission costs incorporated into transportation costsScenario 7The carbon pricing level is taken as RMB 300/tCO2.
Scenario 8The carbon pricing level is taken as RMB 900/tCO2.
Scenario 9The carbon pricing level is taken as RMB 1500/tCO2.
Tariff subsidy policyScenario 10Subsidize RMB 150/TEU for containerized transport by rail.
Scenario 11Subsidize RMB 250/TEU for containerized transport by rail.
Scenario 12A subsidy of RMB 150/TEU is provided for containerized transport via rail and waterway.
Scenario 13A subsidy of RMB 250/TEU is provided for containerized transport via rail and waterway.
Table 4. System simulation results in 2027.
Simulated Values for 2027Carbon Emissions
/Ten Thousand tCO2
Energy Consumption
/Ten Thousand TCE
Container Throughput
/Ten Thousand TEU
1094504.622752
Disclaimer/Publisher’s Note: The statements, opinions and data contained in all publications are solely those of the individual author(s) and contributor(s) and not of MDPI and/or the editor(s). MDPI and/or the editor(s) disclaim responsibility for any injury to people or property resulting from any ideas, methods, instructions or products referred to in the content.

