Article

Comprehensive Evaluation of the Resilience of China’s Oil and Gas Industry Chain: Analysis and Thinking from Multiple Perspectives

School of Economics and Management, Northeast Petroleum University, Daqing 163318, China
*
Author to whom correspondence should be addressed.
Sustainability 2025, 17(14), 6505; https://doi.org/10.3390/su17146505
Submission received: 10 June 2025 / Revised: 12 July 2025 / Accepted: 14 July 2025 / Published: 16 July 2025

Abstract

Enhancing the resilience of the oil and gas industry chain is essential for achieving sustainable energy development amid global industrial restructuring and the accelerating low-carbon transformation. This study identifies the core contradictions in the development of China’s OGI and constructs a comprehensive evaluation index system to assess the resilience of the industry from the four sustainability-aligned dimensions of resistance, recovery, innovation, and transformation. Using the entropy weight comprehensive evaluation model, obstacle degree model, and coupling coordination degree model, the resilience performance of China’s OGI chain is evaluated from 2001 to 2022. The results show a significant upward trend in overall resilience, with evident stage characteristics. Resistance remains relatively stable, recovery shows the most improvement, innovation steadily increases, and transformation accelerates after 2019, particularly in response to China’s dual carbon goals. Key barriers include limited CCUS deployment and insufficient downstream innovation capacity. The improved coupling coordination among resilience subsystems highlights enhanced systemic synergy. These findings offer valuable implications for strengthening the sustainability and security of energy supply chains under climate and geopolitical pressures.

1. Introduction

Driven by rising international trade protectionism and escalating geopolitical tensions, the global energy market has experienced severe volatility, with external uncertainties intensifying and crises occurring frequently. The global oil and gas industry (OGI) chain is undergoing significant disruptions and is being rapidly restructured. China’s OGI is currently facing numerous challenges. First, China has a high degree of dependence on foreign OGI resources, making it highly susceptible to fluctuations in the international oil and gas market. Second, China’s domestic energy supply and demand system is undergoing a rapid transformation. As a foundational industry critical to national economic and social development, the OGI sector is constantly exposed to unforeseeable risks and challenges posed by various “black swan” events during this period of change. The critical role of the OGI as the “anchor” of national energy security is becoming increasingly prominent. Scientifically assessing the resilience level of the OGI chain, deeply revealing the patterns of resilience changes, and scientifically planning development pathways are of great significance for enhancing energy security, ecological security, and industrial security.
Resilience theory is widely applied across multiple fields, including ecology [1], psychology, disaster science, and economics [2]. The conceptual framework and research framework for system resilience are relatively well-established. System resilience exhibits the following characteristics: (1) the system can withstand a series of changes while maintaining control over its functions and structure, i.e., equilibrium; (2) the system has the ability to self-organize, i.e., self-organization [3]; (3) the system possesses the capacity to establish and promote learning and adaptation [4]. Based on these characteristics, a fundamental theoretical framework for resilience research has been established. Walker (2004) proposed the “3R” theoretical framework, which includes resistance, recovery, and creativity [5]. Martin (2012) expanded this into a “4R” analytical framework, encompassing resistance, recovery, renewal, and repositioning [6].
The resilience of industrial chains is a new field of research in economic resilience. Analyzed from multiple dimensions, such as supply and demand chains [7], value chains [8], and enterprise chains [9], global industrial chains and value chains are developing in the direction of “regionalization,” “segmentation,” “localization,” and “digitalization” [10]. The risk of international “chain breaks” is intensifying, and global industrial chains and value chains are in a state of unbalanced development and are accelerating their restructuring [3,11].
Research findings in the fields of resilience measurement, evolutionary patterns, and influencing factors are relatively abundant. Resilience measurement methods can be categorized into three types: single-indicator methods, sensitivity analysis methods, and comprehensive analysis methods. Comprehensive analysis methods are widely applied, including the coefficient of variation comprehensive evaluation method [12], the dynamic combination weighting–TOPSIS method [13,14,15,16], the dynamic evaluation of basic gray correlation degrees [17], and the entropy value comprehensive evaluation method [18,19]. Regarding the evolutionary patterns of industrial chain resilience, the main methods include kernel density estimation, Dagum Gini coefficient decomposition, the σtest, and the Theil index. In terms of system association and attribution in industrial chain resilience, the main methods used are the coupling coordination model and the multi-matrix autoregressive model, which are used to analyze internal system associations and inter-system associations [20,21].
In the OGI field, scholars have concentrated on diverse aspects such as the resource curse and industrial development issues [22], the driving forces of industrial development [23], and the evolutionary paths of industrial development [24]. Additionally, they have explored the return on energy investment in the OGI [25], ecological benefit evaluation and the analysis of influencing factors of the OGI [26], the impact assessment of carbon emission reduction constraints on China’s OGI development [27], the relationship between green financial assets and petroleum industry development [28], and supply–demand forecasts for the OGI under different scenarios [29]. However, research on the OGI from the perspective of resilience remains underdeveloped. For instance, Wu Wenjie (2024) [30] applied the entropy method to measure the resilience level of the oil industry and its supply chain from 2002 to 2022. Furthermore, the DEMATEL-ISM model was employed to identify the key factors influencing resilience. External indicators such as GDP and GDP per capita have been used as critical metrics for assessing the economic resilience of the oil industry [30].
The primary objective of this study is to establish a robust theoretical foundation for an evaluation framework and employ rigorous scientific methods to conduct a comprehensive assessment of the resilience of China’s OGI chain. The marginal contributions of this paper are as follows:
(1) Based on Martin’s “4R” resilience theory framework, a comprehensive evaluation indicator system for the resilience of the OGI is constructed from four dimensions: resistance, recovery, innovation, and transformation. Based on the principles of resilience formation, it identifies the primary risk sources and impact points within the oil and gas industry chain, and develops a set of secondary and tertiary indicators for the multi-level evaluation system.
(2) An objective weighting method is applied to build a suite of analytical models, including a comprehensive evaluation model, an obstacle degree model, and a coupling coordination degree model, thereby enabling a systematic diagnosis of the resilience level of China’s OGI chain.
(3) A multi-dimensional assessment of the resilience of China’s OGI chain is conducted for the period from 2001 to 2022. The study systematically analyzes key obstacle factors, the severity of their occurrence, and the structural causes that constrain improvements in resilience.

2. Materials and Methods

2.1. Comprehensive Evaluation Index System for Resilience of OGI

Based on Martin’s “4R” resilience analysis framework, an evaluation index system for the resilience of the oil and gas industry (OGI) chain is constructed across four dimensions: resistance, recovery, innovation, and transformation. Drawing on relevant research findings and adhering to the principles of comprehensiveness, scientific rigor, representativeness, and data availability, the system includes 4 first-level indicators, 13 second-level indicators, and 35 third-level indicators. This comprehensive evaluation framework for OGI chain resilience is detailed in Table 1 [31,32].
The indicators were selected based on the following considerations:
(1) Resistance Dimension: Resistance refers to a system’s ability to maintain stability and continuous operation in the face of external shocks and disturbances—that is, its capacity to cope with uncertainty. Over the past two decades, China’s oil and gas industry (OGI) has encountered several major challenges arising from risk shocks, including insufficient domestic supply, high external dependency, import shortages, and price volatility caused by fluctuations in the international market. Additional pressures include the industrial chain impacts of the energy structure transition and the dual carbon control targets (i.e., total carbon emissions and carbon intensity).
In response, this study identifies three secondary indicators under the resistance dimension—resource guarantee capability, product supply capability, and price buffer capability—which collectively reflect the OGI chain’s capacity to withstand external shocks. The ability to manage carbon emission constraints is discussed under the transformation dimension.
From the perspective of energy security and the “two markets (domestic market and international market)”, this article selects four level 3 indicators to measure the resource security capacity of the OGI: recoverable reserves of oil, recoverable reserves of natural gas, dependence on oil imports, and dependence on natural gas imports.
Scholars usually choose to use the “number of importing countries” and “import concentration” to reflect an OGI’s resistance to imported crises. Although such indicators can reflect the degree of risk, they cannot accurately reflect the ability to cope with risks. Therefore, this article chooses to use “Price buffering capacity of upstream and downstream of the industrial chain” to reflect the OGI’s ability to resist huge shocks caused by import shortages or international oil and gas price fluctuations.
P r i c e   b u f f e r   c a p a c i t y   o f   u p s t r e a m   i n d u s t r y   c h a i n = U p s t r e a m   p r i c e   i n d e x   o f   t h e   i n d u s t r i a l   c h a i n I n t e r n a t i o n a l   o i l   p r i c e   f l u c t u a t i o n s
P r i c e   b u f f e r   c a p a c i t y   o f   d o w n s t r e a m   i n d u s t r y   c h a i n = D o w n s t r e a m   p r i c e   i n d e x   o f   t h e   i n d u s t r i a l   c h a i n I n t e r n a t i o n a l   o i l   p r i c e   f l u c t u a t i o n s
(2) Recovery Dimension: Recovery refers to the ability of the OGI chain to rapidly return to normal operations after experiencing a shock. Industrial foundation, factor endowments, investment intensity, and economic performance form the basic conditions for the industrial chain to regain equilibrium following disruptions. This study selects four secondary indicators and eleven tertiary indicators to reflect the OGI chain’s system restoration capabilities.
(3) Innovation Dimension: Maintaining technological innovation capacity is essential for achieving dynamic equilibrium in industrial development. When confronted with challenges and opportunities, the OGI chain can enhance its sustainability and competitiveness through technological, product, and managerial innovations. The selected secondary indicators under this dimension include innovation input, innovation output, and technological innovation.
(4) Transformation Dimension: Transformation reflects the OGI chain’s ability to proactively adjust its industrial structure and achieve upgrading in response to changes in the external environment and internal development needs. This study identifies three secondary indicators—structural transformation, low-carbon transformation, and industrial chain extension and integration—as well as nine tertiary indicators to capture the transformation capacity of the OGI chain.
Drawing on the “14th Five-Year Plan for a Modern Energy System” and the reform and development practices of domestic and international energy industries, the OGI chain demonstrates several key trends: raw materialization, low-carbonization, integration, diversification, digitalization, and toolization. This study focuses on three major aspects: raw materialization, low-carbonization, and integration. Specifically, raw materialization is used to reflect structural transformation; under the “dual control” system of carbon emissions, seven indicators—including carbon dioxide emissions, emission intensity, and annual CO2 storage through CCUS—are selected to reflect the level of decarbonization. The number of enterprises extending downstream within the industrial chain is used to indicate the degree of integration in terms of industrial development.

2.2. Evaluation Method

2.2.1. Resilience Comprehensive Evaluation Model

The key to comprehensive evaluation of multiple indicators lies in the reasonable determination of indicator weights to reflect the importance of each indicator to the overall system. There are two main methods for weight setting: the subjective weighting method and the objective weighting method. In order to avoid the influence of human subjective bias, this paper chooses the objective weighting method. Common objective weighting methods include the entropy weight method, mean square error method, and dispersion method. The entropy weight method was chosen to determine the indicator weights.
The entropy weight method is an objective weighting method based on information entropy theory. In multi-attribute decision analysis, different indicators carry different amounts of information and have different degrees of influence on the overall evaluation results. The core idea of this method is to determine the indicator weight by calculating the degree of discreteness (information entropy) of the indicator data. The smaller the entropy value, the greater the amount of information it carries.
(1) Data standardization. The original data is standardized and converted into dimensionless pure values to eliminate the dimensional effects between different indicators. Among them is the original value of the j-th indicator in the i-th year, as are the minimum and maximum values of the j-th indicator, respectively, which are the standardized data.
For positive indicators (maximum), the normalized processing formula is
z i j = x i j x j min x j min
For negative indicators (maximum), the normalized processing formula is
z i j = x j max x i j x j max x j min
For intermediate indicators, the normalized processing formula is
z i j = 1 a x i j max a x j min ,   x j max b , x i j < a 1 , a x i j b 1 x i j b max a x j min ,     x j max b , x i j > b
(2) Calculate the proportion of the value of the i-th object under the j-th indicator to the indicator Pij. The standardized matrix Z at this time is
Z = z 11 z 12 z 1 m z 21 z 22 z 2 m z n 1 z n 2 z n m
Then
P i j = z i j / i = 1 n z i j ,   ( j = 1,2 , , m )
(3) Calculate the entropy value Ej of the j-th indicator. When Pij = 0, Pijln Pij = 0.
E j = 1 ln n i = 1 n P i j l n P i j , ( j = 1,2 , , m )
(4) Calculate the coefficient of variation Gj of the j-th indicator
G j = 1 E j
(5) Calculate the weight Wj of the j-th indicator
W j = G j / j = 1 m G j
Calculate the comprehensive resilience score of the OGI
F i = i = 1 m w j z i j
F z = F a + F b + F c + F d
In these equations, Fz represents the comprehensive resilience level of the OGI chain, and Fa, Fb, Fc, and Fd represent the scores of the four dimensions of resistance, recovery, innovation, and transformation, respectively.

2.2.2. Obstacle Factor Diagnosis Model

In order to better explore the key factors that inhibit the improvement of the resilience level of the OGI chain, the influence of each subsystem and each indicator within each subsystem on the improvement of the resilience of China’s OGI chain was examined, and the key factors affecting the improvement of the resilience of the industry chain were identified.
Referring to relevant research findings, this paper selects the obstacle degree model to identify the shortcomings that inhibit its development [33,34].
The obstacle model is a method to identify key constraints by quantifying the degree of deviation of each indicator from the system goal. The core idea is that the greater the gap between the current value of a certain indicator and the ideal target, and the higher the importance (weight) of the indicator in the system, the stronger the obstacle effect of the indicator on the development of the system.
The method of using the obstacle model to identify the main obstacles to improving the resilience of China’s OGI is as follows:
(1) Calculate the factor contribution F, which reflects the expected contribution of the indicator to the system goal, usually equal to the weight Wj.
(2) Calculate the indicator deviation, which represents the gap between the actual value of the indicator and the optimal value.
I = 1 Z
(3) Calculate the obstacle degree Oij of each layer indicator.
O i j = W j I i j j = 1 n W j I i j

2.2.3. Coupling Coordination Degree Model (CCD Model)

According to the research of Martin, Ahmadi, and others, from an evolutionary perspective, the resilience of the industrial chain is a dynamic evolutionary process of interaction and self-regulation among various links, elements, and subsystems within the industrial system under the impact of external risks. From the perspective of resilience genesis, the resistance, recovery, innovation, and transformation capabilities—formed by the industrial chain in the face of risk shocks—promote and restrict each other, and have a typical interactive coupling relationship. Referring to relevant research findings, the CCD model has been used to analyze the relevant coupling coordination relationship between the subsystems in the urban resilience system and the copper industry resilience system [35]. This paper introduces a coupling coordination model to evaluate and grade the coupling relationships between the resistance, resilience, innovation, and transformation capabilities of the resilience system of the OGI chain.
The CCD model is mainly used to analyze the coordinated development level of things. Generally, there are mutual influences and couplings between multiple subsystems.
(1) Calculate the coupling degree C
C = i = 1 n U i 1 n i = 1 n U i n 1 n
where the number of subsystems is the value of each subsystem, and the distribution range is [0, 1]. That is, after standardization, the coupling degree C value range is also [0, 1]. The larger the C value, the smaller the discreteness between subsystems and the higher the coupling degree; conversely, the lower the coupling degree between subsystems.
(2) Calculate the comprehensive coordination index T
T = i = 1 n α i × U i       ,     i = 1 n α i = 1
where α i is the weight of the i-th subsystem, which is generally set to the same weight.
(3) Calculate CCD index D
D = C × T

2.3. Data Sources and Processing

The indicator data required for this article mainly come from the “China Statistical Yearbook”, “China Industrial Statistical Yearbook”, “China Energy Statistical Yearbook”, “China Environmental Statistical Yearbook”, and “China Climate Change Yearbook” from the 2002 to 2023 editions. Among them, the data related to carbon emissions in the OGI comes from the China Emission Accounts and Datasets (CEADs), and the data related to carbon capture, utilization, and storage (CCUS) in the OGI comes from the CCUS Project Database (2024) of the International Energy Agency (IEA). Since some indicators were missing during the data collection process, a linear regression interpolation method was used to supplement them.

3. Results Analysis

3.1. Analysis of the Results of the Resilience Evaluation of China’s OGI Chain

3.1.1. Comprehensive Index Analysis

Equations (3)–(12) are applied to calculate the comprehensive evaluation indexes of China’s OGI chain resilience, and the results are shown in Figure 1.
The resilience of China’s oil and gas industry (OGI) chain has exhibited a fluctuating upward trend over the past two decades. The comprehensive resilience index rose from 0.23652 in 2001 to 0.72977 in 2022, with an average annual growth rate of 5.51%, indicating a sustained improvement in the resilience of China’s OGI chain.
To further analyze the evolution of the resilience index, the period from 2001 to 2022 is divided into five stages, aligned with China’s national Five-Year Plans for economic and social development:
Phase I (2001–2005) corresponds to the 10th Five-Year Plan. During this period, the resilience of the OGI chain exhibited a “V”-shaped trajectory—initially declining and then rebounding. This was primarily due to the rapid growth in domestic demand for oil and gas resources driven by accelerated economic expansion. However, the sharp increase in international oil prices in 2003 exerted considerable supply–demand and cost pressures on the domestic industry, leading to a decline in resilience. In response, China intensified its efforts in oil and gas exploration and development while actively expanding overseas cooperation. Meanwhile, with China’s accession to the World Trade Organization, the OGI sector gradually opened up to international markets. The three major state-owned enterprises—China National Petroleum Corporation (CNPC), China Petrochemical Corporation (SINOPEC), and China National Offshore Oil Corporation (CNOOC)—completed their shareholding reforms and were listed on overseas stock markets. As market competition diversified, the resilience of the industry improved significantly.
Phase II (2006–2010) corresponds to the 11th Five-Year Plan. During this period, the resilience of China’s OGI chain steadily improved. With continued economic growth, demand for oil surged, leading to a rising dependence on foreign oil and intensifying the imbalance between domestic crude oil supply and demand. To mitigate the risks associated with oil shortages, China began accelerating the construction of a national oil reserve system. The country’s first oil reserve base was completed in 2006, and the National Petroleum Reserve Center was officially established in 2007. This strategic reserve system enhanced the industry’s capacity to respond to sharp fluctuations in international oil prices. This is evidenced by the resilience performance in 2008: although global oil prices reached historic highs before plummeting sharply, the resilience of China’s OGI chain continued to improve. Meanwhile, domestic exploration achieved significant breakthroughs, and the refining and petrochemical industries experienced rapid expansion—both of which were key drivers of the sustained improvement in resilience.
Phase III (2011–2015) corresponds to the 12th Five-Year Plan. During this period, the resilience of China’s OGI chain once again followed a “V”-shaped pattern, first declining and then recovering. The decline in 2012 was primarily due to persistently low international oil prices, which created uncertainty in investment decisions. Additionally, China’s economic growth slowed, leading to a deceleration in oil and gas demand growth and a decline in the overall profitability of the domestic OGI. However, from 2013 to 2015, resilience steadily improved as the industry entered a phase of transformation and upgrading. First, market-oriented reforms in the oil and gas sector deepened, including the relaxation of price controls, which promoted competition and improved resource allocation efficiency. Second, significant breakthroughs were made in the exploration and development of unconventional oil and gas resources such as shale gas, creating new growth drivers. Third, international cooperation became more diversified, expanding beyond traditional regions like the Middle East and Africa to include new partnerships in Latin America, Central Asia, and other regions.
Phase IV (2016–2020) corresponds to the 13th Five-Year Plan. After a slight decline in 2016, the resilience of China’s OGI chain showed a generally upward trend throughout this period. Frequent fluctuations in international oil prices introduced operational uncertainties for oil and gas enterprises. Meanwhile, the global energy transition accelerated, and the rapid rise of new energy sources intensified competitive pressure on the traditional OGI sector. Domestically, slowing economic growth and weak demand momentum further constrained the industry. The “dual carbon” goals (carbon peaking and carbon neutrality) placed additional limits on carbon emissions from the OGI. Despite these challenges, the industry’s resilience continued to improve, driven by several key factors: (1) structural adjustments and a shift toward greener development, including a gradual increase in natural gas consumption; (2) expanded oil and gas exploration into deep-sea and deep-reservoir areas, enhancing supply capacity; and (3) continuous improvement in technological innovation, with advances in intelligence and digitalization across the industry.
Phase V (2021–2022) corresponds to the initial years of the 14th Five-Year Plan. During this period, the global energy transition accelerated significantly, and the large-scale development of renewable energy exerted a substitution effect on the OGI. In addition, increasingly complex international geopolitical tensions posed challenges to oil and gas supply security. Domestically, the pursuit of carbon peak and carbon neutrality targets necessitated urgent reductions in carbon emissions within the industry. At the same time, market competition intensified, requiring enterprises to continually enhance their competitiveness. Despite these pressures, the resilience of the OGI chain continued to improve, primarily due to: (1) the National Petroleum Reserve Center fully assuming its emergency management role; (2) the rapid development of carbon capture, utilization, and storage (CCUS) technologies; and (3) a shift in oil demand, with chemical feedstocks becoming a primary driver, and natural gas consumption steadily increasing across industrial, residential, and power generation sectors.

3.1.2. Multidimensional Index Analysis

Equations (3)–(12) are applied to calculate the resilience index scores of different dimensions of China’s OGI chain, as shown in Figure 2.
In Figure 2, the overall dimensions of China’s OGI resilience showed a fluctuating upward trend from 2001 to 2022.
The resistance index remained relatively stable throughout the period, indicating that China’s oil and gas industry experienced steady improvements in resource security, product supply capacity, and price buffering capability from 2001 to 2022. Over the past 22 years, rapid economic growth has significantly increased demand for oil and gas resources, making resource shortages more acute. However, China’s strategy of leveraging both domestic and international resources and markets to address domestic supply gaps has proven effective. Despite a consistently high level of dependence on foreign oil and gas, the overall supply of resources and products has been reliably maintained. Moreover, despite considerable fluctuations in international oil prices over the past two decades, the oil and gas industrial chain has demonstrated a strong ability to buffer these price shocks, thereby minimizing their impact on downstream industries.
The recovery index increased significantly, suggesting that from 2001 to 2022, China’s oil and gas industry achieved notable progress in factor allocation, scale expansion, and structural adjustment. These improvements have enhanced the industry’s capacity to maintain stable development in the face of complex and diverse shocks.
The innovation index showed a consistent upward trajectory, indicating substantial growth in innovation input and output across the upstream, midstream, and downstream sectors. This trend highlights innovation as a key endogenous driver for enhancing the overall resilience and competitiveness of the OGI chain.
The transformation index remained relatively stable during most of the period but demonstrated a marked increase after 2019. This shift is primarily attributed to the implementation of China’s “dual carbon” policy, which has accelerated the industry’s transition toward low-carbon development. The transformation includes not only reductions in carbon emissions but also the emergence of new business models in the OGI chain, with carbon capture, utilization, and storage (CCUS) technologies serving as a key example.
To clearly compare the characteristics across different stages, six representative years—2001, 2005, 2010, 2015, 2020, and 2022–were selected to construct a radar chart illustrating the resilience index of China’s OGI chain across different dimensions, as shown in Figure 3.
As shown in Figure 3, the shape of the shaded area changes continuously, indicating that the functional performance of each dimension within the OGI chain’s resilience system is constantly evolving and adapting. The expanding shaded area reflects a substantial enhancement in the overall resilience of the OGI chain, suggesting that its capacity to absorb and mitigate risk shocks has significantly improved over time.

3.2. Key Obstacle Factor Analysis

To identify the key obstacles hindering improvements in the resilience of China’s OGI chain, Equations (13) and (14) were employed to calculate the obstacle degrees across different dimensions from 2001 to 2022. The results are presented in Figure 4.
As shown in Figure 4, the obstacle values across the four dimensions fluctuated between 2001 and 2022. The obstacle degree in the resistance dimension remained relatively stable, with slight increases observed from 2006 to 2011 and again from 2015 to 2022. The recovery dimension exhibited the greatest fluctuation, with a continuous decline between 2001 and 2011, followed by a significant increase from 2012 to 2015. The obstacle degree in the innovation dimension showed an overall downward trend, whereas the transformation dimension experienced a fluctuating upward trend. These patterns delineate two stages: the first from 2001 to 2014, and the second from 2015 to 2021.
In summary, recovery-related obstacles have consistently been the primary factors hindering the improvement of resilience in China’s OGI. Conversely, the overall innovation and development environment of China’s OGI has remained relatively favorable over the past 22 years.
To clarify the key factors affecting resilience improvement in China’s OGI, obstacle factors from 2001 to 2022 were ranked, and the top five key obstacle factors were identified, as presented in Table 2.
From 2001 to 2021, indicator D8 (CCUS) consistently ranked first among the obstacles. China began focusing on carbon dioxide-enhanced oil recovery technology as early as 2000, which can be considered the initial prototype of China’s CCUS technology. However, it was not until the 12th Five-Year Plan period that CCUS was officially designated as a key research and development technology within the OGI. Large-scale and commercial exploration of CCUS technology only commenced after 2016.
Indicator C4 (innovation outcomes in the downstream segment of the industrial chain) ranked second in obstacle severity 15 times during the 16 years from 2001 to 2016. This period marked the golden expansion era for the downstream sector of China’s OGI chain. Driven by rapid economic growth, refining capacity, and sales networks experienced significant growth spurts. However, the market during this period was primarily demand-driven, and the industry’s scientific and technological research capabilities lagged behind the pace of market growth. From 2017 to 2021, indicator A4 (dependence on natural gas imports) surged to second place in the obstacle rankings. This shift is closely linked to the explosive growth of China’s LNG imports after 2016. Whereas natural gas import dependence was less than 2% in 2006, it reached 45.4% by 2021. With continued urban and industrial gas demand growth and pressures from the “dual carbon” transition, this indicator remains a critical focus for long-term monitoring.
Between 2001 and 2021, the third-ranked obstacle indices showed varied frequencies: B11 appeared eight times, B10 four times, and B3 three times. These results suggest that the overall economic efficiency of the OGI and competitive dynamics in the downstream segment constitute major constraints on improving the resilience of the OGI chain, often causing significant fluctuations in resilience.
From 2004 to 2013, indicator D7 appeared six times as the fourth-ranked obstacle and three times as the third-ranked obstacle. Sulfur dioxide (SO2) emissions in China’s OGI are primarily associated with the processing, refining, combustion, storage, and transportation of sour natural gas. This indicates that over the past decade, despite rapid industry growth, the application of low-sulfur technologies has been insufficient to offset emission increases driven by the industry’s expansion.
Overall, the obstacle degree analysis results align well with the actual development trajectory of China’s OGI, demonstrating the reliability of the evaluation.

3.3. Coupling Coordination Analysis

Using Formulas (15)–(17), we calculated the coupling and coordination relationships between the various subsystems of China’s OGI chain resilience. The results are shown in Figure 5.
In Figure 5, the overall coordination of the various subsystems of China’s OGI chain resilience shows a volatile upward trend from 2001 to 2022. For phase-specific feature analysis, a hierarchical study of coupling coordination relationships was conducted.
The natural breakpoint method was applied to classify the resilience coupling coordination degree (CCD) of China’s OGI into five levels, as shown in Table 3: Level I Extremely Incoordination (0 < R < 0.3), Level II Mild Incoordination (0.3 ≤ R < 0.5), Level III Primary Coordination (0.5 ≤ R < 0.7), Level IV Mild Coordination (0.7 ≤ R < 0.9), and Level V High-Quality Coordination (0.9 ≤ R ≤ 1.0).
From 2001 to 2003, the system was in Level I Extremely Incoordination, with CCD values showing a declining trend. From 2004 to 2007, it entered a state of Level II Mild Incoordination but, compared to the previous phase, CCD values overall maintained an upward trend, indicating that the coupling and coordination between subsystems were continuously improving. From 2008 to 2013, the system reached Level III Primary Coordination, but the CCD value showed a declining trend from 2010 to 2013. From 2014 to 2016, the CCD value exhibited significant fluctuations. Due to the declining trend in the CCD value from 2010 to 2013 in the previous cycle, the CCD value in 2014 reverted to Level II. Although the CCD value briefly returned to Level III in 2015, but in 2016, it returned to Level II. From 2017 to 2021, the CCD value rose to Level IV Mild Coordination, with significantly improved coupling coordination among subsystems, indicating that the overall coordination of the OGI chain has improved when facing complex environments and challenges. In 2022, the CCD value exceeded 0.9, with coupling coordination among subsystems reaching Level V High-Quality Coordination.

4. Discussion

This study conducted a comprehensive assessment of the resilience of China’s OGI chain and produced a series of insightful results. Compared with existing research on OGI chain resilience, this study presents both similarities and differences.
The similarities include the use of an objective weighting method to construct a comprehensive evaluation model; integration across different dimensions and time periods; and the observation that, from an overall resilience perspective, China’s OGI chain exhibited a fluctuating upward trend with clear phased characteristics. This indicates that the current OGI chain possesses certain buffering, adaptability, and recovery capabilities when facing various internal and external shocks.
The differences lie in the conceptual interpretation of industrial chain resilience. Unlike Wu Wenjie (2024), who regard indicators such as GDP, per capita GDP, and industrial added value as key factors shaping OGI resilience [14], this paper constructs a comprehensive evaluation index system based primarily on endogenous factors (as shown in Table 1), while considering macroeconomic variables like GDP fluctuations as exogenous shocks. Moreover, this study treats the OGI as an integrated whole, due to the natural coexistence of oil and gas resources, their substitutability in consumption and use, and the shared nature of development, processing, and transportation units. Additionally, national energy industry policies and oil and gas companies’ strategic layouts are generally considered holistically. Studying the OGI as a whole allows for a more accurate reflection of the complementary development between China’s natural gas and oil industries since 2006, fully and comprehensively capturing their resource supply capabilities.
Despite its contributions, this study is not without limitations. The absence of publicly available data on national emergency oil and gas reserves limited the precision of the resilience assessment. Although proxy indicators (e.g., price buffering capacity) were employed, they may not fully capture the dynamic response mechanisms. Furthermore, the study period ends in 2022 due to the unavailability of updated data for 2023–2024, potentially omitting recent developments such as geopolitical shifts or CCUS adoption.

5. Conclusions and Implications

5.1. Research Conclusions

Based on Martin’s “4R” resilience theoretical framework, this study constructs a comprehensive evaluation model using the entropy weight method, obstacle factor analysis, and the coupling coordination degree (CCD) model to assess the resilience of China’s oil and gas industry (OGI) chain from 2001 to 2022. The main conclusions are as follows:
(1)
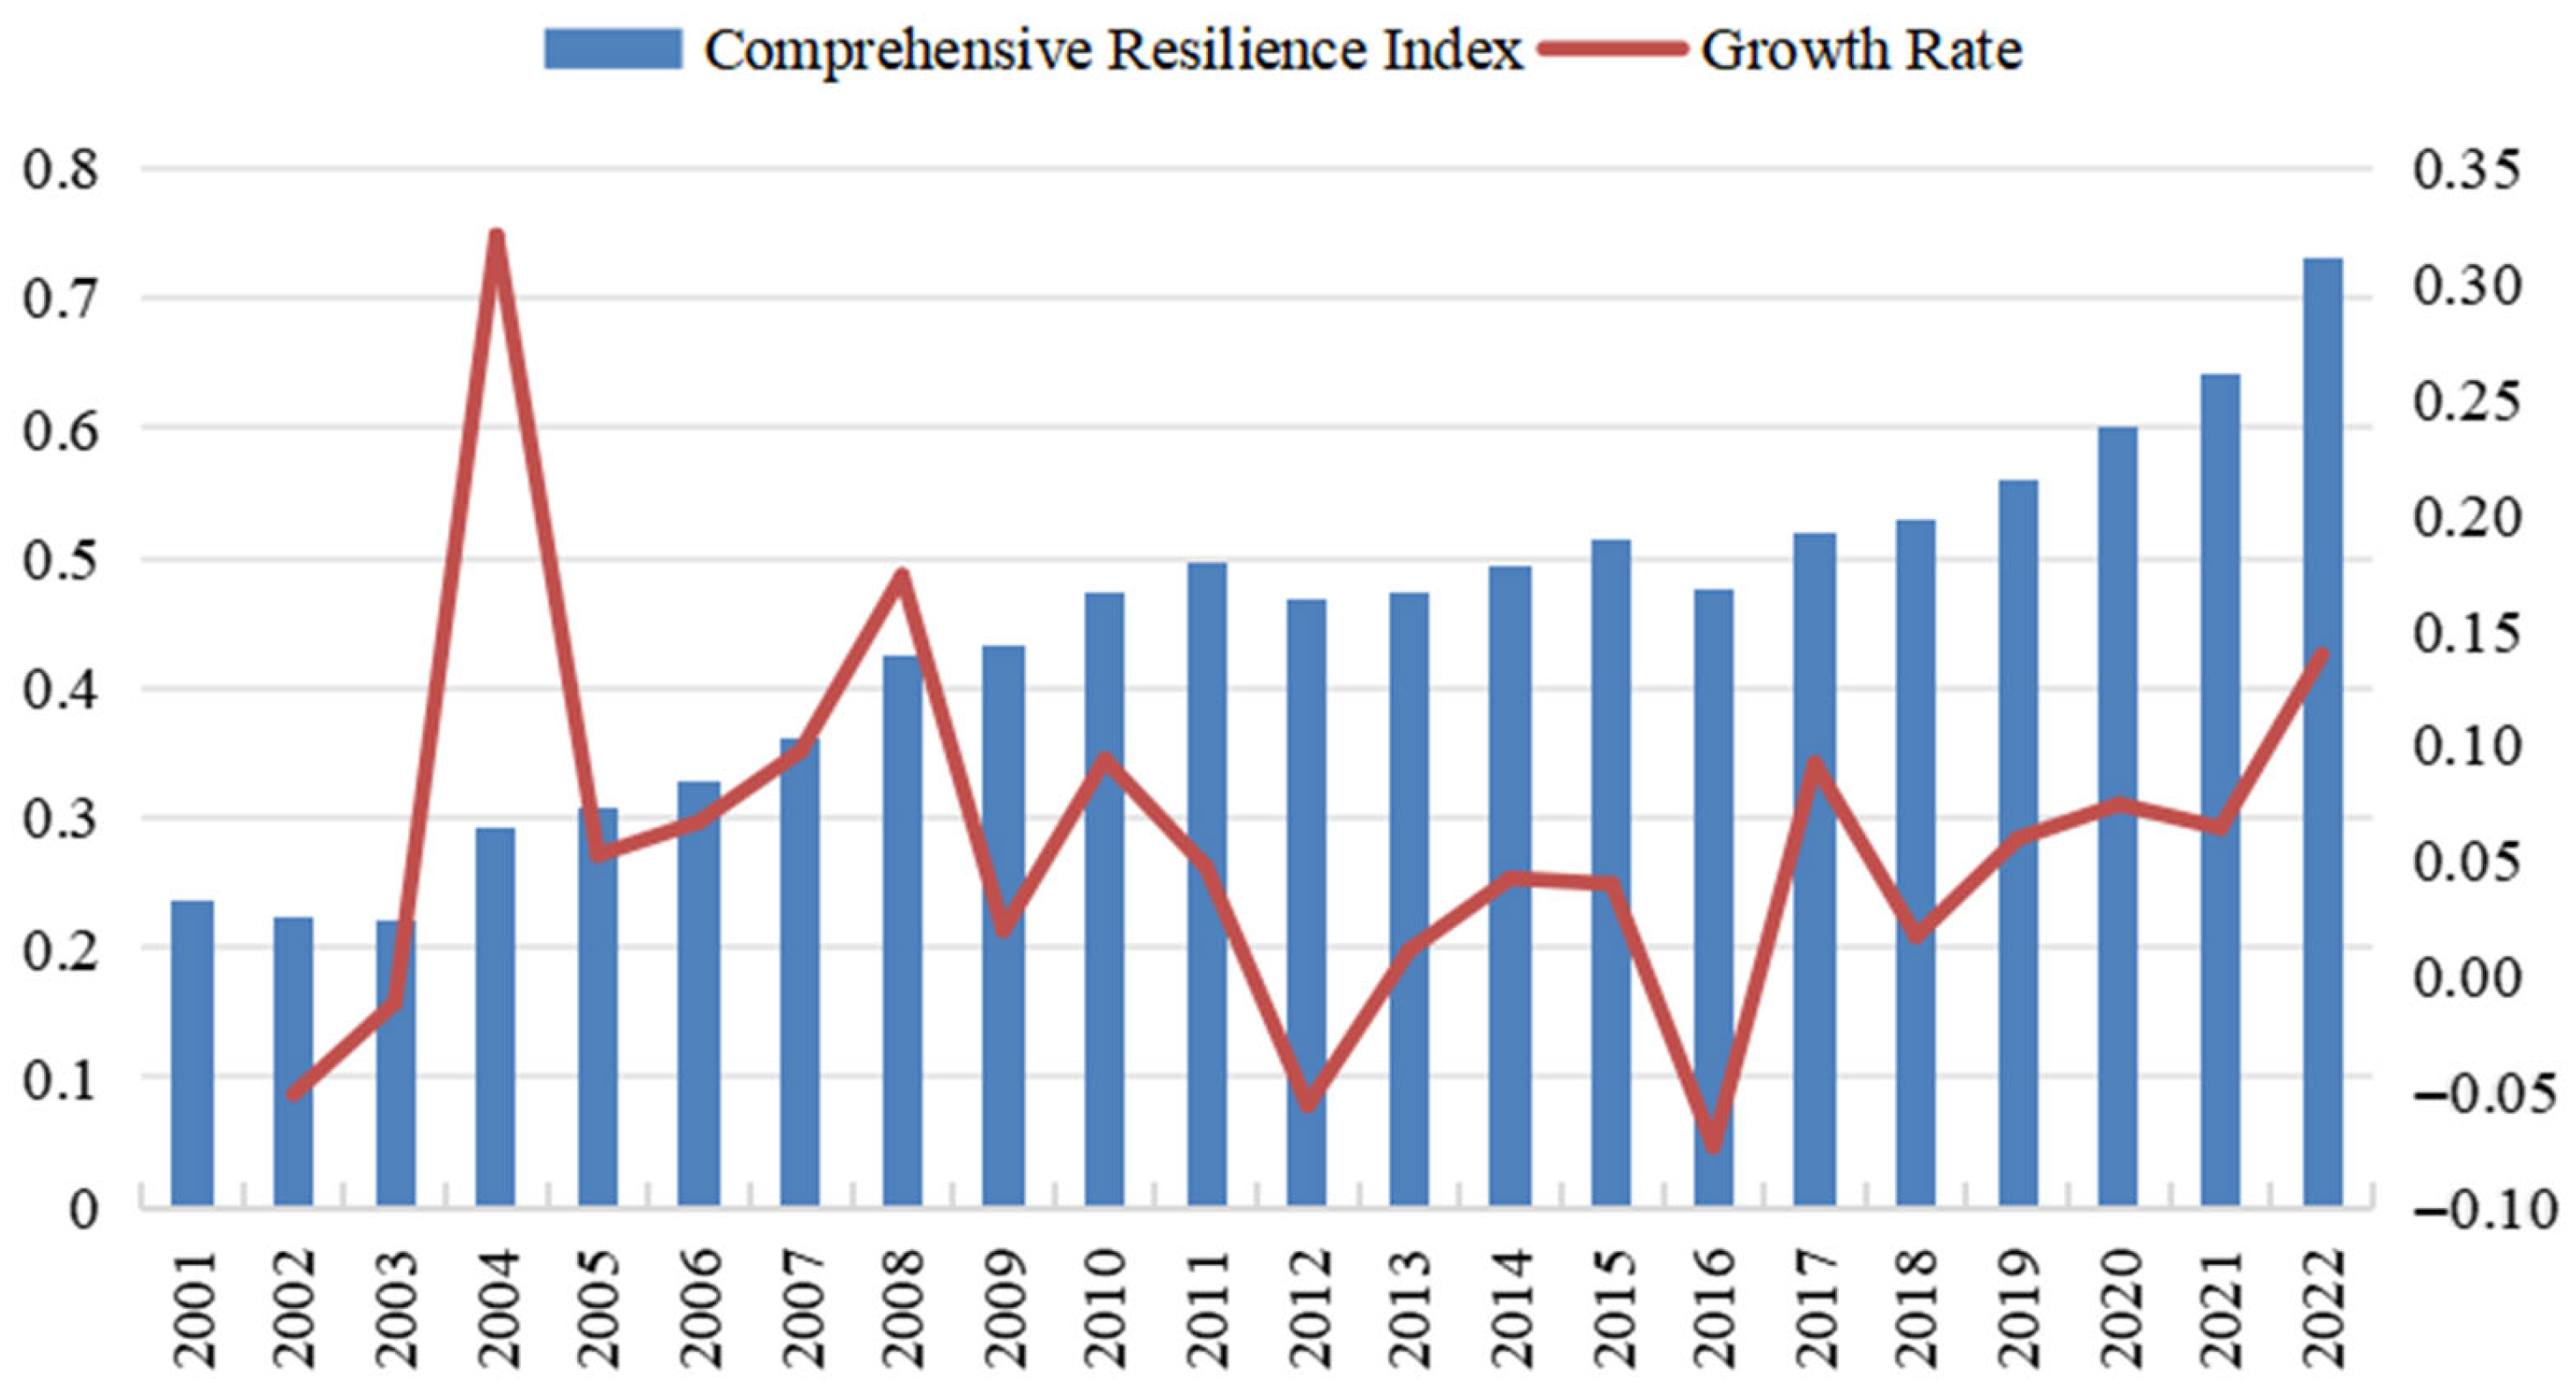
The overall resilience of China’s OGI chain exhibited a sustained upward trend during the study period, rising from 0.23652 in 2001 to 0.72977 in 2022, with an average annual growth rate of 5.51%. Despite experiencing multiple internal adjustments and external shocks, the system’s capacity to absorb and adapt to risks has significantly improved.
(2)
Distinct stage-based patterns emerged in alignment with China’s Five-Year Plan cycles. A “V-shaped” resilience trajectory was observed during the 10th Plan, while the 11th and 12th Plans saw steady gains. Although setbacks occurred in the early years of the 13th and 14th Plans, long-term growth momentum was maintained. These variations highlight the system’s adaptability amid oil price fluctuations, economic transitions, and global crises such as the COVID-19 pandemic.
(3)
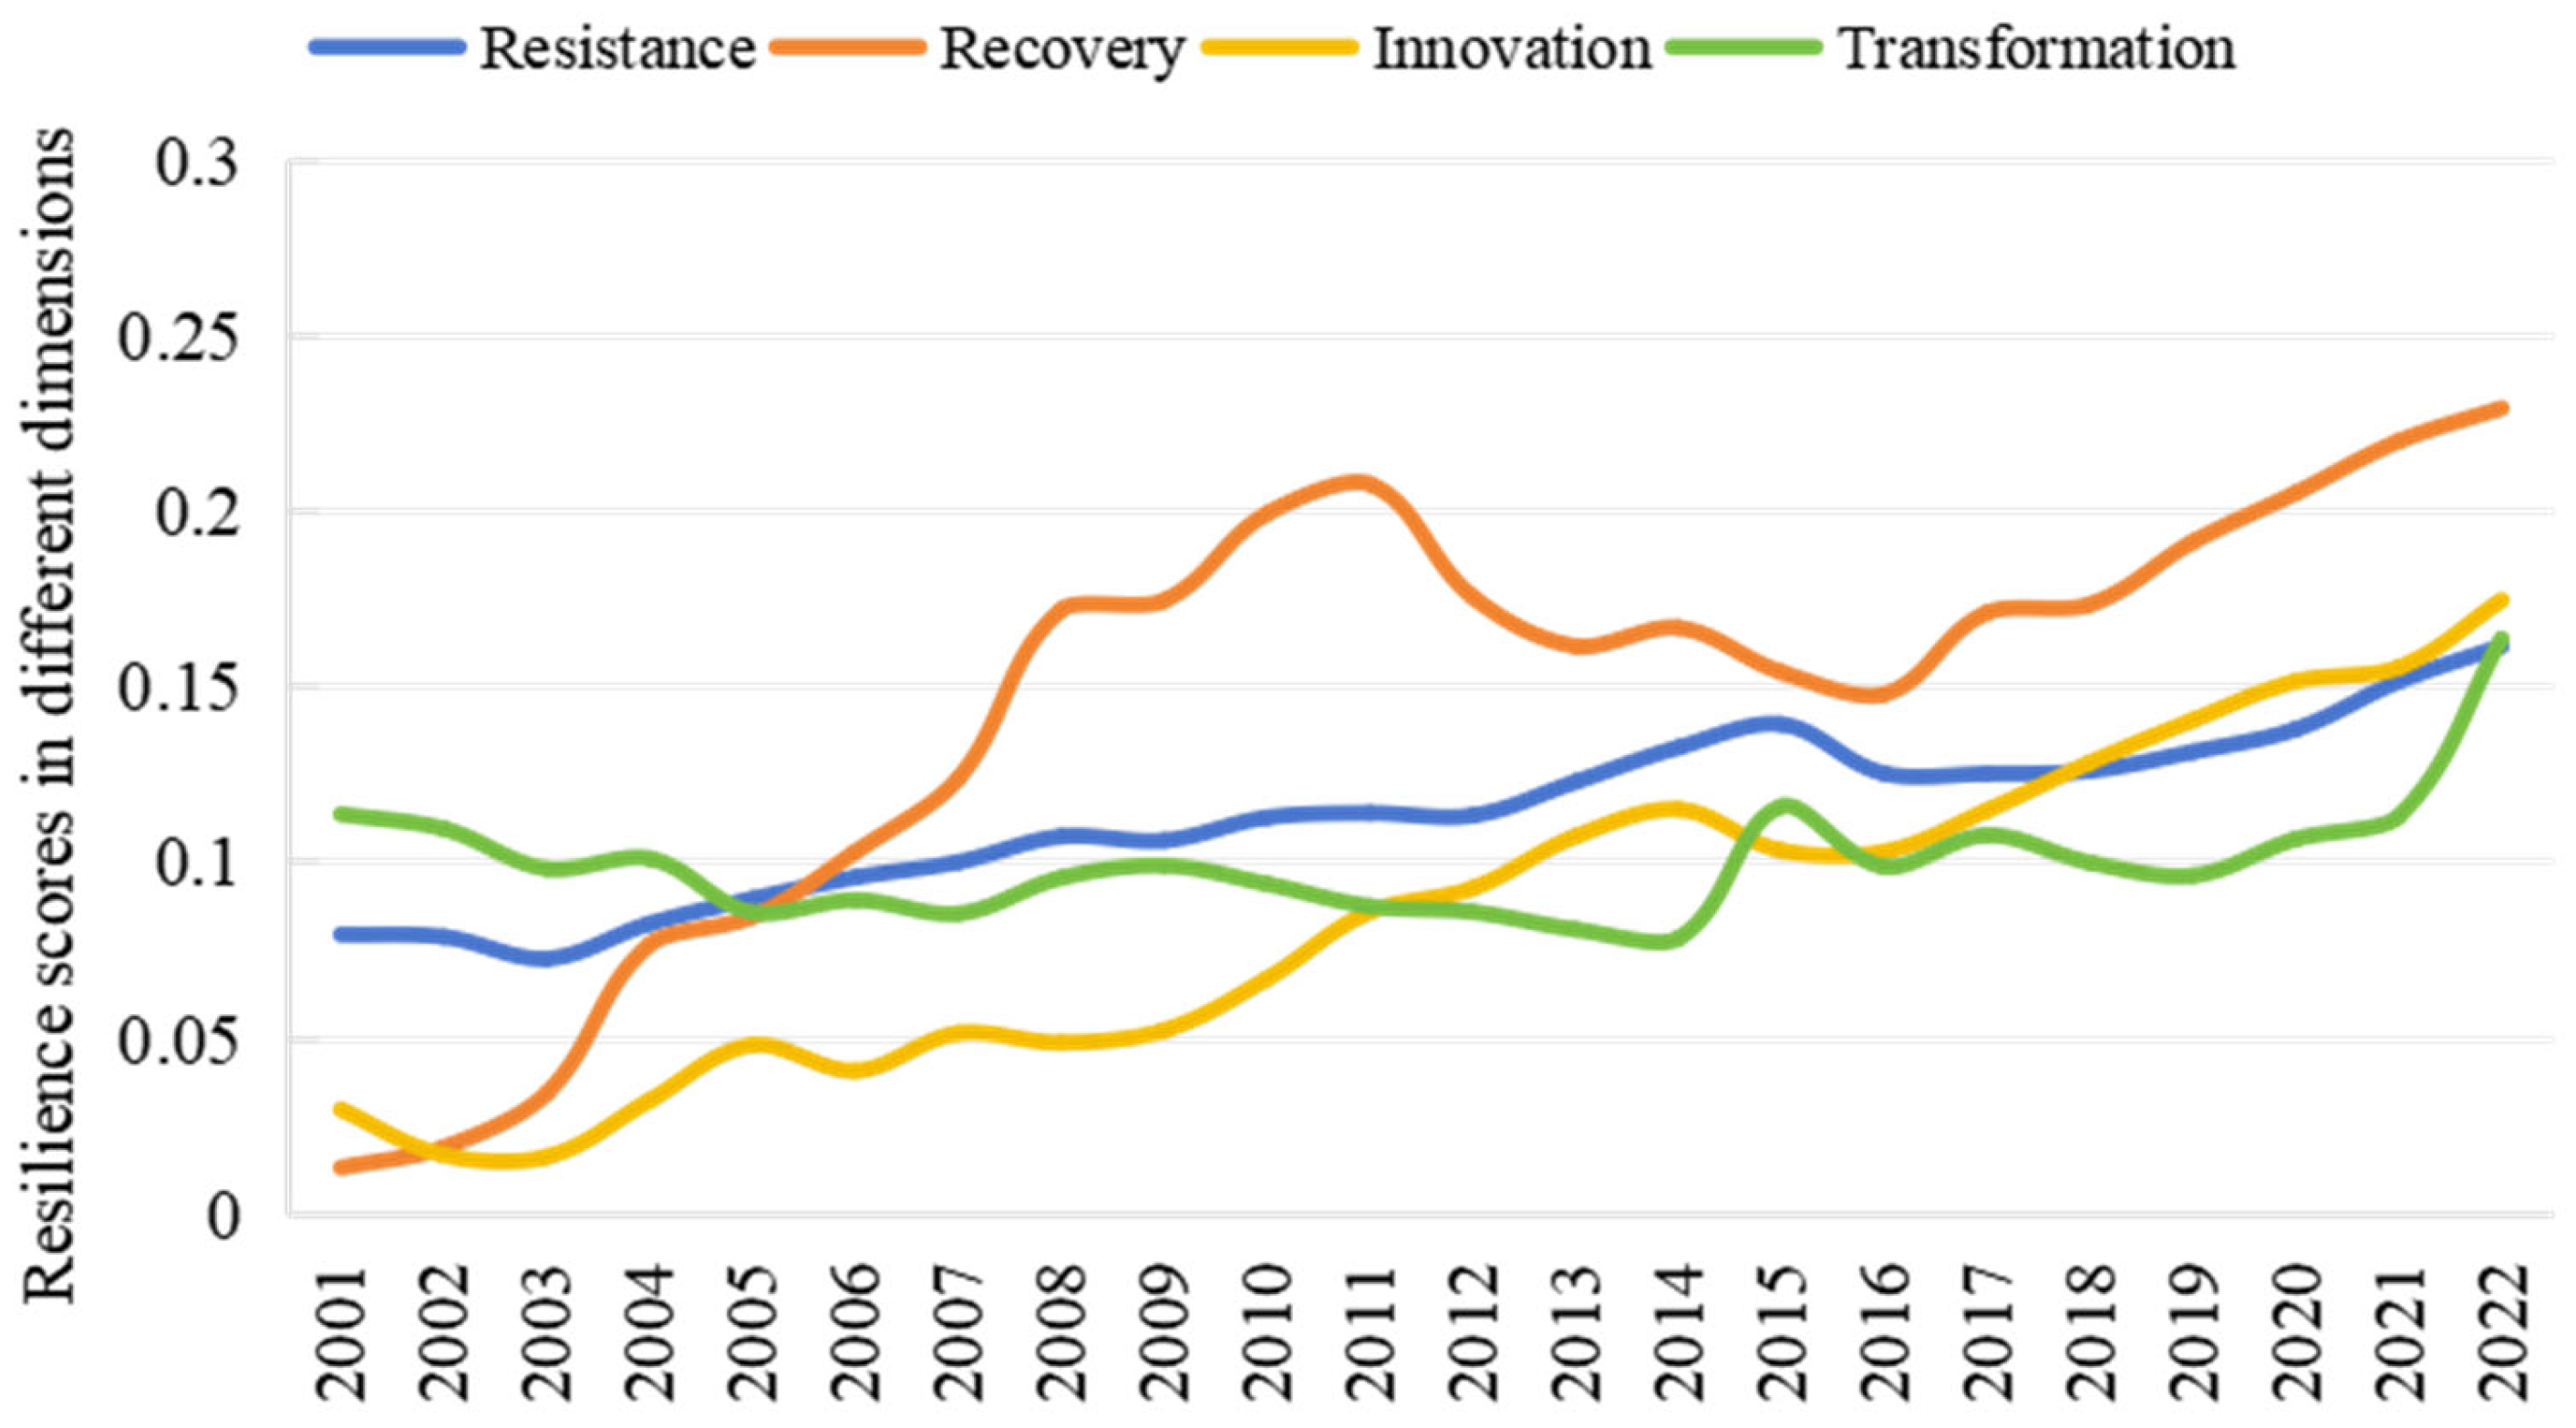
Significant differences in resilience performance were observed across dimensions. Recovery showed the greatest improvement, innovation followed a steady growth path, resistance remained relatively stable, and transformation accelerated after 2019 due to low-carbon development policies. These results reflect advances in technological and structural adjustment, though the capacity to withstand external shocks requires further reinforcement.
(4)
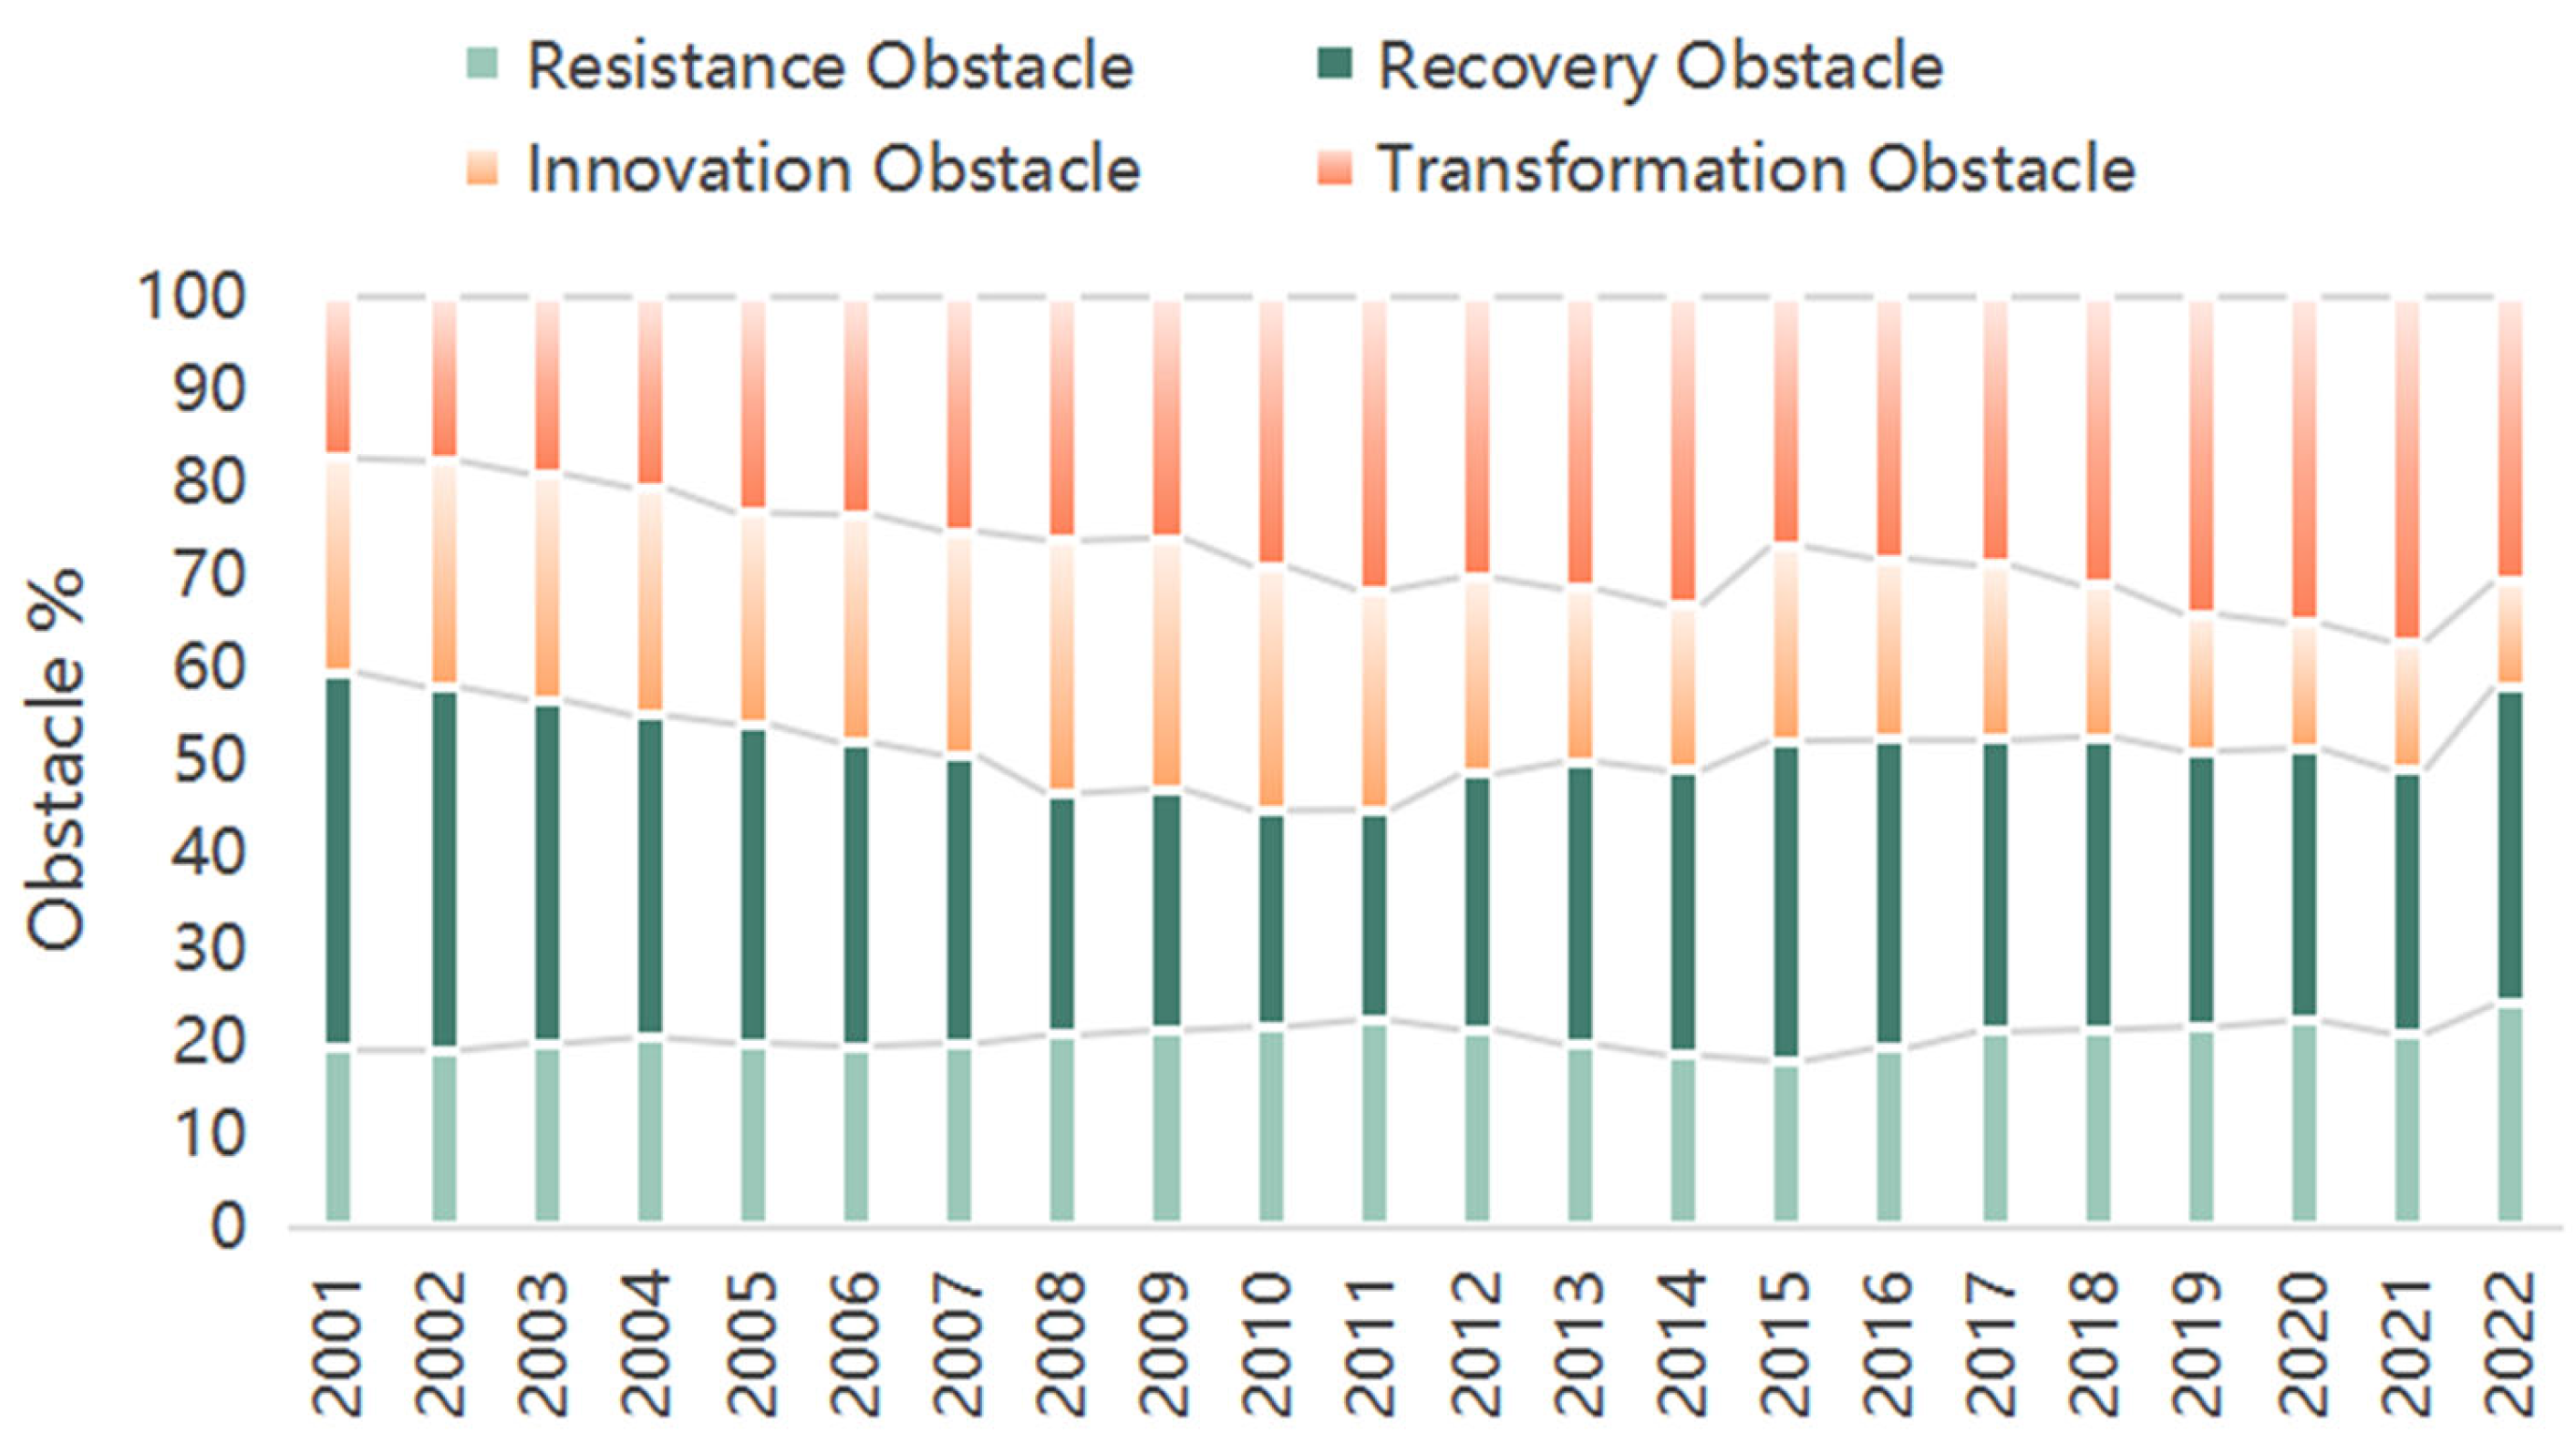
Key obstacles constraining resilience improvement were identified. Recovery capacity remains the most critical bottleneck, particularly in relation to the underdevelopment of CCUS technologies and insufficient innovation in the downstream sector. In addition, rising dependence on natural gas imports and inadequate economic returns across the value chain continue to impede overall resilience enhancement.
(5)
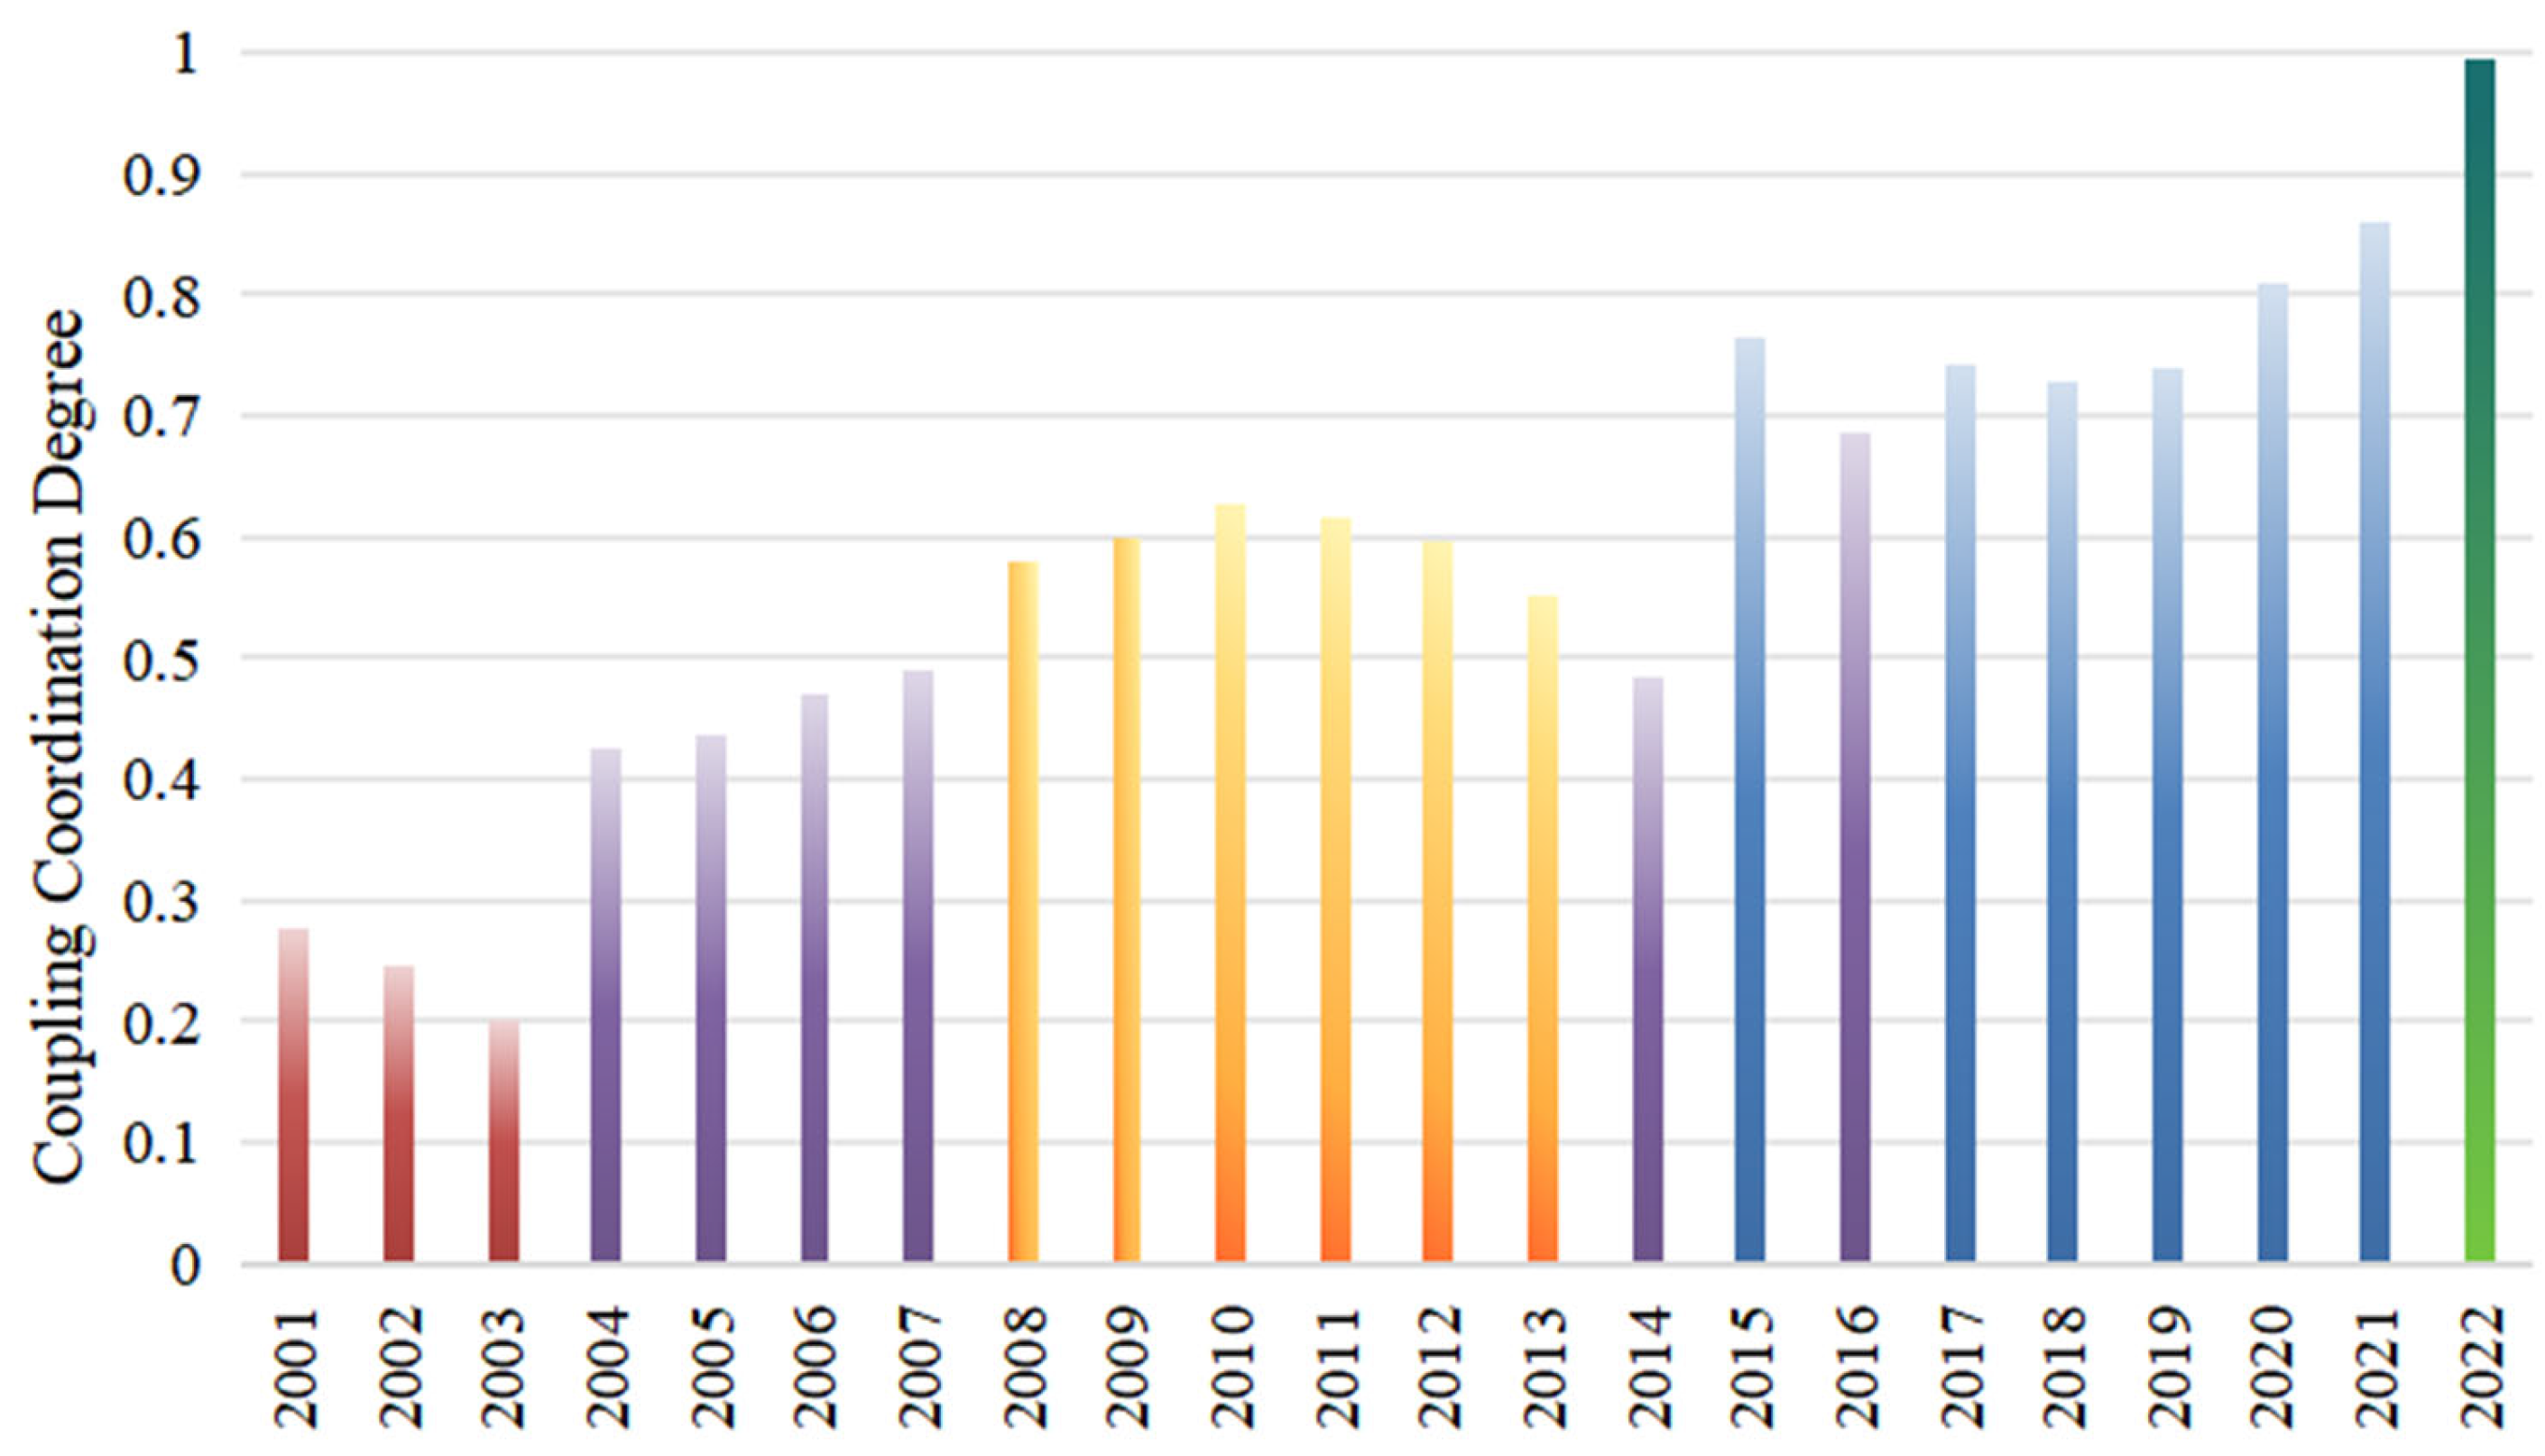
The coupling coordination among resilience subsystems has progressively improved. From 2001 to 2022, the CCD between resistance, recovery, innovation, and transformation evolved from mild imbalance to moderate coordination, indicating enhanced internal synergy and an improved capacity for integrated response to complex and evolving risks.
These findings contribute to the understanding of industrial resilience evolution in the context of energy security and transition, offering valuable insights for policy formulation and strategic planning aimed at strengthening the resilience of critical energy infrastructure.

5.2. Research Implications

Based on the above findings, it is evident that enhancing the resilience of China’s oil and gas industry chain primarily depends on technological innovation and low-carbon transformation. Moreover, government policy support plays a critical role in strengthening industrial resilience. Accordingly, the resilience of the oil and gas industry chain can be improved through the following three pathways:
(1)
Technology-driven upgrading: Foster an integrated upstream and downstream R&D ecosystem, with a particular focus on carbon capture, utilization, and storage (CCUS), digital oilfield technologies, and the development of low-carbon materials.
(2)
Diversification of supply sources: Strategically reduce dependence on imports by expanding domestic reserves and diversifying international procurement channels.
(3)
Governance and policy optimization: Incorporate resilience assessment mechanisms into national energy planning and implement early warning systems for supply chain risks.

5.3. Future Research Directions

Despite the comprehensive assessment of resilience in China’s oil and gas industry chain, several areas remain underexplored and warrant future investigation:
(1)
The Advancement of Resilience Measurement Methods: The current study primarily uses entropy weight-based composite evaluation. However, given the complex networked nature of the OGI chain, future research could incorporate network analysis tools such as network density, centrality, and robustness indicators. The dynamic trade network model proposed by Liu et al. (2025) in the context of agricultural trade offers methodological inspiration [36].
(2)
The Identification of Core Resilience Drivers: Current models focus on multidimensional indicators but lack a statistical identification of causality. Future studies may consider applying the Temporal Exponential Random Graph Model (TERGM) or panel structural equation modeling to identify key internal and external factors influencing resilience [37].
(3)
The Exploration of Differentiated Resilience Enhancement Paths: The OGI chain’s resilience performance varies across different economic cycles. Thus, exploring targeted policy and industrial responses under different scenarios—e.g., demand surges, supply disruptions, or geopolitical shocks—could yield tailored strategies. Comparative case studies or scenario simulations would be valuable.

Author Contributions

Conceptualization, methodology, data curation, software, validation, and writing—review and editing were performed by Y.W. Conceptualization, supervision, methodology, formal analysis, validation, and writing—review and editing were conducted by L.Y. Supervision, formal analysis, validation, and writing—review were completed by X.L. Supervision, formal analysis, and writing—review and editing were completed by Z.Q. All authors have read and agreed to the published version of the manuscript.

Funding

Supported by the Philosophy and Social Science Planning Project of Heilongjiang Province (24JYE011).

Institutional Review Board Statement

Not applicable.

Informed Consent Statement

Not applicable.

Data Availability Statement

The datasets used and/or analyzed during the current study are available from the corresponding author on reasonable request.

Acknowledgments

The authors are grateful to all colleagues who helped us with this research.

Conflicts of Interest

The authors have declared that no competing interests exist.

Abbreviations

The following abbreviations are used in this manuscript:
OGIOil and Gas Industry
CCDCoupling Coordination Degree

References

  1. Holling, C.S. Resilience and Stability of Ecological Systems. Annu. Rev. Ecol. Syst. 1973, 4, 1–23. [Google Scholar] [CrossRef]
  2. Farley, J.; Voinov, A. Economics, Socio-Ecological Resilience and Ecosystem Services. J. Environ. Manag. 2016, 183, 389–398. [Google Scholar] [CrossRef]
  3. Stadtfeld, G.M.; Gruchmann, T. Dynamic Capabilities for Supply Chain Resilience: A Meta-Review. Int. J. Logist. Manag. 2024, 35, 623–648. [Google Scholar] [CrossRef]
  4. Pisano, U. Resilience and Sustainable Development: Theory of Resilience, Systems Thinking and Adaptive Governance; ESDN Quarterly Report N°26; European Sustainable Development Network (ESDN): Vienna, Austria, 2012; pp. 1–50. Available online: https://api.semanticscholar.org/CorpusID:15862869 (accessed on 10 July 2025).
  5. Walker, B.W.; Holling, C.S.; Carpenter, S.R.; Kinzig, A. Resilience, Adaptability and Transformability in Social-Ecological Systems. Ecol. Soc. 2004, 9, 5. [Google Scholar] [CrossRef]
  6. Martin, J.; Henrichs, T.; Francis, C.; Hoogeveen, Y.; Kazmierczyk, P.; Pignatelli, R.; Speck, S. Environmental Indicator Report: Ecosystem Resilience and Resource Efficiency in a Green Economy in Europe; European Environment Agency: Copenhagen, Denmark, 2012; Available online: https://www.eea.europa.eu/publications/environmental-indicator-report-2012 (accessed on 10 July 2025).
  7. Pu, G.; Zhang, J.; Wang, Y.; Li, S. Effect of Supply Chain Resilience on Firm’s Sustainable Competitive Advantage: A Dynamic Capability Perspective. Environ. Sci. Pollut. Res. 2022, 30, 4881–4898. [Google Scholar] [CrossRef]
  8. Shishodia, A.; Sharma, R.; Rajesh, R.; Munim, Z.H. Supply Chain Resilience: A Review, Conceptual Framework and Future Research. Int. J. Logist. Manag. 2023, 34, 879–908. [Google Scholar] [CrossRef]
  9. Guo, Y.; Xie, L.; Du, X. Evaluation on Food Security Resilience: System Construction, Development Disparities, and Obstacle Analysis. Nongcun Jingji (Rural. Econ.) 2025, 1, 29–37. (In Chinese) [Google Scholar]
  10. Ma, L.; Li, X.; Pan, Y. Global Industrial Chain Resilience Research: Theory and Measurement. Systems 2023, 11, 466. [Google Scholar] [CrossRef]
  11. Wang, Y.F.; Yang, H.F.; Wang, X.S. Constructing the Dual Circulation New Development Pattern from the Perspective of Industrial Chain and Supply Chain Security—Based on a Macro Model of Open Economies. Stud. Int. Financ. 2024, 22–35. (In Chinese) [Google Scholar] [CrossRef]
  12. Zhang, M. Research on the Measurement and Influencing Factors of Resilience of China’s High-Tech Industrial Chain. Stat. Decis. 2025, 41, 118–123. (In Chinese) [Google Scholar] [CrossRef]
  13. Wu, A.; Sun, Y.; Zhang, H.; Sun, L.; Wang, X.; Li, B. Research on Resilience Evaluation of Coal Industrial Chain and Supply Chain Based on Interval Type-2F-PT-TOPSIS. Processes 2023, 11, 566. [Google Scholar] [CrossRef]
  14. Wang, S.W.; Guo, R.; Wang, S.B. Coordinated Evolution and Influencing Factors of China’s Energy Resilience and Technological Innovation. China Soft Sci. 2025, 208–224. (In Chinese). Available online: https://link-cnki-net-s.webvpn.nepu.edu.cn/doi/10.16475/j.cnki.1006-1029.2024.12.003 (accessed on 10 July 2025).
  15. Ouyang, M.; Dueñas-Osorio, L.; Min, X. A Three-Stage Resilience Analysis Framework for Urban Infrastructure Systems. Struct. Saf. 2012, 36–37, 23–31. [Google Scholar] [CrossRef]
  16. Wang, Z.Y.; Tang, Y.Q.; Han, Z.L.; Wang, Y. Resilience Measurement and Influencing Factors of the Marine Ship Industry Chain in China’s Coastal Areas. Econ. Geogr. 2022, 42, 117–125. (In Chinese) [Google Scholar] [CrossRef]
  17. Zuo, Z.L.; Cheng, J.H.; Guo, H.X.; Zhan, C. Evolution and Evaluation of the Structural Resilience of the Lithium Industry Chain Trade Network. China Popul. Resour. Environ. 2024, 34, 155–166. (In Chinese) [Google Scholar]
  18. Guan, W.; Xu, H.; Wu, W.; Hui, Z.; Lianxia, W. Comprehensive Urban Resilience and Dynamic Prediction of Nanjing City Based on the New Development Concept. Geogr. Sci. 2024, 44, 681–692. (In Chinese) [Google Scholar] [CrossRef]
  19. Chang, X.; Han, P. Measurement, Spatio-Temporal Evolution, and Regional Differences of Digital Industrial Chain Resilience in China. Stat. Decis. 2024, 40, 28–32. (In Chinese) [Google Scholar] [CrossRef]
  20. Zhu, Y.G.; Zhang, W.F.; Wang, D.; Dou, S.Q.; Xun, D.Y. Evaluation of the Resilience of the Supply Chain of China’s Copper Resource Industry. Resour. Sci. 2023, 45, 1761–1777. (In Chinese) [Google Scholar]
  21. Zhao, Y.; Ye, S.Q.; Yang, C.H.; Hong, Y.M. Measurement, Correlation and Attribution of Industrial Chain Resilience from the Perspective of Big Data. China Ind. Econ. 2025, 61–79. (In Chinese) [Google Scholar] [CrossRef]
  22. Andrews-Speed, P. China’s Oil and Gas Industry: Stranded between the Plan and the Market. In States and Markets in Hydrocarbon Sectors; Belyi, A.V., Talus, K., Eds.; Palgrave Macmillan: Houndmills, UK, 2015; pp. 214–239. [Google Scholar]
  23. Vermeer, E.B. The Global Expansion of Chinese Oil Companies: Political Demands, Profitability and Risks. China Inf. 2015, 29, 3–32. [Google Scholar] [CrossRef]
  24. Chen, L.; Dui, H.; Zhang, C. A Resilience Measure for Supply Chain Systems Considering the Interruption with the Cyber-Physical Systems. Reliab. Eng. Syst. Saf. 2020, 199, 106869. [Google Scholar] [CrossRef]
  25. Kong, Z.Y.; Dong, X.C.; Jiang, Q.Z. Analysis of Energy Return on Investment of China’s Oil and Gas Production. IOP Conf. Ser. Earth Environ. Sci. 2018, 146, 012052. [Google Scholar] [CrossRef]
  26. Liu, C.; Wang, Y.; Li, Y.; Cui, S.; Li, L. Energy Eco-Efficiency in China’s Oil and Gas Resource-Based Enterprises and Its Influencing Factors: A Data Envelopment Analysis from Static and Dynamic Perspectives. Polish J. Environ. Stud. 2023, 32, 2825–2837. [Google Scholar] [CrossRef]
  27. Chen, K.-S. Interlinkages between Bitcoin, Green Financial Assets, Oil, and Emerging Stock Markets. Data Sci. Finance Econ. 2024, 4, 160–187. [Google Scholar] [CrossRef]
  28. Chen, S. Study on Resilience of China’s Oil Energy System under Import Shortage Scenario. Ph.D. Thesis, China University of Mining and Technology, Xuzhou, China, 2022. (In Chinese). [Google Scholar] [CrossRef]
  29. Xiao, X.Z.; Li, S.L. Industrial Chain Resilience under Great Changes: Generating Logic, Practical Concerns and Policy Orientation. Reform 2022, 1–14. (In Chinese). Available online: https://link-cnki-net-s.webvpn.nepu.edu.cn/urlid/50.1012.F.20221219.0957.001 (accessed on 10 July 2025).
  30. Wu, W.J.; Feng, W.Y. Evaluation of the Resilience of the Oil Industry Chain and Supply Chain in China. J. Xi’an Shiyou Univ. (Soc. Sci. Ed.) 2024, 33, 23–30. (In Chinese) [Google Scholar]
  31. Cai, W.G.; Xu, F.G. Research on the Measurement and Characteristics of the Spatial-Temporal Evolution of Industrial Resilience in China. Reform Econ. Syst. 2022, 90–97. (In Chinese) [Google Scholar]
  32. Li, Y. Improving the Resilience and Security of China’s Industrial Chain Supply Chain in the Context of Building the New Development Paradigm. Econ. Rev. J. 2023, 51–58. (In Chinese) [Google Scholar] [CrossRef]
  33. Xiang, K.; Zheng, N.; Chen, J.; Gao, W. Evaluation and Obstacle Degree Analysis of Low-Carbon Development Level in Fujian Province-Based on Entropy Weight TOPSIS Method. Front. Energy Res. 2022, 10, 948893. [Google Scholar] [CrossRef]
  34. Wang, B.; Tang, S. A Study on the Evaluation of the Degree and Diagnosis of Obstacle Factors of Intensive Use Arable Land Resources in China. Macroeconomics 2023, 117–127. (In Chinese) [Google Scholar] [CrossRef]
  35. Xiao, C. Research on Comprehensive Evaluation of Urban Resilience of China. Ph.D. Thesis, Jiangxi University of Finance and Economics, Nanchang, China, 2021. (In Chinese). [Google Scholar] [CrossRef]
  36. Liu, Y.; Zhang, L.; Failler, P.; Wang, Z. The Dynamic Evolution of Agricultural Trade Network Structures and Its Influencing Factors: Evidence from Global Soybean Trade. Systems 2025, 13, 279. [Google Scholar] [CrossRef]
  37. Sheng, D.; Guyot, O. Market Power, Internal and External Monitoring, and Firm Distress in the Chinese Market. Data Sci. Financ. Econ. 2024, 4, 285–308. [Google Scholar] [CrossRef]
Figure 1. Resilience Index and Trend of China’s OGI from 2001 to 2022.
Sustainability 17 06505 g001
Figure 2. Trends in Resilience Index of China’s OGI Chain in Different Dimensions from 2001 to 2022.
Sustainability 17 06505 g002
Figure 3. Radar Chart of the Resilience Index Evolution of China’s OGI Chain. (a) Resilience Scores for Various Dimensions in 2001; (b) Resilience Scores for Various Dimensions in 2005; (c) Resilience Scores for Various Dimensions in 2010; (d) Resilience Scores for Various Dimensions in 2015; (e) Resilience Scores for Various Dimensions in 2020; (f) Resilience Scores for Various Dimensions in 2022.
Sustainability 17 06505 g003
Figure 4. Trend of Obstacle Degree Changes in Various Dimensions of China’s OGI.
Sustainability 17 06505 g004
Figure 5. Resilience Coupling Coordination of Resilience Subsystems in China’s OGI Chain.
Sustainability 17 06505 g005
Table 1. Comprehensive Evaluation Index System for Resilience of China’s OGI.
First-Level IndicatorsSecond-Level IndicatorsThird-Level IndicatorsTypeWeight
ResistanceResource Guarantee CapabilityUltimate Recoverable Reserves of OilA1Maximum0.0297
Ultimate Recoverable Reserves of Natural GasA2Maximum0.0292
Oil Import DependenceA3Minimum0.0269
Natural Gas Import DependenceA4Minimum0.0394
Product Supply CapabilityCrude Oil ProductionA5Maximum0.0181
Natural Gas ProductionA6Maximum0.0341
Pipeline Cargo TurnoverA7Maximum0.0365
Price Buffer CapabilityPrice Buffer Capability of Upstream Industry ChainA8Median0.0067
Price Buffer Capability of Downstream Industry ChainA9Median0.0058
RecoveryIndustrial BasePipe LengthB1Maximum0.0295
Number of Upstream Enterprises in the Industry ChainB2Maximum0.0352
Number of Downstream Enterprises in the Industry ChainB3Maximum0.0474
Element BaseUpstream Capital Stock of the OGIB4Maximum0.0284
Downstream Capital Stock of the OGIB5Maximum0.0342
Upstream Labor Stock of the OGIB6Maximum0.0289
Downstream Labor Stock of the OGIB7Maximum0.0296
Investment CapacityUpstream Investment in the OGIB8Maximum0.0278
Downstream Investment in the OGIB9Maximum0.0272
Economic FoundationMain Operating Revenue
per 100 Yuan of Assets of Large-Scale Enterprises
B10Maximum0.0177
Return on Total Assets of Industrial Enterprises Above Designated SizeB11Maximum0.0159
InnovationInnovation InvestmentFunding for R&D Investment in the Upstream OGI to Develop New ProductsC1Maximum0.0212
Funding for R&D Investment in the Downstream OGI to Develop New ProductsC2Maximum0.0380
Innovation OutputNumber of Invention Applications from Upstream Oil and Gas CompaniesC3Maximum0.0370
Number of Invention Applications from Downstream Oil and Gas CompaniesC4Maximum0.0663
Technology ImprovementRefining RateC5Maximum0.0270
Efficiency of Energy ConversionC6Maximum0.0158
TransformationStructural TransformationThe Proportion of Crude Oil Consumption in the Chemical Raw Materials and Chemical Products Manufacturing IndustriesD1Maximum0.0183
Low-carbon TransformationCO2 Emissions—OilD2Minimum0.0239
CO2 Emissions—Natural GasD3Minimum0.0176
Carbon Emission Intensity of OilD4Minimum0.0174
Carbon Emission Intensity of Natural GasD5Minimum0.0305
Sulfur Dioxide Emissions from Upstream of the Industrial ChainD6Minimum0.0059
Sulfur Dioxide Emissions from Downstream of the Industrial ChainD7Minimum0.0448
Annual Storage of CO2 by CCUSD8Maximum0.0719
Extension and Integration of The Industrial ChainNumber of Downstream Enterprises in the Industrial ChainD9Maximum0.0162
Table 2. Key obstacle factors and degree of obstacles affecting the resilience of China’s OGI from 2001 to 2022.
Title 1NO. 1NO. 2NO. 3NO. 4NO. 5
IndexObstacleIndexObstacleIndexObstacleIndexObstacleIndexObstacle
2001D89.41C48.63B36.20C24.95C34.85
2002D89.27C48.48B36.09C24.89C34.72
2003D89.24C48.42B36.02C24.88C34.65
2004D810.17C49.03B116.32D75.33C35.05
2005D810.39C49.19B116.49D75.68C34.85
2006D810.44C49.81B116.59D75.46C24.85
2007D810.97C410.38B116.77D75.68C34.78
2008D812.16C411.39B116.81D76.06C35.25
2009D812.34C411.23B116.77C25.86C75.22
2010D813.30C411.68B117.11D76.69C26.06
2011D811.46C410.87D78.89B117.72C25.49
2012D810.86C49.32D78.36B116.99B105.23
2013D810.39C49.00D78.35B116.65B55.40
2014D810.80D78.62C48.08B116.38A45.56
2015D810.93C48.87B116.30B55.82A45.80
2016D810.14C48.51A46.07B55.65B115.60
2017D811.06A47.31C46.82B106.10D55.87
2018D811.18A48.34B106.56D56.47C46.37
2019D811.98A48.79B106.83D56.45C56.13
2020D813.24A49.33B107.21C56.78A36.75
2021D812.53A410.96B47.78B107.33C57.19
2022A413.22B410.70B109.43C29.15A38.87
Table 3. Types and Grades of Coupling Coordination Degree (CCD).
GradeExtremely IncoordinationMild
Incoordination
Primary
Coordination
Mild
Coordination
High-Quality
Coordination
CCD[0.0, 0.3)[0.3, 0.5)[0.5, 0.7)[0.7, 0.9)[0.9, 1.0)
Disclaimer/Publisher’s Note: The statements, opinions and data contained in all publications are solely those of the individual author(s) and contributor(s) and not of MDPI and/or the editor(s). MDPI and/or the editor(s) disclaim responsibility for any injury to people or property resulting from any ideas, methods, instructions or products referred to in the content.

