1. Introduction
Offshore renewable energy technologies, particularly solar photovoltaic (PV), wind, and wave energy, are increasingly recognized as sustainable alternatives to conventional fossil fuels. A promising innovation in this domain is the “energy island”: An integrated offshore platform that harnesses multiple renewable sources to supply electricity to coastal infrastructure such as desalination plants. As described by [
1], this concept includes both man-made structures and isolated geographic systems designed to enhance energy security and environmental sustainability. In this study, the term specifically refers to an offshore hub that integrates wind, wave, and solar energy to power desalination plants along the Kingdom of Saudi Arabia (KSA) coast.
Despite their potential, energy islands face substantial technical and economic challenges, including high capital costs, logistical complexity, and environmental constraints [
2]. Nonetheless, pilot projects such as Poseidon80 and W2Power have demonstrated the feasibility of such systems, showing improved energy yields and cost-effectiveness [
3]. Critical technical considerations, such as structural health monitoring, life cycle analysis (LCA), and optimal site selection, must be addressed in the design phase [
4,
5]. However, no established framework currently exists to guide the initial site selection of offshore energy islands, as discussed in
Section 2. This study addresses that gap by developing and applying a comprehensive decision-making framework that integrates renewable energy potential, site suitability, and operational constraints, including marine traffic and proximity to desalination facilities. The methodology combines Inverse Distance Weighting (IDW) interpolation with Multi-Criteria Decision Analysis (MCDA) and is applied to a case study along the Red Sea coast of KSA.
The study explores whether a generalized framework can be developed to identify optimal locations for offshore energy islands and how the proposed framework supports site identification along the Red Sea coast. It also investigates whether an offshore energy island in the Red Sea is a feasible solution to meet the energy demands of regional desalination plants. It is hypothesized that sustainable clean water production in KSA can be achieved by powering desalination plants with offshore renewable energy sources, thereby reducing fossil fuel consumption and associated environmental impacts. Furthermore, it is proposed that the combined solar, wind, and wave energy resources of the Red Sea are sufficient to supply the estimated 2.1 million kW of energy required daily by coastal desalination facilities. This paper investigates these research questions and hypotheses.
1.1. Renewable Energy Resources
A significant portion of this study is grounded in quantitative resource assessment. Wave power potential is estimated using the formula developed by [
6]:
Similarly, wind power is calculated using Betz’s law, as demonstrated in [
7]:
Here, represents the wind speed in meters per second (m/s), is the area in square meters (m2), and is the air density, assumed to be 1.2 kg per cubic meter (kg/m3).
Solar power depends on the local solar density. The total solar power collected can be calculated using the equation provided by [
8], where
is solar irradiance (Watt/m
2) and
is the area in square meters (m
2):
Although the units of these power expressions differ, wave power being expressed in watts per meter (W/m), and wind and solar power in total watts (W), a harmonized assessment was achieved by referencing each source to a standardized 1 m width or 1 m2 collection area. Specifically, for comparison purposes, wave power in W/m was interpreted over a 1 m wide segment of wave crest and subsequently divided by a representative capture length in the direction of wave propagation, yielding an equivalent power density in W/m2. This reflects the conversion from linear energy flux (W/m) to areal energy density (W/m2), enabling consistent comparison with wind and solar power, which are inherently area-based. Wind and solar power values, calculated over surface areas, were similarly evaluated with respect to a 1 m2 collection area. This approach allows for a coherent assessment of energy potential across the three renewable sources while preserving the physical basis of each formulation.
1.2. Renewable Energy and Water Desalination
The feasibility of powering desalination plants with renewable energy has been demonstrated in multiple studies. Offshore wind turbines, in particular, have been shown to deliver higher energy yields than onshore systems [
9,
10]. Offshore wind also provides greater reliability due to more consistent wind patterns [
11]. The viability of solar-powered desalination has been substantiated in previous studies [
12,
13], with [
13] specifically demonstrating enhanced system efficiency in Dhahran, KSA, through the optimization of photovoltaic (PV) tilt angles. Similarly, wave energy technologies such as Wave Dragon and Weptos have shown promise in supplying energy to reverse osmosis (RO) systems [
14,
15].
Other renewable sources were excluded from this study due to practical limitations. Geothermal and biomass energy present significant technical and economic challenges for offshore deployment [
16,
17], while tidal energy is considered inefficient in the Red Sea due to low average tidal currents of approximately 0.1 m/s [
18].
In parallel with the global transition to renewable energy, water scarcity remains an escalating concern driven by population growth, climate change, and the depletion of freshwater resources. Only about 0.4% of the Earth’s water is readily accessible and suitable for use, with most either locked in oceans or contaminated, making desalination a necessary alternative in water-stressed regions [
19]. However, desalination is highly energy-intensive and remains largely dependent on fossil fuels, contributing significantly to carbon dioxide (CO
2) emissions.
KSA, located in one of the world’s most arid regions, relies heavily on seawater desalination to meet its water needs. This dependence places significant pressure on fossil fuel-based energy systems, exacerbates environmental degradation, and hinders progress toward sustainability goals. Desalination is reported to be the second-largest contributor to CO
2 emissions among all industrial sectors in the Kingdom [
20].
In addition to emissions, desalination poses other environmental challenges. Brine discharge can adversely affect marine ecosystems [
21,
22], and thermal pollution may disrupt aquatic habitats [
23]. Health-related concerns, such as noise and degraded air quality, can be mitigated through proper site selection [
24]. The disposal of used RO filters also raises sustainability issues due to their limited operational lifespan and handling requirements [
25]. While various studies have proposed solutions to address these concerns, this research focuses specifically on reducing CO
2 emissions through renewable energy integration.
The Red Sea region offers highly favorable conditions for renewable-powered desalination, with abundant solar radiation, strong and stable wind speeds, and promising wave energy potential [
26,
27]. This study introduces a comprehensive, data-driven framework to identify optimal sites for offshore energy islands supplying renewable electricity to coastal infrastructure. The framework is applied to select suitable locations for powering desalination plants along KSA’s Red Sea coast. It integrates spatial analysis techniques, including IDW interpolation and MCDA, along with data from platforms such as RETScreen. Key factors considered include renewable energy availability, infrastructure proximity, and environmental constraints. Although the Red Sea region serves as the case study, the proposed framework is designed to be adaptable and scalable for broader applications in different geographic and industrial contexts, offering a robust tool for advancing global sustainable energy planning.
3. Water Desalination Technologies
To evaluate the potential of offshore energy islands in sustainably powering coastal desalination facilities, it is essential first to understand the current landscape of desalination technologies and their associated environmental impacts. This section provides a comprehensive analysis of the energy consumption and CO2 emissions linked to both conventional and emerging desalination methods used in KSA. By highlighting the inefficiencies of thermal-based systems such as Multi-Stage Flash (MSF) and Multi-Effect Distillation (MED) and comparing them with more energy-efficient technologies like RO, the necessity and timeliness of integrating offshore renewable energy becomes evident. These insights support the transition to renewable-powered desalination and inform the development of a spatial decision-making framework for optimal energy island deployment.
RO currently dominates global desalination due to its superior energy efficiency and lower greenhouse gas emissions. According to [
36], RO accounts for approximately 74% of global desalinated water production, compared to 21% from thermal technologies and 5% from other methods. This dominance stems from RO’s membrane-based process, which operates using only electrical energy to power high-pressure pumps. In contrast, MSF and MED systems require both thermal and electrical energy. Studies in [
37] and [
38] confirm that RO is not only more responsive to fluctuations in water demand but also emits significantly fewer greenhouse gases than thermal systems.
Energy consumption is directly influenced by both the desalination technology and the scale of production. MSF and MED systems require substantial thermal input in addition to electricity, while RO relies solely on electrical energy, making it more compatible with renewable energy integration.
Table 1 summarizes energy consumption factors from multiple sources. While energy consumption is commonly expressed in kilowatt-hours per cubic meter (kWh/m
3), this value alone does not always reveal the differences in energy types across desalination technologies. Thermal-based processes such as MSF and MED typically require both thermal and electrical energy, while RO is primarily driven by electrical energy. In this study, the reported values represent total energy consumption, including both thermal and electrical components for MSF and MED, as provided in the referenced literature. Although these energy forms differ in how they are generated and applied, the aggregated values are crucial for assessing the overall power requirements of each technology. This comprehensive total is particularly important when estimating the renewable energy capacity needed to power desalination plants. Regardless of the type of desalination system, knowing the total energy demand is essential for sizing and designing renewable energy systems capable of meeting operational requirements. Average consumption values indicate that RO is the most efficient technology, typically requiring between 3 and 6 kWh/m
3, while MSF and MED range from 10 to 38.5 kWh/m
3, depending on plant design and operational conditions.
KSA’s Saline Water Conversion Corporation (SWCC) has adopted energy recovery systems (ERS) to improve the energy efficiency of RO plants. According to [
43], ERS implementation has reduced energy consumption to 2.7 kWh/m
3 in large-scale facilities and 2.27 kWh/m
3 in smaller plants. These values apply exclusively to RO and do not reflect improvements in MSF or MED unless significant retrofitting is undertaken. As defined in [
44], large plants are those producing more than 10,000 m
3/day.
The variation in energy consumption among technologies directly translates into different levels of CO
2 emissions. According to [
20], while MSF accounted for 57.8% of KSA’s desalinated water production, it was responsible for 80.1% of the related CO
2 emissions. MED contributed 13.2% of water production and 14% of emissions, whereas RO produced 29% of the water but only 5.8% of total emissions. Carbon intensity also depends on fuel type and energy conversion efficiency. Crude-oil-fired turbines, for example, emit approximately 0.76 kg CO
2/kWh, whereas combined-cycle systems emit about 0.48 kg CO
2/kWh.
Table 2 presents emission factors for each technology based on literature data.
Further emphasizing the environmental burden, Ref. [
43] reported that the Shuqaiq 5 desalination plant alone emits more than 1.23 million tons of CO
2 annually. National estimates place average emissions at 3.8955 kg/m
3 for large-scale plants and 3.2751 kg/m
3 for smaller ones. These findings, supported by [
20,
46,
47], highlight the disproportionately high carbon footprint of thermal desalination compared to RO.
In parallel with conventional systems, recent studies have investigated solar-driven material-based evaporators as low-cost, sustainable alternatives for localized water purification. Although these systems are effective at removing specific contaminants such as pharmaceuticals, caffeine, and herbicides, their peak evaporation rates, ranging from 1.67 to 3.61 kg/m
2/h, are insufficient to match the output of centralized RO plants. Their dependence on direct solar radiation further limits reliability and scalability. While promising for small-scale or emergency applications, these technologies are not yet suitable replacements for municipal or industrial desalination systems [
48,
49,
50].
Emerging solar evaporators represent a promising innovation for decentralized water purification. However, they are not currently viable for large-scale desalination needs in urban or industrial contexts. RO remains the most efficient and scalable solution for meeting KSA’s water demand, particularly when integrated with offshore renewable energy. These findings reinforce the urgency of transitioning to cleaner, more efficient desalination infrastructure based on proven technologies, while continuing to explore complementary innovations where appropriate.
4. Methodology
4.1. Method Used for Developing the Framework
The proposed framework outlines the process for selecting the optimal site for an offshore energy island intended to power desalination plants. Its development follows a structured, evidence-based methodology designed to be both systematic and reproducible. The aim is to ensure that the process aligns with scientific rigor while also supporting innovative and practical decision-making. Key elements considered in the framework’s development include a clear problem definition, a comprehensive literature review, the establishment of system requirements and performance criteria, conceptual design formulation, the use of analytical and simulation tools, and iterative refinement of the approach.
The framework presented in the manuscript is grounded in an academically rigorous methodology that incorporates all of these essential components. First, the problem is clearly defined in
Section 1, where the study identifies the challenge of sustainably powering desalination plants along the Red Sea and emphasizes the need for a structured site-selection framework. This is followed by a comprehensive literature review in
Section 2, which examines existing methodologies, the lack of standardized global frameworks, and insights drawn from major international projects such as ORECCA and MARINA. The system requirements and performance criteria, including energy potential, cost, and risk, are established in
Section 4.1 and are subsequently applied in
Section 5.1,
Section 5.2 and
Section 5.3 to guide the evaluation of candidate sites. A conceptual design of the framework is outlined in
Section 5.1, where a multi-stage evaluation process is introduced. Analytical and simulation tools, such as IDW and RETScreen, are described in
Section 4.1,
Section 5.1 and
Section 5.2, providing the technical basis for spatial and performance analysis. Finally,
Section 5.3 demonstrates iterative refinement, where MCDA weightings are adjusted to test the robustness and reliability of the framework. Together, these elements ensure the framework is scientifically sound, transparent, and applicable for the strategic planning of renewable-powered desalination infrastructure.
The core methodological approach integrates spatial interpolation and MCDA to evaluate and select the most suitable location. Specifically, the framework employs the IDW interpolation method to generate spatial estimates of renewable energy potential, followed by MCDA to rank alternative sites based on key evaluation criteria. These methods are supported by RETScreen Expert–Viewer–9.1.0.98 software, which facilitates the assessment of energy production potential, cost implications, and basic risk factors. While the primary focus of this study is on power generation potential, both cost and risk are also acknowledged as critical components, though not explored in depth.
IDW, or Inverse Distance Weighting, is a spatial interpolation technique used to estimate values at unsampled locations based on the values of nearby sampled points. It operates on the principle that closer points have a greater influence on the interpolated value than those farther away. Due to its intuitive logic and simplicity, IDW is widely used in disciplines such as geography, environmental science, and geostatistics. Further technical details regarding the implementation of IDW are available in [
51].
A central feature of the framework is the application of MCDA to select the most suitable offshore energy island location. In this study, the Weighted Sum Model (WSM) is used as the MCDA technique, allowing for structured and quantitative decision-making by aggregating diverse evaluation criteria into a single composite score. WSM is chosen for its mathematical clarity, ease of implementation, and transparency in assigning and applying weights to criteria. The final performance score for each site alternative is calculated using the following formula [
52].
In this equation, represents the score assigned to the criterion, is the relative importance of that criterion, and is the number of evaluation criteria. The scores for each criterion were assigned on a normalized scale from 0 to 1, based on technical assessments and expert evaluations. This approach ensured consistent comparability across all criteria and alternatives without the need for additional normalization after the analysis.
Three primary criteria were used in the evaluation: power generation potential, cost efficiency, and risk management. Power generation scores reflect the expected renewable energy output from solar, wind, and wave sources. Solar potential was assumed to be constant across all locations, while wind and wave potential were considered to increase with offshore distance due to favorable marine conditions. Cost efficiency scores represent the economic feasibility of each location, with higher scores indicating lower capital, operational, and maintenance costs. As these costs typically increase with offshore distance, sites located farther from the coast generally receive lower cost efficiency scores. These costs typically rise with offshore distance. Risk management scores account for exposure to environmental conditions, structural health, and vulnerability to natural disasters, with closer locations generally considered lower risk.
In addition to these three criteria, interruptions were evaluated as a binary exclusion condition. If a region was found to experience significant interruptions that would compromise project reliability or continuity, it was labeled as “Yes” under interruptions and automatically excluded from ranking, regardless of its performance on the other criteria. This ensured that only technically viable and operationally stable regions would be considered in the final selection.
Weights were assigned based on the strategic priorities of the project. Power generation was given a weight of 0.50 due to its central role in the viability of energy systems. Cost and risk management were each assigned weights of 0.25 to reflect their secondary yet essential influence on the long-term feasibility and sustainability of the project.
4.2. Data Accuracy
Real-time meteorological data for this study were sourced from [
53], which operates using the Global Forecast System (GFS) model at a spatial resolution of 13 km. The GFS is a global numerical weather prediction model managed by the National Centers for Environmental Prediction (NCEP) [
54], a division of the National Oceanic and Atmospheric Administration (NOAA) [
55] and the National Weather Service (NWS) [
56] in the United States. The model runs four times daily at 00, 06, 12, and 18 Coordinated Universal Time (UTC), generating forecasts up to 384 h in advance. Since January 2015, GFS has provided forecast outputs with a resolution of 27 km for predictions extending up to 240 h. As a global model, it offers full geographic coverage, making it suitable for large-scale site assessment applications.
In addition to GFS data, this study incorporates data from RETScreen [
57], a comprehensive software platform developed by Natural Resources Canada under the Ministry of Natural Resources since 1997. RETScreen is designed to evaluate the feasibility, performance, and risk of renewable energy and energy efficiency projects. The platform sources meteorological inputs from both ground-based weather stations and NASA satellite systems. NASA provides Global Horizontal Irradiation (GHI) and other meteorological variables with a data latency of approximately 3 to 6 days. These datasets are regularly updated and validated, ensuring the accuracy and relevance of climate data used in site analysis.
5. Results
5.1. Developing Initial Design Framework
The methodology described in
Section 4.1 was applied to develop a comprehensive framework for identifying the optimal location for an offshore energy island. This framework is illustrated in
Figure 1, while the IDW interpolation component is detailed in
Figure 2.
The framework provides a structured approach to evaluating the feasibility of using renewable energy to power desalination plants, particularly in remote coastal or island environments. Its primary objective is to identify locations that offer maximum renewable energy generation, minimal cost, and low operational risk. The process begins by identifying high-potential areas using global atlases that map solar, wind, and wave energy resources.
After identifying candidate locations, the framework applies exclusion criteria to filter out sites with critical interruptions. These include marine traffic, existing infrastructure conflicts, political restrictions, and environmental regulations. Only locations without major barriers proceed to further evaluation. Environmental data such as solar irradiance, wind speed, wave height, and wave period are then collected using sources like Windguru and RETScreen. These inputs are used to estimate energy generation using established engineering equations for wind and wave power.
To assess spatial variability in energy potential, data are analyzed in QGIS using the IDW method. This allows for the mapping of energy-rich zones and supports spatially informed site selection focused on maximizing renewable energy availability.
A comprehensive cost analysis follows, covering capital costs (equipment, installation, permitting), operating and maintenance expenses (labor, logistics, waste handling), and financial considerations related to projected energy savings and demand profiles. This ensures economic feasibility is factored into site selection.
The framework also includes a risk assessment to evaluate potential environmental impacts, exposure to extreme weather, infrastructure resilience, and social or regulatory challenges. Addressing these factors early helps reduce the likelihood of long-term disruptions, supporting project sustainability.
With data on energy potential, costs, and risks compiled, RETScreen software is used to simulate technical performance, financial feasibility, and power reliability. This modeling step confirms whether a site is realistically capable of supporting a renewable-powered desalination system.
The final stage involves applying MCDA to rank candidate sites. MCDA integrates power output, cost efficiency, and risk into a single weighted score, ensuring the selected site is balanced across all relevant dimensions. This structured approach supports transparent and data-driven decision-making.
The site selection process concludes with the identification of an optimal energy island capable of reliably supplying renewable energy to support desalination operations. The result reflects a rigorous, multi-criteria framework that balances technical feasibility, cost-effectiveness, environmental considerations, and risk management. This approach is particularly valuable in regions facing growing water scarcity and rising energy demands.
Crucially, the framework is not limited to a specific region. Its modular structure allows adaptation across different geographic, climatic, and regulatory settings. As such, it offers a globally applicable tool for integrated energy and water planning, supporting national and international goals for climate resilience and sustainable development.
5.2. IDW Interpolation Analysis
To identify the most energy-rich regions along the Red Sea, the IDW interpolation method was applied to spatially distribute wave, wind, and solar power across the study area.
The left panel in
Figure 3 illustrates the distribution of wave power, highlighting a pronounced concentration of high wave energy in the central and northern parts of the Red Sea. Maximum values exceed 8154.82 W/m, particularly in offshore zones near NEOM, Al Wajh, and Al Mahash. In contrast, the southernmost areas, such as those near Jizan, exhibit much lower wave energy, with values dropping below 100 W/m.
The middle panel presents wind power potential at 10 m above sea level. The northern region, including NEOM, Duba, Al Wajh, and Umluj, demonstrates the highest offshore wind energy availability, reaching up to 750.97 W/m2. Wind potential gradually declines toward the south, with the lowest values observed around the Farasan Islands and Jizan.
The right panel displays solar power potential based on Global Horizontal Irradiance (GHI). Solar energy is strongest in the northern and southern regions, with peak values around 262 W/m2 near Jazirat Jabal Zugar and NEOM. The central region shows moderately consistent solar irradiance ranging between 199.45 and 230 W/m2.
Although the resource data used in
Figure 3 originates from publicly available datasets, the maps are not reproductions of existing material. Instead, they were generated using IDW interpolation applied to geospatial datasets described in the methodology. This approach provides a spatial representation of renewable energy potential across the Red Sea coastline based on observed rather than generalized data.
These interpolated maps serve two primary analytical purposes. First, they provide spatial estimates of average energy output, which are essential for determining the scale of hybrid renewable systems required to support desalination infrastructure under various scenarios. This spatial detail helps guide preliminary decisions related to site selection and system sizing.
Second, the maps support the justification of the power scores assigned to each region within the multi-criteria decision analysis framework. By visualizing the spatial distribution of solar, wind, and wave resources, the maps enhance understanding of renewable energy availability across regions. This spatial context strengthens the transparency and credibility of the evaluation process presented in the following sections.
5.3. MCDA
The MCDA process began by evaluating three regions along the Red Sea: North, Middle, and South. The evaluation was based on three key criteria: power potential, economic cost, and risk mitigation capability. These criteria were selected for their strategic relevance in the design and implementation of hybrid renewable energy island systems. Interruptions such as dense marine traffic, political instability, or environmental constraints were treated as a binary exclusion factor. Any region experiencing significant interruptions was disqualified from further consideration.
The criteria were weighted as follows: 50 percent for power, 25 percent for cost, and 25 percent for risk. This weighting reflects widely accepted MCDA practices and is consistent with similar studies in the literature. The selected weights emphasize the core functional requirement of energy islands, which is the delivery of reliable renewable energy, while also accounting for economic feasibility and operational resilience.
Power was assigned the highest weight due to its central role in determining the viability of the system. The primary function of an energy island is to generate and supply sufficient energy. Therefore, maximizing power potential is critical. This prioritization is supported by previous studies such as [
58], which emphasized energy output in PV site selection, and [
59], which highlighted reliable and affordable clean energy as a key sustainability objective. Giving power the dominant weight ensures that the evaluation framework is aligned with these foundational goals.
Cost was weighted at 25 percent, reflecting its importance for economic viability without allowing it to outweigh energy performance. Comparative studies often allocate 30 to 35 percent of the weight to cost, as demonstrated in the MCDA model used by [
60]. However, in this study, slightly less emphasis was placed on cost due to the higher priority given to energy availability. Risk management was also weighted at 25 percent to ensure that reliability and resilience were properly addressed. Risk in this context includes environmental exposure, structural vulnerability, and uncertainty in operational and regulatory conditions. The inclusion of risk as a formal evaluation criterion is supported by [
61], who recognized resilience as a critical component of sustainable energy system design.
Environmental and social considerations were addressed within sub-criteria or incorporated contextually into the main categories rather than being treated as standalone primary criteria. This approach is consistent with targeted MCDA applications in which technical and economic viability take precedence. For example, Ref. [
59] noted that while environmental factors are relevant, they are often integrated within broader technical assessments rather than evaluated separately when the focus is on energy reliability and performance.
The selected weighting scheme clearly communicates the study’s priorities, particularly the emphasis on securing a stable and sufficient renewable energy supply. Each criterion contributes proportionally to the final evaluation. All scores were normalized on a scale from 0 to 1, where 0 indicates the lowest performance and 1 the highest. Normalization was performed relative to the maximum value observed for each criterion. For instance, if the site with the highest power output received a score of 1, the others were scaled proportionally. This ensures fair comparison across all sites. After normalization, each score was multiplied by its assigned weight, and the resulting weighted values were summed to calculate the final composite score for each location.
The results are summarized in
Table 3. The Middle region achieved the highest total score, 0.9375, due to balanced performance across all criteria and the absence of disqualifying interruptions. The South region followed with a score of 0.7825, while the North region, despite high power potential, was excluded due to interruptions from marine traffic and infrastructure.
Within the Middle region, five potential sites (A through E) were assessed in more detail, where Site A is the closest to the shore and Site E is the farthest. All sites were evaluated based on power output (wind, wave, and solar), cost factors (installation, maintenance, logistics), and risk (environmental and social vulnerabilities). Solar power was assumed to remain constant across all sites. However, both wind and wave power increased with distance from shore, as did associated costs and risks.
Table 4 shows the breakdown of performance in each criterion and summarizes the final weighted scores obtained after normalization of all evaluation criteria. Among the candidate locations, Site A, situated less than 5 km from the coast, emerged as the optimal location with a final composite score of 0.86. This high score reflects a well-balanced performance across technical, economic, and environmental dimensions. Site A’s proximity to shore offers significant logistical advantages, including reduced transmission costs and easier access for construction and maintenance activities. Although its power potential is moderate compared to other sites, it remains sufficient to meet project requirements. Additionally, the site presents a relatively low exposure to environmental and operational risks, which further strengthens its overall suitability. Taken together, these factors contribute to Site A being identified as the most favorable location for development within the evaluated set.
Although the weighting scheme was adjusted by increasing the values for cost and risk management to 30% each and reducing the weight of power to 40%, the overall outcome remained consistent. The Middle region continued to achieve the highest total score, and Site A was still identified as the most suitable location among the evaluated alternatives. This consistency reinforces the robustness of the analysis. Moreover, the application of the MCDA framework using the Weighted Sum Model facilitated a transparent and traceable comparison of all options, enabling the selection of the optimal site for offshore renewable energy development through a structured and defensible process.
5.4. Desalination Production, Energy Demand, and Emissions
According to [
62], desalination plants along the Red Sea produced approximately 2,358,078 cubic meters of water per day in 2023, representing more than 43.17 percent of the total national desalinated water output. Based on this production volume and national data, the estimated total energy required for these Red Sea facilities is approximately 2.1 million kilowatts. This figure is derived from KSA’s reported total desalination energy consumption of 42.684 million megawatt-hours in 2023, as documented in open-source datasets [
63].
Desalination activities are also significant contributors to national greenhouse gas emissions. According to [
43,
64], operations at these facilities may have produced up to 39.6 million metric tons of CO
2 in 2023, translating to approximately 46,836,493 kg of CO
2 emitted per day. These emissions are primarily due to the use of fossil fuels in powering energy-intensive thermal desalination technologies.
KSA’s role in global desalination is substantial. As reported by [
65], the Kingdom is responsible for approximately 22 percent of global desalinated water production. Given this share, the CO
2 emissions from Saudi desalination plants are estimated to account for as much as 9.5 percent of global desalination-related carbon emissions. This figure underscores the critical importance of transitioning to clean, renewable energy sources to reduce environmental impacts and support the sustainability of water production systems.
5.5. Final Energy Island Location: Shuaiba
A single energy island was identified as a more effective solution than multiple installations due to superior cost efficiency, simplified logistics, and enhanced environmental oversight. The selected site is Shuaiba, located approximately 40 km south of Jeddah in the central region of the Red Sea. Shuaiba was selected because of its proximity to the largest desalinated water production facility on the Red Sea coast.
Desalination plants along the Red Sea require an estimated 2.1 million kilowatts of electricity daily. Meeting this demand necessitates a hybrid renewable energy assessment to determine site-specific resource availability, which was performed using IDW interpolation.
According to the IDW results, the combined renewable energy potential at a location approximately five kilometers offshore from Shuaiba is approximately 1998 watts per square meter. This includes 1519 W/m2 from wave energy, 247 W/m2 from solar irradiance, and 232 W/m2 from wind energy. Based on this theoretical maximum, the minimum area required to fully power the desalination plants using renewable energy would be approximately 1.05 square kilometers, assuming no spacing between energy systems.
However, this estimate does not reflect real-world system performance. To adjust energy conversion efficiency, standard values were applied: 65 percent for wave energy using hydraulic-type converters, 59.3 percent for wind energy based on the Betz limit, and 10 percent for solar photovoltaic systems [
7,
8,
66]. Incorporating these efficiencies results in adjusted power outputs of approximately 987 W/m
2 from wave, 138 W/m
2 from wind, and 25 W/m
2 from solar. The total effective power density is therefore approximately 1150 W/m
2. Based on this revised value, the estimated area required to meet the desalination energy demand increases to approximately 1.83 square kilometers.
Using a comprehensive methodology that incorporates spatial interpolation, multi-criteria decision analysis, environmental assessments, and strategic alignment with national policies, the Shuaiba site in the central Red Sea region has been confirmed as the most suitable location for a single offshore renewable energy island. This selection supports the goals of energy diversification, environmental sustainability, and the continued development of KSA’s desalination infrastructure in alignment with Vision 2030.
5.6. Alignment with Saudi Vision 2030
Desalination is an energy-intensive process that relies heavily on fossil fuels, resulting in considerable greenhouse gas emissions [
67]. Integrating renewable energy sources such as offshore wind, solar, and wave power offers a promising path to reducing these environmental impacts while supporting KSA’s Vision 2030. Offshore energy islands, in particular, present a strategic opportunity to reduce dependence on fossil fuels, lower operational costs, and enhance desalination capacity. This transition positions KSA as a potential global leader in sustainable water production, with the capacity to generate millions of cubic meters of clean water annually.
To facilitate this shift, the Kingdom has begun prioritizing RO over thermal technologies such as MSF and MED. RO is favored due to its superior energy efficiency and reduced environmental impact. The exclusive adoption of RO aligns operational strategies with the broader goals of Vision 2030. When coupled with offshore renewable energy systems, RO offers a scalable and sustainable approach to increasing water production capacity while reducing both emissions and long-term costs.
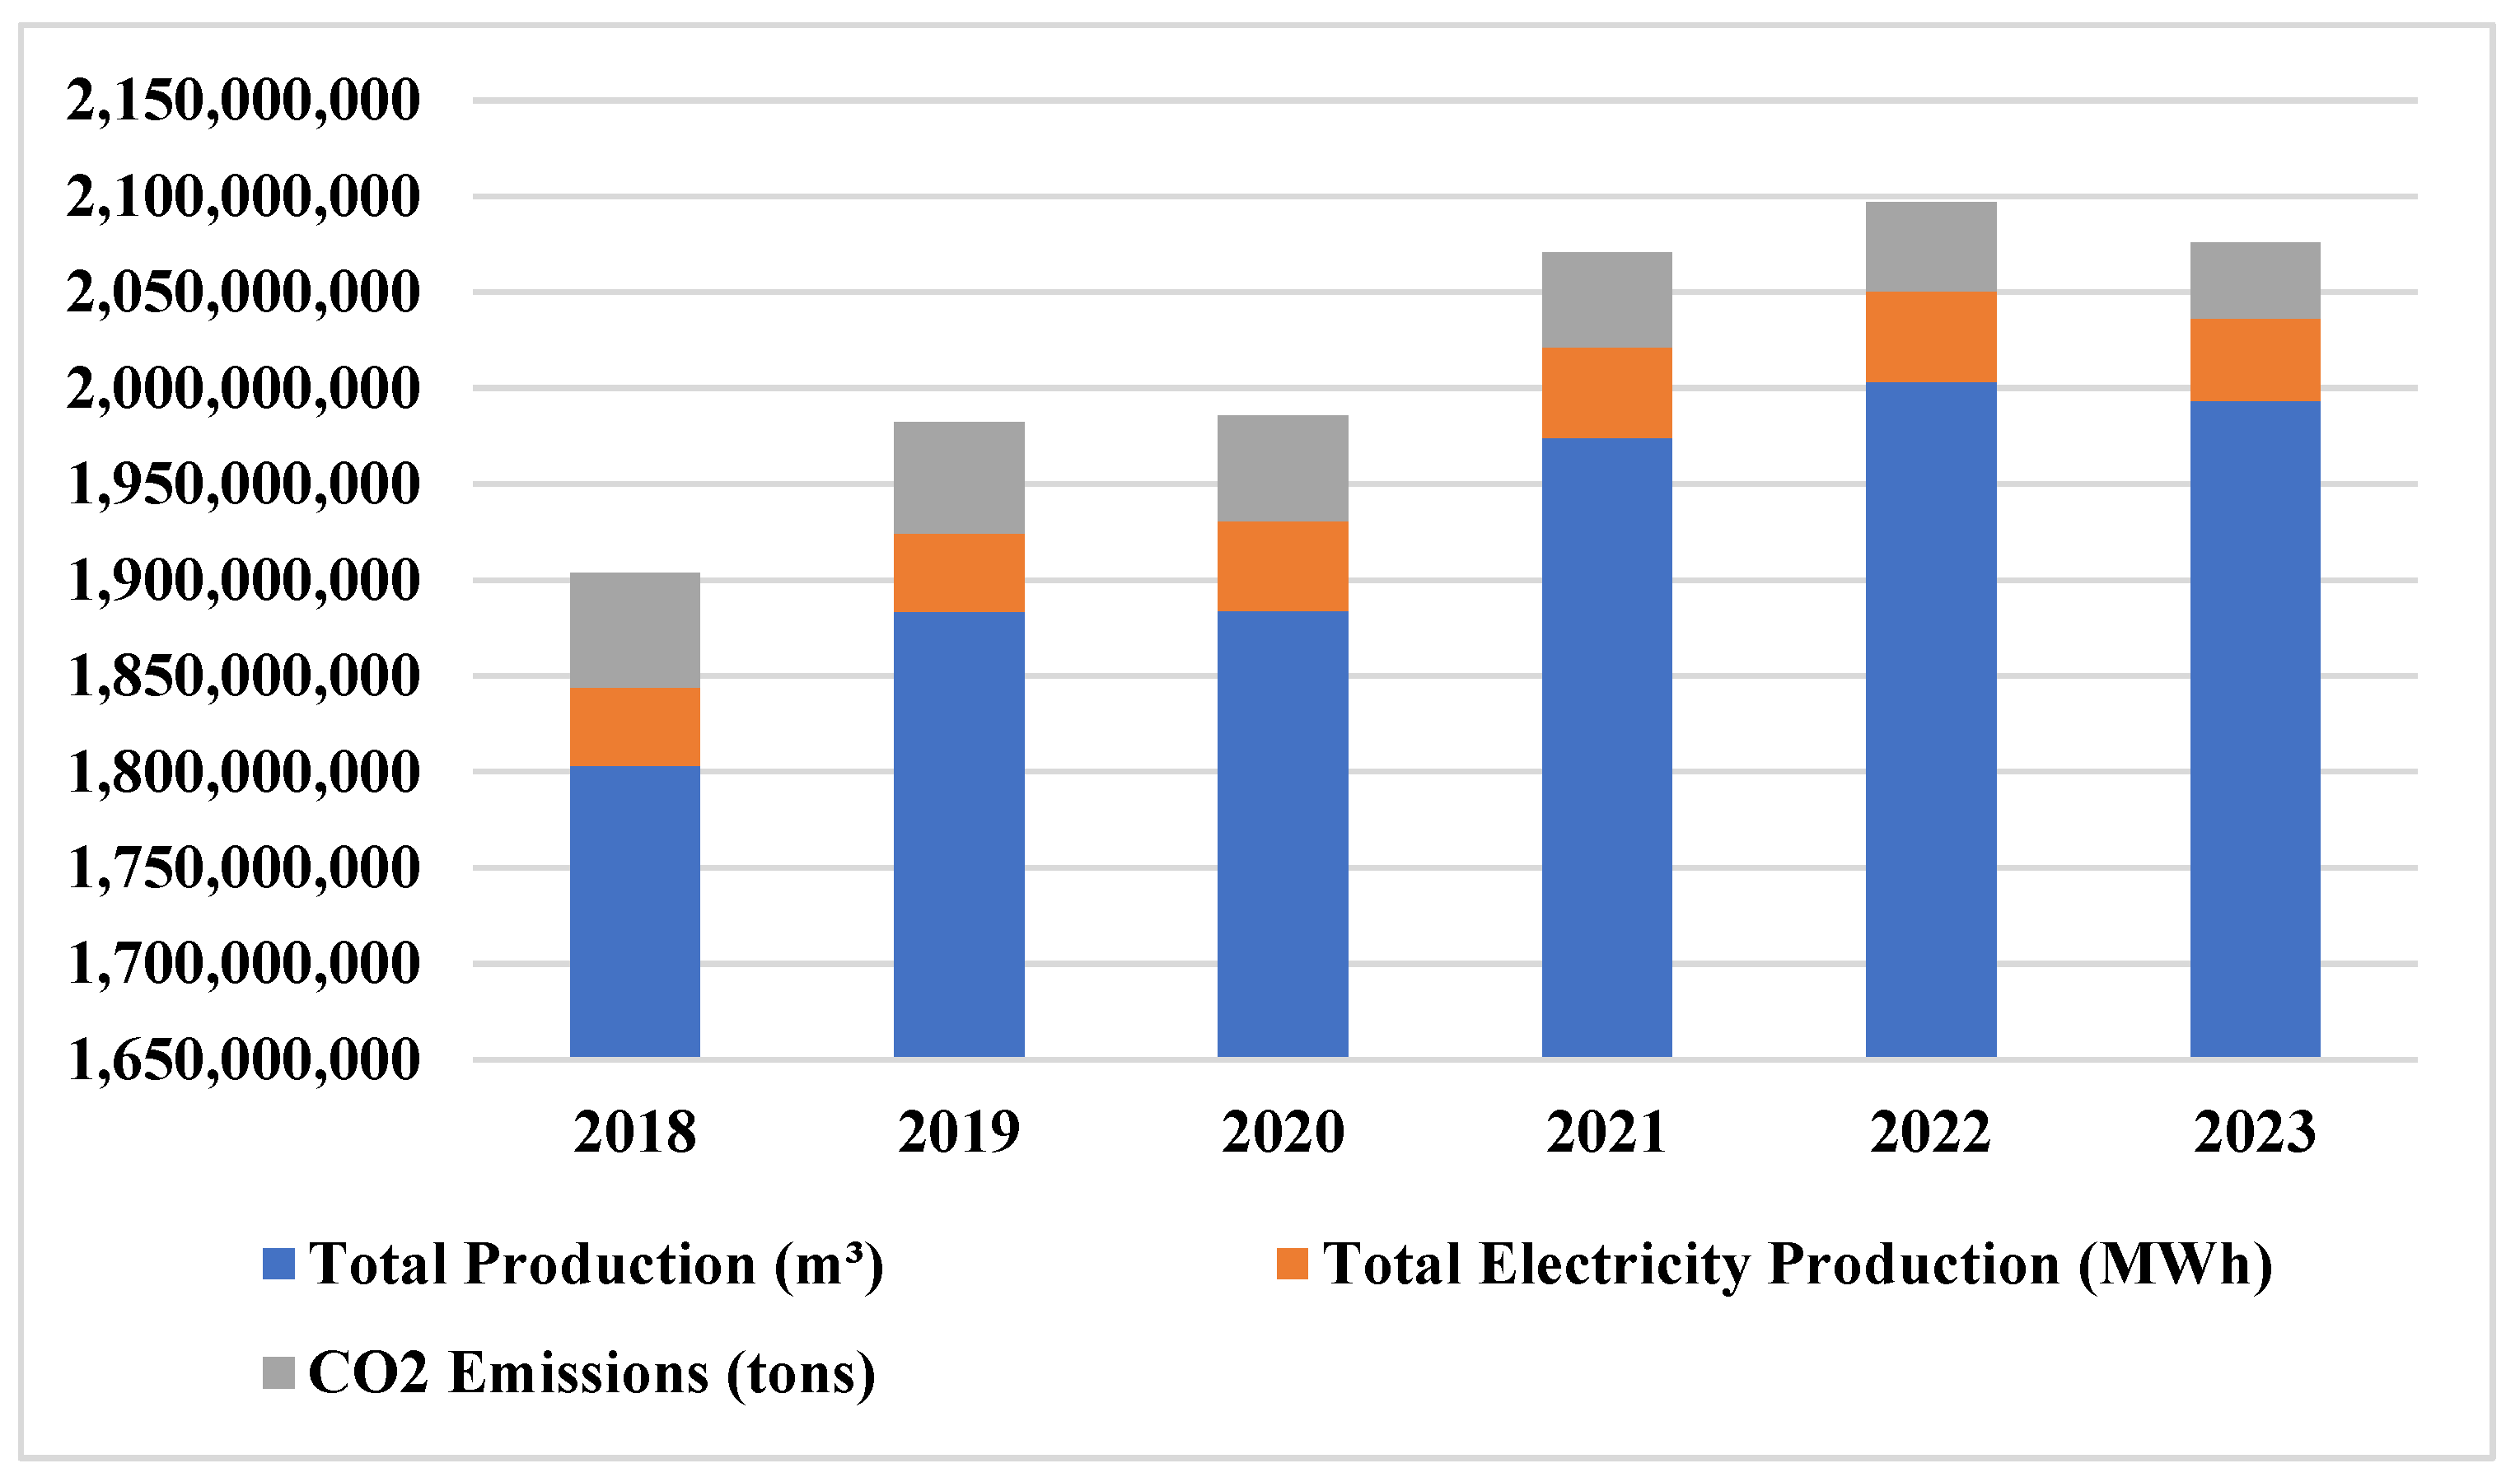
These changes are reflected in operational data from recent years.
Figure 4 presents annual trends in desalinated water production, electricity consumption, and CO
2 emissions in KSA from 2018 to 2023. During this period, water production steadily increased, peaking in 2022. Although there was a slight decline in 2023, output remained significantly higher than in earlier years, indicating sustained demand for freshwater.
Electricity consumption, shown in orange, closely follows the trend in water production. This relationship underscores the energy-intensive nature of desalination. The minor decrease observed in 2023 may indicate improved operational efficiency or temporary reductions due to maintenance or upgrades.
Significantly, CO2 emissions, illustrated in green, have declined over the same period. This inverse trend, rising water production accompanied by falling emissions suggests successful integration of cleaner technologies and energy sources. The increased adoption of RO systems and a gradual shift away from fossil fuel-based methods contribute to these improvements and demonstrate measurable progress toward the environmental targets outlined in Vision 2030.
These results affirm the importance of continued investment in renewable-powered desalination as a pillar of KSA’s national sustainability agenda. They also highlight the practical impact of policy shifts that prioritize efficiency, innovation, and environmental responsibility.
5.7. Environmental and Social Considerations
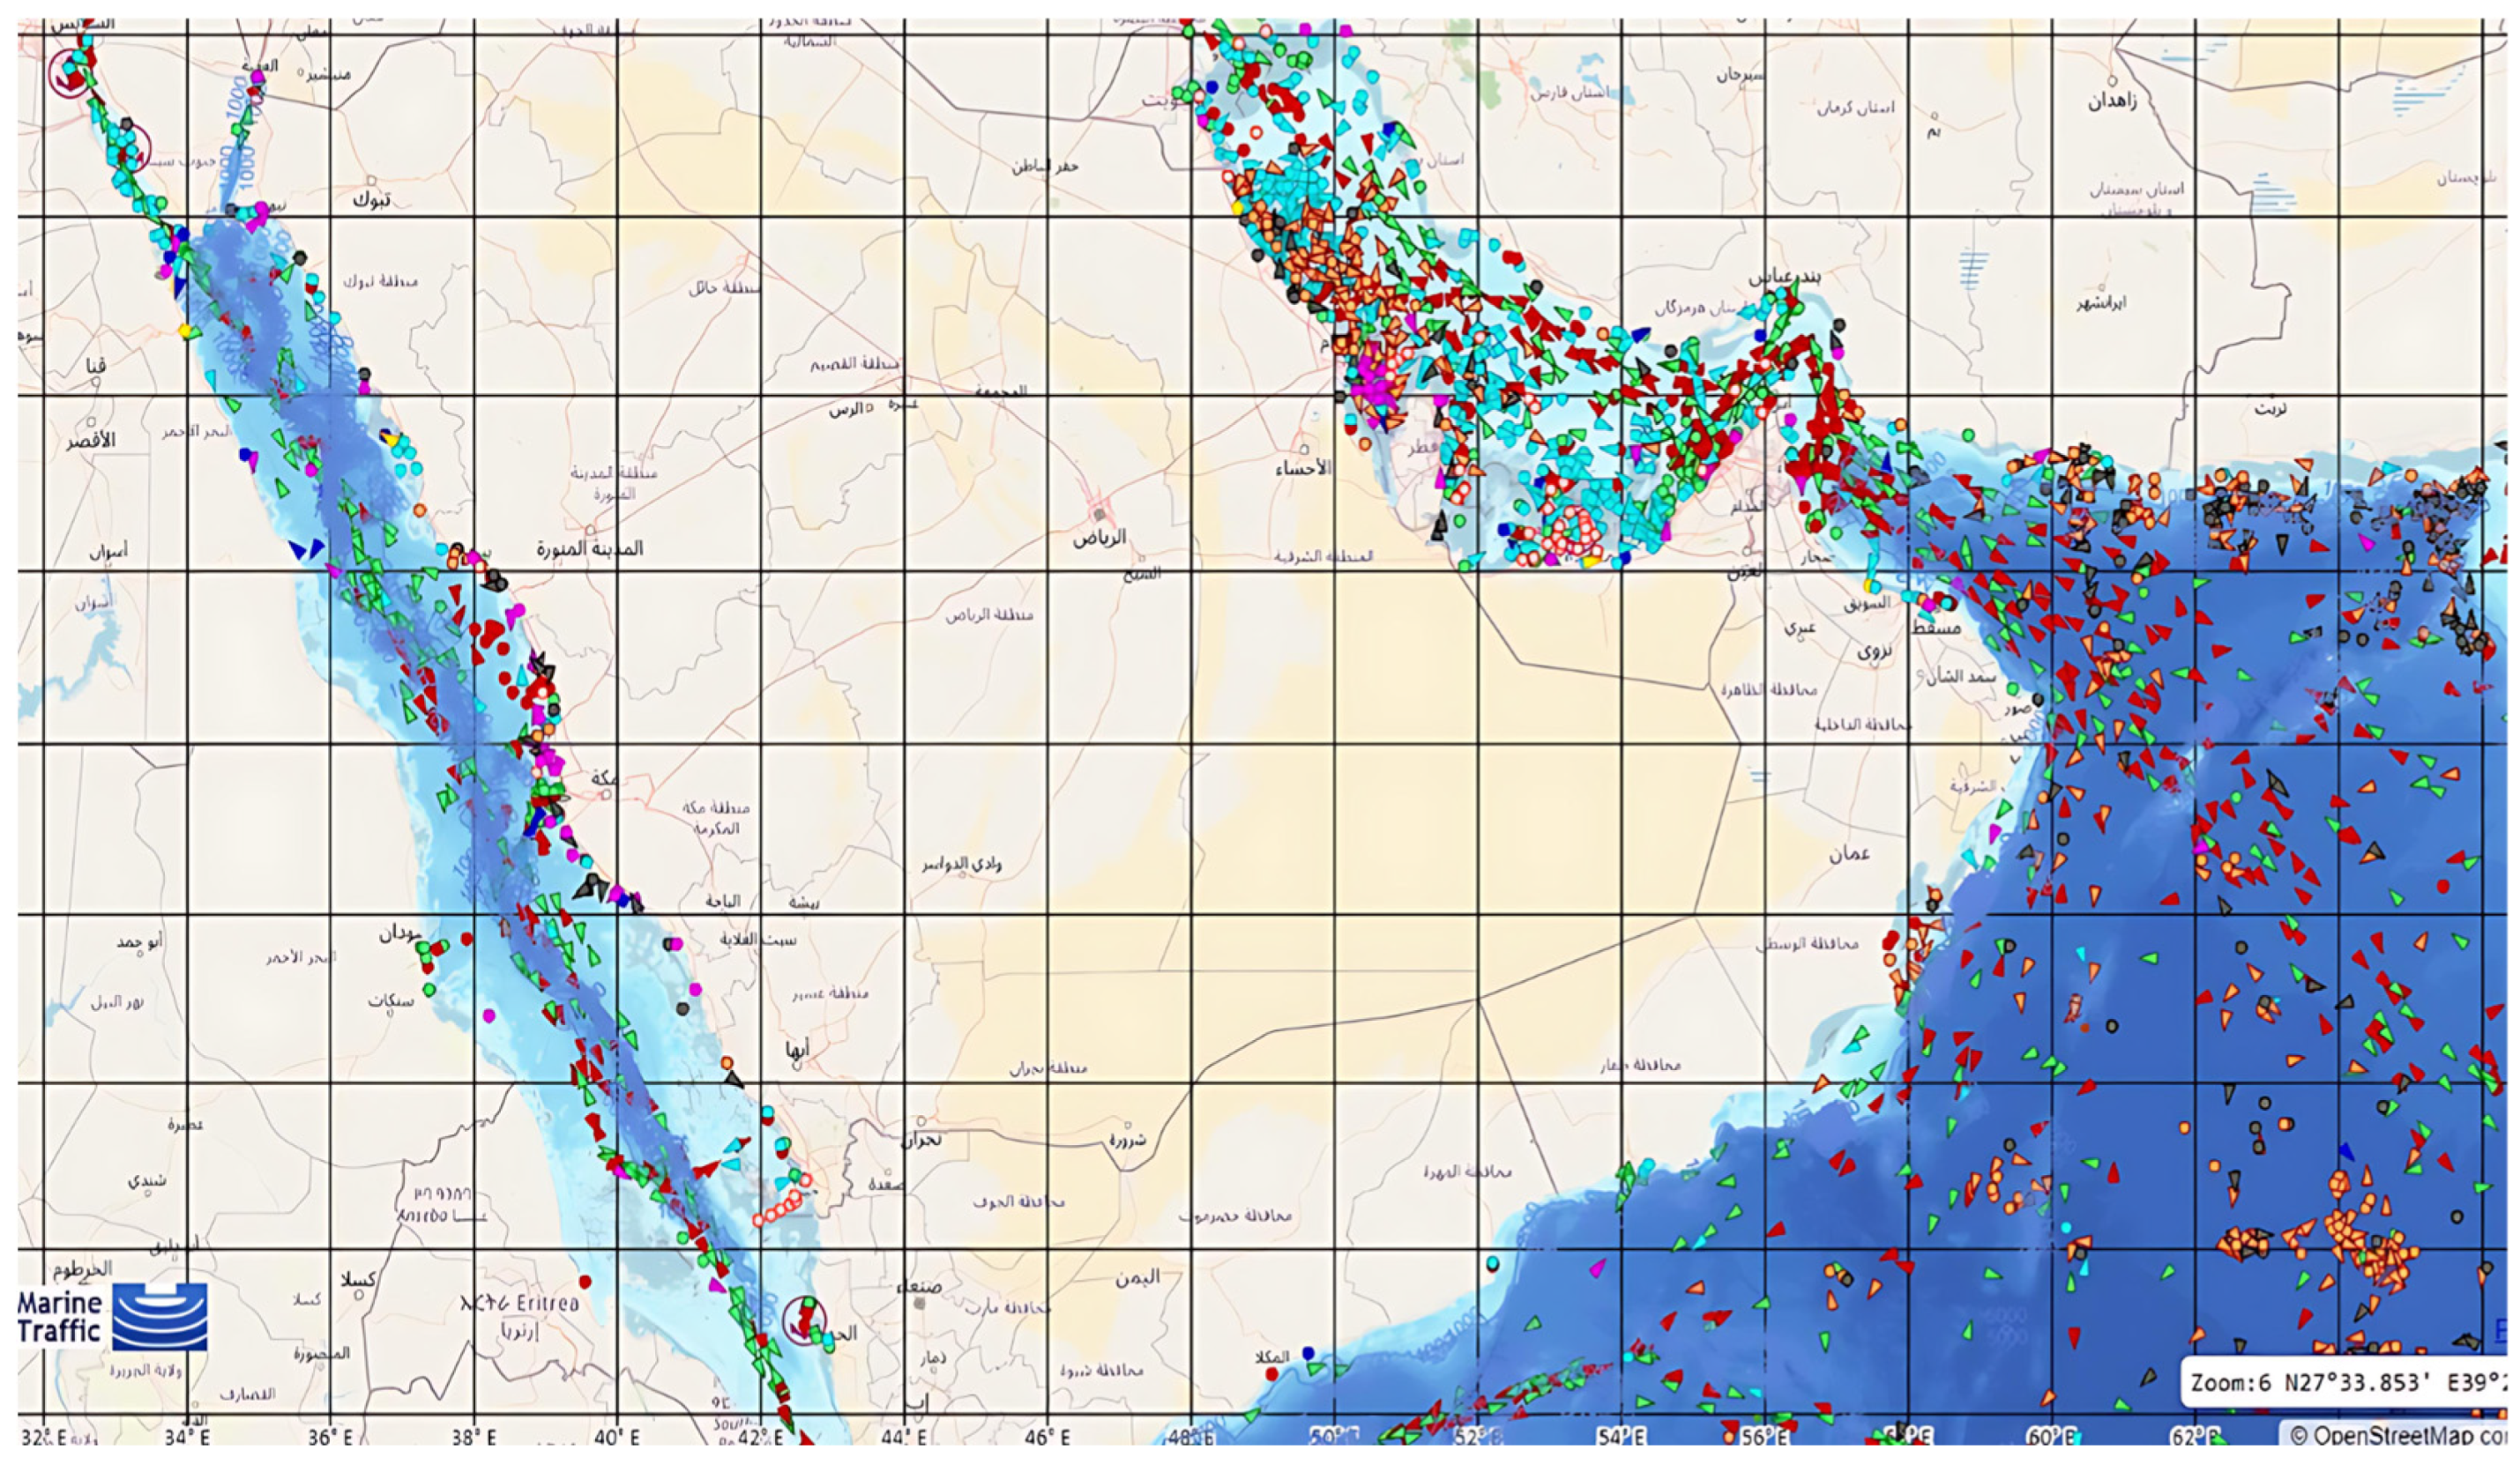
Environmental sustainability plays a vital role in the successful implementation of offshore energy island projects. Marine traffic data, illustrated in
Figure 5, show high vessel density near major ports such as Jeddah and Yanbu. In contrast, areas located between Shuaiba and Al Birk experience relatively low marine activity. This low-density region reduces the likelihood of operational conflicts and environmental disruptions, making it a suitable area for offshore infrastructure deployment.
Sustainable project development requires comprehensive planning that addresses environmental, technical, and social dimensions. Environmentally responsible practices include the use of recyclable and low-impact construction materials, safe and regulated disposal of brine and construction waste, replanting of affected marine vegetation, and the introduction of salt-tolerant plant species to enhance biodiversity. Particular attention must also be given to managing the end-of-life phase of RO membranes. These membranes can be processed through methods such as re-preparation, regeneration, upcycling, or downcycling to minimize waste and support a circular materials economy, as outlined by [
68].
From a social perspective, offshore energy projects must avoid residential areas and environmentally sensitive zones. Public engagement is critical to securing community support, and project developers are encouraged to involve local stakeholders early in the planning process to address concerns and improve social acceptance [
69]. This approach ensures that the benefits of the project are equitably distributed and that its implementation aligns with broader social and environmental sustainability goals.
Figure 5.
The map of the marine traffic for the Red Sea (west) and the Gulf (east) by OpenSeaMap [
70].
Figure 5.
The map of the marine traffic for the Red Sea (west) and the Gulf (east) by OpenSeaMap [
70].
6. Conclusions
This study presents a comprehensive and operational framework for the site selection of offshore renewable energy islands intended to power desalination plants along the Red Sea coast of KSA. The approach integrates IDW interpolation-based spatial analysis, demonstrates how RETScreen can support techno-economic evaluation, and applies MCDA to identify optimal sites based on renewable energy availability, environmental constraints, economic feasibility, and proximity to desalination infrastructure.
In contrast to previous approaches that are often conceptual or geographically constrained, this framework enables the deployment of hybrid renewable systems, including solar, wind, and wave energy, through a unified and spatially explicit methodology. When applied to the Red Sea region, the analysis identified the central zone, particularly Site A, as the most favorable location. This finding is supported by the site’s strong renewable energy potential, closeness to shore, and reduced implementation risks.
The framework contributes directly to the objectives of Saudi Vision 2030 by promoting sustainable water production, diversifying the national energy portfolio, and reducing greenhouse gas emissions. By aligning spatial planning with strategic national policy goals, this work offers a scalable and transferable model for integrating renewable energy into water infrastructure. The methodology can also be adapted to coastal regions globally that face similar challenges related to water scarcity and energy demand.
Several recommendations emerge from this study. First, future offshore renewable energy projects for desalination should adopt the integrated framework proposed here, as it combines geospatial accuracy with decision-making support using publicly accessible tools. Second, further investigation into wave energy potential in the Red Sea should be pursued, particularly through the development of a high-resolution, real-time wave energy atlas to refine resource estimation and system design. Third, in areas where offshore space is limited, the use of complementary land-based solar installations should be considered. Such systems may reduce maintenance demands, mitigate saltwater corrosion, and enhance long-term performance and stability.


