
Decomposition of Industrial Carbon Emission Drivers and Exploration of Peak Pathways: Empirical Evidence from China

Abstract
1. Introduction
2. Literature Review
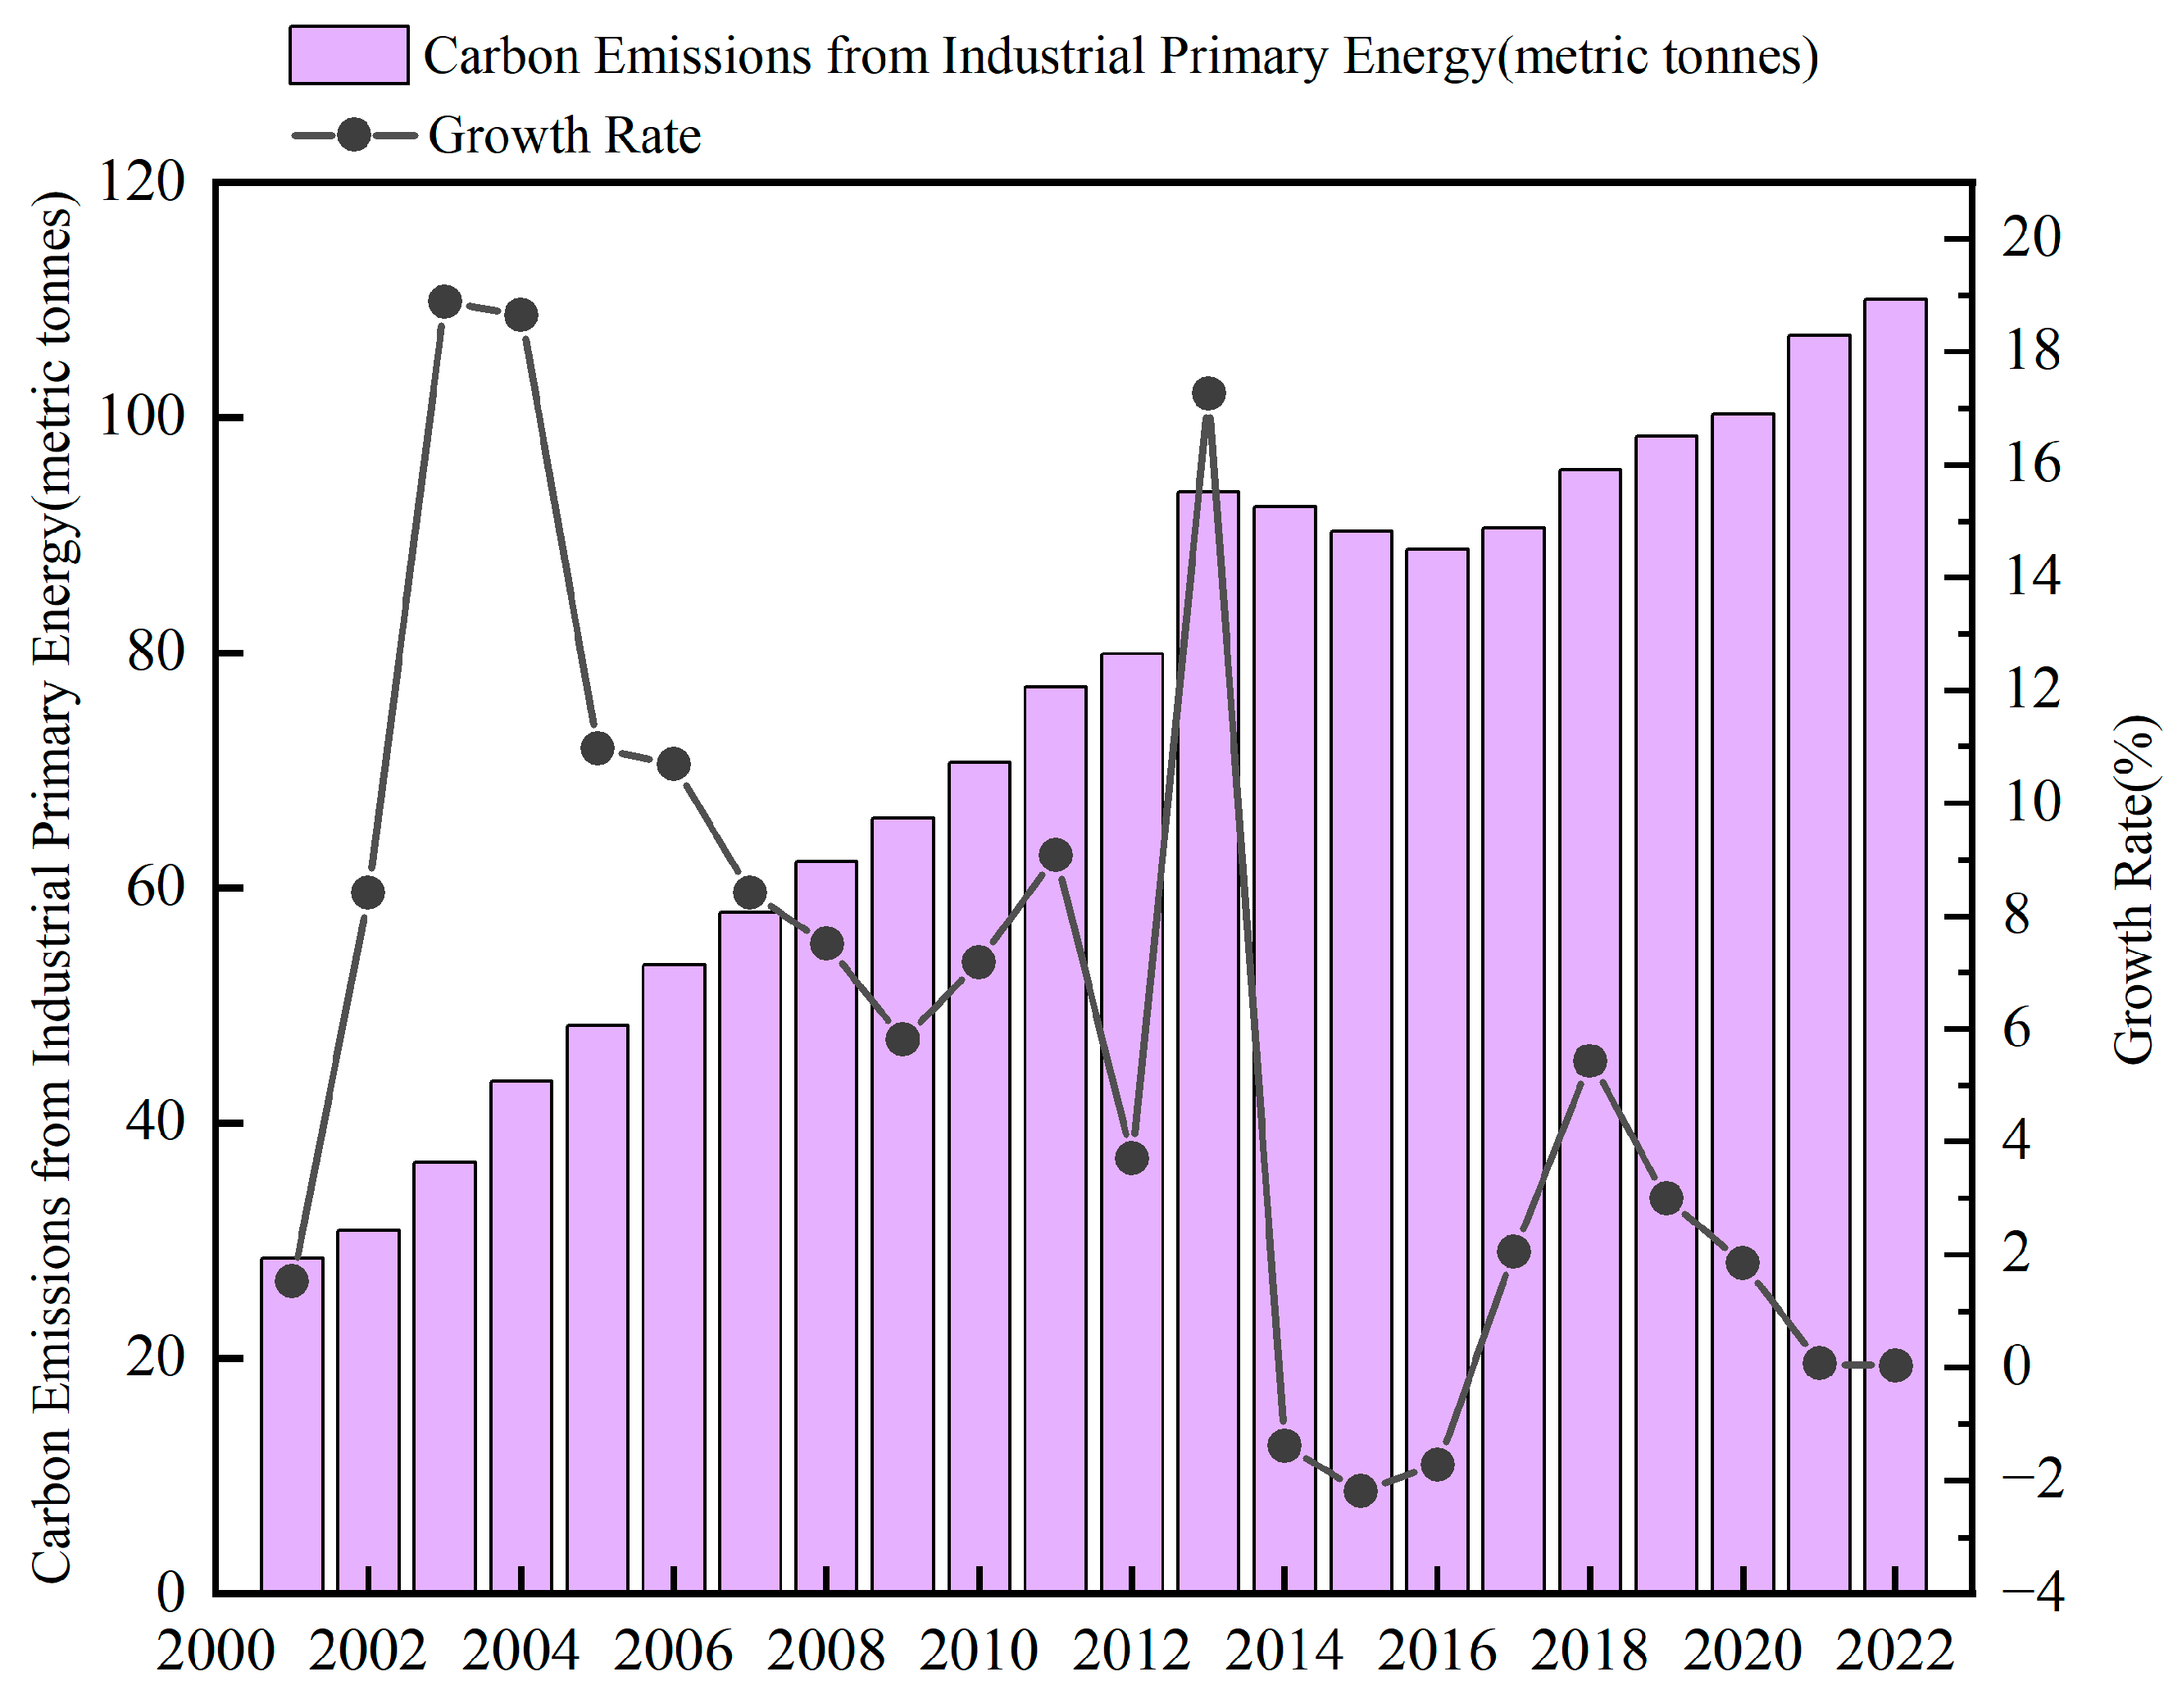
3. Facts Characterizing Industrial Energy Consumption and Carbon Emissions in China
4. Research Design
4.1. Methodology for Decomposition of Carbon Emission Drivers
4.2. Scenario Analysis and Carbon Emission Forecasts
5. Results and Analyses
5.1. Decomposition of Carbon Emission Driving Factors
5.2. Scenario Analysis and Peak Carbon Forecasts
5.2.1. Parameter Adjustment Carving
- (1)
- Size of the Economy
- (2)
- Industrial Structure
- (3)
- Energy Intensity
5.2.2. Scenario Setting Description
5.2.3. Carbon Emission Projections
- (1)
- Analysis of projected results
- (2)
- “Peak Carbon 2030” target-setting statement
5.2.4. Research Summary
6. Conclusions and Policy Implications
6.1. Conclusions
6.2. Research Implications
6.2.1. Balancing Industrial Growth with Low-Carbon Transition
6.2.2. Multidimensional Energy Conservation System for Structural Transformation
6.2.3. Institutionalizing Sustainable Governance Mechanisms
Author Contributions
Funding
Institutional Review Board Statement
Informed Consent Statement
Data Availability Statement
Acknowledgments
Conflicts of Interest
Abbreviations
| GDIM | Generalized Divisia Index Method |
| LEAP | Low Emissions Analysis Platform |
Appendix A
| High-Carbon Industries: | Low-Carbon Industries: |
| Coal Mining and Washing; Petroleum and Natural Gas Extraction; Ferrous Metal Ore Mining; Non-ferrous Metal Ore Mining; Non-metal Ore Mining; Petroleum, Coal and Other Fuel Processing; Raw Chemical Materials and Chemical Products; Non-metallic Mineral Products; Ferrous Metal Smelting and Rolling; Non-ferrous Metal Smelting and Rolling; Paper and Paper Products; Electricity and Heat Production and Supply; Gas Production and Supply | Agricultural and Sideline Food Processing; Food Manufacturing; Liquor, Beverage and Refined Tea Manufacturing; Tobacco Products; Textile Industry; Textile Wearing and Apparel Industry; Leather, Fur, Feather and Related Products and Footwear; Wood Processing and Wood, Bamboo, Rattan, Palm and Grass Products; Furniture Manufacturing; Printing and Record Medium Reproduction; Cultural, Educational, Arts and Crafts, Sports and Entertainment Supplies Manufacturing; Pharmaceutical Manufacturing; Chemical Fiber Manufacturing; Rubber and Plastic Products; Metal Products; General Equipment Manufacturing; Special Equipment Manufacturing; Transport Equipment Manufacturing; Electrical Machinery and Apparatus Manufacturing; Computer, Communication and Other Electronic Equipment Manufacturing; Measuring Instrument Manufacturing; Other Manufacturing; Water Production and Supply |
References
- Raza, A.; Shakeel, M. Analysing research patterns on low carbon development, climate change mitigation and renewable energy through text analytics: An artificial intelligence approach. Innov. Green Dev. 2025, 4, 100242. [Google Scholar] [CrossRef]
- Chen, S.Y.; Chen, D.K. Air pollution, Government regulations and high-quality economic development. Econ. Res. J. 2018, 53, 20–34. [Google Scholar]
- Xu, G.Q.; Liu, Z.Y.; Jiang, Z.H. Decomposition model and empirical study of carbon emissions for China, 1995–2004. China Popul. Resour. Environ. 2006, 6, 158–161. [Google Scholar]
- Shahbaz, M.; Hye, Q.M.A.; Tiwari, A.K.; Leitão, N.C. Economic growth, energy consumption, financial development, international trade and CO2 emissions in Indonesia. Renew. Sustain. Energy Rev. 2013, 25, 109–121. [Google Scholar] [CrossRef]
- Wang, R.; Mirza, N.; Vasbieva, D.G.; Abbas, Q.; Xiong, D. The nexus of carbon emissions, financial development, renewable energy consumption, and technological innovation: What should be the priorities in light of COP 21 Agreements? J. Environ. Manag. 2020, 271, 111027. [Google Scholar] [CrossRef] [PubMed]
- Abam, F.I.; Inah, O.I.; Nwankwojike, B.N. Impact of asset intensity and other energy-associated CO2 emissions drivers in the Nigerian manufacturing sector: A firm-level decomposition (LMDI) analysis. Heliyon 2024, 10, e28197. [Google Scholar] [CrossRef] [PubMed]
- Jiang, S.Z.; Du, H.F.; Xu, M.Z. Dual transition of energy and industrial structure under the carbon peaking and neutrality goals. J. Quant. Technol. Econ. 2024, 41, 109–130. [Google Scholar]
- Shao, S.; Zhang, X.; Zhao, X.R. Empirical decomposition and peaking pathway of carbon dioxide emissions of China’s manufacturing sector–generalized Divisia index method and dynamic scenario analysis. China Ind. Econ. 2017, 3, 44–63. [Google Scholar]
- Jiang, H.; Jiang, S.; Su, B.; Zhou, J.; Jing, C.; Wang, D.; Jiang, T.; Xu, R. Contributors to the carbon emissions of metropolises at different development levels. Energy Sustain. Dev. 2025, 87, 101736. [Google Scholar] [CrossRef]
- Ang, B.W. The LMDI approach to decomposition analysis: A practical guide. Energy Policy 2005, 33, 867–871. [Google Scholar] [CrossRef]
- Zhou, X.; Zhang, M.; Zhou, M.; Zhou, M. A comparative study on decoupling relationship and influence factors between China’s regional economic development and industrial energy–related carbon emissions. J. Clean. Prod. 2016, 142 Pt 2, 783–800. [Google Scholar] [CrossRef]
- Chen, X.; Shuai, C.; Wu, Y.; Zhang, Y. Analysis on the carbon emission peaks of China’s industrial, building, transport, and agricultural sectors. Sci. Total Environ. 2020, 709, 135768. [Google Scholar] [CrossRef] [PubMed]
- Solaymani, S. CO2 emissions patterns in 7 top carbon emitter economies: The case of transport sector–ScienceDirect. Energy 2019, 168, 989–1001. [Google Scholar] [CrossRef]
- Vaninsky, A. Factorial decomposition of CO2 emissions: A generalized Divisia index approach. Energy Econ. 2014, 45, 389–400. [Google Scholar] [CrossRef]
- Chen, L.; Ma, M.; Xiang, X. Decarbonizing or illusion? How carbon emissions of commercial building operations change worldwide. Sustain. Cities Soc. 2023, 96, 104654. [Google Scholar] [CrossRef]
- Shao, S.; Liu, J.; Geng, Y.; Miao, Z.; Yang, Y. Uncovering driving factors of carbon emissions from China’s mining sector. Appl. Energy 2016, 166, 220–238. [Google Scholar] [CrossRef]
- Yan, Q.; Wang, Y.; Baležentis, T.; Streimikiene, D. Analysis of China’s regional thermal electricity generation and CO2 emissions: Decomposition based on the generalized Divisia index. Sci. Total Environ. 2019, 682, 737–755. [Google Scholar] [CrossRef] [PubMed]
- Wang, C.; Wu, L.M. Factors driving the carbon emission reduction in transport along the Silk RoadEconomic Belt: An analysis from the perspective of “double carbon”. J. Arid Land Resour. Environ. 2024, 38, 9–19. [Google Scholar]
- Fageda, X.; Teixidó, J.J. Pricing carbon in the aviation sector: Evidence from the European emissions trading system. J. Environ. Econ. Manag. 2022, 111, 102591. [Google Scholar] [CrossRef]
- Song, X.; Du, S.; Deng, C.; Shen, P.; Xie, M.; Zhao, C.; Chen, C.; Liu, X. Carbon emissions in China’s steel industry from a life cycle perspective: Carbon footprint insights. J. Environ. Sci. 2025, 148, 650–664. [Google Scholar] [CrossRef] [PubMed]
- Li, B.; Han, S.; Wang, Y.; Li, J.; Wang, Y. Feasibility assessment of the carbon emissions peak in China’s construction industry: Factor decomposition and peak forecast. Sci. Total Environ. 2020, 706, 135716. [Google Scholar] [CrossRef] [PubMed]
- Liu, X.; Cifuentes-Faura, J.; Wang, C.; Wang, L. Can green finance policy reduce corporate carbon emissions? Evidence from a quasi-natural experiment in China. Br. Account. Rev. 2024, 101540. [Google Scholar] [CrossRef]
- Wang, K.; Qiao, Y.; Ling, L.; Zhao, Z.; Liu, K. The impact of carbon emissions trading policy on carbon emission efficiency in Chinese cities: Evidence from a quasi-natural experiment. Chin. J. Popul. Resour. Environ. 2023, 21, 121–136. [Google Scholar] [CrossRef]
- Wang, L.H.; Wang, H.; Dong, Z.Q. Policy conditions for compatibility between economic growth and environmental quality: A test of policy bias effects from the perspective of the direction of environmental technological progress. J. Manag. World 2020, 36, 39–60. [Google Scholar]
- Mo, J.L.; Duan, H.B.; Fan, Y.; Wang, S.Y. China’s energy and climate targets in the Paris agreement: Integrated assessment and policy options. Econ. Res. J. 2018, 53, 168–181. [Google Scholar]
- Liu, C.; Zhao, T. Influencing factors and scenario forecasting of China’s low-carbon economy. Resour. Sci. 2011, 33, 844–850. [Google Scholar]
- Wang, S.J.; Kuai, L.Y. Driving factors and peaking path of CO2 emissions for China’s transportation sector. Resour. Sci. 2022, 44, 2415–2427. [Google Scholar]
- Chen, S.Y. Energy consumption, CO2 emission and sustainable development in Chinese industry. Econ. Res. J. 2009, 44, 41–55. [Google Scholar]
- IPCC 2006: “IPCC Guidelines for National Greenhouse Gas Inventories 2006”. Available online: https://www.ipcc-nggip.iges.or.jp/public/2006gl/chinese/index.html (accessed on 16 December 2024).
- Wang, Y.; Bi, Y.; Wang, E.D. Scene prediction of carbon emission peak and emission reduction potential estimation in Chinese industry. China Popul. Resour. Environ. 2017, 27, 131–140. [Google Scholar]
- Zhao, J.B.; Shi, D.; Deng, Z. A framework of China’s high-quality economic development. Res. Econ. Manag. 2019, 40, 15–31. [Google Scholar]
- China Energy Research Association. China Energy Outlook 2030 Report. Available online: https://www.cers.org.cn/site/content/aedd9e2bd6a4f2bc7d05989b12866622.html (accessed on 15 October 2024).
- Tang, D.D.; Liu, X.L.; Ni, H.F.; Yang, Y.W.; Huang, Q.H.; Zhang, X.J. The Changing Global Economic Landscape and China’s Potential Growth Rate and High-quality Development in the Post-epidemic Era. Econ. Res. J. 2020, 8, 4–23. [Google Scholar]
- Aziz, G.; Sarwar, S.; Hussan, M.W.; Saeed, A. The importance of extended-STIRPAT in responding to the environmental footprint: Inclusion of environmental technologies and environmental taxation. Energy Strategy Rev. 2023, 50, 101216. [Google Scholar] [CrossRef]
- Wang, Z.; Yang, L. Delinking indicators on regional industry development and carbon emissions: Beijing–Tianjin–Hebei economic band case. Ecol. Indic. 2015, 48, 41–48. [Google Scholar] [CrossRef]


| Rank | 2010 | Percentage Share | 2022 | Percentage Share |
|---|---|---|---|---|
| 1 | Electricity, heat generation, and supply | 41.22% | Electricity, heat generation, and supply | 44.68% |
| 2 | Petroleum, coal, and other fuel processing industries | 24.65% | Petroleum, coal, and other fuel processing industries | 28.95% |
| 3 | Ferrous metal smelting and rolling industry | 7.65% | Manufacture of chemical materials and products | 6.37% |
| 4 | Nonmetallic mineral products industry | 6.46% | Ferrous metal smelting and rolling industry | 5.46% |
| 5 | Coal mining and washing industry | 6.24% | Nonmetallic mineral products industry | 4.91% |
| Top 5 industries cumulative | 86.21% | Top 5 industries cumulative | 90.36% | |
| 6 | Manufacture of chemical materials and products | 5.84% | Non-ferrous metals smelting and rolling | 2.80% |
| 7 | Non-ferrous metals smelting and rolling | 1.57% | Coal mining and washing industry | 2.72% |
| 8 | Paper and paper products industry | 1.16% | Paper and paper products industry | 0.61% |
| 9 | Oil and gas extraction industry | 0.99% | Oil and gas extraction industry | 0.59% |
| 10 | Textile industry | 0.71% | Gas production and supply industry | 0.49% |
| Top 10 industries cumulative | 96.48% | Top 10 industries cumulative | 97.57% |
| Target Variables | CO2 | Z | Carbon Dioxide Emissions (tons) |
|---|---|---|---|
| Absolute indicators | R | x1 | Revenue from main operations (million CNY) |
| E | x3 | Total energy consumption (tons of standard coal) | |
| P | x5 | Average number of workers employed by industrial enterprises above designated size (10,000 persons) | |
| I | x7 | Investment in fixed assets (million CNY) | |
| T | x9 | R&D expenditure (million CNY) | |
| Relative indicators | CO2/R | x2 | Output carbon intensity |
| CO2/E | x4 | Carbon intensity of energy consumption | |
| CO2/P | x6 | Employment carbon intensity | |
| CO2/I | x8 | Investment carbon intensity | |
| CO2/T | x10 | R&D carbon intensity | |
| R/P | x11 | Output per employee (labor productivity) | |
| E/R | x12 | Energy use per unit of output (Energy intensity) | |
| T/I | x13 | R&D expenditure share in fixed asset investment (R&D expenditure intensity) | |
| R/I | x14 | Fixed asset investment productivity (investment efficiency) | |
| R/T | x15 | Economic output per unit of R&D investment (R&D efficiency) |
| Timescale | 2001–2020 | 2001–2020 | 2006–2015 | 2006–2015 | ||
|---|---|---|---|---|---|---|
| Industry Type | Industry (Revenue from Main Operations) | Industry (Value Added) | High-Carbon Industries | Low-Carbon Industries | ||
| Indicator Type | ||||||
| Absolute indicators | R | x1 | 2.16 | 1.50 | 0.43 | 0.55 |
| E | x3 | −0.20 | −0.18 | −0.11 | −0.14 | |
| P | x5 | 0.63 | 0.64 | 0.15 | 0.16 | |
| I | x7 | −0.01 | −0.01 | 0.00 | 0.06 | |
| T | x9 | 0.21 | 0.29 | 0.04 | 0.08 | |
| Relative indicators | CO2/R | x2 | 0.58 | 0.53 | 0.15 | 0.14 |
| CO2/E | x4 | 0.45 | 0.45 | 0.29 | 0.33 | |
| CO2/P | x6 | −0.21 | −0.21 | −0.14 | −0.17 | |
| CO2/I | x8 | 0.46 | 0.46 | 0.21 | 0.29 | |
| CO2/T | x10 | −0.21 | −0.21 | −0.09 | −0.14 | |
| R/P | x11 | −1.30 | −0.68 | −0.21 | −0.25 | |
| E/R | x12 | −0.02 | −0.01 | −0.01 | −0.03 | |
| T/I | x13 | 0.00 | 0.00 | −0.01 | −0.01 | |
| R/I | x14 | −0.01 | −0.02 | −0.01 | −0.02 | |
| R/T | x15 | −0.01 | −0.02 | 0.00 | 0.00 | |
| Scenario | Baseline Scenario | Low-Carbon Scenario | |||||||
| Sub-Scenario | High Growth | Low Growth | High Growth | Low Growth | |||||
| Stage | 2025–2030 | 2031–2040 | 2025–2030 | 2031–2040 | 2025–2030 | 2031–2040 | 2025–2030 | 2031–2040 | |
| Economic Growth Rate | 5.50 | 5.00 | 5.00 | 4.50 | 5.50 | 5.00 | 5.00 | 4.50 | |
| Industrial Structure (Percentage of Industry) | (2024, 30.05) | (2024, 30.05; 2030, 26.00; 2040, 26.00) | |||||||
| Industrial Ssector Structure (Proportion of High-Carbon Industries) | (2022, 41.34) | (2022, 41.34; 2030, 34.00; 2040, 28.00) | |||||||
| Average Annual Growth Rate of Energy Intensity | 0.00 | 0.00 | |||||||
| Scenario | Integrated Scenario | ||||||||
| Sub-Scenario | High Growth | Low Growth | |||||||
| Stage | 2025–2030 | 2031–2040 | 2025–2030 | 2031–2040 | |||||
| Economic Growth Rate | 5.50 | 5.00 | 5.00 | 4.50 | |||||
| Industrial Structure (Percentage of Industry) | (2024, 30.05; 2030, 26.00; 2040, 26.00) | ||||||||
| Industrial Sector Structure (Proportion of High-Carbon Industries) | (2022, 41.34; 2030, 36.00; 2040, 28.00) | ||||||||
| Industry Type | High Carbon | Low Carbon | High Carbon | Low Carbon | High Carbon | Low Carbon | High Carbon | Low Carbon | |
| Average Annual Growth Rate of Energy Intensity | coal | −0.02 | −0.10 | −0.05 | −0.20 | −0.01 | −0.08 | −0.04 | −0.18 |
| crude oil | −0.01 | 0.00 | −0.03 | 0.00 | −0.01 | 0.00 | −0.02 | 0.00 | |
| gas | 0.06 | 0.01 | 0.00 | 0.01 | 0.03 | 0.01 | 0.00 | 0.00 | |
Disclaimer/Publisher’s Note: The statements, opinions and data contained in all publications are solely those of the individual author(s) and contributor(s) and not of MDPI and/or the editor(s). MDPI and/or the editor(s) disclaim responsibility for any injury to people or property resulting from any ideas, methods, instructions or products referred to in the content. |
© 2025 by the authors. Licensee MDPI, Basel, Switzerland. This article is an open access article distributed under the terms and conditions of the Creative Commons Attribution (CC BY) license (https://creativecommons.org/licenses/by/4.0/).
Share and Cite
Hou, Y.; Zhang, X.; Geng, K.; Li, Y. Decomposition of Industrial Carbon Emission Drivers and Exploration of Peak Pathways: Empirical Evidence from China. Sustainability 2025, 17, 6479. https://doi.org/10.3390/su17146479
Hou Y, Zhang X, Geng K, Li Y. Decomposition of Industrial Carbon Emission Drivers and Exploration of Peak Pathways: Empirical Evidence from China. Sustainability. 2025; 17(14):6479. https://doi.org/10.3390/su17146479
Chicago/Turabian StyleHou, Yuling, Xinyu Zhang, Kaiwen Geng, and Yang Li. 2025. "Decomposition of Industrial Carbon Emission Drivers and Exploration of Peak Pathways: Empirical Evidence from China" Sustainability 17, no. 14: 6479. https://doi.org/10.3390/su17146479
APA StyleHou, Y., Zhang, X., Geng, K., & Li, Y. (2025). Decomposition of Industrial Carbon Emission Drivers and Exploration of Peak Pathways: Empirical Evidence from China. Sustainability, 17(14), 6479. https://doi.org/10.3390/su17146479