Article

Performance Assessment of Advanced Daily Surface Soil Moisture Products in China for Sustainable Land and Water Management

School of Geography Science and Geomatics Engineering, Suzhou University of Science and Technology, Suzhou 215009, China
*
Author to whom correspondence should be addressed.
Sustainability 2025, 17(14), 6482; https://doi.org/10.3390/su17146482
Submission received: 5 June 2025 / Revised: 4 July 2025 / Accepted: 14 July 2025 / Published: 15 July 2025

Abstract

This study evaluates the performance of nine satellite and model-based daily surface soil moisture products, encompassing sixteen algorithm versions across mainland China to support sustainable land and water management. The assessment utilizes 2018 in situ measurements from over 2400 stations in China’s Automatic Soil Moisture Monitoring Network. All products were standardized to a 0.25° × 0.25° grid in the WGS-84 coordinate system through reprojection and resampling for consistent comparison. Daily averaged station observations were matched to product pixels using a 10 km radius buffer, with the mean station value as the reference for each time series after rigorous quality control. Results reveal distinct performance rankings, with SMAP-based products, particularly the SMAP_IB descending orbit variant, achieving the lowest unbiased root mean square deviation (ubRMSD) and highest correlation with in situ data. Blended products like ESA CCI and NOAA SMOPS, alongside reanalysis datasets such as ERA5 and MERRA2, outperformed SMOS and China’s FY3 products. The SoMo.ml product showed the broadest spatial coverage and strong temporal consistency, while FY3-based products showed limitations in spatial reliability and seasonal dynamics capture. These findings provide critical insights for selecting appropriate soil moisture datasets to enhance sustainable agricultural practices, optimize water resource allocation, monitor ecosystem resilience, and support climate adaptation strategies, therefore advancing sustainable development across diverse geographical regions in China.

1. Introduction

Soil moisture critically influences Earth’s hydrological and climatic processes by controlling land–atmosphere water and energy exchanges, affecting climate variability across scales [1]. It also supports agricultural production, water resources, ecosystems, and hazard mitigation. Acquiring spatially comprehensive, temporally continuous, high-accuracy soil moisture data is essential for understanding land–atmosphere interactions and informing environmental management decisions [2,3,4]. Contemporary soil moisture monitoring employs three principal approaches: in situ measurements, satellite remote sensing, and land surface model simulations. While in situ observations deliver the highest accuracy, deploying and maintaining ground stations poses logistical and financial challenges in areas such as China’s mountainous west. Moreover, the sparse spatial distribution of these stations limits their ability to capture regional-to-global variability [5,6]. Model-based simulations depend on assimilated satellite and meteorological data and may be affected by parameterization biases or lack of observational constraint, often resulting in reduced accuracy compared to field measurements.
Advances in satellite remote sensing have facilitated the use of microwave sensors—including radiometers and synthetic aperture radars—that penetrate atmospheric interference and vegetation, enabling consistent observations across diverse surface and climatic conditions. Such systems offer large-scale coverage, regular revisit times, and increasingly refined spatial resolutions, making them vital for monitoring surface soil moisture at continental scales [7,8,9].
Alongside improvements in retrieval algorithms, increasing attention has been directed toward the intercomparison and validation of satellite-based soil moisture products. Current operational products include NASA’s Soil Moisture Active Passive (SMAP), ESA’s Soil Moisture and Ocean Salinity (SMOS), China’s Fengyun (FY) satellite series, and the harmonized ESA Climate Change Initiative (CCI) Soil Moisture dataset. Due to differences in sensor design, algorithmic assumptions, and temporal or spatial coverage, the accuracy and applicability of these products vary substantially [10,11,12]. A comprehensive evaluation is therefore essential to determine their reliability across regions and to guide optimal product selection.
Previous validation studies have employed varying temporal and spatial scopes. Dorigo et al. [13] analyzed the ESA CCI soil moisture product from 1979 to 2010, highlighting quality improvements over time. Yee et al. [14] compared AMSR2 and SMOS products in southeastern Australia, finding better performance for AMSR2. Beck et al. [15] ranked 18 global soil moisture products using data from 826 in situ sensors between 2015 and 2019. Liu et al. [16] investigated how surface heterogeneity and soil texture affect retrieval performance, emphasizing the importance of environmental controls.
Within China, numerous regional studies have examined the applicability of satellite soil moisture products across representative landscapes [17,18,19,20,21,22]. However, most focused on isolated regions or individual products, lacking integrated cross-product validation at the national scale. This absence of large-scale evaluation across China’s diverse climates and terrains limits our understanding of product suitability in operational applications.
This study addresses these gaps by using 2018 in situ observations from more than 2400 ground stations in the China Meteorological Administration’s soil moisture monitoring network to evaluate the performance of nine latest daily soil moisture products (sixteen product versions in total) across mainland China. The goals are to quantify regional performance variation, identify high-performing products under different environmental conditions, and offer guidance for algorithm development and product application. The rest of this manuscript is organized as follows. Section 2 describes the datasets used, including in situ soil moisture observations and the selected remote sensing and reanalysis products, as well as the spatial resampling and temporal matching methods applied. Section 3 presents the results of the performance evaluation, including spatial and temporal analyses across multiple metrics, and provides a discussion of the findings in the context of product usability and regional differences. Finally, Section 4 summarizes the main conclusions.

2. Materials and Methods

2.1. Study Area

This study focuses on the mainland territory of China, encompassing a wide range of climatic zones, land cover types, and soil properties. The study area is shown in Figure 1, which also includes the distribution of in situ soil moisture monitoring stations used for validation. The station network ensures spatial representation across different eco-regions and soil-climate zones.

2.2. Data Collection

2.2.1. SMOS Data

The SMOS mission, operated by the European Space Agency, employs an L-band synthetic aperture microwave radiometer to acquire global brightness temperature observations for soil moisture and sea surface salinity retrievals [23]. The SMOS Level 3 (L3) soil moisture product delivers daily global gridded estimates at 25 km spatial resolution, utilizing a multi-orbit retrieval algorithm that combines ascending and descending pass observations to optimize temporal sampling and reduce retrieval uncertainties.
The SMOS-IC version 2 product, developed collaboratively by the French National Research Institute for Agriculture, Food and Environment (INRAE) and the Centre d’Etudes Spatiales de la Biosphère (CESBIO), employs a coupled retrieval approach for simultaneous estimation of soil moisture and vegetation optical depth. This product maintains the 25 km spatial resolution of the parent SMOS observations while implementing enhanced quality control procedures, including systematic filtering of radio frequency interference, correction for vegetation effects, and removal of retrievals over frozen or snow-covered surfaces.

2.2.2. SMAP Soil Moisture Products

The SMAP mission, operated by NASA, utilizes a combined L-band radar and radiometer system to acquire complementary active and passive microwave observations for enhanced soil moisture retrievals [24]. The SMAP Level 3 (L3) soil moisture product provides global daily estimates at 36 km spatial resolution, delivering separate ascending and descending orbit retrievals based on the Dual Channel Algorithm (DCA). This baseline algorithm exploits the differential sensitivity of horizontal and vertical polarization brightness temperatures to soil dielectric properties while accounting for vegetation attenuation effects through empirical parameterizations.
The SMAP-IB (INRAE-Bordeaux) product employs the L-band Microwave Emission of the Biosphere (L-MEB) radiative transfer model to simultaneously retrieve soil moisture and vegetation optical depth from SMAP brightness temperature observations. This physics-based approach operates independently of auxiliary soil moisture or vegetation information from optical sensors, instead relying on the intrinsic microwave signatures to constrain both surface and vegetation parameters through iterative optimization procedures.

2.2.3. FY-3 Soil Moisture Products

The Fengyun-3 (FY-3) constellation represents China’s operational polar-orbiting meteorological satellite program, with soil moisture retrievals derived from the onboard Microwave Radiation Imager (MWRI) [25]. The MWRI sensor operates across multiple frequency bands (10.65, 18.7, 23.8, 36.5, and 89.0 GHz) in both horizontal and vertical polarizations, enabling multi-channel soil moisture estimation at 25 km spatial resolution.
This study incorporates soil moisture products from both FY-3B (operational 2010–2017) and FY-3C (operational 2013–present) satellites, obtained from the National Satellite Meteorological Center’s Fengyun Satellite Remote Sensing Data Service. The FY-3 soil moisture algorithm employs a land surface microwave emission model that relates multi-frequency brightness temperatures to surface soil moisture through empirical relationships calibrated for diverse land cover types and climatic conditions across China and surrounding regions.

2.2.4. Blended Soil Moisture Products

Blended soil moisture products, which integrate data from multiple sensors via fusion algorithms, can offer enhanced accuracy and superior spatial coverage relative to single-sensor products. Among the prominently utilized blended products are the European Space Agency’s Climate Change Initiative (ESA CCI) soil moisture and the National Oceanic and Atmospheric Administration’s Soil Moisture Operational Products System (SMOPS) [26,27]. The ESA CCI soil moisture, a component of ESA’s Essential Climate Variable monitoring program, releases new datasets annually at a spatial resolution of 0.25° × 0.25°. The SMOPS delivers global soil moisture data every six hours, also on a 0.25° × 0.25° grid.

2.2.5. Reanalysis and Model-Based Soil Moisture Products

1.
ERA5
ERA5, the fifth-generation global atmospheric reanalysis, is produced by the European Centre for Medium-Range Weather Forecasts (ECMWF) [28]. This reanalysis provides hourly estimates of numerous climate variables pertaining to the atmosphere, land surface, and oceanic domains. The soil moisture data utilized in this study were obtained from the Copernicus Climate Change Service (C3S) Climate Data Store. Specifically, daily averaged volumetric soil water for Layer 1, representing the topsoil layer (0–7 cm), was employed at a spatial resolution of 0.1° × 0.1°.
2.
MERRA-2
The Modern-Era Retrospective Analysis for Research and Applications, Version 2 (MERRA-2), represents a significant advancement in reanalysis products, as it is the first long-term global reanalysis to assimilate space-borne aerosol observations and incorporate their interactions with other physical processes within the climate system [29]. Produced by NASA’s Global Modeling and Assimilation Office (GMAO), MERRA-2 offers a continuous data record commencing in 1980, superseding the original MERRA dataset. This iteration features an improved data assimilation system, which includes the integration of hyperspectral radiance, microwave observations, and Global Positioning System (GPS) radio occultation data.
3.
SoMo.ml Product
The SoMo.ml dataset, accessible at https://www.bgc-jena.mpg.de/geodb/, accessed on 1 June 2024, employs long short-term memory (LSTM) neural networks to generate a comprehensive global soil moisture record derived from in situ measurements [30]. This dataset provides multi-layer soil moisture information at depths of 0–10 cm, 10–30 cm, and 30–50 cm, with a spatial resolution of 0.25° × 0.25°, spanning the period from 2000 to 2019. For the purpose of this study, the top layer (0–10 cm) was utilized as an independent reference dataset to evaluate various soil moisture retrieval strategies.
The temporal and spatial resolution, coordinate reference system, gridding information, availability of separate ascending/descending orbit data, and data size of all the products are summarized in Table 1.

2.2.6. In Situ Station Data

Automatic soil moisture observation stations enable convenient, rapid, and continuous measurements of soil moisture at various depths. These fixed-location stations are characterized by high accuracy, real-time monitoring capability, and strong temporal continuity. Currently, China operates a nationwide observation network comprising over 2400 such stations, the distribution of which is presented in Figure 1.
These stations utilize Frequency Domain Reflectometry (FDR) technology for measuring soil water content. The resulting observational dataset specifically provides surface soil moisture information for the 0–10 cm layer. For this study, in situ data for the entire year of 2018 were acquired from the China Meteorological Administration’s automatic surface soil moisture monitoring network.

2.2.7. Auxiliary Data

The eco-geographical regionalization data of China were obtained from the Resource and Environment Science and Data Center of the Chinese Academy of Sciences (https://www.resdc.cn/data.aspx), accessed on 1 June 2024. This dataset categorizes mainland China into five distinct zones: humid, semi-humid, semi-arid, arid, and a transitional humid/semi-humid region. The spatial distribution of these regions is presented in Figure 1. The classification criteria are detailed in the dataset metadata, available on the data acquisition webpage.

2.3. Methods

2.3.1. Evaluation Preprocessing

In the evaluation of satellite remote sensing and land surface model products, a reference dataset is typically selected under the assumption that its error is negligible. The evaluation process begins with the harmonization of coordinate reference systems across all datasets. Through reprojection and resampling, both the target and reference datasets are standardized to a common spatial and temporal resolution. Based on the aligned datasets, various evaluation metrics are calculated to assess product performance from multiple perspectives. In this study, we employed in situ soil moisture measurements from China’s national monitoring network in 2018 as the reference to evaluate the performance of recently released surface soil moisture products over mainland China.
During the data preprocessing stage, the Hampel filter was applied to the raw in situ measurements to identify and remove outliers caused by sensor anomalies [31]. The observation time series were then temporally resampled to generate daily average values, ensuring a uniform daily resolution across all sites. As summarized in Table 1, the soil moisture products differ in coordinate reference systems and spatial resolutions. Although resampling can introduce representativeness errors, all datasets were resampled to a consistent 0.25° × 0.25° spatial grid using the WGS-84 coordinate system to ensure comparability. Given that previous studies have identified substantial quality differences between ascending and descending satellite overpasses, these were evaluated separately in this study.
For each of the nine soil moisture products (sixteen versions in total), we extracted the extent of mainland China. Spatial matching was performed using the central coordinates of each grid cell. For each grid cell, in situ stations located within a 10 km radius of the center were identified, and their daily average values were computed. These in situ averages were then paired with the corresponding grid cell values to form matched time series for evaluation. In total, 1972 grid cells were successfully matched with in situ observations. Only pixels identified as high-quality in the respective product documentation were included in the analysis. For the FY-3 satellite data provided by the National Satellite Meteorological Center, due to the absence of quality control flags, we used the ascending and descending orbit data as provided. Finally, we overlaid the 1972 matched grid cells with China’s eco-geographical regionalization map to assign each pixel to a climate region, thereby enabling performance assessment under varying hydroclimatic conditions.

2.3.2. Evaluation Metrics

To evaluate the performance of soil moisture products over mainland China, we used in situ station data as the reference and adopted three quantitative metrics: mean bias (Bias), unbiased root mean square deviation (ubRMSD), and Pearson correlation coefficient (R).
To further examine spatial performance differences, we stratified the evaluation by eco-geographical region, allowing for an assessment of product robustness under varying hydroclimatic and land surface conditions. This regional analysis helps identify strengths and limitations of each product in specific environments, such as arid zones, temperate agricultural areas, or humid forested regions, thereby informing appropriate applications in environmental monitoring and land surface modeling.

3. Results and Discussion

3.1. Overall Product Evaluation

Figure 2 presents the spatially averaged distributions of nine soil moisture products across mainland China for the year 2018. The figure clearly illustrates substantial differences in the spatial patterns of annual mean soil moisture among the various products. SMAP L3 soil moisture products show high consistency between ascending and descending passes. SMAP_IB descending data exhibits data gaps in southern China and drier conditions in northern arid regions versus SMAP L3; however, spatial patterns remain consistent. SMOS products generally read lower than SMAP L3, particularly in northeastern and southern China. SMOS ascending data varies significantly across the Qinghai-Tibet Plateau and southern regions, while SMOS L3 and SMOS_IC products align closely. FY3 products indicate drier conditions than SMAP in southern China, especially in the Sichuan Basin, with FY3B ascending data showing stronger drying trends than FY3C products. SoMo.ml products match SMAP but struggle with fine-scale moisture representation in transition zones. Among blended products, CCI shows higher moisture than SMOPS in the northwest, with better detail in the plateau and transition regions. Model products differ significantly in the plateau and arid regions, with ERA5 showing drier trends and underestimating moisture; however, SoMo.ml and ERA5 display similar overall distribution patterns. These discrepancies can be attributed to multiple factors, including differences in quality control procedures, retrieval algorithms, and satellite sensor characteristics. Notably, the spatial coverage of satellite-based products varies due to the influence of quality control filters, which often exclude low-confidence retrievals. In addition, significant differences are observed between ascending and descending overpasses of the same satellite, reflecting variations in observation geometry and surface conditions at different times of day. Differences among products employing distinct retrieval algorithms further contribute to inconsistencies in spatial distribution. These findings underscore the necessity of conducting a comprehensive performance evaluation to assess the reliability and applicability of each product under varying conditions across China.
Ground stations provide the most reliable soil moisture observations. Using these as reference points allows us to evaluate and compare satellite products to determine their relative performance with maximum accuracy. Figure 3 presents scatter density plots comparing each soil moisture product with in situ measurements, where the black solid line indicates the 1:1 reference line. For satellite-based soil moisture products directly derived from remote sensing observations, ascending (A) and descending (D) overpasses were evaluated separately. As a result, these products have fewer matched data pairs compared to the SoMo.ml, blended, and land surface model products, which offer continuous spatial and temporal coverage. After quality control, the number of collocated data pairs for the SMOS products is relatively limited, largely due to stricter filtering criteria and more frequent data gaps.
In general, SMOS products tend to underestimate soil moisture compared to in situ observations. Among them, the SMOS_IC product performs slightly better than the SMOS_L3 product, exhibiting improved agreement with ground measurements. The SMOS_L3 ascending and descending products both yield an unbiased root mean square deviation (ubRMSD) of 0.13 m3/m3 and a correlation coefficient (R) of approximately 0.42. In contrast, SMAP products demonstrate markedly better performance than other satellite-based products, showing the highest consistency with in situ observations. The SMAP_L3 product achieves an ubRMSD of 0.11 m3/m3 and a correlation coefficient of 0.53. However, SMAP data tend to slightly overestimate soil moisture under high-moisture surface conditions, likely due to saturation effects or retrieval limitations in densely vegetated or wet regions. FY-3 satellite-derived products exhibit the weakest performance among all evaluated datasets. The scatter plots reveal a dispersed distribution, indicating poor agreement with in situ measurements. FY-3 products typically underestimate soil moisture, particularly under low to moderate soil moisture conditions. It should be noted that the absence of official data quality control methods may cause imbalance issues when evaluating the magnitude of FY-3 products, as low-quality data cannot be properly filtered.
Compared to in situ station observations, SoMo.ml products, blended soil moisture products, and ERA-5 products provide better spatial coverage; however, all tend to underestimate surface moisture. Among these three categories, SoMo.ml products demonstrate the best performance, blended soil moisture products surpass land surface model products, and both outperform SMOS and FY3 satellite products. These products exhibit ubRMSD values of approximately 0.10 m3/m3, with correlation coefficients above 0.50.

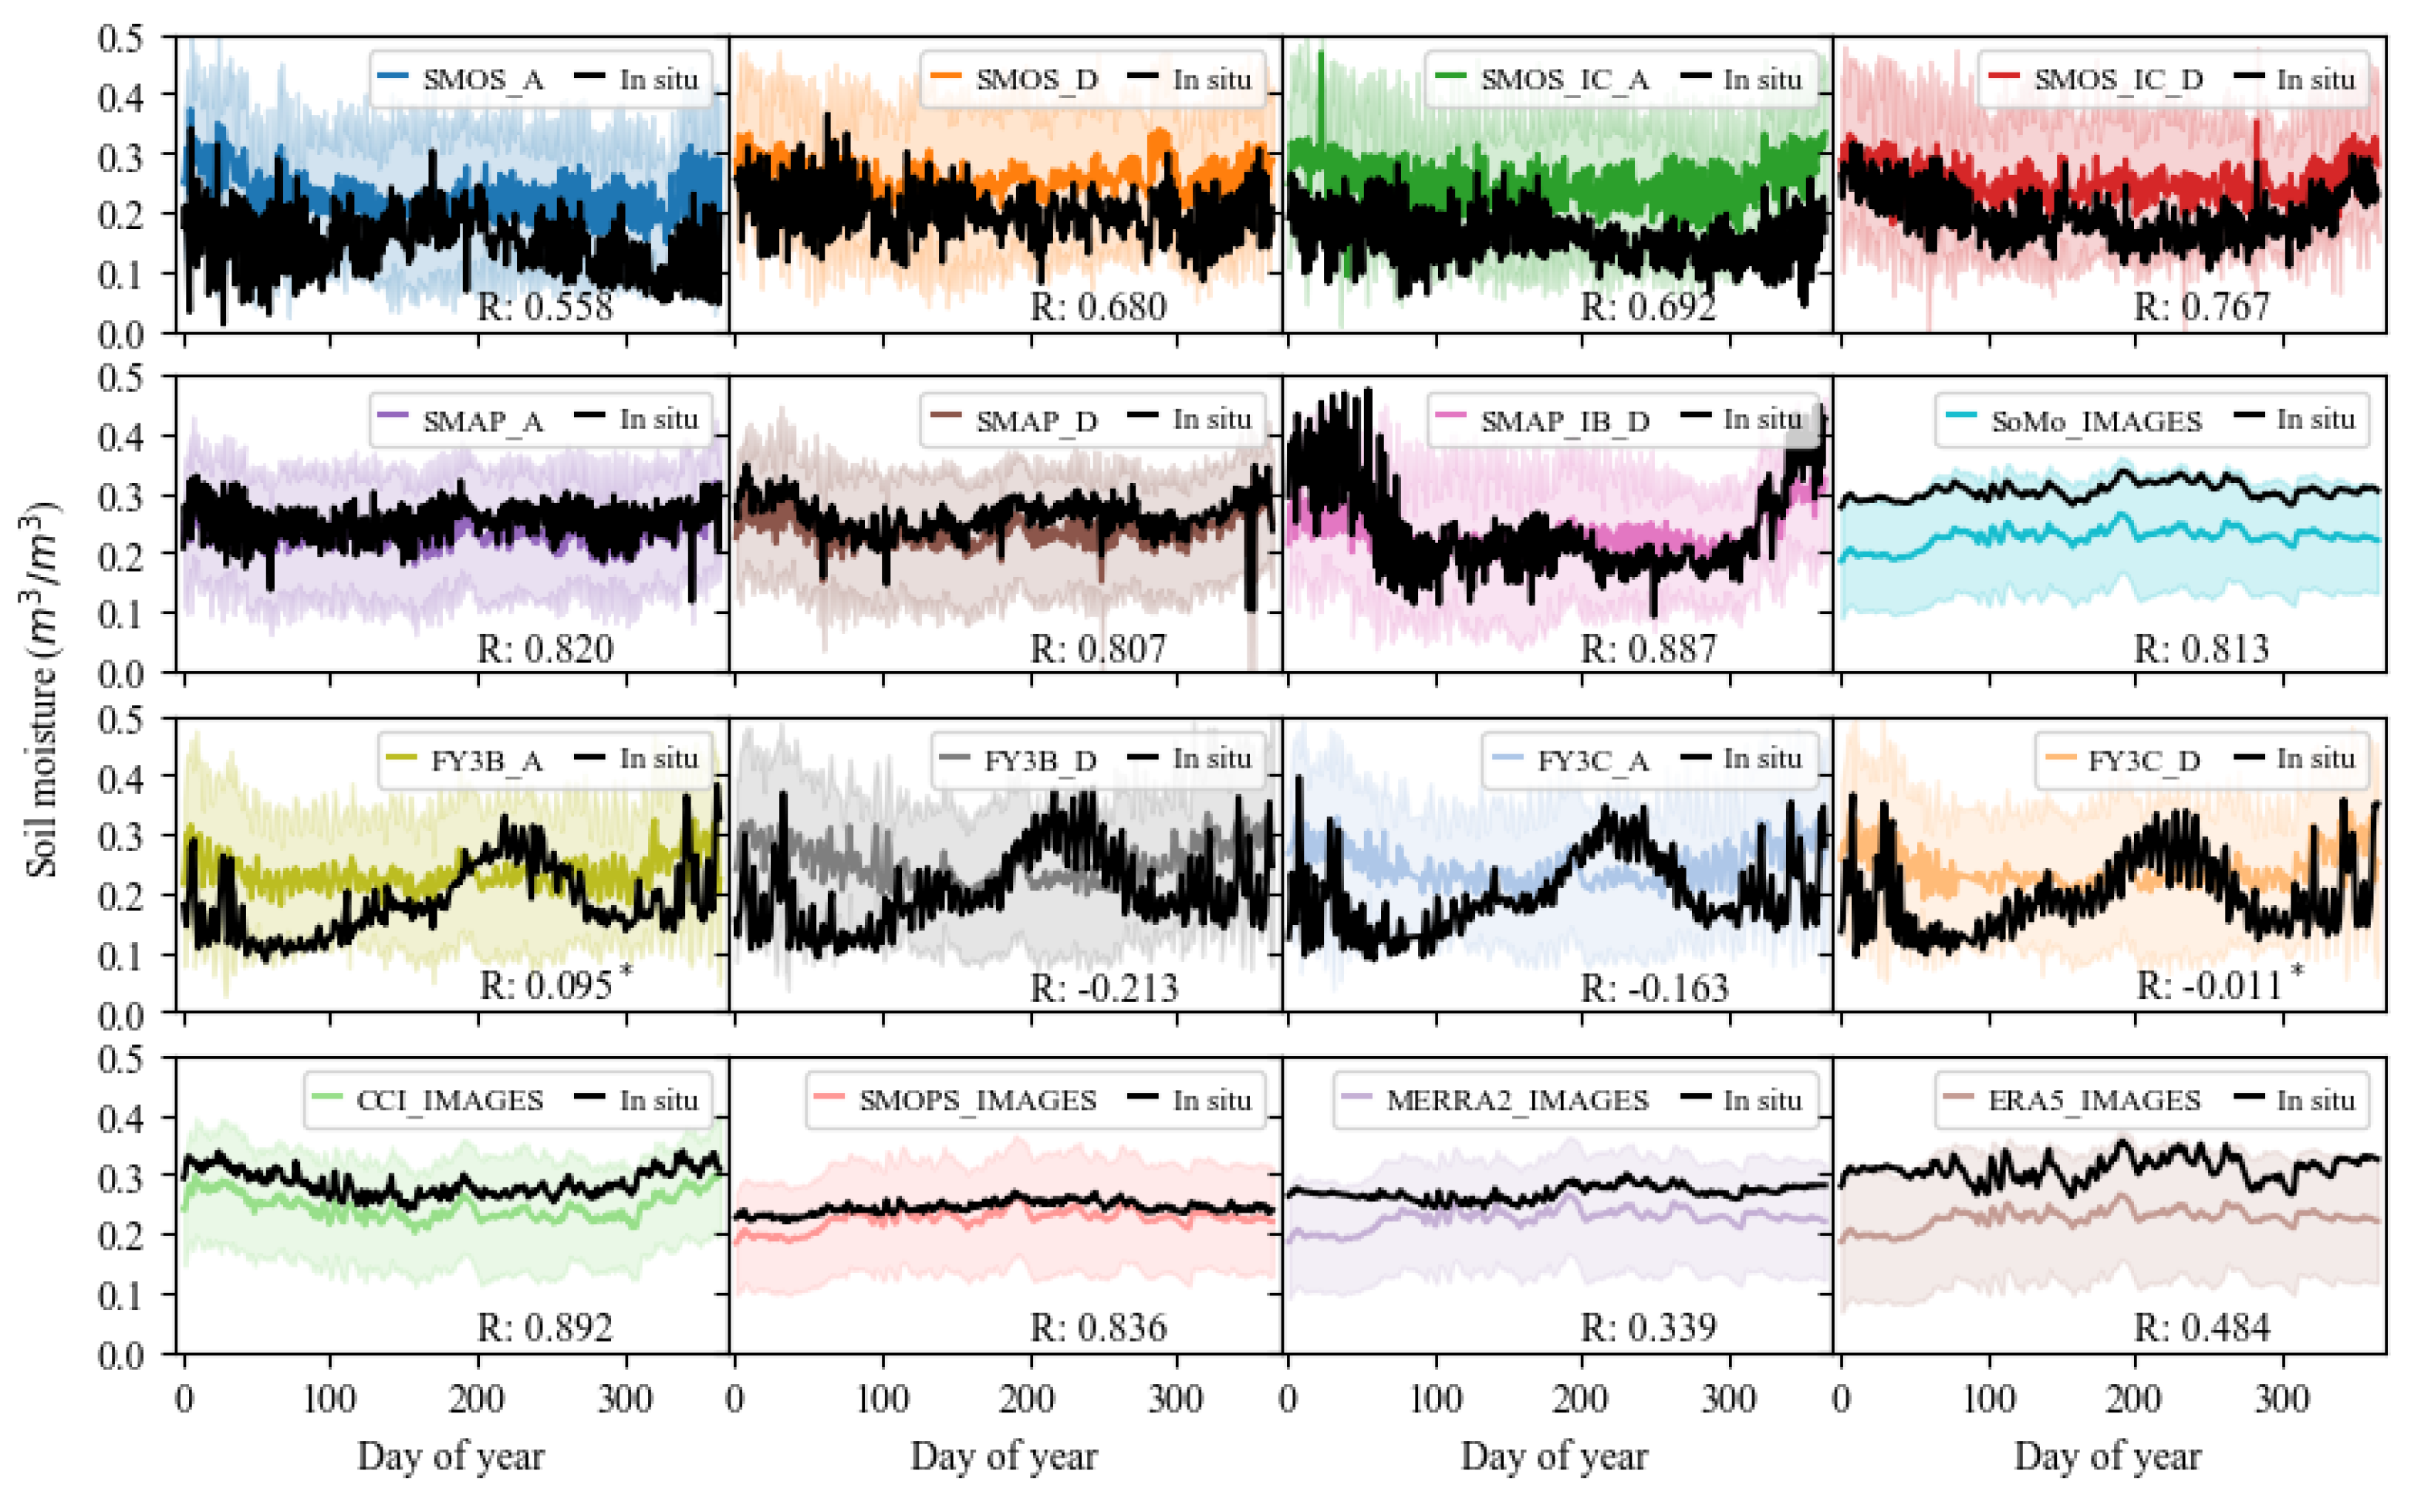
3.2. Spatiotemporal Performance of the Products

Figure 4 and Figure 5 present the ubRMSD and R of the time series matched between different satellite-derived products and ground-based station data across various validated grid cells.
It is important to note that the number of grid cells included in the evaluation varies across products. This variation is primarily determined by each product’s spatial coverage and the application of quality control criteria as specified in the respective product documentation. For the SMOS products, validation grid cells with ubRMSD values between 0.00 m3/m3 and 0.05 m3/m3 are primarily located in regions south of the Yangtze River. In contrast, larger errors are mostly concentrated in the humid southern regions. This seemingly contradictory result may be explained by SMOS’s L-band radiometer sensitivity to vegetation water content and surface roughness, which are higher in humid, densely vegetated areas. The SMOS_IC product shows a similar spatial pattern to SMOS_L3; however, it includes fewer grid cells with errors in the 0.10–0.15 m3/m3 range, likely due to its improved retrieval algorithm that incorporates ancillary vegetation data.
The SMAP_L3 ascending and descending products exhibit nearly identical spatial error patterns across the validation grids. Most collocated grid cells show ubRMSD values ranging from 0.05 to 0.10 m3/m3. Compared to SMAP_L3, the SMAP_IB descending orbit product performs slightly better in overlapping regions such as Shandong Province, potentially due to the descending orbit’s alignment with drier surface conditions during overpass times, which reduces radio-frequency interference and enhances retrieval stability. The four FY-3 products display relatively high errors across humid regions in southern, northern, and northeastern China. These products operate at higher frequencies (e.g., X-band), which are more susceptible to atmospheric interference and less capable of penetrating dense vegetation, contributing to reduced retrieval accuracy in these regions. This highlights the importance of sensor frequency and vegetation correction in algorithm design for subtropical zones. The SoMo.ml product, blended soil moisture datasets, and the MERRA-2 reanalysis show consistent spatial patterns, with most grid cells falling within the 0.00 to 0.05 m3/m3 error range. Their favorable performance is likely due to the integration of multiple data sources (e.g., satellite, reanalysis, and in situ observations), which helps mitigate the limitations of any single source and enhances spatial coherence. However, slightly poorer performance in the Sichuan Basin—characterized by complex terrain and frequent cloud cover—indicates that terrain heterogeneity and microclimate may still challenge blended and reanalysis approaches.
In contrast, the ERA5 product performs less favorably in northern China. This may be due to an inadequate capture of the fine-scale variability in soil texture and precipitation patterns in semi-arid regions. These findings emphasize that regional performance differences are driven not only by surface conditions (e.g., vegetation, topography, climate) but also by sensor characteristics and algorithmic assumptions embedded in each product.
The spatial distribution of R values across validation cells reveals distinct patterns among the different soil moisture products. For the SMOS products, grid cells with high R values (greater than 0.7) are primarily concentrated in regions south of the Yangtze River. In contrast, the SMAP_L3 product covers a broader range of validation pixels in the southern regions compared to SMOS products. Both the SMAP_L3 and SMAP_IB descending orbit products exhibit highly consistent spatial patterns across their overlapping validation grids, suggesting stable performance in these regions. The FY-3 satellite products show a different spatial distribution, with most collocated validation grid cells concentrated in northern and northeastern China. However, the number of high-R grid cells is significantly lower than that observed for the SMAP products, indicating weaker correlation with in situ measurements. In contrast to the previously observed ubRMSD spatial patterns, the SoMo.ml, blended, and surface model products demonstrate different distributions of R. The SoMo.ml product performs best among these categories, with the highest proportion of grid cells exhibiting strong correlations (R > 0.7). The two blended products (e.g., CCI and SMOPS) show similar spatial patterns, with high-R grid cells mainly located in the southern regions of the Yangtze River. Similarly, the two land surface model products (ERA5 and MERRA-2) also exhibit comparable spatial distributions, with high-R grid cells predominantly concentrated in southern China.
Figure 6 presents the statistical evaluation metrics for each soil moisture product, based on matched in situ measurements across all valid grid cells. The SMOS descending orbit product clearly outperforms its ascending counterpart. For SMOS-IC, the difference between ascending and descending orbits is considerably smaller than for SMOS_L3, and the distributions of the ubRMSD and correlation coefficient (R) are more concentrated, indicating more stable performance. Specifically, the median ubRMSD and R values for SMOS-IC are 0.056 m3/m3 and 0.577 for the ascending orbit, and 0.058 m3/m3 and 0.535 for the descending orbit. In comparison, the SMOS_L3 product exhibits higher median ubRMSD values—0.066 m3/m3 for the ascending and 0.076 m3/m3 for the descending orbit—with corresponding R values of 0.577 and 0.504. These results confirm that SMOS-IC slightly outperforms SMOS_L3 in terms of both accuracy and stability.
For SMAP products, the difference between ascending and descending orbits is minimal in the L3 dataset. However, the SMAP_IB descending orbit product performs noticeably better than SMAP_L3, showing a more compact distribution of both the ubRMSD and R. The SMAP_IB descending product achieves a median ubRMSD of 0.049 m3/m3 and a median R of 0.608, while the SMAP_L3 descending product reports values of 0.057 m3/m3 and 0.571, respectively.
The FY-3 satellite products exhibit the weakest overall performance. Their ubRMSD distributions are highly dispersed, and the median ubRMSD values are consistently higher than those of other products. Additionally, the distribution of R values displays two distinct peaks, suggesting inconsistent correlation with in situ data. The median R values are significantly lower than those of other satellite, blended, and model-based products. Among the FY-3 products, FY-3B L2 (ascending orbit) and FY-3C L2 (descending orbit) show slightly improved performance compared to their respective counterpart passes.
Among the blended products, the ESA CCI product performs marginally better than SMOPS. In general, the ubRMSD distributions and medians of blended products are superior to those of single-satellite products. However, the correlation coefficients (R) for blended products tend to be lower, suggesting a trade-off between overall accuracy and temporal consistency.
The two land surface model products—ERA5 and MERRA-2—exhibit similar performance patterns, with ERA5 showing slightly better results in both the ubRMSD and R. These findings suggest that while blended and model-based products provide broader spatial and temporal coverage, they may vary in accuracy depending on the evaluation metric.
Based on the matched data pairs, the daily mean values of different products and in situ measurement data were calculated in the time domain, along with the standard deviations of the satellite-derived products relative to the in situ measurements. Figure 7 presents line plots of the daily mean time series errors for each product. Each subplot shows the R between product and station means at the bottom, with asterisk indicating correlations that failed to pass the significance test at p < 0.05.
Among the single-satellite sensor products, the SMAP L3 product exhibited the highest consistency with the in situ measurements, showing the smallest deviations in the daily mean soil moisture time series. The SMAP_IB product also maintained a high overall consistency with the in situ measurement data time series, achieving an R value of 0.887, which is higher than that of the SMAP L3 ascending and descending products, 0.820 and 0.807, respectively. The performance of the SMOS products was slightly inferior to that of SMAP; however, the SMOS time series showed a generally consistent variation trend with the in situ measurement data, and the soil moisture values from the stations were systematically drier compared to SMOS estimates. Specifically, the SMOS ascending product performed worse than its descending counterpart, while the SMOS_IC product overall outperformed the SMOS L3 product. Among the satellite products, the FY-3 satellite products exhibited the poorest performance, as they could barely capture the annual variation of surface soil moisture across China in the time domain, with the daily mean time series even showing negative correlations with in situ measurement data. The SoMo.ml and blended soil moisture products performed comparably to the SMAP products and outperformed the land surface model products. These products accurately reflected both short-term fluctuations and long-term seasonal trends in soil moisture. Among them, the CCI product showed the best performance, with an R value of 0.892 relative to the in situ daily mean time series. The ERA5 product performed slightly better than MERRA2, and both outperformed the FY-3 products by a significant margin.

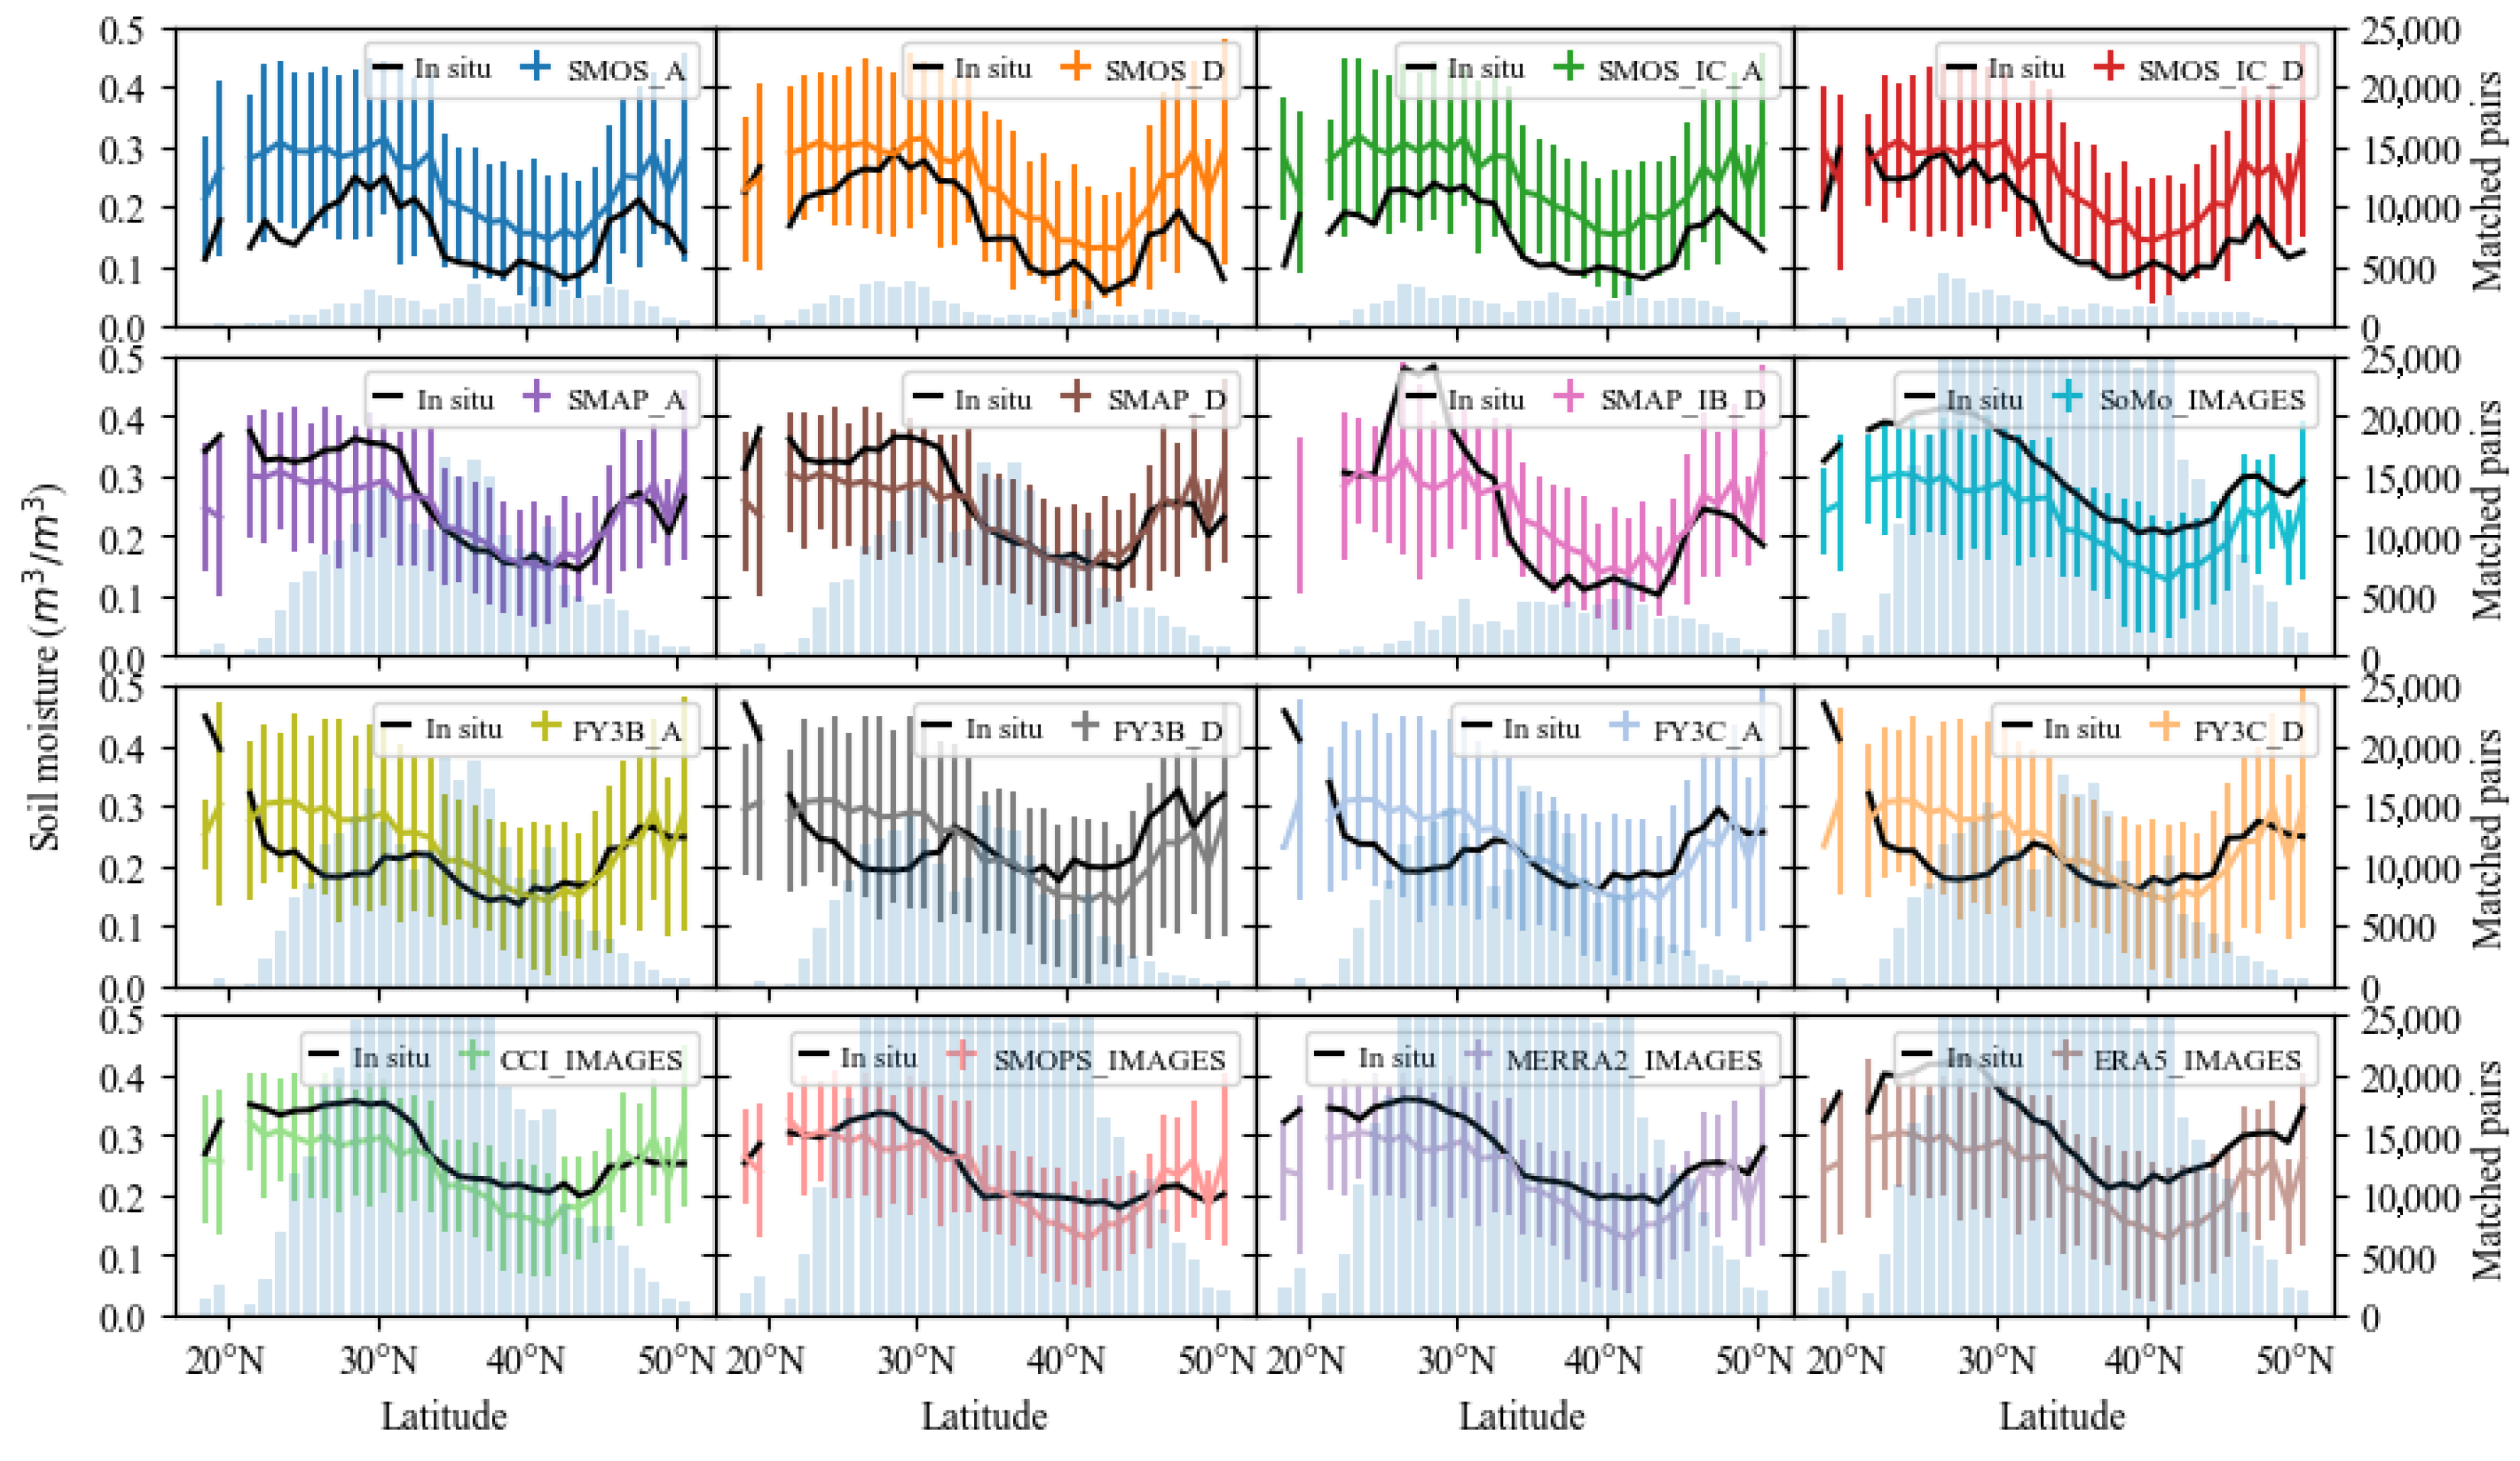
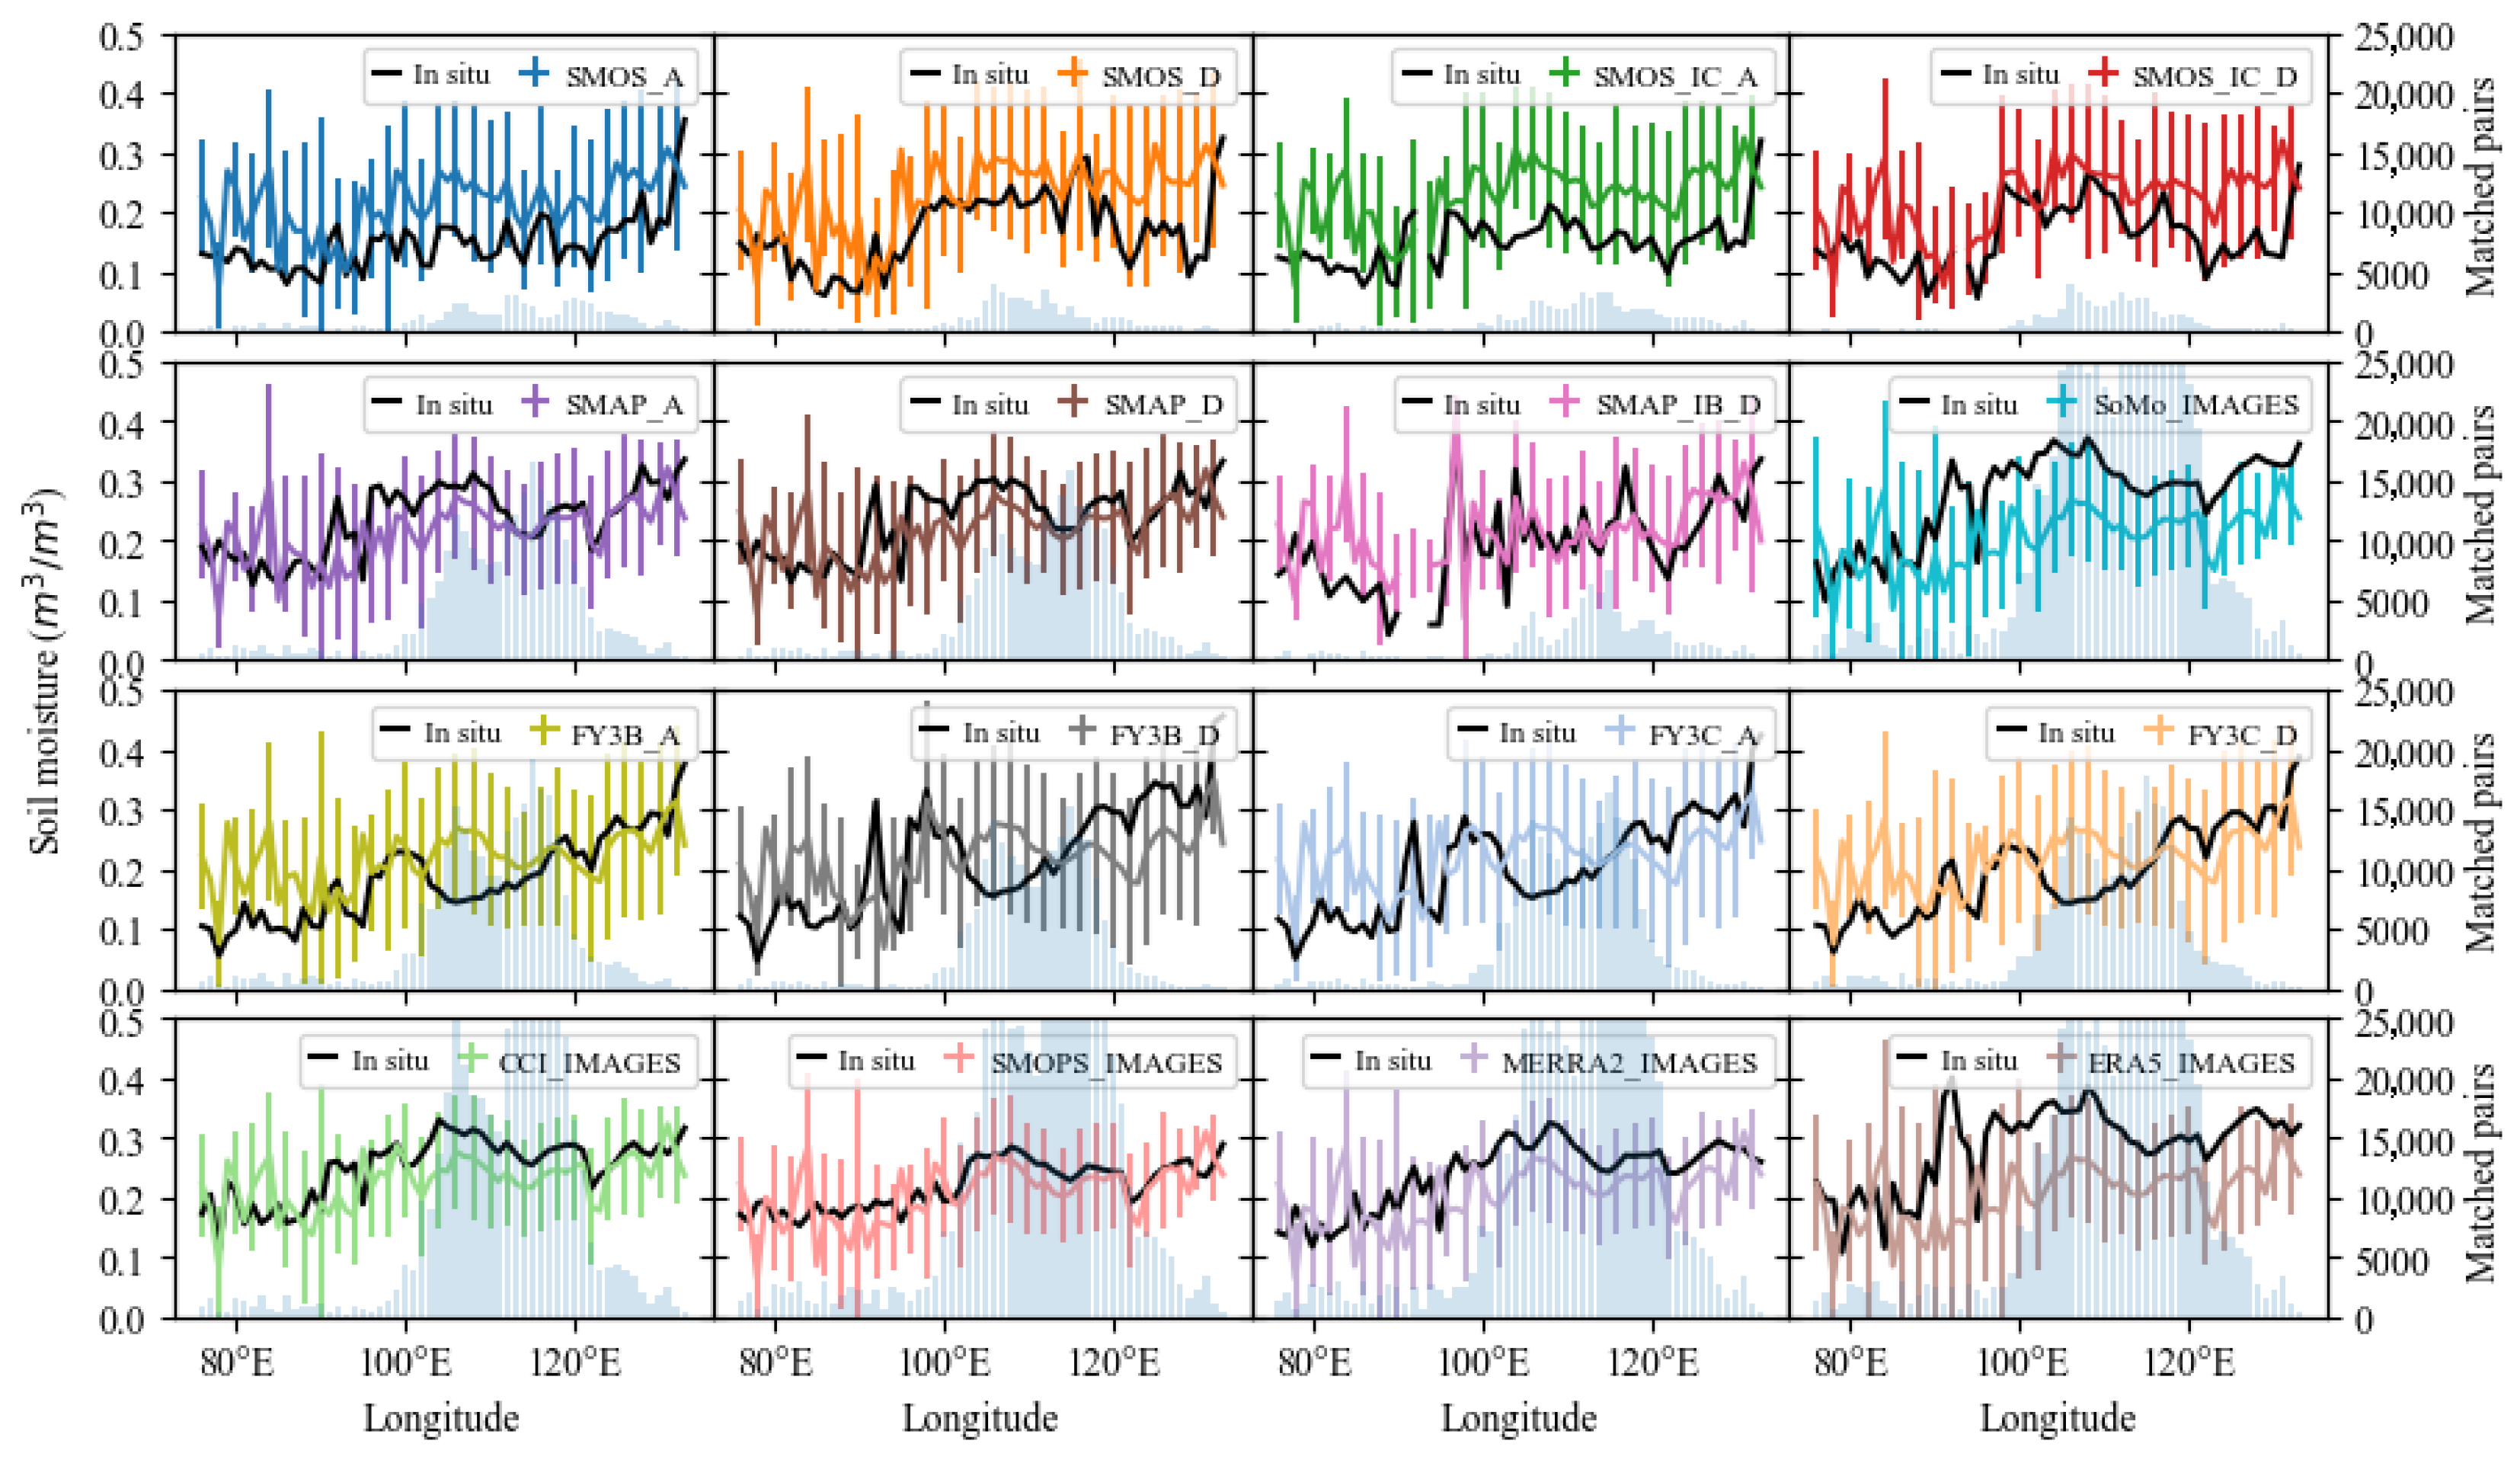
3.3. Product Performance Across Geographical Regions

Surface soil moisture is strongly shaped by natural conditions such as climate, topography, vegetation, and soil characteristics. Precipitation patterns and temperature regimes determine the water input and evapotranspiration rates, while terrain influences runoff and infiltration processes. However, the interaction between natural variability and sensor-specific sensitivities also plays a critical role in shaping the performance of soil moisture products. For instance, passive microwave sensors (e.g., SMAP, SMOS) are more sensitive to surface moisture in sparsely vegetated or bare-soil areas but tend to saturate in dense vegetation due to canopy attenuation, limiting retrieval accuracy in forested or crop-dense regions. Blended products, which integrate multiple data sources, often offer enhanced spatial coverage but may still be influenced by input biases from lower-performing sensors. Reanalysis and model-based products (e.g., ERA5, MERRA2) rely heavily on land surface parameterizations and are affected by inaccuracies in precipitation forcing or land cover representation, which can cause performance degradation in mountainous or semi-arid zones. In a geographically diverse country like China, where climates range from humid subtropical to arid continental, and landscapes vary from flat plains to high mountains, these factors collectively create substantial regional differences in soil moisture distribution. Figure 8 and Figure 9 present the performance of various soil moisture products across different latitudes and longitudes in China.
The SMOS-based products generally show an overestimation trend at various longitudes and latitudes in China, while the SMAP-based products have a relatively high degree of conformity with the in situ measurement data at different longitudes, but show an overestimation trend at low latitudes. The FY-3 series products tended to overestimate soil moisture at lower latitudes and mid-longitudes but demonstrated relatively better agreement with in situ measurement data under other conditions. Blended products outperformed individual satellite products, better capturing the spatial variations of surface soil moisture across China, notably the north–south and east–west gradients. Both the SoMo.ml and ERA5 products were able to reflect these spatial patterns; however, they exhibited noticeable systematic biases when compared with in situ measurement data.

3.4. Product Performance Across Different Dry and Wet Regions

Due to the influence of geographical and climatic differences, China shows obvious differences in surface dryness and wetness in the north–south and east–west directions. To further compare the performance of different products under various surface dry and wet conditions, we conducted an analysis based on the data of China’s ecological geographical divisions and the results of spatial connections. Figure 10 presents the comparison of evaluation metrics for matched data pairs under different surface moisture conditions. Due to limitations in data volume from single ascending orbits, quality control constraints, and the distribution of in situ measurement stations, the SMAP_IB product lacked sufficient matched data in arid regions, resulting in missing statistics in the figure. Among other products, except for the FY-3 satellite data products, no pronounced differences were observed across different moisture conditions. Overall, product performance was slightly better over humid and semi-humid surfaces compared to drier areas. The SMOS ascending orbit product showed relatively larger variations across different surface moisture conditions. The FY-3 satellite products performed significantly worse than other datasets in semi-humid, arid, and humid regions, and exhibited poorer performance when comparing between dry and humid/semi-humid regions. Blended surface soil moisture products and land surface model products demonstrated smaller differences in performance across varying surface moisture conditions compared to individual satellite products.

4. Conclusions

4.1. Performance Comparison Among Product Types

This study conducted a comprehensive evaluation of the latest surface soil moisture products over mainland China, using in situ measurements from more than 2400 ground stations within the China Soil Moisture Observation Network. This large-scale assessment addresses limitations in previous studies, which often relied on sparse observation networks, climate-agricultural station data, or focused solely on small watershed scales. The primary objective is to provide reliable guidance for researchers and practitioners across diverse disciplines in China when selecting appropriate soil moisture products to support sustainable land and water management. The main conclusions are as follows:
(1)
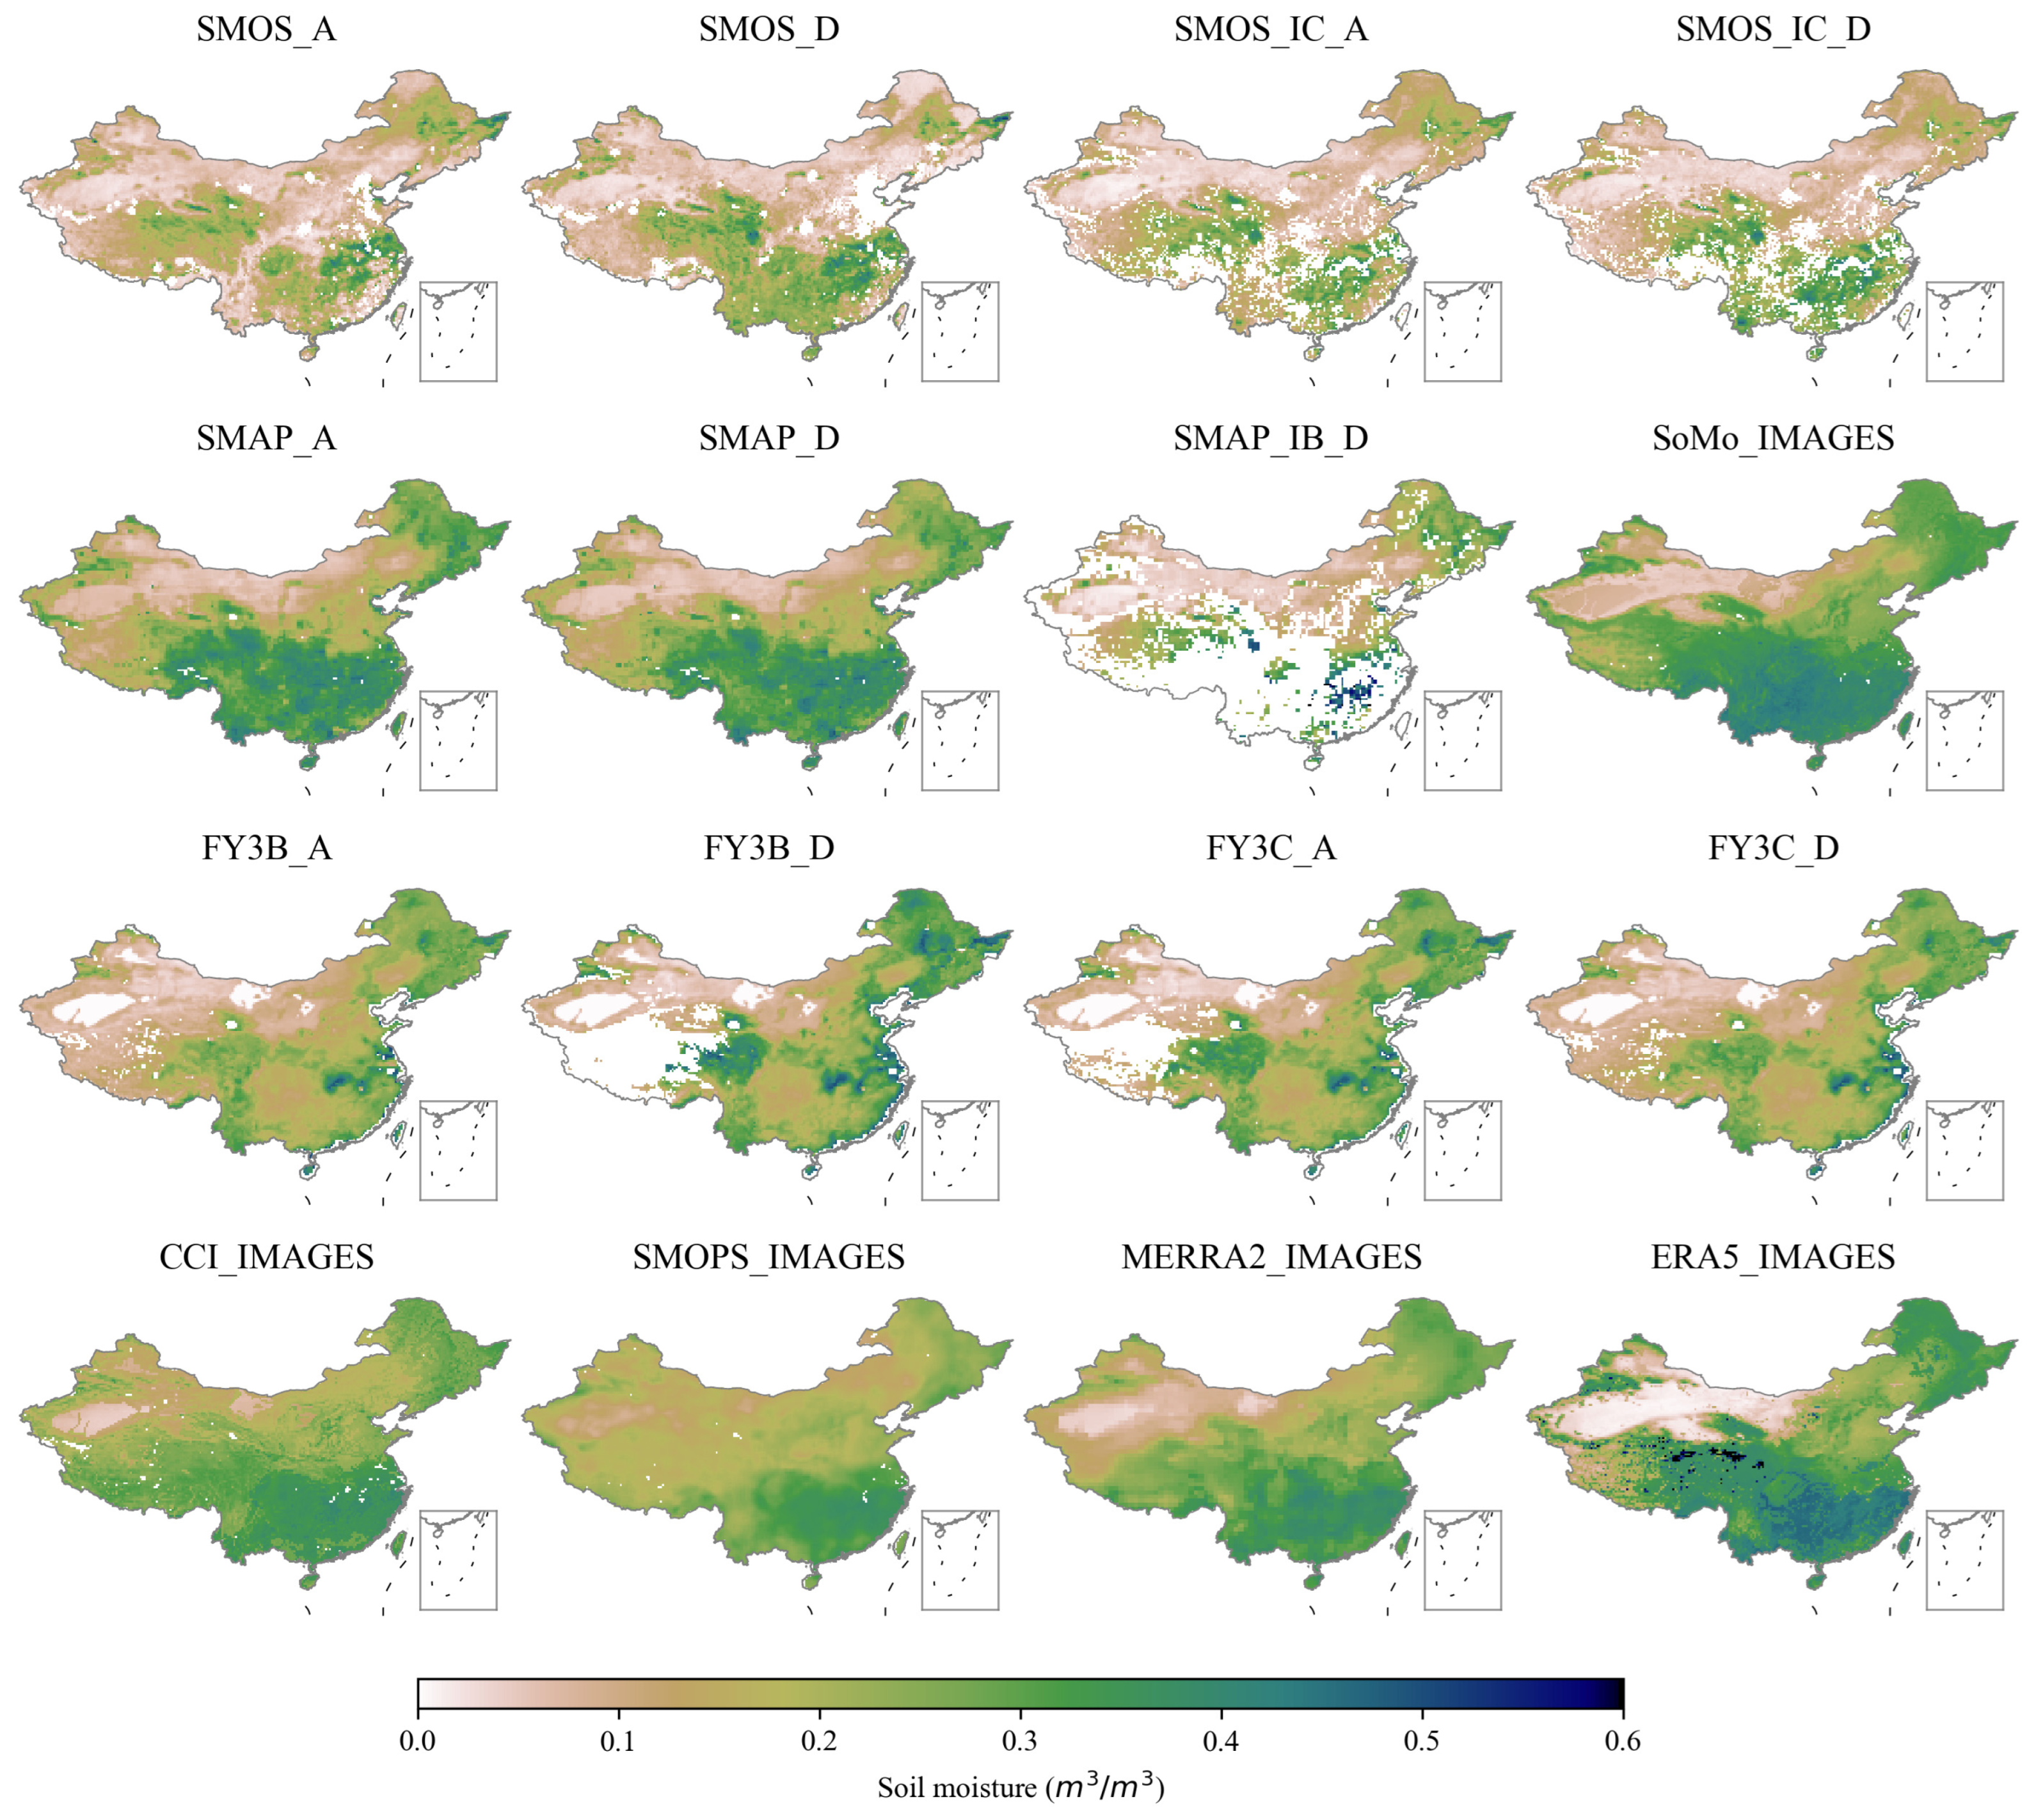
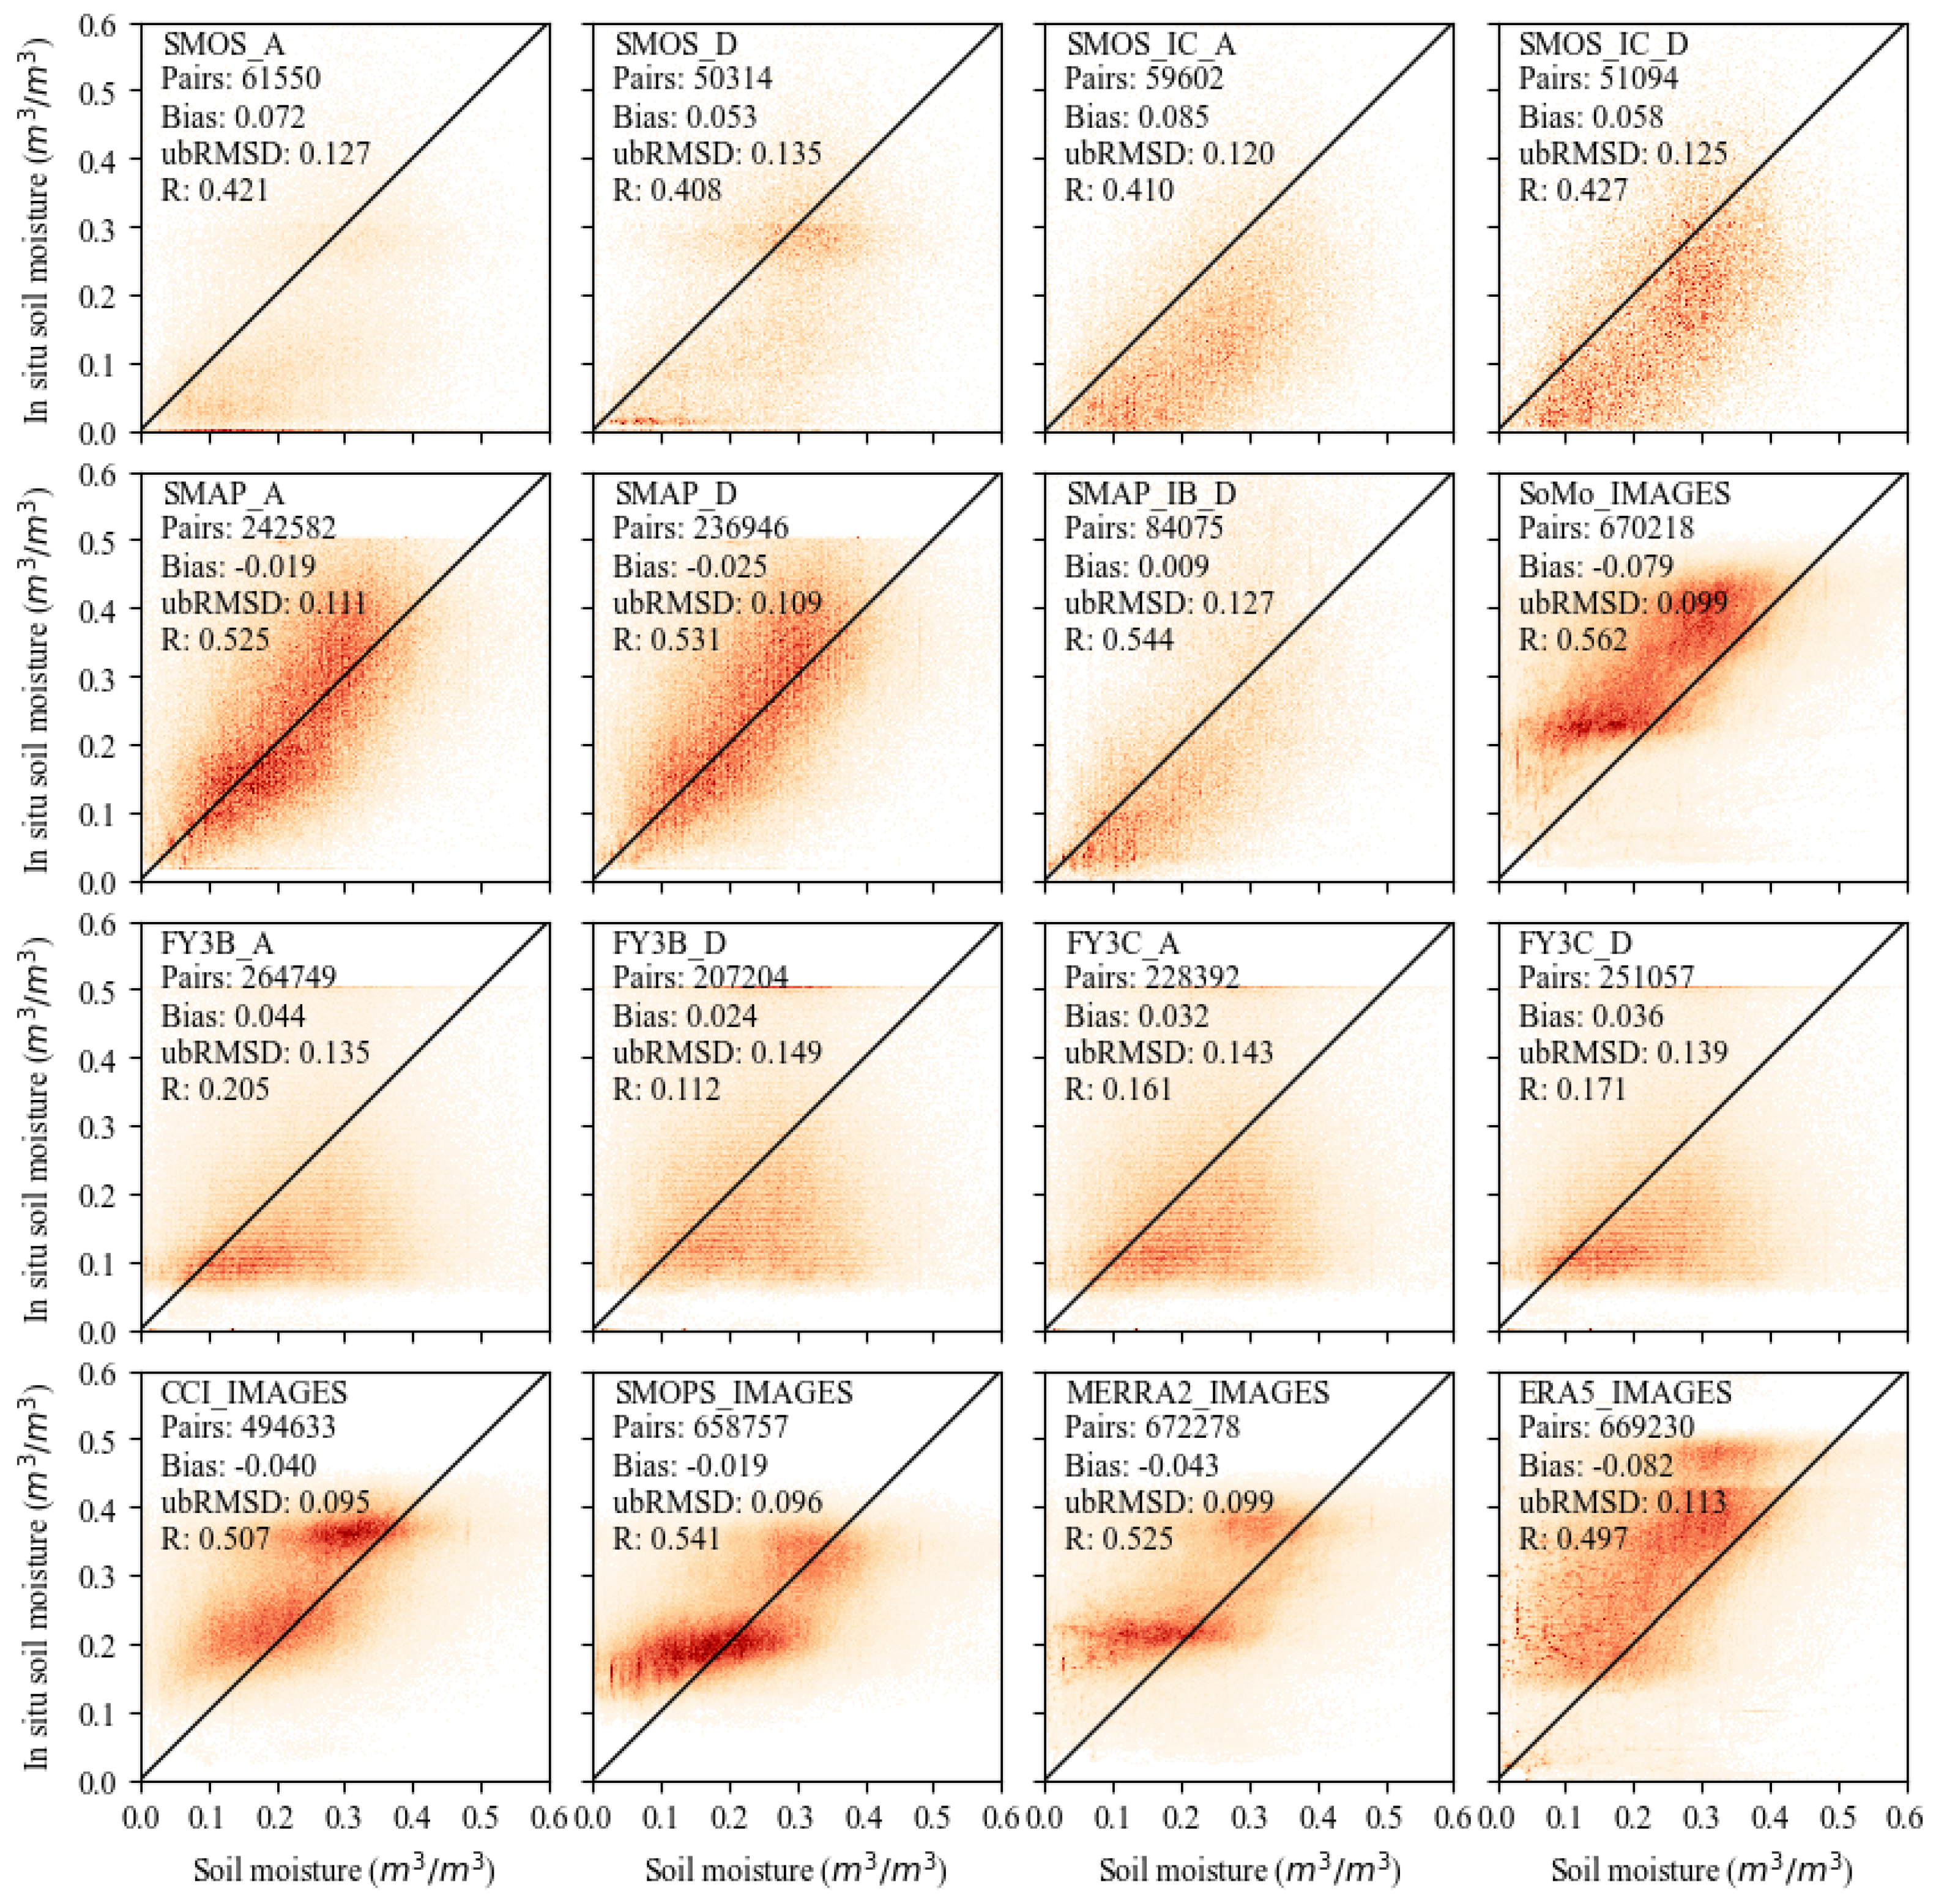
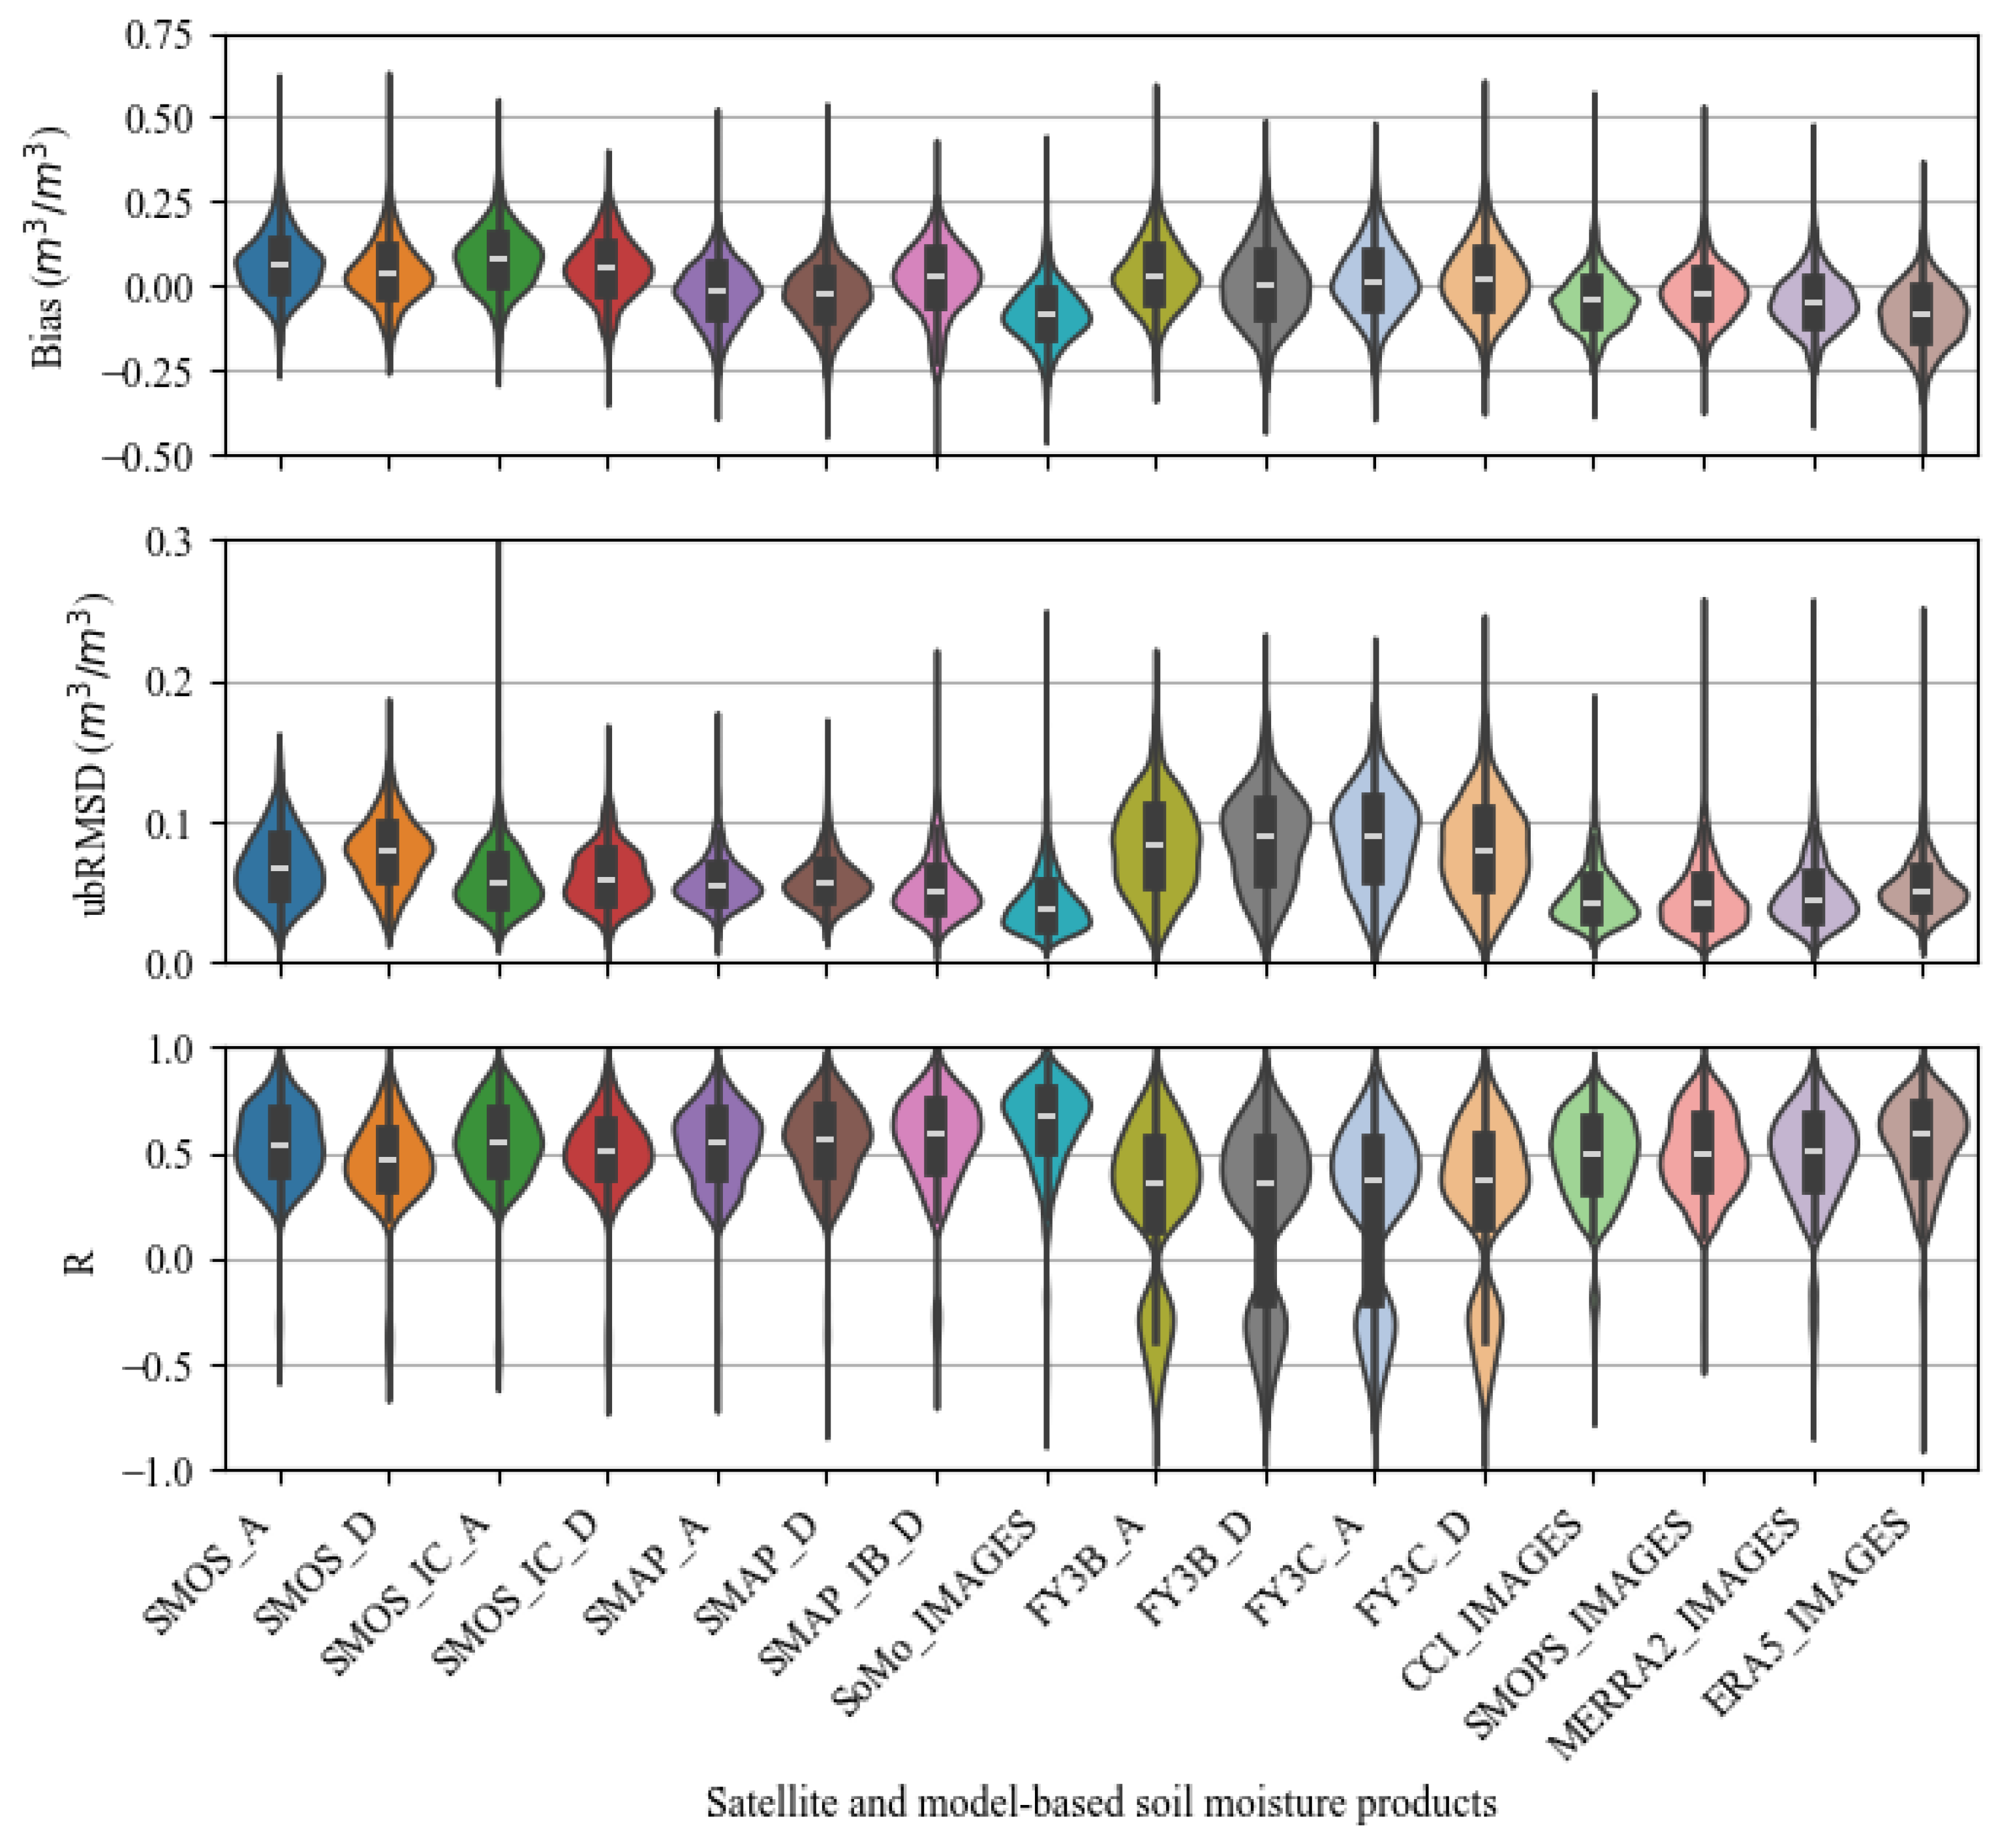
In terms of evaluation metrics, SMAP products significantly outperformed other single-satellite products, with an ubRMSD of 0.11 m3/m3 and a R of 0.53, demonstrating the best agreement with in situ measurement data. However, under high surface moisture conditions, SMAP products showed a slight tendency to underestimate soil moisture. FY-3 soil moisture products exhibited the poorest performance. SMOS products performed moderately, with the SMOS_IC product slightly outperforming the SMOS L3 product. SoMo.ml products, blended soil moisture products, and land surface model products demonstrated superior spatial coverage; however, they tended to underestimate surface moisture levels.
(2)
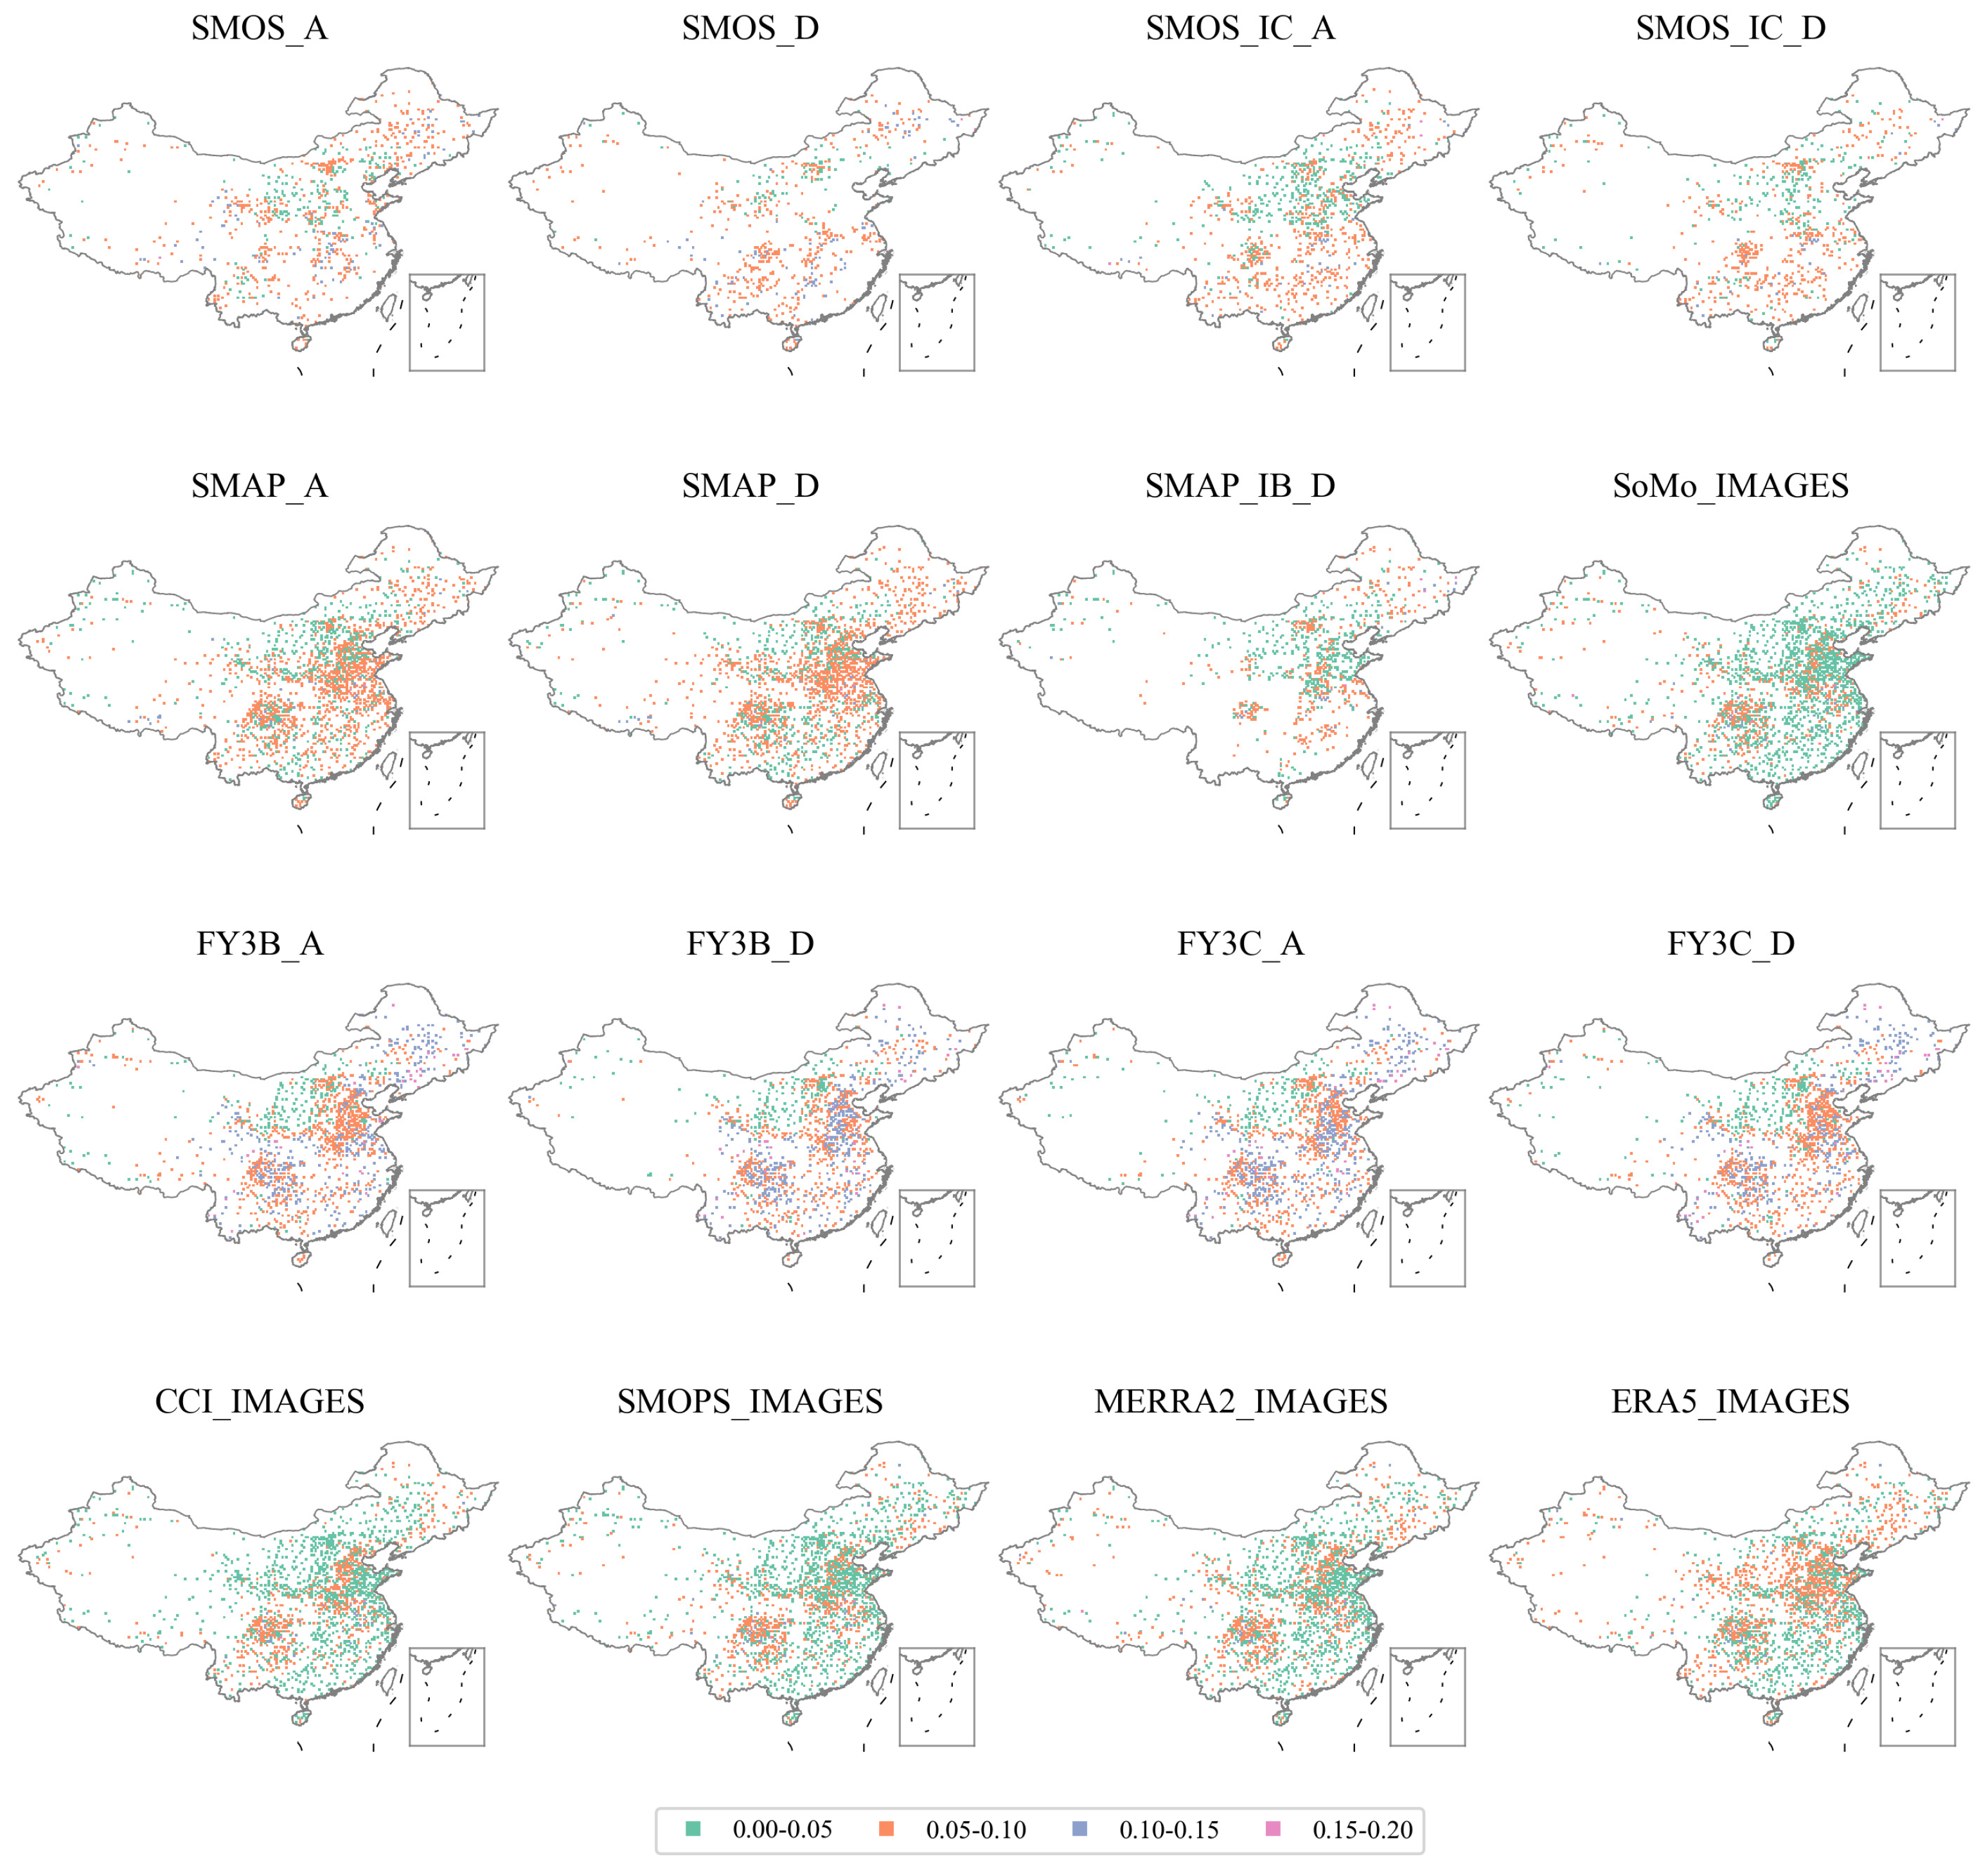
In terms of spatiotemporal performance, SMAP and SMOS products exhibited generally consistent spatial patterns, with pixels showing high correlation coefficients mainly distributed in regions south of the Yangtze River. Among blended products, the SoMo.ml product performed best, exhibiting the highest proportion of grids with strong correlations. The two blended products and the two land surface model products showed similar spatial patterns of correlation coefficients between the validation pixels and ground station time series, with blended products showing high-correlation grids mainly south of the Yangtze River, and land surface model products showing concentrations primarily in southern China.
(3)
In terms of ascending and descending orbits, the differences between the ascending and descending orbit products of SMAP L3 were minimal. However, the descending orbit product of SMAP_IB outperformed that of SMAP L3. For SMOS, the ascending orbit product performed significantly better than the descending orbit product, while the difference between ascending and descending orbit products for SMOS-IC was much smaller compared to SMOS L3. For FY-3B, the ascending orbit product slightly outperformed the descending orbit product, whereas the opposite was observed for FY-3C.

4.2. Environmental Suitability and Practical Recommendations for Sustainable Development

Spatial analysis revealed that high-correlation grids for most products were concentrated in humid, vegetated, and agricultural zones—particularly south of the Yangtze River—highlighting the influence of climatic and land cover conditions. Conversely, performance declined in arid, high-altitude, and sparsely vegetated regions. Differences in ascending and descending orbit retrievals were generally small but product-dependent, indicating sensitivity to observational geometry. Beyond numerical evaluation, we contextualized these results by product type: blended products are well-suited for large-scale hydrological modeling and long-term environmental monitoring due to their spatial consistency. Single-sensor products like SMAP and SMOS are better for applications requiring high temporal sensitivity, such as agricultural drought early warning or real-time irrigation scheduling. Reanalysis datasets, such as ERA5 and MERRA2, are ideal for climatological assessments and long-term hydrological studies where data continuity is paramount. In light of these findings, we recommend that hydrologists prioritize blended or reanalysis products for regional modeling, agricultural agencies adopt SMAP-like datasets for operational monitoring, and land use planners integrate soil moisture data according to eco-hydrological zones, balancing spatial precision with temporal reliability.
This study advances sustainable development by providing critical insights for selecting appropriate soil moisture datasets across China’s diverse eco-hydrological zones. Accurate soil moisture data enables precision irrigation that optimizes water usage while enhancing crop productivity. High-performing products such as SMAP and SoMo.ml help farmers schedule irrigation more efficiently, supporting Sustainable Development Goal (SDG) 6 (Clean Water). In humid zones, SMAP and blended products perform particularly well, aiding climate adaptation strategies for drought and flood management (SDG 13). For policymakers, these findings offer clear guidance for integrating soil moisture data into land management policies. The product-specific recommendations—SMAP for operational monitoring, blended products for regional modeling, and reanalysis datasets for long-term studies—empower agencies to make more informed decisions, ultimately fostering sustainable development and contributing to food security (SDG 2).

Author Contributions

Conceptualization, D.C. and Z.D.; Data curation, D.C.; Formal analysis, Z.D.; Funding acquisition, Z.D.; Investigation, J.C.; Methodology, D.C.; Resources, Z.D.; Software, Z.D. and J.C.; Visualization, J.C.; Writing—original draft, D.C.; Writing—review and editing, Z.D. All authors have read and agreed to the published version of the manuscript.

Funding

This research was funded by the National Natural Science Foundation of China, grant number 42204014, and the Jiangsu Postgraduate Practice and Innovation Program, grant number SJCX24_1884.

Institutional Review Board Statement

Not applicable.

Informed Consent Statement

Not applicable.

Data Availability Statement

The original contributions presented in this study are included in the article. Further inquiries can be directed to the corresponding author.

Conflicts of Interest

The authors declare no conflicts of interest.

References

  1. Babaeian, E.; Sadeghi, M.; Jones, S.B.; Montzka, C.; Vereecken, H.; Tuller, M. Ground, Proximal, and Satellite Remote Sensing of Soil Moisture. Rev. Geophys. 2019, 57, 530–616. [Google Scholar] [CrossRef]
  2. Seneviratne, S.I.; Corti, T.; Davin, E.L.; Hirschi, M.; Jaeger, E.B.; Lehner, I.; Orlowsky, B.; Teuling, A.J. Investigating Soil Moisture–Climate Interactions in a Changing Climate: A Review. Earth-Sci. Rev. 2010, 99, 125–161. [Google Scholar] [CrossRef]
  3. Song, X.; Li, Y.; Zhang, T.; Li, L.; Gu, T. Focusing High-Maneuverability Bistatic Forward-Looking SAR Using Extended Azimuth Nonlinear Chirp Scaling Algorithm. IEEE Trans. Geosci. Remote Sens. 2022, 60, 1–14. [Google Scholar] [CrossRef]
  4. Loew, A.; Holmes, T.; De Jeu, R. The European Heat Wave 2003: Early Indicators from Multisensoral Microwave Remote Sensing? J. Geophys. Res. 2009, 114, 2008JD010533. [Google Scholar] [CrossRef]
  5. Yang, C.G.; Liang, Y.; Bai, X.L.; Li, X. GLEAM Soil Moisture Data Evaluation and Its Spatiotemporal Characteristics in the Huaihe River Basin. China Rural Water Hydropower 2021, 52–57+66. [Google Scholar]
  6. Wu, J.; Gao, Y.H.; Pan, Y.J.; Jang, Y.S.; Li, Z.; Ma, J.N. Evaluation of soil-moisture simulations in the central and eastern Tibetan Plateau and error analysis. Chin. J. Geophys. 2020, 63, 2184–2198. [Google Scholar] [CrossRef]
  7. Wagner, W.; Naeimi, V.; Scipal, K.; De Jeu, R.; Martínez-Fernández, J. Soil Moisture from Operational Meteorological Satellites. Hydrogeol. J. 2007, 15, 121–131. [Google Scholar] [CrossRef]
  8. Das, K.; Paul, P.K. Present Status of Soil Moisture Estimation by Microwave Remote Sensing. Cogent Geosci. 2015, 1, 1084669. [Google Scholar] [CrossRef]
  9. Lakhankar, T.; Krakauer, N.; Khanbilvardi, R. Applications of Microwave Remote Sensing of Soil Moisture for Agricultural Applications. Int. J. Terraspace Sci. Eng. 2009, 2, 81–91. [Google Scholar]
  10. Taylor, C.M.; de Jeu, R.A.M.; Guichard, F.; Harris, P.P.; Dorigo, W.A. Afternoon Rain More Likely over Drier Soils. Nature 2012, 489, 423–426. [Google Scholar] [CrossRef] [PubMed]
  11. Albergel, C.; De Rosnay, P.; Gruhier, C.; Muñoz-Sabater, J.; Hasenauer, S.; Isaksen, L.; Kerr, Y.; Wagner, W. Evaluation of Remotely Sensed and Modelled Soil Moisture Products Using Global Ground-Based in Situ Observations. Remote Sens. Environ. 2012, 118, 215–226. [Google Scholar] [CrossRef]
  12. Dorigo, W.A.; Scipal, K.; Parinussa, R.M.; Liu, Y.Y.; Wagner, W.; De Jeu, R.A.M.; Naeimi, V. Error Characterisation of Global Active and Passive Microwave Soil Moisture Datasets. Hydrol. Earth Syst. Sci. 2010, 14, 2605–2616. [Google Scholar] [CrossRef]
  13. Dorigo, W.A.; Gruber, A.; De Jeu, R.A.M.; Wagner, W.; Stacke, T.; Loew, A.; Albergel, C.; Brocca, L.; Chung, D.; Parinussa, R.M.; et al. Evaluation of the ESA CCI Soil Moisture Product Using Ground-Based Observations. Remote Sens. Environ. 2015, 162, 380–395. [Google Scholar] [CrossRef]
  14. Yee, M.S.; Walker, J.P.; Rüdiger, C.; Parinussa, R.M.; Koike, T.; Kerr, Y.H. A Comparison of SMOS and AMSR2 Soil Moisture Using Representative Sites of the OzNet Monitoring Network. Remote Sens. Environ. 2017, 195, 297–312. [Google Scholar] [CrossRef]
  15. Beck, H.E.; Pan, M.; Miralles, D.G.; Reichle, R.H.; Dorigo, W.A.; Hahn, S.; Sheffield, J.; Karthikeyan, L.; Balsamo, G.; Parinussa, R.M.; et al. Evaluation of 18 Satellite- and Model-Based Soil Moisture Products Using in Situ Measurements from 826 Sensors. Hydrol. Earth Syst. Sci. 2021, 25, 17–40. [Google Scholar] [CrossRef]
  16. Liu, Y.; Yang, Y.; Yue, X. Evaluation of Satellite-Based Soil Moisture Products over Four Different Continental In-Situ Measurements. Remote Sens. 2018, 10, 1161. [Google Scholar] [CrossRef]
  17. Jin, L.; Wang, Y.F.; Guo, E.L.; Narenmandula; Gu, X.L.; Kang, Y. Applicability evaluation of ERA5, GLDAS and FLDAS soil moisture data in Inner Mongolia. Water Sav. Irrig. 2023, 3, 53–60. [Google Scholar] [CrossRef]
  18. Liu, Z.; Jiao, W.G.; Wang, X.Y.; Xu, G.H.; Wu, A.J. Evaluation of agricultural drought in Guizhou Province based on standardized soil moisture index. China Rural Water Hydropower 2022, 1–5. [Google Scholar] [CrossRef]
  19. Yang, W.J.; Li, J.Z.; Feng, P. Evaluation of agricultural drought in Luanhe River Basin based on the standardized soil moisture index. Ying Yong Sheng Tai Xue Bao = J. Appl. Ecol. 2022, 33, 801–807. [Google Scholar] [CrossRef]
  20. Zhu, H.W.; Luo, D.; Zhu, L.; He, W. Construction and evaluation of high spatial resolution soil moisture products based on random forest algorithm. Mod. Electron. Tech. 2023, 46, 153–158. [Google Scholar] [CrossRef]
  21. Zhang, Y.C.; Fu, X.L.; Ding, Y.J.; Jiang, X.L.; Zhong, Q. The study of downscaling SMAP surface soil moisture based on random forests in the source region of Yellow River. J. China Hydrol. 2024, 44, 22–29. [Google Scholar] [CrossRef]
  22. Peng, J.; Niesel, J.; Loew, A.; Zhang, S.; Wang, J. Evaluation of Satellite and Reanalysis Soil Moisture Products over Southwest China Using Ground-Based Measurements. Remote Sens. 2015, 7, 15729–15747. [Google Scholar] [CrossRef]
  23. Barre, H.M.J.P.; Duesmann, B.; Kerr, Y.H. SMOS: The Mission and the System. IEEE Trans. Geosci. Remote Sens. 2008, 46, 587–593. [Google Scholar] [CrossRef]
  24. Entekhabi, D.; Njoku, E.G.; O’Neill, P.E.; Kellogg, K.H.; Crow, W.T.; Edelstein, W.N.; Entin, J.K.; Goodman, S.D.; Jackson, T.J.; Johnson, J.; et al. The Soil Moisture Active Passive (SMAP) Mission. Proc. IEEE 2010, 98, 704–716. [Google Scholar] [CrossRef]
  25. Sun, Y.; Huang, F.; Xia, J.; Yin, C.; Bai, W.; Du, Q.; Wang, X.; Cai, Y.; Li, W.; Yang, G.; et al. GNOS-II on Fengyun-3 Satellite Series: Exploration of Multi-GNSS Reflection Signals for Operational Applications. Remote Sens. 2023, 15, 5756. [Google Scholar] [CrossRef]
  26. Dorigo, W.; Wagner, W.; Albergel, C.; Albrecht, F.; Balsamo, G.; Brocca, L.; Chung, D.; Ertl, M.; Forkel, M.; Gruber, A.; et al. ESA CCI Soil Moisture for Improved Earth System Understanding: State-of-the Art and Future Directions. Remote Sens. Environ. 2017, 203, 185–215. [Google Scholar] [CrossRef]
  27. Liu, J.; Zhan, X.; Hain, C.; Yin, J.; Fang, L.; Li, Z.; Zhao, L. NOaa Soil Moisture Operational Product System (SMOPS) and Its Validations. In Proceedings of the 2016 IEEE International Geoscience and Remote Sensing Symposium (IGARSS), Beijing, China, 10–15 July 2016; pp. 3477–3480. [Google Scholar]
  28. Hersbach, H.; Bell, B.; Berrisford, P.; Hirahara, S.; Horányi, A.; Muñoz-Sabater, J.; Nicolas, J.; Peubey, C.; Radu, R.; Schepers, D.; et al. The ERA5 Global Reanalysis. Quart. J. R. Meteoro. Soc. 2020, 146, 1999–2049. [Google Scholar] [CrossRef]
  29. Gelaro, R.; McCarty, W.; Suárez, M.J.; Todling, R.; Molod, A.; Takacs, L.; Randles, C.A.; Darmenov, A.; Bosilovich, M.G.; Reichle, R.; et al. The Modern-Era Retrospective Analysis for Research and Applications, Version 2 (MERRA-2). J. Clim. 2017, 30, 5419–5454. [Google Scholar] [CrossRef] [PubMed]
  30. O, S.; Orth, R. Global Soil Moisture Data Derived through Machine Learning Trained with In-Situ Measurements. Sci. Data 2021, 8, 170. [Google Scholar] [CrossRef] [PubMed]
  31. Caldwell, T.G.; Bongiovanni, T.; Cosh, M.H.; Jackson, T.J.; Colliander, A.; Abolt, C.J.; Casteel, R.; Larson, T.; Scanlon, B.R.; Young, M.H. The Texas Soil Observation Network:A Comprehensive Soil Moisture Dataset for Remote Sensing and Land Surface Model Validation. Vadose Zone J. 2019, 18, 1–20. [Google Scholar] [CrossRef]
Figure 1. Arid and humid region delineations across China and the distribution of ground-based stations within the China Soil Moisture Monitoring Network.
Sustainability 17 06482 g001
Figure 2. Mean surface soil moisture in 2018 from different gridded products of China.
Sustainability 17 06482 g002
Figure 3. Scatter plots of overall coincident gridded soil moisture products and in situ measurements.
Sustainability 17 06482 g003
Figure 4. ubRMSD (m3/m3) between different gridded soil moisture products and in situ measurements at coincident pixels.
Sustainability 17 06482 g004
Figure 5. Correlation coefficients between different gridded soil moisture products and in situ measurements at coincident pixels.
Sustainability 17 06482 g005
Figure 6. Statistical violin plots of evaluation metrics calculated for different gridded soil moisture products and in situ measurements at coincident pixels.
Sustainability 17 06482 g006
Figure 7. Daily average time series of different gridded surface soil moisture products and in situ measurements.
Sustainability 17 06482 g007
Figure 8. Mean and standard deviation of surface soil moisture from different products matched with in situ measurements along latitude in China.
Sustainability 17 06482 g008
Figure 9. Mean and standard deviation of surface soil moisture from different products matched with in situ measurements along longitude in China.
Sustainability 17 06482 g009
Figure 10. Bias, ubRMSD, and R of different soil moisture products relative to in situ measurements across dry and wet regions of China.
Sustainability 17 06482 g010
Table 1. Metadata for the Original Gridded Soil Moisture Dataset.
NameTemporal ResolutionSpatial ResolutionGridCoordinate SystemAscending Orbit/Descending OrbitLevelRows × Columns
SMOS L3Daily25 kmEASE-Grid2WGS84 EPSG:6933AllL3584 × 1388
SMOS_ICDaily25 kmEASE-Grid2WGS84 EPSG:6933All 584 × 1388
SMAP DCADaily36 kmEASE-Grid2WGS84 EPSG:6933AllL3406 × 964
SMAP-IBDaily36 kmEASE-Grid2WGS84 EPSG:6933DL3406 × 964
FY-3BDaily25 kmEASE-GridInternational 1924 Authalic Sphere, EPSG:3410AllL2586 × 1383
FY-3CDaily25 kmEASE-GridInternational 1924 Authalic Sphere, EPSG:3410AllL2586 × 1383
CCIDaily~28 kmregular gridWGS84None/720 × 1440
SMOPSDaily~28 kmregular gridWGS84None/720 × 1440
SoMo.mlDaily~28 kmregular gridWGS84None/720 × 1440
ERA-5 Land reanalysisHourly~9 kmregular gridWGS84None/1801 × 3600
MERRA2Hourly~50 kmregular gridWGS84None/361 × 576
Disclaimer/Publisher’s Note: The statements, opinions and data contained in all publications are solely those of the individual author(s) and contributor(s) and not of MDPI and/or the editor(s). MDPI and/or the editor(s) disclaim responsibility for any injury to people or property resulting from any ideas, methods, instructions or products referred to in the content.

