Article

Application of Econometric Techniques to Analyze Selected Driving Forces and Regional Heterogeneity in the Recreational Fishery Industry Across 11 Coastal Areas in the Chinese Mainland from 2005 to 2023

School of Economics and Management, Shanghai Ocean University, Shanghai 201306, China
*
Author to whom correspondence should be addressed.
Sustainability 2025, 17(14), 6440; https://doi.org/10.3390/su17146440
Submission received: 13 June 2025 / Revised: 9 July 2025 / Accepted: 12 July 2025 / Published: 14 July 2025

Abstract

With the advantages of industrial integration, China’s recreational fishery sector represents a new trajectory in the transformation of the fishery industry. Coastal regions possess abundant fishery resources and have favorable geographical conditions, offering natural advantages for developing recreational fishing. However, substantial variations can be observed among regions regarding their resource endowments and economic conditions, leading to diversity in the driving forces and paths of recreational fishery development. This study employs panel data for 11 coastal provinces, municipalities, and autonomous regions in the Chinese mainland from 2005 to 2023 to explore the driving forces and regional heterogeneity of recreational fishery development. This paper employs fixed-effects estimation and further incorporates a mediating-effect model to explore the role of market demand in shaping the development path of recreational fisheries. The results are as follows: (1) Natural resource endowments and market demand are key driving forces that promote growth in the output value of recreational fisheries. (2) There is heterogeneity in the driving forces across regions. In areas with richer resource endowments or lower economic development levels, recreational fishery growth relies more on natural resource-driven mechanisms, whereas in regions with weaker resource endowments or higher economic development levels, market demand plays a more dominant role. (3) Market demand drives recreational fishery growth through the expansion of the tertiary sector. This paper offers a valuable reference for policymakers seeking to allocate resources more efficiently, support balanced regional development, and formulate tailored development strategies in accordance with local conditions, thereby facilitating the sustainable and high-quality development of the recreational fishery industry in the Chinese mainland.

1. Introduction

Recreational fisheries optimize the use of fishery, environmental, and human resources by organically integrating modern fisheries with leisure, tourism, sightseeing, and marine knowledge dissemination. This integration facilitates the convergence and transformation of primary, secondary, and tertiary industries, thereby generating greater economic and social benefits (Ping, 2004) [1]. In contemporary society, recreational fisheries, as an emerging leisure activity, not only offer people opportunities to connect with nature but also play a positive role in promoting local economic and social development. Over the past two decades, China’s recreational fishery industry has received significant institutional and policy support, especially since its formal inclusion in national fishery development plans in 2011. These efforts have catalyzed growth in the sector across various coastal regions. However, the development trajectory of recreational fisheries is far from uniform. Substantial regional heterogeneity has emerged due to differences in natural resource endowments, economic structures, and market demands, resulting in distinct developmental patterns across provinces.
Academic research on recreational fisheries has been continuously expanding, and various regions in the Chinese mainland have successively introduced policies to promote and regulate the development of the sector. Despite increasing academic and policy interest, there remains a lack of systematic understanding of the driving forces behind this growth and how these forces vary regionally. This knowledge gap limits the effectiveness of policy interventions and impedes the design of tailored development strategies. Therefore, this study seeks to address a critical societal and economic challenge: identifying and quantifying the key driving forces and their regional heterogeneity in the development of recreational fisheries in the Chinese mainland. By employing rigorous econometric techniques and analyzing panel data from 11 coastal provinces, municipalities, and autonomous regions between 2005 and 2023, this research aims to provide empirical insights that support evidence-based, region-specific policy formulation. These insights are expected to enhance the efficiency of resource allocation and promote sustainable and inclusive growth in the recreational fishery sector.

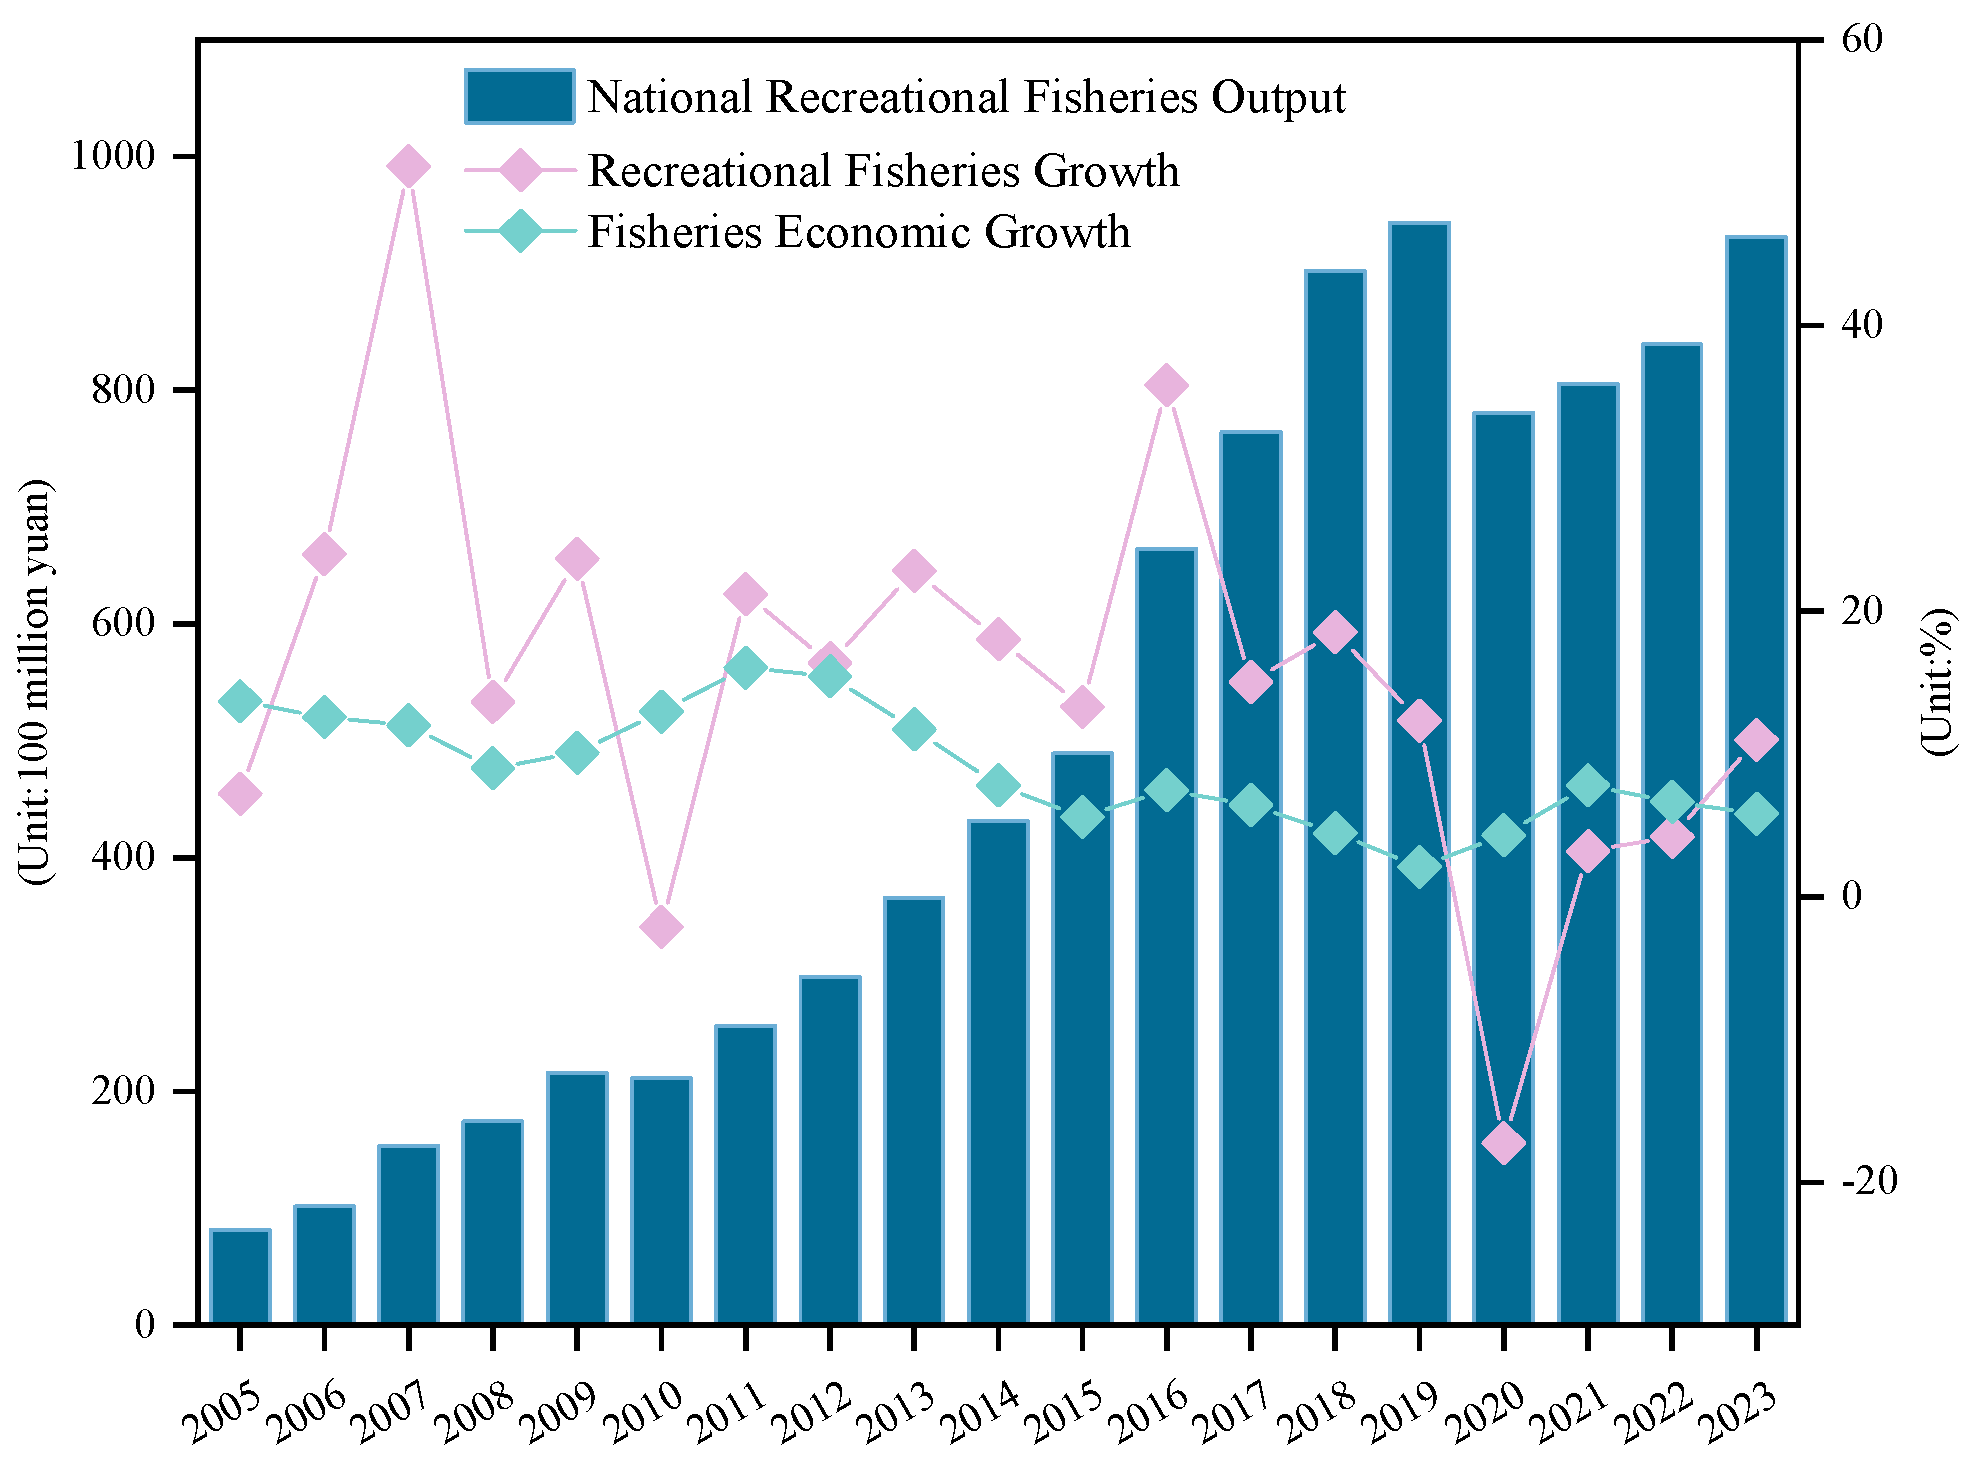
2. Background of Coastal Recreational Fisheries

Since 2005, China’s recreational fisheries have gradually entered a phase characterized by institutional guidance and policy support (see Table 1). In 2011, recreational fisheries were incorporated into the national fishery development plan issued by China’s Ministry of Agriculture, officially becoming one of the five major fishery sectors. As China transitioned into a new era of economic growth, problems associated with the fishery sector’s extensive, unbalanced, uncoordinated, and unsustainable growth became increasingly prominent. With tightening resource and environmental constraints and a continuous reduction in traditional fishery waters, the development space for fisheries has become limited. In December 2016, China’s Ministry of Agriculture released the 13th Five-Year Plan for National Fishery Development, which explicitly identified recreational fisheries as one of the five modern fishery industry systems. The plan called for promoting the integration of the primary, secondary, and tertiary sectors and actively developing recreational fisheries, thereby providing strong policy support for innovation in fishery development [2]. In April 2021, the Ministry of Culture and Tourism issued the 14th Five-Year Plan for Cultural and Tourism Development, which acknowledged the persistent imbalance and inadequacy in the development of China’s tourism industry. Issues such as urban–rural disparities, regional disparities, and mismatches in the supply and demand of tourism products remain prominent, falling short of the requirements for high-quality development. As an emerging sector within tourism, recreational fisheries face similar challenges. In December of the same year, the Ministry of Agriculture and Rural Affairs released the 14th Five-Year Plan for National Fishery Development, which assessed the challenges and opportunities facing the fishery industry and committed to achieving basic fishery modernization by 2035 [3]. During the revision of the Fisheries Law of the People’s Republic of China, the Ministry of Agriculture and Rural Affairs proposed regulatory requirements for managing recreational fisheries and encouraged local governments to develop context-specific management approaches. Under national policy guidance, in November 2024, the Shandong Provincial Department of Agriculture and Rural Affairs issued the Administrative Measures for Recreational Fisheries in Shandong Province, aimed at regulating recreational fishery operations, ensuring safety in recreational fishery activities, and enhancing the quality-oriented development of new fishery business formats [4].
Recreational fisheries not only contribute to improving people’s physical and mental well-being but also help stimulate the growth of local service sectors and cultural tourism industries (Yang et al., 2017) [5]. In 2017, the concept of “Tourism Plus” was officially incorporated into China’s No. 1 Central Document, which further fueled the rapid rise of rural tourism.
As shown in Figure 1, from 2005 to 2019, the gross value generated by the Chinese mainland’s recreational fisheries exhibited a steady upward trend. However, by the end of 2019, the industry experienced a significant downturn caused by the COVID-19 pandemic, which posed challenges to its development. Notably, since 2021, the gross output value from recreational fishing activities has resumed its growth trajectory, demonstrating resilience and a capacity for recovery. Overall, despite fluctuations in growth rates, the sector has maintained a relatively stable upward trend, injecting new momentum into the broader development of the fishery economy.
Figure 2 illustrates the total output value and annual increases in recreational fisheries across 11 coastal provinces, municipalities, and autonomous regions of the Chinese mainland, including Tianjin, Hebei, Liaoning, Shanghai, Jiangsu, Zhejiang, Fujian, Shandong, Guangdong, Guangxi Zhuang Autonomous Region, and Hainan. From 2005 to 2015, recreational fisheries in these coastal regions remained in an early stage of development, characterized by low levels of growth, limited economic output, and sluggish expansion. This can be attributed to the fact that, during this period, the Chinese mainland’s fishery economy was still dominated by traditional fisheries, resulting in a slow increase in the output value of recreational fisheries. Between 2016 and 2019, following the introduction of supply-side structural reform policies, the fishery industry in the Chinese mainland underwent structural adjustment. Supported by favorable national policies, the recreational fishery sector in coastal areas experienced rapid development. Moreover, with China’s transition toward high-quality economic growth and the emergence of integrated “agriculture–culture–tourism” development models, consumer spending patterns began to shift, reflecting the growing demand for leisure and entertainment. Recreational fisheries, with their inherent recreational attributes, increasingly met tourists’ experiential needs and gained popularity, leading to sustained increases in output value year over year. In 2020, the coastal recreational fishery sector was significantly impacted by the external shock of the COVID-19 pandemic, resulting in a notable decline in total output and a sharp contraction in the growth rate. This demonstrated the industry’s sensitivity to economic conditions and external uncertainties. As the pandemic’s effects gradually subsided, the output value of recreational fisheries in coastal regions resumed its upward trend, although the growth rate moderated compared to the earlier peak period, indicating a stabilization in overall development. By 2023, the total output value of recreational fisheries in the Chinese mainland’s 11 coastal provinces (municipalities and autonomous regions) had reached RMB 55.6 billion, accounting for 59.69% of the national total. This figure represents an increase of RMB 5.841 billion compared to 2022 [6].
With the advancement of urbanization and the increasing diversification of residents’ consumption patterns, the recreational fishery sector is also facing a series of challenges, including excessive resource exploitation, declining environmental carrying capacity, a lack of diversified business models, and insufficient regulatory frameworks. Against the backdrop of modern fishery transformation and upgrading, recreational fisheries are regarded as a key lever for addressing resource and environmental constraints and enhancing industry quality and efficiency. Therefore, a thorough understanding of the driving forces behind their development holds significant practical implications for achieving high-quality and sustainable growth. As China undergoes structural economic transformation and consumer demand continues to evolve, the eastern coastal regions—endowed with favorable natural resources, advantageous geographical locations, and a solid tourism foundation—are gradually emerging as new growth poles for the development of recreational fisheries. These regions provide an ideal setting for examining the endogenous drivers of recreational fishery development (Zhao et al., 2022) [7].
In light of the aforementioned context, this research investigates the key driving forces and regional heterogeneity of recreational fishery development in the Chinese mainland’s coastal areas to promote the sustainable and high-quality development of the recreational fishery industry. Utilizing panel data from 11 coastal provinces, municipalities, and autonomous regions in the Chinese mainland spanning the years 2005 to 2023, this study employs baseline regression models and mediation analysis frameworks to empirically examine the sources of industrial momentum and their regional variations. This research not only enriches the theoretical framework and methodological approach concerning the driving mechanisms and regional heterogeneity of recreational fisheries but also provides empirical evidence and policy guidance for region-specific strategies to advance the high-quality and long-term development of recreational fisheries in the Chinese mainland’s coastal regions, thereby holding significant theoretical and practical implications.

3. Literature Review

Overall, the existing domestic and international literature on recreational fisheries and the drivers of industrial development offers robust theoretical and methodological support. A systematic review of these studies enhances our understanding of the underlying driving forces shaping the development of recreational fisheries and provides a solid foundation for formulating context-specific development strategies. Nevertheless, research explicitly focusing on the drivers of recreational fisheries remains relatively limited. This study synthesizes key contributions from both strands of literature and proposes an integrated analytical framework to guide future research and policy design (see Table 2).

3.1. Domestic Research

3.1.1. Domestic Research on Recreational Fisheries

Research on recreational fisheries in the Chinese mainland began in the early years of the country’s Reform and Opening Up. In the early 1980s, Yu Guangyuan advocated the importance of studying recreational fisheries, initiating theoretical explorations of the domestic leisure industry (Chen & Liu, 2015) [8]. Early scholars primarily focused on defining the concept and connotation of “recreational fisheries” (Bao et al., 2008) [9] and conducting preliminary analyses of the sector’s development status (Cai, 2005) [10]. For instance, the classification system proposed by Jiang Rongji laid a theoretical foundation for subsequent academic expansion [11]. With the evolution of practice, research perspectives have gradually shifted from static descriptions to mechanism-based analysis and governance-path exploration. Zhang (2005) [12] noted that most regions in the Chinese mainland lacked comprehensive planning for the development of recreational fisheries. In response, Guo (2006) [13] emphasized leveraging resource advantages, highlighting regional characteristics, and balancing ecological conservation to achieve harmony between humans and fisheries. Dong and Yang (2014) [14] examined strategies for promoting the integrated growth of recreational fisheries through the lens of industrial integration, identifying market demand, industrial development needs, and the necessity of industrial transformation as the three main driving forces. This line of reasoning aligns logically with empirical model-based studies in the international academic community. Zhao et al. (2022b) [15] employed input–output analysis to reveal the economic embeddedness of recreational fisheries within the Chinese mainland’s tertiary sector. Their findings suggested that recreational fisheries not only promote employment and consumption but also serve as a critical linkage between the manufacturing and tourism industries, thereby becoming a vital node in economic growth. In terms of regional comparisons and development assessments, Le and Fan (2019) [16] applied a varying-coefficient model to analyze the impact of labor increment on recreational fishery output across provinces. The study found that the development of recreational fisheries is influenced not only by regional conditions but also by the foundational strength of local fisheries. At the policy and institutional level, Liu (2020) [17], within the framework of rural revitalization, examined issues related to governance mechanisms and industrial coordination. Shih et al. (2024) [18] further integrated the Delphi method and the Analytic Hierarchy Process (AHP) to establish a six-dimensional policy assessment system aimed at promoting recreational fisheries in the Chinese mainland’s coastal communities. Among the identified dimensions, “government support”, “service facilities”, and “activity pricing” were regarded as key indicators for assessing policy effectiveness. Additionally, Zhang et al. (2024) [19] analyzed the integration of recreational and traditional fisheries in the Chinese mainland from a supply-and-demand perspective, shedding light on the challenges and transformation mechanisms underlying this convergence.

3.1.2. Domestic Research on the Driving Forces of Industrial and Tourism Development

Given the limited body of literature directly examining the driving forces behind the development of recreational fisheries, this study draws upon research methodologies from related fields that explore industrial development dynamics. In contemporary domestic academic research, commonly used methods for studying driving forces include empirical analysis, literature review, logical analysis, theoretical modeling, and field investigation. For example, Zhang and Zhou (2022) [20] employed a literature review and logical analysis to explore the driving forces behind the digital empowerment of the ice and snow sports industry. Zhang (2024) [21], drawing on fieldwork conducted in multiple regions, used theoretical analysis to examine the motivation mechanisms driven by face-saving pressure. Weng et al. (2024) [22] applied a spatiotemporal geographically weighted regression model to investigate the driving factors behind the green transformation in 26 mountainous counties in Zhejiang Province and subsequently proposed relevant policy recommendations. Furthermore, in the field of tourism-related research on driving forces, Zhang and Li (2022) [23] employed theoretical deduction to argue that the coupling between cultural interpretation and tourism industry elements, as well as the complementarity of industrial functions, serves as a key driving force for cross-industry reproduction of tourism products. Wang et al. (2023) [24] used a panel regression model to investigate the influencing factors of high-quality tourism development and found that the driving forces vary across regions. Based on the conceptual framework of a “driver–state–response” mechanism for rural tourism digitalization, Yin (2023) [25] conducted a systematic analysis of the fundamental driving forces that facilitate its development.

3.2. International Research

3.2.1. International Research on Recreational Fisheries

As an emerging industry that integrates fisheries and tourism, recreational fisheries have developed rapidly worldwide. International research on recreational fisheries primarily focuses on their ecological impacts, management models, institutional arrangements, and socioeconomic benefits. Early studies concentrated on the pressure exerted by recreational fishing on aquatic biological resources and its implications for ecological sustainability. For example, Cooke and Cowx (2004) [26] noted that with the global depletion of fishery resources, the contribution of recreational fisheries to total catch has become increasingly significant and should be formally integrated into resource governance systems. Veiga et al. (2010) [27], using the example of shore-based fishing activities in southern Portugal, conducted a quantitative analysis and found that although recreational fisheries generate economic benefits, they also impose notable harvesting pressure on certain fish populations, highlighting the importance of maintaining ecological–economic balance. At the theoretical level, Arlinghaus and Cooke (2009) [28] argued that recreational fisheries should move away from traditional “command-and-control” management models and instead adopt ecosystem-based, stakeholder-participatory, and voluntary multi-level governance approaches to enhance institutional adaptability and social acceptability. This perspective was further elaborated in subsequent research. Arlinghaus et al. (2017) [29] characterized recreational fisheries as a typical “complex adaptive social–ecological system”, emphasizing the bidirectional feedback mechanisms between human behavior and ecological systems. They recommended the use of interdisciplinary governance tools to improve system resilience. In terms of institutional research, Fowler et al. (2023) [30], through a comparative policy study across 15 countries, pointed out that recreational fisheries are often marginalized in marine fisheries governance, lacking clear goal-setting, performance indicators, and quota management mechanisms. This issue limits the effectiveness of policy implementation and weakens the sector’s influence in resource allocation debates. Correspondingly, Ryan et al. (2025) [31] proposed a framework for understanding recreational fishers’ attitudes toward fisheries policy, which helps identify target groups for communication and enhances public acceptance and policy execution. Regarding behavioral response mechanisms, Arostegui et al. (2021) [32] systematically compared seven common regulatory approaches in recreational fisheries—such as quota controls, temporal and spatial restrictions, and gear regulations—and concluded that appropriately combining these methods can balance ecological objectives with angler satisfaction. Furthermore, Brownscombe et al. (2019) [33] emphasized that the rise of citizen science and digital data collection has opened new avenues for adaptive management in recreational fisheries and made stakeholder co-governance increasingly feasible.

3.2.2. International Research on the Driving Forces of Industrial and Tourism Development

In terms of methodological approaches, international studies have widely employed empirical modeling, panel data analysis, structural equation modeling, and institutional variable modeling to identify the core drivers of industrial transformation or accelerated development across various sectors. For instance, Klevtsova et al. (2021) [34], using global industrial sector statistics, applied time-series and dynamic analysis methods to investigate the coupling relationships among fiscal input, technological density, and employment structure that underlie industrial transformation. Similarly, Ndubuisi et al. (2023) [35], in their analysis of service-sector growth acceleration in 50 developing countries, employed a Probit model to identify key factors driving the expansion of market-based service industries. Beyond macro-level statistical analyses, several scholars have emphasized the mediating effects of geographical heterogeneity and spatial mechanisms in shaping development dynamics. For example, Sakita et al. (2023) [36] focused on the digital transformation of seaports and adopted a combined approach of bibliometric analysis and conceptual modeling to reveal the spatial and institutional factors influencing this transition. Furthermore, in the study of tourism development drivers, Kvam and Stræte (2010) [37], based on a case study of sea-angling tourism in Norway, emphasized that the true impetus behind regional tourism development lies in the effective diffusion of innovation and the synergy among local enterprises. From the perspective of institutional and perceptual variables, Tan et al. (2017) [38] employed the Geweke causality analysis method to identify that factors such as public safety, transportation, and environmental sanitation constitute the key causal variables driving international tourism growth in Tamil Nadu, India. From a structural efficiency standpoint, Hosseini and Hosseini (2021) [39] constructed a two-stage super-efficiency SBM model to evaluate the contribution of tourism infrastructure to industrial performance across 24 developing countries. Their findings revealed that the coordination between tourist-support facilities and demand-driven infrastructure is the main explanatory factor for efficiency disparities. At the macro level, Yang et al. (2024) [40], using longitudinal data from 71 countries between 1996 and 2016, found that technological innovation and industrial upgrading significantly contribute to the development of the tourism sector.
Table 2. Literature on recreational fisheries and development drivers.
Authors
and Year
Domestic/InternationalResearch
Objective
Research
Method
Research
Subject
Research
Conclusions
Yang et al., 2017 [5]DomesticTo propose a responsible recreational fisheries management framework tailored to China’s policy context and ecological conditions.Literature review and policy analysisRecreational fisheries management in the Chinese mainlandResponsible recreational fisheries management can support ecological sustainability and stakeholder engagement in the Chinese context.
Cooke & Cowx, 2004 [26]InternationalTo assess the role of recreational fisheries in the global fisheries crisis and explore its implications for sustainable resource management.Perspective
commentary
Global recreational fisheriesRecreational fisheries represent a significant factor in global fishery resource dynamics and require integration into international management frameworks.
Arlinghaus et al., 2017 [29]InternationalTo conceptualize freshwater recreational fisheries as complex adaptive social–ecological systems and propose strategies for integrated governance.Theoretical framework and case analysisFreshwater recreational fisheriesManaging freshwater recreational fisheries as complex systems can enhance resilience through institutional flexibility and stakeholder feedback.
Fowler et al., 2023 [30]InternationalTo incorporate recreational fishing into marine fisheries harvest strategies to support long-term ecological sustainability.Cross-national policy case studyGlobal marine recreational fisheriesRecreational fisheries remain underrepresented in marine management regimes, necessitating their formal integration into sustainable harvest planning.
Arostegui et al., 2021 [32]InternationalTo compare and assess the effectiveness of seven regulatory instruments in balancing ecological sustainability with recreational fishing satisfaction.Institutional comparison and behavioral analysisGlobal marine recreational fisheriesCombining multiple regulatory instruments can enhance ecological outcomes while maintaining recreational angler satisfaction.
Dong & Yang, 2014 [14]DomesticTo explore the pathways for the integrated development of recreational fisheries from the perspective of industrial convergence.Theoretical analysisCoastal areas in the Chinese mainlandThe development of recreational fisheries requires coordinated efforts in resource conservation and market alignment.
Le & Fan, 2019 [16]DomesticTo empirically assess how variations in the labor force contribute to changes in recreational fisheries output across Chinese provinces.Varying-coefficient regression model28 provinces and municipalities in the Chinese mainland from 2003 to 2016Labor force changes interact with baseline fisheries infrastructure to shape recreational fisheries’ output performance.
Zhang et al., 2024 [19]DomesticTo investigate the integration challenges between traditional and recreational fisheries in the Chinese mainland from a supply–demand perspective.Empirical analysis from a supply–demand perspective29 provinces in the Chinese mainland from 2005 to 2019Structural mismatches between traditional and recreational fisheries highlight the need for innovative integration strategies.
Klevtsova et al., 2021 [34]InternationalTo examine industrial sector transformation under global restructuring, focusing on institutional reform and structural adjustment.Time-series and structural variable analysisGlobal industrial sectorIndustrial development is primarily driven by long-term institutional adaptation and macroeconomic restructuring.
Sakita et al., 2023 [36]InternationalTo evaluate the enablers and barriers of digital transformation in maritime ports using stakeholder consultation and literature synthesis.Bibliometric and conceptual modelingMaritime port logistics sectorDigital transformation in ports is facilitated by external technological innovation and internal absorptive capacities.

3.3. Research Contribution

This paper focuses on the 11 coastal provinces (municipalities and autonomous regions) of the Chinese mainland, aiming to investigate the fundamental driving forces and regional heterogeneity of recreational fishery development, thereby contributing both theoretical and practical value. On the one hand, with the advancement of the Rural Revitalization Strategy and the implementation of “culture–tourism integration” policies, recreational fisheries have been further endowed with key functions such as promoting green development, supporting ecological restoration, and generating rural employment. As such, the sector has emerged as a new engine for upgrading traditional fishing regions and diversifying rural economies. However, regional disparities in resource endowment, market demand, and policy responsiveness have led to marked spatial heterogeneity in the development of recreational fisheries across the Chinese mainland. Analyzing the influencing factors and regional differences in recreational fishery development can help relevant authorities provide targeted guidance for high-quality growth, avoid “one-size-fits-all” approaches, foster dynamic mechanisms for growth, and build long-term institutional frameworks to continuously enhance the sector’s development. On the other hand, considering that academic research on the driving forces of recreational fisheries remains scarce and lacks a mature theoretical framework, this study fills an important gap in the literature. It is expected to attract more scholarly attention and stimulate deeper theoretical inquiry, thereby enriching and expanding the field of recreational fishery studies.

4. Theoretical Analysis and Research Hypotheses

4.1. Driving Forces: Natural Resource Endowment and Market Demand

The development of recreational fisheries is influenced by a range of interacting factors, which can be broadly categorized into supply-side and demand-side drivers. In this study, we categorize them into two primary dimensions—natural resource endowment and market demand. While institutional factors, cultural preferences, or other potential drivers may also exert influence, this study focuses on these two fundamental categories of driving forces due to their direct relevance, data availability, and theoretical salience in explaining regional development disparities. Moreover, these two dimensions reflect the ecological basis and the economic impetus of recreational fisheries, respectively, making them particularly relevant for assessing the sustainability of different regional development patterns. Building on this classification, we further explore how each dimension contributes to or constrains the long-term sustainability of regional development trajectories.
This two-dimensional framework offers a theoretical basis for analyzing the regional variation in development paths and enables a nuanced understanding of sustainability: while resource endowment provides essential ecological support, it may lead to environmental strain if overexploited; market demand, on the other hand, reflects economic vitality, yet excessive commercialization without ecological consideration may undermine long-term balance. Together, these dimensions frame a more comprehensive view of sustainable recreational fishery development.

4.2. Hypothesis and Impact Mechanism of Natural Resource Endowment on Recreational Fishery Development

From the supply-side perspective, natural resource endowment constitutes the fundamental condition for the advancement of recreational fisheries. The abundance of fishery resources within a region directly determines its supply capacity and attractiveness in developing recreational fisheries. According to the theory of marginal productivity, the richer the resource endowment, the greater its potential economic benefits and industrial development space. Furthermore, the theory of comparative advantage suggests that unique natural resources not only serve as the material foundation for production activities but also confer distinctive competitive advantages to the industry. In the context of recreational fisheries, the utilization of fishery resources typically takes the form of angling experiences, fishing tourism, and related activities, whose attractiveness is highly dependent on the quantity and quality of fishery resources. As an important indicator reflecting a region’s natural fishery endowment, the annual fish catch effectively captures the capacity for natural resource supply and its sustainable utilization. Therefore, it is reasonable to assume that regions with more abundant fishery resources are likely to possess enhanced capacity for recreational fishery expansion. Accordingly, the following hypothesis is put forward:
Hypothesis 1. 
Natural resource endowment exerts a significantly positive impact on the gross output value of recreational fisheries.

4.3. Effect and Hypothesis of Market Demand in Promoting Recreational Fishery Development

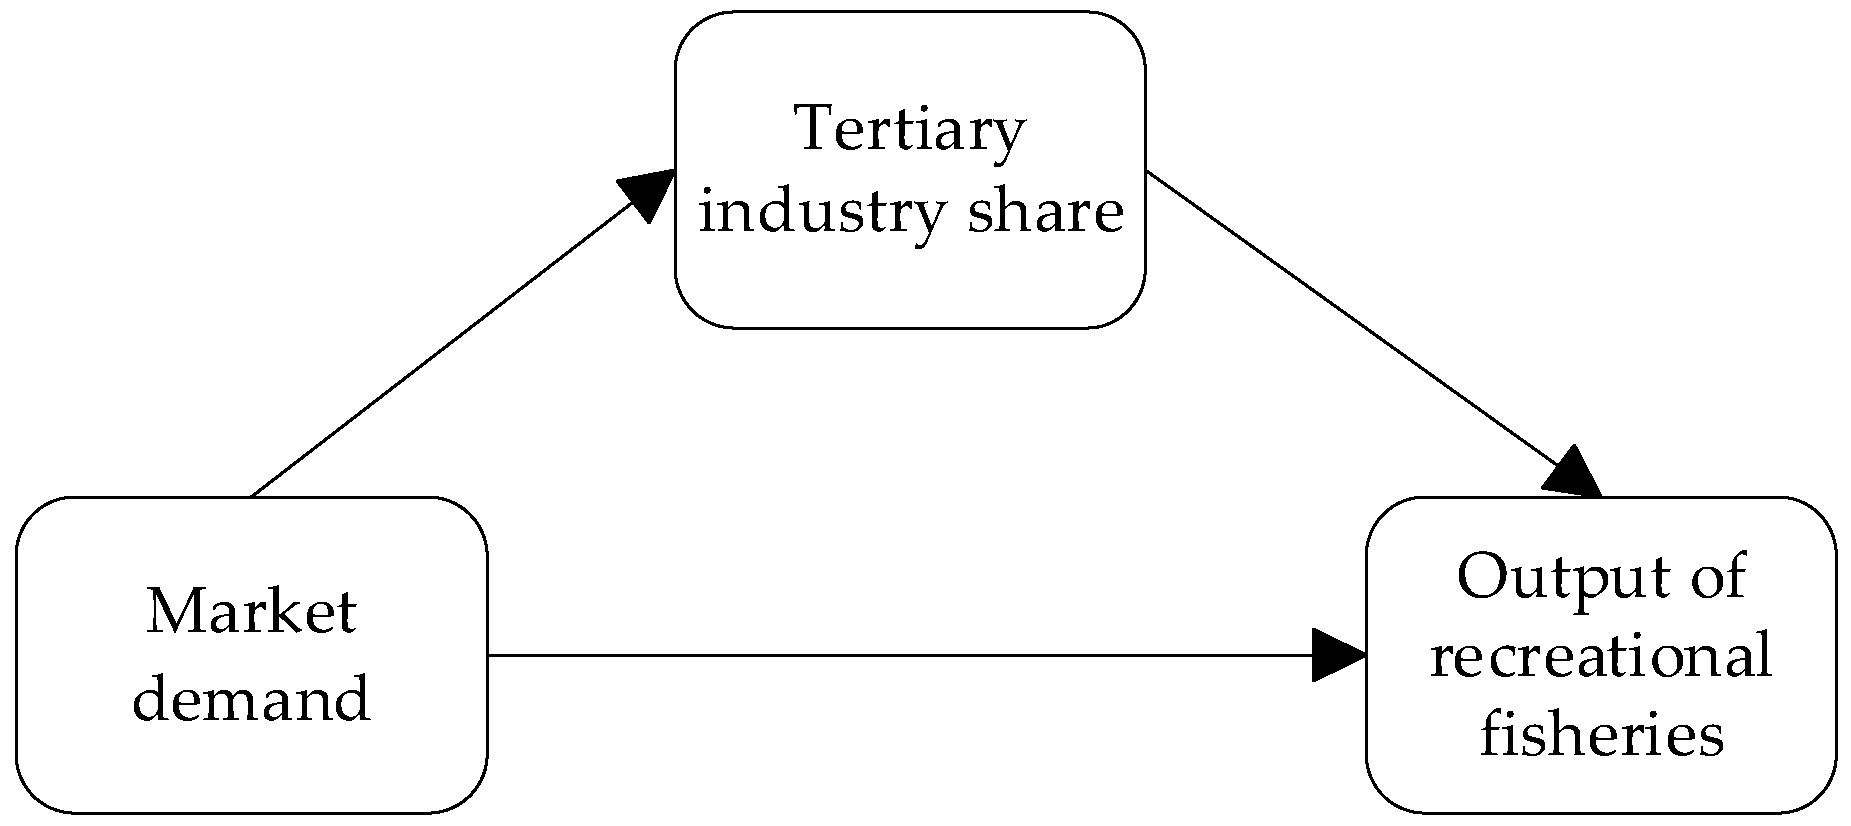
4.3.1. Direct Effect

Market demand constitutes a fundamental driving force behind industrial development and serves as a critical source of momentum for the emergence and growth of recreational fisheries. From a demand-side perspective, the upgrading of household consumption and the evolution of tourism behavior are key dynamics fostering the development of recreational fisheries. According to Keynesian consumption theory, household income level is the core determinant of consumption capacity. As per-capita disposable income increases, consumer preferences gradually shift from meeting basic subsistence needs to pursuing enjoyment-oriented and experiential consumption. This structural transformation in consumption significantly raises the proportion of expenditure allocated to leisure and recreation, thereby laying a stable and growing demand foundation for recreational fishery development.
In addition, tourism economics posits that the number of tourists is a vital indicator of the industrial demand scale. An increase in total domestic tourist visits expands the potential customer base of recreational fisheries. Meanwhile, per-capita tourism expenditure reflects tourists’ purchasing power; higher spending levels indicate greater market potential. From the perspective of cultural consumption theory, individuals with higher income levels tend to prefer experience-rich and culturally immersive activities. Due to its strong experiential and cultural attributes, recreational fishing has thus become a preferred option for such groups.
In summary, market demand affects the output value of recreational fisheries through multiple dimensions. As key indicators capturing both market scale and consumer capacity, total domestic tourist visits and per-capita tourism expenditure jointly characterize market demand and effectively reveal its driving force. Based on the above theoretical analysis, the following research hypothesis is proposed:
Hypothesis 2. 
Market demand positively contributes to the total output value of recreational fisheries.

4.3.2. Mediating Effect

In the development of recreational fisheries, market demand not only directly determines the level of consumption activity but may also exert an indirect influence by guiding the reallocation of industrial factors at a deeper level.
The share of the tertiary industry, as a key indicator reflecting the degree of regional economic modernization and the vibrancy of the service sector, broadly captures the service-oriented structure of the economy and its consumer-driven tendencies. This variable is believed to play a potential mediating role within the recreational fishery industry chain. On one hand, with rising household incomes and shifting consumer preferences, leisure- and experience-oriented consumption has become increasingly mainstream, driving the continuous expansion of the tertiary sector, especially service-related industries. In this context, the rise in market demand manifests not only in increased tourist numbers and tourism expenditure but also in structural shifts that elevate the share of the service sector within the regional industrial framework. On the other hand, as an emerging industry integrating traditional fisheries with modern services, recreational fisheries rely heavily on the support of tertiary industries such as tourism, catering, and transportation. Regions with a higher share of the tertiary sector typically offer more developed service infrastructure and a more mature consumption environment. These conditions facilitate the attraction of tourists, the extension of stay durations, and increased consumption frequency, thereby creating favorable conditions for the growth of recreational fisheries. From the perspective of spatial economics, an increased share of the tertiary industry enhances the efficiency of industrial chain integration, reduces consumers’ transaction and time costs, and helps unleash consumption potential, all of which contribute to the expansion of recreational fisheries. Based on this theoretical framework, the following hypothesis is put forward:
Hypothesis 3. 
Market demand exerts a significant positive influence on the tertiary industry’s share, which, in turn, substantially enhances the output value of recreational fisheries. The share of the tertiary industry thereby functions as a key intermediary in this causal chain.

4.4. Analysis and Hypotheses on Regional Differences in the Driving Forces of Recreational Fishery Development

Due to differences in natural resource endowments and economic foundations across regions, the development patterns and driving forces of recreational fisheries exhibit significant regional heterogeneity. From the perspective of regional economics, such heterogeneity is a natural outcome of the uneven spatial distribution of economic activities. According to regional economic disparity theory, economically developed areas often possess higher market demand, well-developed service infrastructure, and preferential policy resources. These advantages enable such regions to promote the rapid growth of recreational fisheries through market-driven pathways. In contrast, economically underdeveloped regions are more likely to rely on resource-based development models to leverage their comparative advantages.
This regional variation is not only reflected in economic development levels but is also closely tied to historical trajectories and resource endowments. Path-dependence theory suggests that regions with earlier development may have formed first-mover advantages through historical industrial accumulation and resource exploitation. These regions can further strengthen their competitiveness through industrial agglomeration effects. For example, economically advanced coastal regions may already possess integrated industrial chains in fishery processing and tourism services, offering robust support for the sustained development of recreational fisheries. Conversely, regions with weaker resource endowments or later development may face dual challenges of limited industrial foundations and insufficient market expansion. Theoretical insights from the above discussion lead to the formulation of the following hypotheses aimed at conducting heterogeneity analysis:
Hypothesis 4a. 
In regions with abundant resource endowments, the development of recreational fisheries is more likely to rely on resource-driven pathways, whereas in regions with weaker resource endowments, development is more dependent on market demand.
Hypothesis 4b. 
In regions with higher levels of economic development, recreational fisheries are more likely to grow rapidly through market-driven mechanisms, whereas in less developed regions, development is more likely to depend on natural resource endowments.

5. Research Design

5.1. Model Construction

5.1.1. Fixed-Effects Model

This study employs panel data, for which the fixed-effects (FE) and random-effects (RE) models are standard econometric techniques used to mitigate potential endogeneity. In particular, the two-way fixed-effects (TWFE) model adjusts for unobserved heterogeneity by simultaneously incorporating individual and time fixed effects. Accordingly, the following two-way fixed-effects econometric model is specified in this study:
ln Y i , t = α + β 1 ln ( f i s h i n g i , t ) + β 2 m a r k e t _ d e m a n d i , t + γ X i , t + μ i + λ t + ε i , t
where ln Y i , t serves as the dependent variable in this study, representing the total output value of recreational fisheries; α denotes the intercept term; ln ( f i s h i n g i , t ) is the explanatory variable, i.e., fishery catch; m a r k e t _ d e m a n d i , t is another explanatory variable, namely the market demand index; β 1 and β 2 are the key coefficients to be estimated; X i , t represents a set of control variables that affect residents’ economic activities, including the economic growth rate ( g d p _ g r o w t h ), transportation accessibility ( r o a d _ d e n s i t y ), and urbanization level ( u r b a n ); μ i and λ t represent individual fixed effects and time fixed effects, respectively; ε i , t is the error term; and i and t represent the province and year, respectively.

5.1.2. Mediating-Effect Model

To analyze the channels through which market demand exerts influence on the recreational fishery industry, this paper introduces the proportion of the tertiary industry as a mediating variable to examine whether it plays an indirect transmission role between market demand and the output value of recreational fisheries. Theoretically, an increase in market demand may lead to the reallocation of resources and capital toward service-oriented industries, thereby promoting the overall expansion of the tertiary sector. The rise in the proportion of the tertiary industry is often accompanied by growing demand for leisure consumption, forming a potential mediating pathway of “demand–structure–output value”. Meanwhile, natural resource endowment is incorporated into the model as a control variable to eliminate its direct influence on the dependent variable, allowing for a more focused identification of the mediating role of market demand in influencing the output value of recreational fisheries. This study adopts the stepwise testing method proposed by Baron and Kenny (1986) [41] to assess the mediating effect and constructs the following mediating effect model:
ln Y i , t = μ 0 + μ 1 m a r k e t _ d e m a n d i , t + μ 2 C o n t r o l i , t + μ i + λ t + ε i , t
Z i , t = γ 0 + γ 1 m a r k e t _ d e m a n d i , t + γ 2 C o n t r o l i , t + μ i + λ t + ε i , t
ln Y i , t = δ 0 + δ 1 m a r k e t _ d e m a n d i , t + δ 2 Z i , t + δ 3 C o n t r o l i , t + μ i + λ t + ε i , t
where Z i , t denotes the mediating variable, represented by the proportion of the tertiary industry, and C o n t r o l i , t refers to the collection of control variables in the basic regression model, with the addition of natural resource endowment ln ( f i s h i n g i , t ) . If the model simultaneously satisfies the following conditions, it indicates that Z i , t acts as a mediator in the relationship: the coefficients γ 1 in Equation (3) and δ 1 and δ 2 in Equation (4) are all statistically significant, and the absolute value of δ 1 in Equation (4) is smaller than that of μ 1 .

5.2. Measurement and Description of Variables

5.2.1. Explained Variable: ln Y

The dependent variable selected in this study is the total output value of recreational fisheries. To eliminate the influence of price fluctuations, the nominal values were deflated using the Consumer Price Index (CPI) of each province (municipality/autonomous region), with 2004 as the base year, thereby converting them into real variables. Furthermore, to reduce heteroscedasticity, the variable was transformed using the natural logarithm.

5.2.2. Explanatory Variables

Given the limitations of data availability and the scope of this study, we focus on quantifiable and economically relevant drivers—namely, natural resource endowment and market demand—as the primary explanatory variables:
1.
Natural Resource Endowment ( ln ( f i s h i n g ) )
To quantify this dimension, this study selects the annual fishery catch as a proxy indicator. To eliminate the scale effects caused by differences in economic size across regions, the variable is transformed using the natural logarithm.
2.
Market Demand ( m a r k e t _ d e m a n d )
To comprehensively measure the level of market demand in the Chinese mainland’s coastal regions, this study selects the “total number of domestic tourist visits” and the “per-capita tourism expenditure” as representative indicators. Principal component analysis (PCA) is employed to reduce dimensionality and construct a composite index of “market demand” [42]. The representative indicators are described as follows:
(a)
Domestic tourist arrivals: This variable reflects the scale of the regional tourism market and effectively captures the potential demand for recreational fisheries from tourists. To control for differences in variable magnitudes, the natural logarithm of this variable is taken.
(b)
Per-capita tourism expenditure: This variable measures the spending power of tourists and represents an important aspect of the tourism demand structure. The indicator is calculated as the “domestic tourism revenue divided by domestic tourist arrivals”. To control for differences in variable magnitudes, the natural logarithm of this variable is taken.
The specific variable settings are as follows:
m a r k e t _ d e m a n d i , t = ω 1 ln x 1 , i , t + ω 2 ln x 2 , i , t

5.2.3. Mediating Variable

Based on the preceding theoretical analysis, this paper selects the tertiary industry share ( i n d u s t r y ) as the mediating variable, which is commonly regarded as an important indicator of the level of service-oriented economic development in a region.

5.2.4. Control Variables

To reduce potential bias in the regression results caused by omitted variables, this study draws on the relevant literature [43] and includes the following control variables:
1.
Economic growth rate ( g d p _ g r o w t h )
This indicator measures the level of regional economic development. To eliminate dimensional effects and ensure comparability of growth rates across regions and over time, it is expressed as the log-difference of regional gross domestic product (GDP), calculated as follows:
g d p _ g r o w t h i , t = ln ( g d p i , t ) ln ( g d p i , t 1 )
2.
Transportation accessibility ( r o a d _ d e n s i t y )
This indicator serves as a critical external condition influencing regional economic activity. In this study, road density is selected as the proxy variable, measured in kilometers per square kilometer (km/km2).
3.
Urbanization level ( u r b a n )
This indicator reflects the transformation of the regional socio-economic structure and is specifically measured by the proportion of the urban permanent population to the total permanent population.

5.3. Data Sources

Considering data accessibility and the research goals, the time frame under investigation ranges from 2005 to 2023, and the sample consists of 11 coastal provinces, municipalities, and autonomous regions in the Chinese mainland, namely Tianjin, Hebei, Liaoning, Shanghai, Jiangsu, Zhejiang, Fujian, Shandong, Guangdong, Guangxi Zhuang Autonomous Region, and Hainan. The data for the variables used in this study are primarily sourced from the China Fishery Statistical Yearbook, the statistical yearbooks of the respective provinces (municipalities and autonomous regions), and the Statistical Communiqués on National Economic and Social Development. Data analysis and processing were conducted using Stata 18 software. The key characteristics and summary measures of the variables are presented in Table 3.

6. Results Analysis

6.1. Baseline Regression Analysis

To compare and reference the regression results, this study proceeded through the following modeling stages: In the first step, a baseline specification without any fixed effects or control variables was constructed, and Ordinary Least Squares estimation (Model I) was applied. Next, potential control variables that may influence residents’ economic activities were introduced, and the model was estimated using clustered least squares (Model II). Then, the same set of control variables was retained, and regression was conducted using a random-effects model (Model III). Finally, on the basis of controlling for provincial-level variables, both year and individual fixed effects were further incorporated, and regression analysis was conducted using a fixed-effects model (Model IV).
The core regression results are presented in Table 4. The dependent variable in all models is the recreational fishery output value of the Chinese mainland’s provinces (municipalities and autonomous regions). The outcome of the Hausman test (p-value = 0.00) led to the rejection of the null hypothesis, which posits that individual-specific effects are independent of the explanatory variables. Therefore, the fixed-effects specification is preferred for the panel data analysis. The regression results of the fixed-effects model are shown in Model IV of Table 4.
According to the baseline regression results, regardless of whether control variables were included, the estimated coefficients of the explanatory variables—natural resource endowment and market demand—were all significantly positive at the 10% statistical level across all models. Specifically, the fixed-effects model indicated that at the 10% level of statistical significance and holding other conditions constant, a 1% increase in the annual fishery catch leads to an average increase of approximately 0.142% in recreational fisheries output, demonstrating that natural resource endowment serves as a key enabler in the development of recreational fisheries. Furthermore, at the 1% significance level, a one-unit increase in market demand results in an average increase of about 0.575% in recreational fisheries output, indicating that market demand is a key driving force behind the growth of the recreational fisheries sector.

6.2. Heterogeneity Test

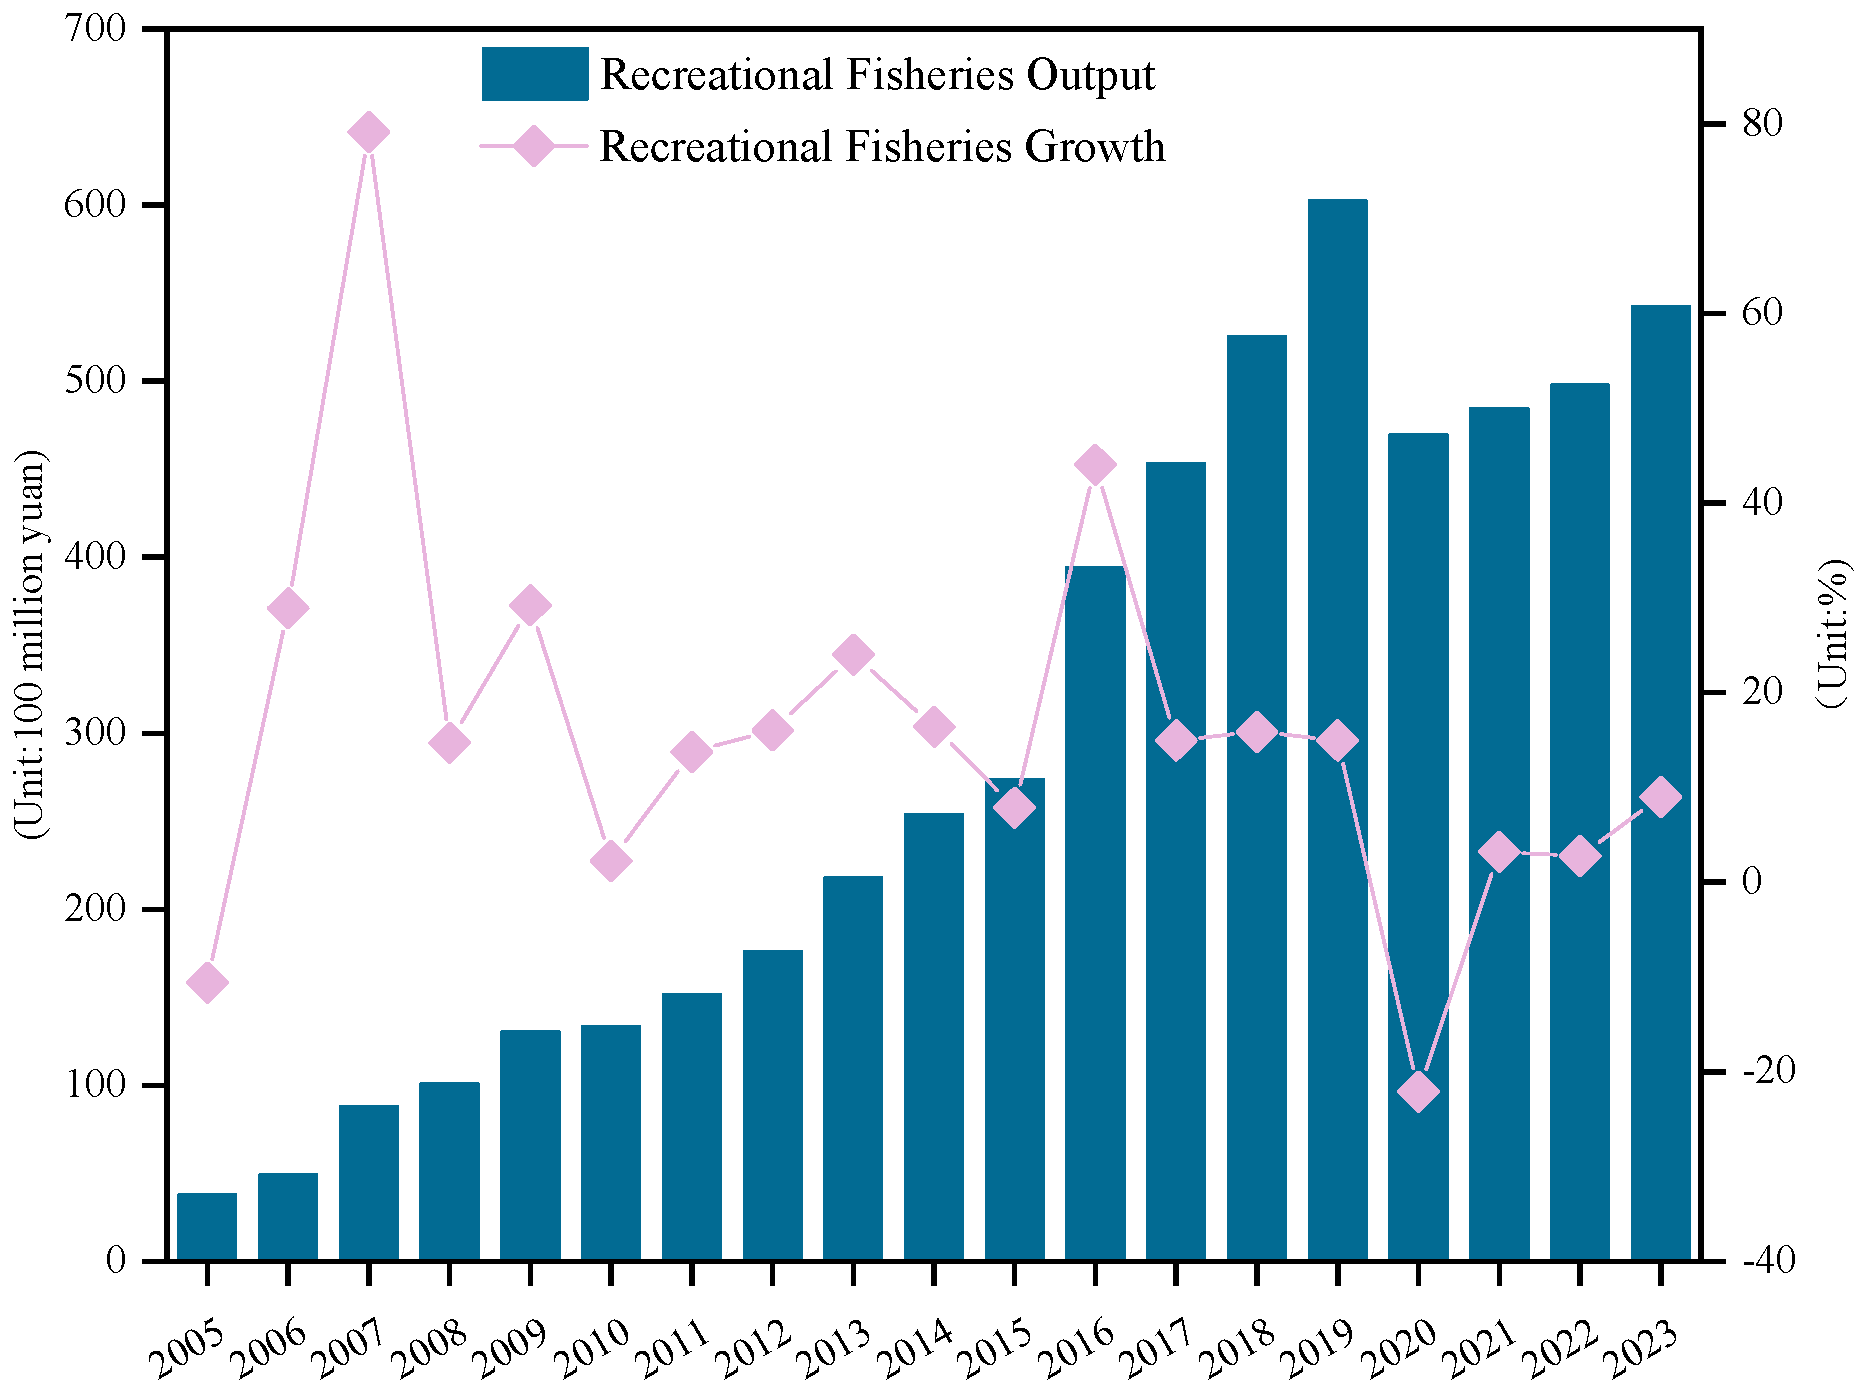
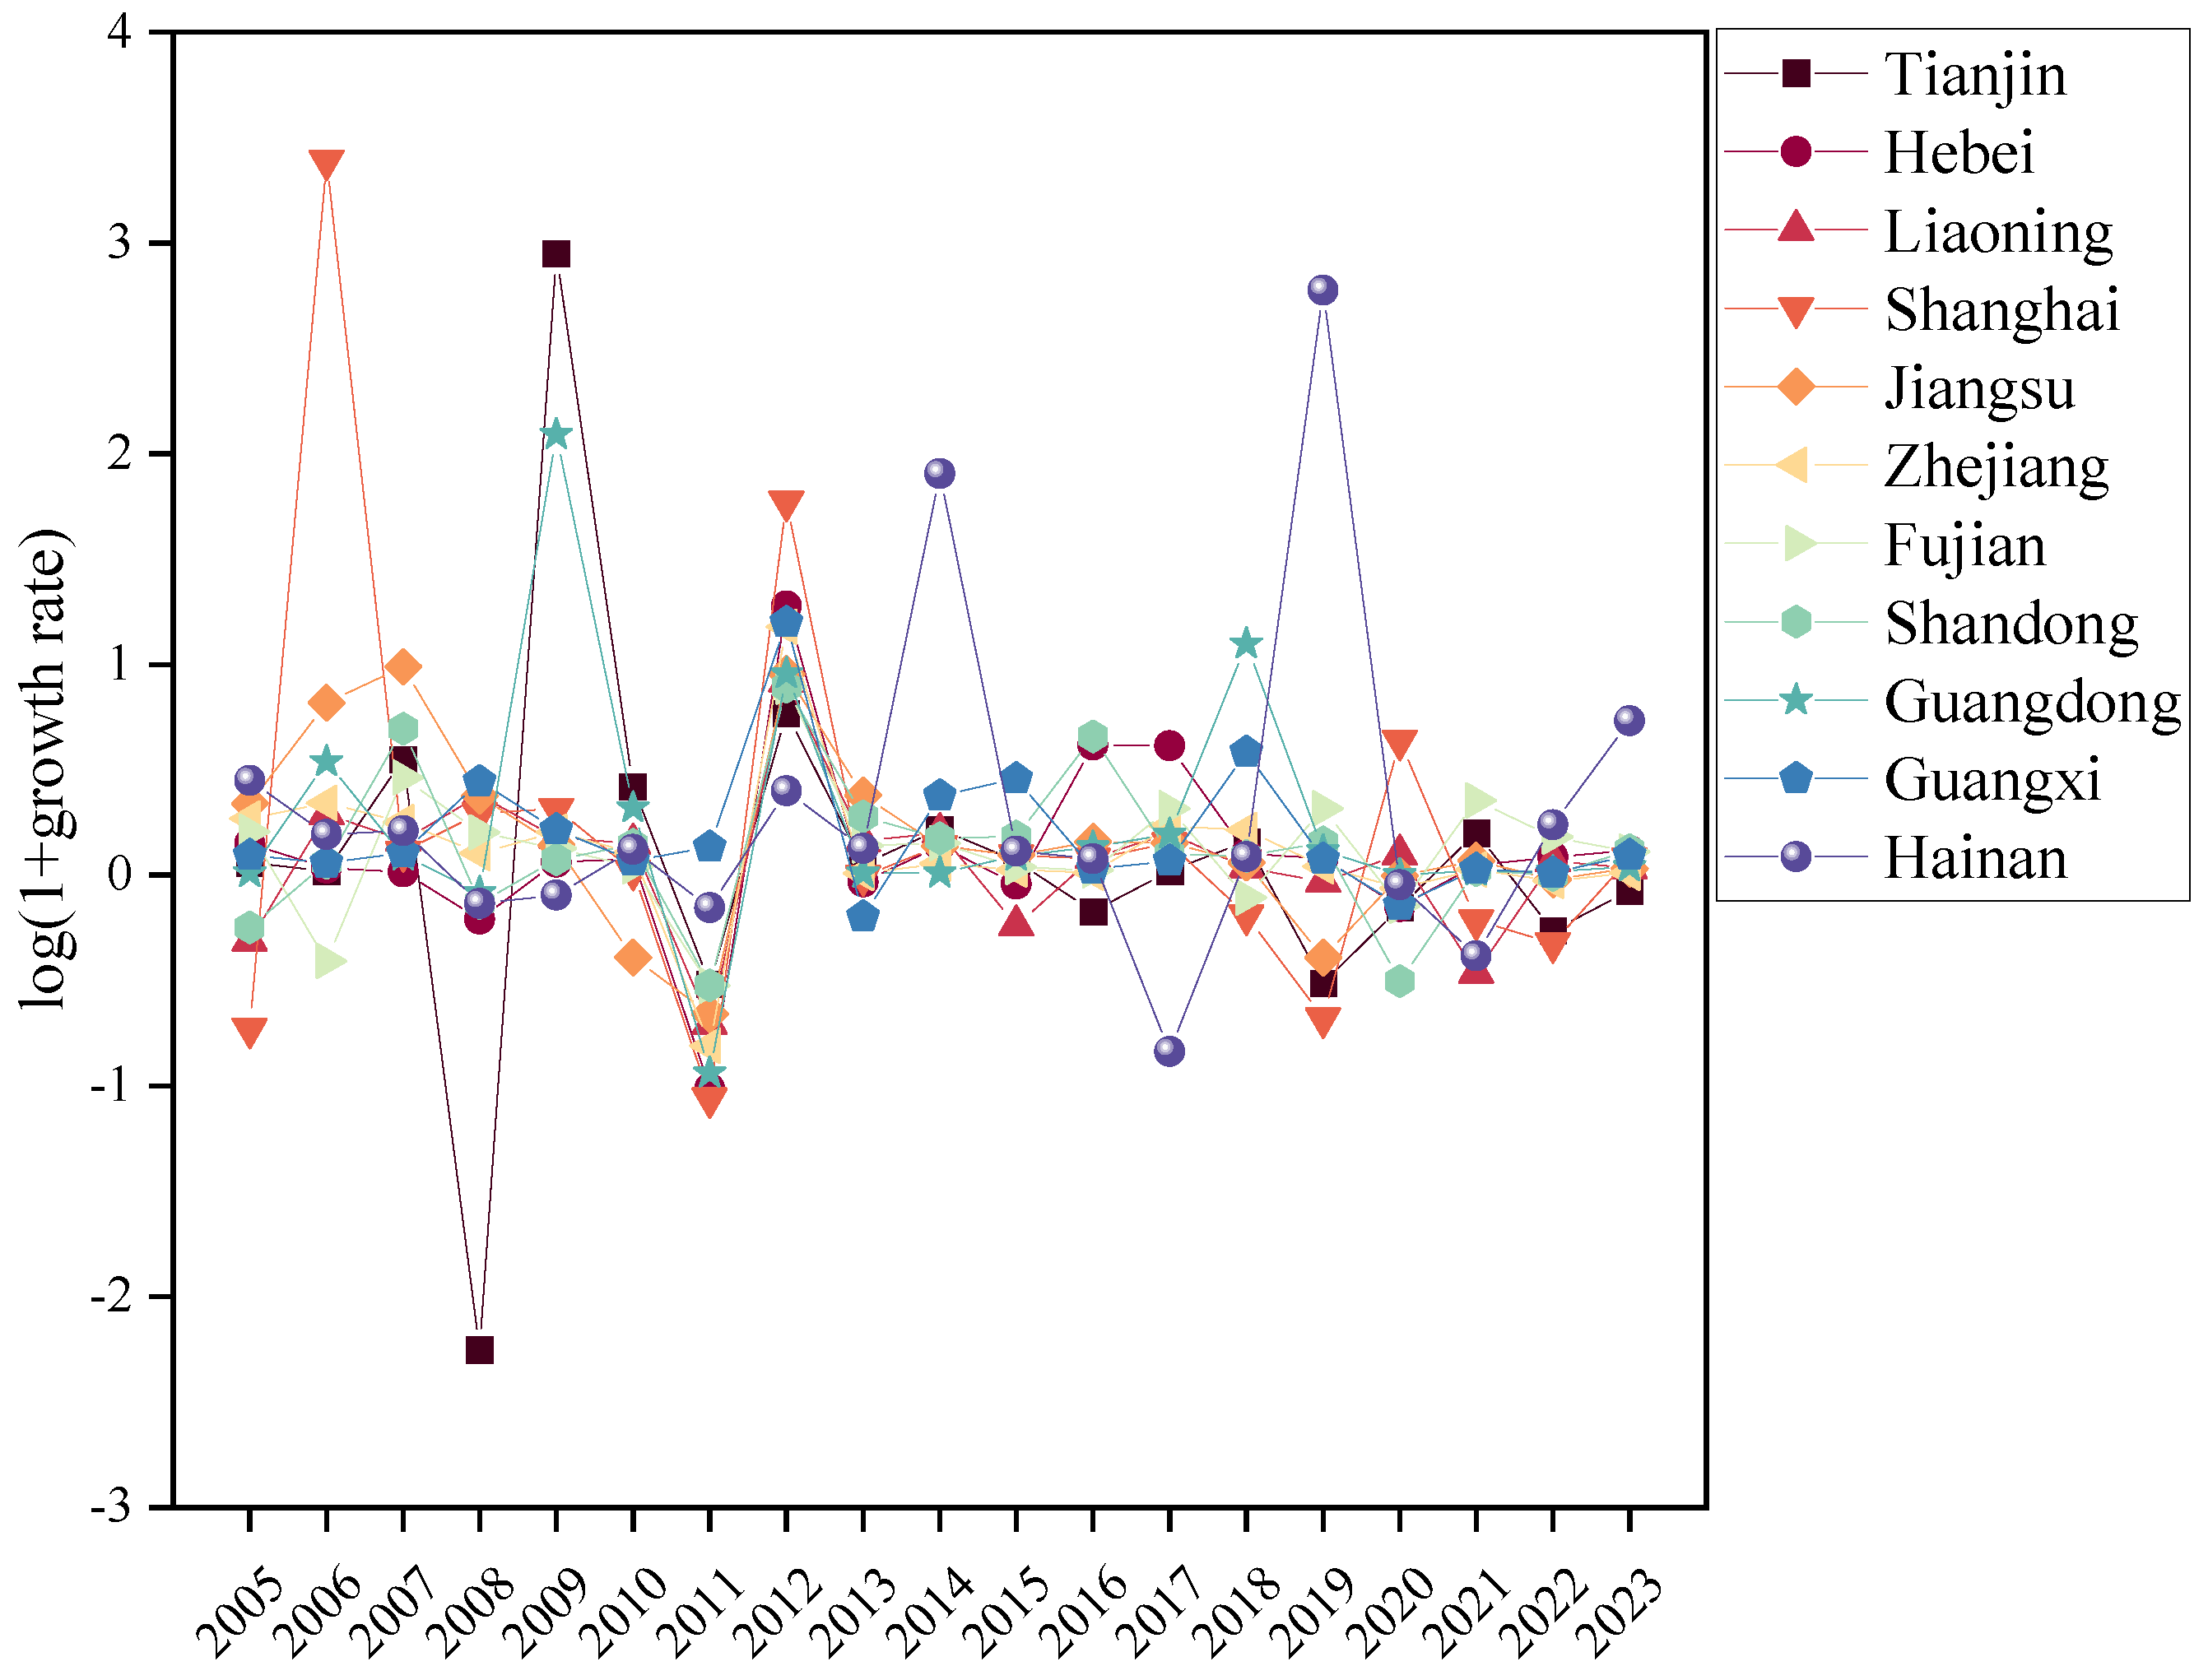
6.2.1. Visualization of Recreational Fisheries Output Growth Trends

Before conducting the heterogeneity analysis of the driving forces behind recreational fisheries, we section examined the trends in the average annual growth rate of recreational fisheries output across 11 coastal provincial-level administrative divisions in the Chinese mainland from 2005 to 2023. This analysis helped to better understand the spatiotemporal heterogeneity in the development of recreational fisheries. Due to the presence of extreme values in the raw growth-rate data, a logarithmic transformation was applied, allowing the long-term growth trends across provinces to be presented more clearly.
The transformation follows this formula:
G r o w t h   R a t e = log ( 1 + x 100 )
where x denotes the original annual growth rate. This transformation preserves all valid observations while compressing large values, thus mitigating the distortion caused by outliers and allowing for a more nuanced view of regional development patterns.
Figure 3 illustrates the notable differences in the development trajectories of recreational fisheries across the 11 coastal provinces, municipalities, and autonomous regions in the Chinese mainland. As shown in the graph, most regions exhibit relatively stable growth patterns, while provinces such as Shanghai, Hainan, and Tianjin display more pronounced fluctuations. These inter-provincial disparities underscore the importance of further investigating the underlying driving forces behind such variation.

6.2.2. Disaggregated Analysis by Resource and Economic Levels

To explore the regional heterogeneity of the driving forces behind recreational fishery development, this paper conducted subregional regression analyses. Specifically, the 11 coastal provinces (municipalities and autonomous regions) included in the study were classified into distinct groups based on two key dimensions: natural resource endowment and economic development level. Based on differences in the average annual fishery catch, the provinces were divided into low-resource and high-resource regions. Then, according to the average GDP during the study period (2005–2023), they were categorized into low-economic-level and high-economic-level regions (see Table 5). Subgroup regressions were then performed to analyze potential variations in the driving mechanisms of recreational fisheries (see Table 6).
In low-resource regions, the coefficient of the impact of natural resource endowment on the output value of recreational fisheries is 0.369 and is significantly positive at the 10% statistical level. The coefficient for market demand is 0.505 and is significantly positive at the 1% level, indicating that in areas with relatively limited fishery catch volumes, the development of recreational fisheries relies more heavily on market demand. In contrast, in high-resource regions, the coefficient of natural resource endowment is 0.253 and significantly positive at the 10% level, while the coefficient for market demand is positive but not statistically significant.
In low-economic-level regions, the coefficient of the impact of natural resource endowment on the output value of recreational fisheries is 0.601 and is significantly positive at the 1% statistical level. The coefficient for market demand is 0.481, also significantly positive at the 1% level. This suggests that in areas with relatively low levels of economic development, the growth of recreational fisheries relies more on natural resource endowments. In high-economic-level regions, the coefficient for market demand is 0.527 and statistically significant at the 5% level, while the coefficient for natural resource endowment is positive but not statistically significant.

6.2.3. Subsample Case Analysis: Interpreting Sustainability in Contrasting Regional Combinations

To further explore how different combinations of natural resource endowment and economic development level influence the sustainability of recreational fisheries, we conducted a sub-case analysis on two contrasting regional groups. Fujian and Hainan are categorized as high-resource but low-economic-level regions, while Shanghai and Jiangsu are classified as low-resource but high-economic-level regions. These groupings are based on the provincial-level classification results presented in Table 5. The table below presents the regression results for the two subsamples. “High Resource–Low Economic Level” refers to provinces with high natural resource endowment but relatively low levels of economic development, representing a resource-driven development pattern. “Low Resource–High Economic Level” denotes regions with low natural resource endowment but high levels of economic development, reflecting a market-driven development trajectory (see Table 7).
In the high-resource, low-economic-level group, the coefficient of the impact of natural resource endowment on recreational fisheries output is 1.520 and is significantly positive at the 1% statistical level. In contrast, market demand is not statistically significant. This suggests that in these less economically developed but resource-rich regions, the growth of recreational fisheries heavily relies on the exploitation of ecological resources. In the low-resource, high-economic-level group, the dynamic is reversed. The coefficient of the impact of market demand on recreational fisheries output is 0.216 and is significantly positive at the 1% statistical level, whereas natural resource endowment shows a weaker and statistically insignificant effect. These provinces exhibit a market-responsive trajectory, wherein industry development is increasingly shaped by consumer behavior, diversified services, and advanced economic capacity.
These findings underscore the differentiated mechanisms of recreational fishery development across regions and highlight that sustainability challenges vary accordingly.

6.3. Mediation Mechanism Test

On the basis of the earlier theoretical considerations, this research further examined whether the proportion of the tertiary industry serves as a mediating variable between market demand and the development of the recreational fishery industry. Three models were constructed (see Table 8), where Model V estimated the direct effect of market demand on recreational fisheries, Model VI tested the impact of market demand on the tertiary industry, and Model VII included both variables to assess whether the tertiary industry mediates the relationship between market demand and recreational fisheries.
As shown in Figure 4 and Table 8, the coefficient of market demand on the proportion of the tertiary industry is 0.775, which is statistically significant at the 5% level. The coefficient of the tertiary industry proportion on recreational fisheries output is 1.188, significant at the 10% level. Additionally, the coefficient of market demand in Model VII (0.566) is smaller than that in Model V (0.575), indicating the presence of a mediating effect.

6.4. Robustness Tests

To strengthen the credibility, robustness, and validity of the regression analysis results, this study implemented several robustness checks: (1) Winsorization: To ensure robustness, the main variables were Winsorized at the bottom 1% to mitigate outlier bias, and the effects of natural resource endowment and market demand on recreational fisheries were re-examined. (2) Changing the sample range: The years 2020 to 2022 corresponded to the initial global spread of the COVID-19 pandemic and adjustments to prevention and control policies. To exclude the impact of major external shocks, the sample data for these years were removed, and fixed-effects model regression analysis was re-conducted (see Table 9).
Table 9 presents the results of the robustness tests. It can be observed that, whether through Winsorization or narrowing the sample period, the direction and significance of the explanatory variables remain consistent with those in the benchmark regression. This outcome provides further support for the robustness of the initial results.

7. Discussion

7.1. Hypothesis Test Results

Based on the theoretical framework and empirical analysis, this section summarizes the test results of the proposed research hypotheses. The analysis focuses on examining the effects of key driving factors—such as natural resource endowment and market demand—on the total output value of recreational fisheries. The outcomes of the hypothesis test are presented in Table 10.

7.2. Baseline Regression Results

The baseline regression results suggested that both natural resource endowment and market demand have a significant positive impact on the total output value of recreational fisheries, thereby validating Hypotheses 1 and 2 proposed in this paper. According to the results of the robustness tests, whether through Winsorization or altering the sample range, natural resource endowment, and market demand, consistently demonstrated a significant positive effect on the output of recreational fisheries, indicating the robustness of the research findings. Regarding the regression results of the control variables, road density exerts a positive effect on the output of recreational fisheries. The academic discourse on the relationship between transportation accessibility and the development of the recreational fishery industry often draws from New Economic Geography theory, which posits that reduced transportation costs diminish the constraints of geographic distance. An improved transportation network facilitates the spatial agglomeration of recreational fisheries and promotes industrial chain coordination. In the long run, there exists a significant cumulative circular relationship between transportation convenience and the development of recreational fisheries. Initial transportation investments lower the market access threshold, attracting the first wave of recreational fishery practitioners. Their successful demonstration further incentivizes continued government investment in transportation infrastructure, forming a positive feedback loop. This process may also encourage the transformation of traditional fisheries into high-value-added recreational services, thereby fostering industrial structure optimization and upgrading. In addition, economic growth and urbanization levels did not demonstrate statistically significant effects on the development of recreational fisheries, suggesting that these factors are not currently primary drivers of the industry’s growth.

7.3. Mediation Mechanism Results

The regression results from the mediation analysis revealed that rising market demand significantly contributes to the expansion of the tertiary sector, and the expansion of the tertiary industry exerts a significant positive impact on recreational fisheries. These findings confirm Hypothesis 3 proposed in this study: market demand exerts a significant positive influence on the contribution of the tertiary industry; the share of the tertiary industry, in turn, positively influences the output value of recreational fisheries; and the tertiary industry acts as a mediating variable in the relationship between market demand and the output value of recreational fisheries.

7.4. Heterogeneity Test Results

The regression results of the heterogeneity analysis confirm Hypotheses 4a and 4b, indicating that differences in resource endowments and economic foundations across regions lead to distinct development patterns and sources of industrial momentum, thus exhibiting significant regional heterogeneity.
In low-resource regions, both natural resource endowments and market demand constitute major motivating factors behind the expansion of recreational fisheries, but the industry relies more heavily on market demand. In contrast, in high-resource regions, the primary driving force is natural resource endowments. The potential reasons for this difference are as follows: (1) When traditional fishery catch volumes are insufficient, regions constrained by limited resources tend to shift their development models, leveraging external market demand to achieve value transformation. Meanwhile, regions with relatively abundant resource supplies may develop a dependency on these resources, leading to a diminished sensitivity to market demand. (2) Furthermore, differences in institutional environments may amplify this disparity. Low-resource regions often face greater pressure for industrial transformation, prompting local governments to enhance market connectivity through preferential policies. In contrast, high-resource regions may lack motivation to upgrade related industries due to the stable returns from traditional fisheries, resulting in a rigid market response mechanism.
In low-economic-level regions, both natural resource endowments and market demand act as driving forces of the development of recreational fisheries, but the industry relies more heavily on natural resource endowments. In contrast, in high-economic-level regions, market demand serves as the primary driver. The possible reasons for this divergence are as follows: (1) In regions with relatively low levels of economic development, recreational fisheries are often in the early stages of industrialization, and the growth of the output value largely depends on the direct exploitation and utilization of natural resources. At the same time, the limited scale and diversity of the consumer market restrict the marginal contribution of market demand. However, once a region’s economic level reaches a certain threshold, diversified consumer demand for recreational fishery products and services becomes the main driving force for output growth. For example, high-economic-level regions are more likely to develop high-end fishing tourism and cultural fishery experiences—value-added formats that are less directly dependent on natural resources but more sensitive to market demand. (2) Institutional differences across regions may further reinforce this divergence. In low-economic-level regions, due to shortages of capital and technology, local governments often prioritize the exploitation of readily available natural resources to achieve short-term economic returns. In contrast, high-economic-level regions tend to optimize resource allocation through policy guidance and market mechanisms—for instance, by promoting the integration of eco-tourism or recreational fisheries with other industries—thereby reducing reliance on singular natural resource advantages.

8. Conclusions and Recommendations

8.1. Conclusions

This paper employed a fixed-effects model to investigate the driving forces behind the development of recreational fisheries and their regional heterogeneity in 11 coastal provinces, municipalities, and autonomous regions in the Chinese mainland from 2005 to 2023. Additionally, this study analyzed the mediating role of the tertiary industry’s share. The primary conclusions derived are as follows:
(1)
All the research hypotheses proposed in this paper have been verified. Overall, natural resource endowment and market demand serve as the main driving forces behind the development of the recreational fishery industry. Market demand exerts a positive effect on the industry through the mediating mechanism of the “proportion of the tertiary industry”. Furthermore, due to differences in economic development levels and natural resource endowments, the driving forces behind recreational fishery development vary significantly across regions. In areas with low resource endowments, both natural resources and market demand contribute to the industry’s development, with a greater reliance on market demand. In contrast, in regions with abundant resources, natural resource endowment is the dominant driver. In areas with lower levels of economic development, both factors are important, but the industry relies more heavily on natural resource endowment. In more economically developed regions, however, market demand is the primary driving force.
(2)
These empirical results contribute to the academic understanding of the driving forces and regional heterogeneity of recreational fisheries and offer practical implications for regional policymakers. By identifying the differentiated roles of natural resource endowment and market demand, this analysis contributes to the broader goals of sustainability by highlighting the importance of balancing ecological carrying capacity with market responsiveness. The findings offer a valuable reference for policymakers seeking to allocate resources more efficiently, support balanced regional development, and formulate tailored development strategies in accordance with local conditions.
(3)
In particular, the regional classification allows us to uncover development trajectories that may present potential sustainability concerns. For example, in resource-rich but economically less diversified provinces, the industry’s heavy reliance on natural resource extraction may lead to ecological vulnerability and long-term development constraints. In contrast, in areas where growth is increasingly demand-driven—such as more economically advanced coastal regions—development appears more resilient and adaptive, with greater potential to align with sustainable consumption patterns and diversified economic structures.

8.2. Recommendations

With the aim of fostering long-term and quality-oriented development in the Chinese mainland’s recreational fishery industry, the following policy recommendations are proposed:
(1)
In regions with relatively scarce natural resources, market demand emerges as the dominant force shaping the output performance of recreational fisheries. Therefore, optimizing resource allocation mechanisms and enhancing the support capacity of the tertiary industry for recreational fisheries should be prioritized. On one hand, efforts should be made to encourage the development of integrated business models such as “fishery + tourism” and “fishery + wellness”, thereby expanding consumption scenarios and extending the industrial chain. On the other hand, it is essential to improve infrastructure related to tourist services and promote the joint development of digital marketing platforms by local governments and enterprises to enhance the precision of outreach to potential consumer groups. Meanwhile, the integration of regional cultural elements with local fishery characteristics should be strengthened to build distinctive recreational fishery brands, thereby improving market recognition and competitiveness.
(2)
In regions with superior natural resource endowments, greater emphasis should be placed on ecological protection and resource use efficiency to prevent path dependence and the risks associated with resource overexploitation. To achieve this, a differentiated management mechanism based on the carrying capacity of water bodies should be established, with reasonable limits on resource development intensity. At the same time, the government should encourage private capital to invest in projects such as eco-friendly fishery resorts and high-end angling camps, thereby promoting the upgrading of recreational fisheries toward higher quality and greater diversity. On this basis, it is imperative to promote the timely implementation of comprehensive green certification schemes and ecological compensation mechanisms to incentivize environmentally friendly operators, cultivate exemplary models with demonstration effects, and realize the market-oriented transformation of resource value.
(3)
For economically underdeveloped regions, it is essential to strengthen the development foundation and unlock resource potential. Specifically, dedicated development funds could be established to support the construction of cold-chain logistics, water-based transportation, and tourism-related infrastructure. Meanwhile, vocational training and financial support should be provided to enhance the management and service capabilities of practitioners and increase the level of industrial organization. Additionally, for eligible regions, pilot projects for integrated “fishery–tourism” industrial clusters should be launched to promote the deep integration of the primary, secondary, and tertiary sectors. This would foster a development pattern characterized by the synergy of resource-based stimulation, industry-driven development, and market-oriented expansion.
(4)
In contrast, economically developed regions should focus on consumption upgrading and promote business model innovation. Policy priorities should shift toward optimizing product structures and enhancing consumer experiences. In this context, efforts should be made to cultivate customized, high-value-added fishery experience products that cater to increasingly diversified consumer demands. Meanwhile, the incorporation of recreational fisheries into culture, technology, healthcare, and other sectors should be promoted to explore new formats such as “smart fishery + cultural experience”. Based on a comprehensive understanding of regional differences, it is advisable to build regional brand clusters and foster cross-regional collaboration to develop “urban-suburban fishery-tourism zones” or “coastal ecological experience belts”, thereby enhancing the overall industrial influence and spillover effects.

Author Contributions

Conceptualization, Y.C. and L.C.; methodology, Y.C.; software, L.C.; validation, Y.C. and L.C.; investigation, L.C.; resources, Y.C.; data curation, L.C.; writing—original draft preparation, Y.C.; writing—review and editing, Y.C. and L.C.; supervision, L.C.; visualization, Y.C. and L.C. All authors have read and agreed to the published version of the manuscript.

Funding

This research was funded by the Shanghai Fisheries Economics Research Association Project, “Agricultural Heritage and Rural Revitalization—A Case Study of Qingtian Rice–Fish Culture” (SHYJYJH-B-202408).

Institutional Review Board Statement

Not applicable.

Informed Consent Statement

Not applicable.

Data Availability Statement

The data presented in this study are available upon request from the corresponding authors.

Conflicts of Interest

The authors declare no conflicts of interest.

References

  1. Ping, Y. Planning and Design of Leisure Fisheries. Fish. Mod. 2004, 2, 3. [Google Scholar]
  2. Ministry of Agriculture and Rural Affairs. The 13th Five-Year Plan for National Fishery Development. Available online: http://www.moa.gov.cn/nybgb/2017/derq/201712/t20171227_6131208.htm (accessed on 22 May 2025).
  3. Ministry of Agriculture and Rural Affairs. Ministry of Agriculture and Rural Affairs Issues the 14th Five-Year Plan for National Fishery Development. Available online: http://www.yyj.moa.gov.cn/gzdt/202201/t20220107_6386443.htm (accessed on 22 May 2025).
  4. Ministry of Agriculture and Rural Affairs. Shandong Provincial Department of Agriculture and Rural Affairs Issues the Administrative Measures for Recreational Fisheries in Shandong Province. Available online: http://www.yyj.moa.gov.cn/dfqk/202411/t20241129_6467173.htm (accessed on 22 May 2025).
  5. Yang, Z.J.; Chen, Y.S.; Wang, D.C.; Liu, L.T.; Liu, C.; Hughes, R.M.; Liu, Y.D. Responsible recreational fisheries: A Chinese perspective. Fisheries 2017, 42, 303–307. [Google Scholar] [CrossRef]
  6. China Society of Fisheries. China Leisure Fisheries Development Monitoring Report. China Fish 2024, 10, 18–22. [Google Scholar]
  7. Zhao, Q.L.; Chen, X.J.; Chen, G.Y.; Qi, S.Q. Understanding the development of recreational fisheries with an industry competitiveness framework: Evaluation of a case study from China. Mar. Policy 2022, 137, 105121. [Google Scholar] [CrossRef]
  8. Chen, X.Z.; Liu, C. Research on strategies to promote the healthy development of leisure fisheries in China. China Fish 2015, 2, 32–36. [Google Scholar]
  9. Bao, T.L.; Wang, C.; Wang, T.L. Definition of the connotation of recreational fisheries and analysis of its market characteristics. Fish. Econ. Res. 2008, 3, 44–50. [Google Scholar]
  10. Cai, X.L. The current status and prospects of leisure fisheries in China. Fish. Mod. 2005, 1, 5–6. [Google Scholar]
  11. Chen, S.X. Current Situation of Recreational Fisheries in the United States. J. Beijing Fish. 2005, 1, 8–11. [Google Scholar]
  12. Zhang, G.H. The current situation and development strategies of leisure fisheries in China. Changjiang Univ. J. Nat. Sci. Ed. 2005, 8, 98–102. [Google Scholar]
  13. Guo, M. Developing leisure fisheries and promoting the construction of new fishing villages. Shandong Fish. 2006, 5, 45–46. [Google Scholar]
  14. Dong, Z.W.; Yang, Y.L. Research on the development path of leisure fisheries from the perspective of industrial integration. Chin. Fish. Econ. 2014, 32, 129–134. [Google Scholar]
  15. Zhao, Q.L.; Chen, X.J.; Chen, G.Y.; Qi, S.Q. The socioeconomic contribution of the recreational fishery based on input–output analysis: The case of China. Mar. Policy 2022, 138, 105177. [Google Scholar] [CrossRef]
  16. Le, J.H.; Fan, X.Z. Regional differences in the impact of labor force increments on the output value of leisure fisheries: An empirical test based on a varying coefficient model with 28 variables. Chin. Fish. Econ. 2019, 37, 30–39. [Google Scholar]
  17. Liu, H.X. The development status and strategic research of leisure fisheries in China from the perspective of rural revitalization. Rural Econ. Technol. 2020, 31, 76–78. [Google Scholar]
  18. Shih, C.H.; Wang, X.R.; Lu, Y.M.; Chu, T.J. Assessing the role of policy in the evolution of recreational fisheries in Chinese fishing villages: An AHP and Delphi analysis. Fishes 2024, 9, 353. [Google Scholar] [CrossRef]
  19. Zhang, J.; Zheng, J.M.; Duan, Y.C.; Gao, C.H. Research on the integrated development of leisure fisheries and traditional fisheries in China from the supply and demand perspective. Syst. Eng. Theory Pract. 2024, 44, 3079–3090. [Google Scholar]
  20. Zhang, D.X.; Zhou, Q. Empowering the Ice and Snow Sports Industry with Digital Technology: Driving Forces, Application Value, and Promotion Strategies. Sports Cult. Guide 2022, 11, 69–75. [Google Scholar]
  21. Zhang, Y.H. A Study on the Driving Mechanisms of County Urbanization from the Perspective of Generational Transformation. Chin. Youth Res. 2024, 7, 5–14. [Google Scholar]
  22. Weng, Y.J.; Yang, Y.; Wen, Y.B.; Du, L. Evaluation and Driving Mechanisms of Green Transformation in Mountainous Counties of Zhejiang Province. J. Earth Sci. Environ. 2024, 46, 470–485. [Google Scholar]
  23. Zhang, C.; Li, T. Driving Forces and Pathways of the Reproduction of Cultural Performance Products in the Tourism Industry. J. Sichuan Norm. Univ. (Soc. Sci. Ed.) 2022, 49, 89–96. [Google Scholar]
  24. Wang, K.; Guo, X.; Ye, J.; Gan, C. Spatiotemporal Characteristics and Influencing Factors of High-Quality Tourism Development in China. World Reg. Stud. 2023, 32, 104–117. [Google Scholar]
  25. Yin, Y. Digital Development of Rural Tourism: Driving Mechanisms, Logical Dimensions, and Conflict Resolution. J. Xi’an Univ. Financ. Econ. 2023, 36, 29–40. [Google Scholar]
  26. Cooke, S.J.; Cowx, I.G. The role of recreational fishing in global fish crises. Bioscience 2004, 54, 857–859. [Google Scholar] [CrossRef]
  27. Veiga, P.; Ribeiro, J.; Gonçalves, J.M.S.; Erzini, K. Quantifying recreational shore angling catch and harvest in southern Portugal (north-east Atlantic Ocean): Implications for conservation and integrated fisheries management. J. Fish Biol. 2010, 76, 2216–2237. [Google Scholar] [CrossRef] [PubMed]
  28. Arlinghaus, R.; Cooke, S.J. Recreational fisheries: Socioeconomic importance, conservation issues and management challenges. In Recreational Hunting, Conservation and Rural Livelihoods; Dickson, B., Hutton, J., Adams, W.M., Eds.; Blackwell Publishing: Oxford, UK, 2009; pp. 39–58. [Google Scholar]
  29. Arlinghaus, R.; Alós, J.; Beardmore, B.; Daedlow, K.; Dorow, M.; Fujitani, M.; Hühn, D.; Haider, W.; Hunt, L.M.; Johnson, B.M.; et al. Understanding and managing freshwater recreational fisheries as complex adaptive social-ecological systems. Rev. Fish. Sci. Aquac. 2017, 25, 1–41. [Google Scholar] [CrossRef]
  30. Fowler, A.M.; Dowling, N.A.; Lyle, J.M.; Alós, J.; Anderson, L.E.; Cooke, S.J.; Danylchuk, A.J.; Ferter, K.; Folpp, H.; Hutt, C.; et al. Toward sustainable harvest strategies for marine fisheries that include recreational fishing. Fish Fish. 2023, 24, 1003–1019. [Google Scholar] [CrossRef]
  31. Ryan, K.L.; Syers, C.; Holtom, K.; Green, T.; Lyle, J.M.; Stark, K.E.; Tracey, S.R. Recreational fishers’ attitudes to fisheries management and compliance. Mar. Policy 2025, 172, 106483. [Google Scholar] [CrossRef]
  32. Arostegui, M.C.; Anderson, C.M.; Benedict, R.F.; Dailey, C.; Fiorenza, E.A.; Jahn, A.R. Approaches to regulating recreational fisheries: Balancing biology with angler satisfaction. Rev. Fish Biol. Fish. 2021, 31, 573–598. [Google Scholar] [CrossRef]
  33. Brownscombe, J.W.; Hyder, K.; Potts, W.; Wilson, K.L.; Pope, K.L.; Danylchuk, A.J.; Cooke, S.J.; Clarke, A.; Arlinghaus, R.; Post, J.R. The future of recreational fisheries: Advances in science, monitoring, management, and practice. Fish. Res. 2019, 211, 247–255. [Google Scholar] [CrossRef]
  34. Klevtsova, M.; Vertakova, Y.; Polozhentseva, Y. Analysis of the development of the industrial sector in the context of global transformation. SHS Web Conf. 2021, 92, 9. [Google Scholar] [CrossRef]
  35. Ndubuisi, G.; Owusu, S.; Asiama, R.; Avenyo, E. Drivers of Services Sector Growth Acceleration in Developing Countries; WIDER Working Paper Series 2023, 2023/87; UNU-WIDER: Helsinki, Finland, 2023. [Google Scholar]
  36. Sakita, B.M.; Helgheim, B.I.; Bråthen, S. Drivers, barriers, and enablers of digital transformation in maritime ports sector. In Digital Transformation in Maritime and City Logistics; Springer: Cham, Switzerland, 2023; pp. 3–33. [Google Scholar]
  37. Kvam, G.T.; Stræte, E.P. Innovation and diffusion—Different roles in developing nature-based tourism. Open Soc. Sci. J. 2010, 3, 30–40. [Google Scholar] [CrossRef]
  38. Tan, K.G.; Tandon, A.; Xie, T. Causal drivers of international tourism industry in Tamil Nadu: A Geweke causality analysis. Int. J. Indian Cult. Bus. Manag. 2017, 15, 38–57. [Google Scholar] [CrossRef]
  39. Hosseini, S.P.; Hosseini, S.M. Efficiency assessment of tourism industry in developing countries in the context of infrastructure: A two-stage super-efficiency SBM. Open J. Soc. Sci. 2021, 9, 346–372. [Google Scholar]
  40. Yang, C.Y.; Yang, J.Y.; Huang, J.; You, B.Y.; Hong, H.Z. An investigation of technological innovation and tourism industrial structure upgrading as drivers of tourism economic growth. Int. J. Tour. Res. 2024, 26, e2687. [Google Scholar] [CrossRef]
  41. Baron, R.M.; Kenny, D.A. The moderator-mediator variable distinction in social psychological research: Conceptual, strategic, and statistical considerations. J. Pers. Soc. Psychol. 1986, 51, 1173–1182. [Google Scholar] [CrossRef] [PubMed]
  42. Stock, J.H.; Watson, M.W. Forecasting using principal components from a large number of predictors. J. Am. Stat. Assoc. 2002, 97, 1167–1179. [Google Scholar] [CrossRef]
  43. Liu, N.Q.; Hu, Y.Q.; Zhou, M.J.; Zhang, H.W. Regional integration and intra-city regional income disparity: Evidence from prefecture-level cities in the Yangtze River Delta Region. Rev. Econ. Manag. 2023, 39, 14–29. [Google Scholar]
  44. Wooldridge, J.M. Introductory Econometrics: A Modern Approach, 7th ed.; Cengage Learning: Boston, MA, USA, 2019. [Google Scholar]
Figure 1. Chinese mainland’s recreational fishery output, growth rate, and fishery economic growth, 2005−2023 (Data source: China Fishery Statistical Yearbook (2006−2024)).
Sustainability 17 06440 g001
Figure 2. Coastal recreational fishery output and growth in the Chinese mainland, 2005−2023 (Data source: China Fishery Statistical Yearbook (2006−2024)).
Sustainability 17 06440 g002
Figure 3. Log−transformed growth trends of recreational fisheries output in coastal regions of the Chinese mainland, 2005−2023 (Data source: China Fishery Statistical Yearbook (2006−2024)).
Sustainability 17 06440 g003
Figure 4. Pathways between market demand, tertiary industry share, and recreational fisheries output.
Sustainability 17 06440 g004
Table 1. Evolution of national policies on fishery development in China.
Date of IssuancePolicy DocumentSignificance
2006.11National Fishery Development Plan for the 11th Five-Year Plan Period (2006–2010)Served as a guiding document for China’s fishery development during the 11th Five-Year Plan period.
2016.12National Fishery Development Plan for the 13th Five-Year Plan Period (2016–2020)Included recreational fisheries among the five major fishery sectors and promoted integration with the primary, secondary, and tertiary industries, forming the basic framework of the modern fishery industry system.
2021.1214th Five-Year National Fishery Development PlanAimed to achieve basic fishery modernization by 2035.
2024.12Opinions of the Ministry of Agriculture and Rural Affairs on Further Strengthening the Management of Recreational Angling in the Yangtze River BasinProposed improving the regulatory system for recreational angling in areas where fishing is banned to meet public demand for safe and regulated recreational fishing.
Table 3. Overview of variables and their summary statistics.
Variable
Type
Variable
Abbreviation
Variable MeaningObserved
Value
Average
Value
Standard
Deviation
Minimum
Value
Maximum
Value
Dependent
variable
ln Y The logarithm of the total output value of recreational fisheries2091.8251.970−4.9485.676
Explanatory
variables
ln ( f i s h i n g ) The logarithm of the annual fishery catch20913.1391.6119.16915.060
m a r k e t _ d e m a n d Market demand
composite index
2094.25 × 10−90.896−2.2022.069
Intermediary
variable
i n d u s t r y Tertiary industry share2090.4890.0870.3250.752
Control
variables
g d p _ g r o w t h The logarithmic
difference in GDP
1980.1050.0490.0030.232
r o a d _ d e n s i t y Road density (kilometers per square kilometer)2091.0980.4420.2612.438
u r b a n Proportion of urban population to total resident population2090.6380.1360.3360.896
Due to the requirement of lagged data for calculating GDP growth rate, data for the year 2005—used as the starting point of the sample—cannot generate a valid growth rate, resulting in a reduction of 11 effective observations. When the missing data mechanism is exogenous (e.g., caused by lagged calculations), directly deleting the missing values does not lead to estimation bias (Wooldridge, 2019) [44]. Therefore, the sample size used in subsequent analyses is 198.
Table 4. Benchmark test of the driving forces of the recreational fishery industry.
Variable ln Y
Model IModel IIModel IIIModel IV
ln ( f i s h i n g ) 0.507 ***
(0.0655)
0.768 ***
(0.1648)
0.179 *
(0.1034)
0.142 *
(0.0120)
m a r k e t _ d e m a n d 0.985 ***
(0.1178)
0.610 **
(0.2320)
0.230 **
(0.0910)
0.575 ***
(0.1200)
g d p _ g r o w t h −14.580 ***
(2.7449)
−6.828 ***
(2.0131)
−2.851
(1.8078)
r o a d _ d e n s i t y 1.325
(0.8506)
2.995 **
(1.4019)
2.648 *
(1.4244)
u r b a n 0.232 *
(2.7362)
3.579 **
(1.6448)
−3.119
(2.9952)
Constant −4.834 ***
(0.8675)
−8.280 **
(2.8867)
−5.388 **
(2.1907)
0.801
(1.5366)
Individual fixed effectsNoNoNoYes
Time fixed effectsNoNoNoYes
Observations209198198198
R 2 0.41610.66860.73050.7932
Note: T-statistics are reported in parentheses. *, **, and *** denote significance at the 10%, 5%, and 1% levels, respectively.
Table 5. The regional grouping results of the 11 coastal regions in the Chinese mainland.
Grouping DimensionRegions Included
Low ResourceTianjin, Hebei, Liaoning, Shanghai, Jiangsu, Guangxi
High ResourceZhejiang, Shandong, Fujian, Guangdong, Hainan
Low EconomicTianjin, Hebei, Liaoning, Fujian, Guangxi, Hainan
High EconomicShanghai, Jiangsu, Zhejiang, Shandong, Guangdong
Table 6. Regional heterogeneity analysis of the driving forces behind recreational fishery development.
Variable ln Y
Low-Resource
Regions
High-Resource
Regions
Low-Economic-Level RegionsHigh-Economic-Level Regions
ln ( f i s h i n g ) 0.369 *
(0.1365)
0.253 *
(0.1351)
0.601 ***
(0.1035)
0.039
(0.0894)
m a r k e t _ d e m a n d 0.505 ***
(0.1962)
0.421
(0.2578)
0.481 ***
(0.1707)
0.527 **
(0.2204)
g d p _ g r o w t h −1.823
(2.2482)
−3.795
(2.7138)
−3.027
(2.0287)
−2.271
(3.0878)
r o a d _ d e n s i t y −0.899 **
(0.3734)
3.771 ***
(0.5030)
4.110 ***
(0.8973)
−0.039
(0.3279)
u r b a n 0.014
(1.4779)
2.109
(3.9485)
−2.970 **
(1.3810)
−13.428 ***
(1.7181)
Constant −4.966 **
(2.3728)
−6.697 **
(2.7383)
−7.244 ***
(1.6331)
9.091 ***
(2.1458)
Time fixed
effects
YesYesYesYes
Observations1089010890
R 2 0.51660.85090.69910.7802
Note: T-statistics are reported in parentheses. *, **, and *** denote significance at the 10%, 5%, and 1% levels, respectively.
Table 7. Subsample regression results for contrasting regional combinations.
Variable ln Y
High Resource–Low Economic LevelLow Resource–High Economic Level
ln ( f i s h i n g ) 1.520 ***
(0.3527)
0.794
(0.5603)
m a r k e t _ d e m a n d 0.096
(0.0972)
0.216 ***
(0.0777)
g d p _ g r o w t h −3.061 *
(1.5922)
−19.543 **
(3.0837)
r o a d _ d e n s i t y 5.720 ***
(0.2192)
−0.735
(1.0072)
u r b a n 0.0452 ***
(0.0102)
−0.069
(0.1047)
Constant −27.315 ***
(4.4847)
1.249
(0.0130)
Time fixed
effects
YesYes
Observations3838
R 2 0.90520.8701
Note: T-statistics are reported in parentheses. *, **, and *** denote significance at the 10%, 5%, and 1% levels, respectively.
Table 8. The mediating effect of market demand on recreational fisheries.
Variable ln Y i n d u s t r y ln Y
Model V Model VIModel VII
i n d u s t r y 1.188 *
(0.0386)
m a r k e t _ d e m a n d 0.575 ***
(0.1200)
0.775 **
(0.0468)
0.566 ***
(0.0124)
ln ( f i s h i n g ) 0.142 *
(0.0120)
−0.015 **
(0.0051)
0.046 *
(0.0141)
g d p _ g r o w t h −2.851
(1.8078)
−0.034
(0.0078)
−2.892
(0.1912)
r o a d _ d e n s i t y 2.648 *
(1.4244)
0.103 **
(0.0349)
2.770
(0.1645)
u r b a n −3.119
(2.9952)
−0.193
(0.1247)
−3.348
(0.3373)
Constant 0.801
(1.5366)
0.630 ***
(0.1102)
1.550
(0.1949)
Time fixed effectsYesYesYes
Individual fixed effectsYesYesYes
Observations198198198
R 2 0.79320.94540.7935
Note: T-statistics are reported in parentheses. *, **, and *** denote significance at the 10%, 5%, and 1% levels, respectively.
Table 9. Robustness test.
Variable ln Y
WinsorizationSample Range Adjustment
ln ( f i s h i n g ) 0.272 *
(0.0167)
0.133 **
(0.0154)
m a r k e t _ d e m a n d 0.551 ***
(0.0128)
0.510 *
(0.0253)
g d p _ g r o w t h −2.578
(0.1794)
−1.374
(0.2085)
r o a d _ d e n s i t y 3.442 **
(0.1359)
1.738 *
(0.1268)
u r b a n −2.664
(0.2889)
−1.694
(0.3076)
Constant −0.967
(0.1554)
2.013
(0.2476)
Individual fixed effectsYesYes
Time fixed effectsYesYes
Observation198154
R 2 0.81240.7650
Note: T-statistics are reported in parentheses. *, **, and *** denote significance at the 10%, 5%, and 1% levels, respectively.
Table 10. Summary of hypothesis test results.
Hypothesis NumberResearch HypothesisTest Result
H1Natural resource endowment exerts a significantly positive impact on the gross output value of recreational fisheries.Supported
H2Market demand positively contributes to the total output value of recreational fisheries.Supported
H3Market demand exerts a significant positive influence on the tertiary industry’s share, which, in turn, substantially enhances the output value of recreational fisheries. The share of the tertiary industry thereby functions as a key intermediary in this causal chain.Supported
H4aIn regions with abundant resource endowments, the development of recreational fisheries is more likely to rely on resource-driven pathways, whereas in regions with weaker resource endowments, development is more dependent on market demand.Supported
H4bIn regions with higher levels of economic development, recreational fisheries are more likely to grow rapidly through market-driven mechanisms, whereas in less developed regions, development is more likely to depend on natural resource endowments.Supported
Disclaimer/Publisher’s Note: The statements, opinions and data contained in all publications are solely those of the individual author(s) and contributor(s) and not of MDPI and/or the editor(s). MDPI and/or the editor(s) disclaim responsibility for any injury to people or property resulting from any ideas, methods, instructions or products referred to in the content.

