
An Italian Patent Multi-Label Classification System to Support the Innovation Demand and Supply Matching

 ,
,  ,
,  ,
,  ,
, 
Abstract
1. Introduction
- -
- They are paid services, not open access—often open innovation platforms;
- -
- They report the patent document as such, without a usable “translation” for all that facilitates matching;
- -
- The classification of the patent in a given technological area is a challenging task: users choose a category based on those proposed, but users often do not know how to choose the best, and it is not true that the proposed choices are necessarily the best.
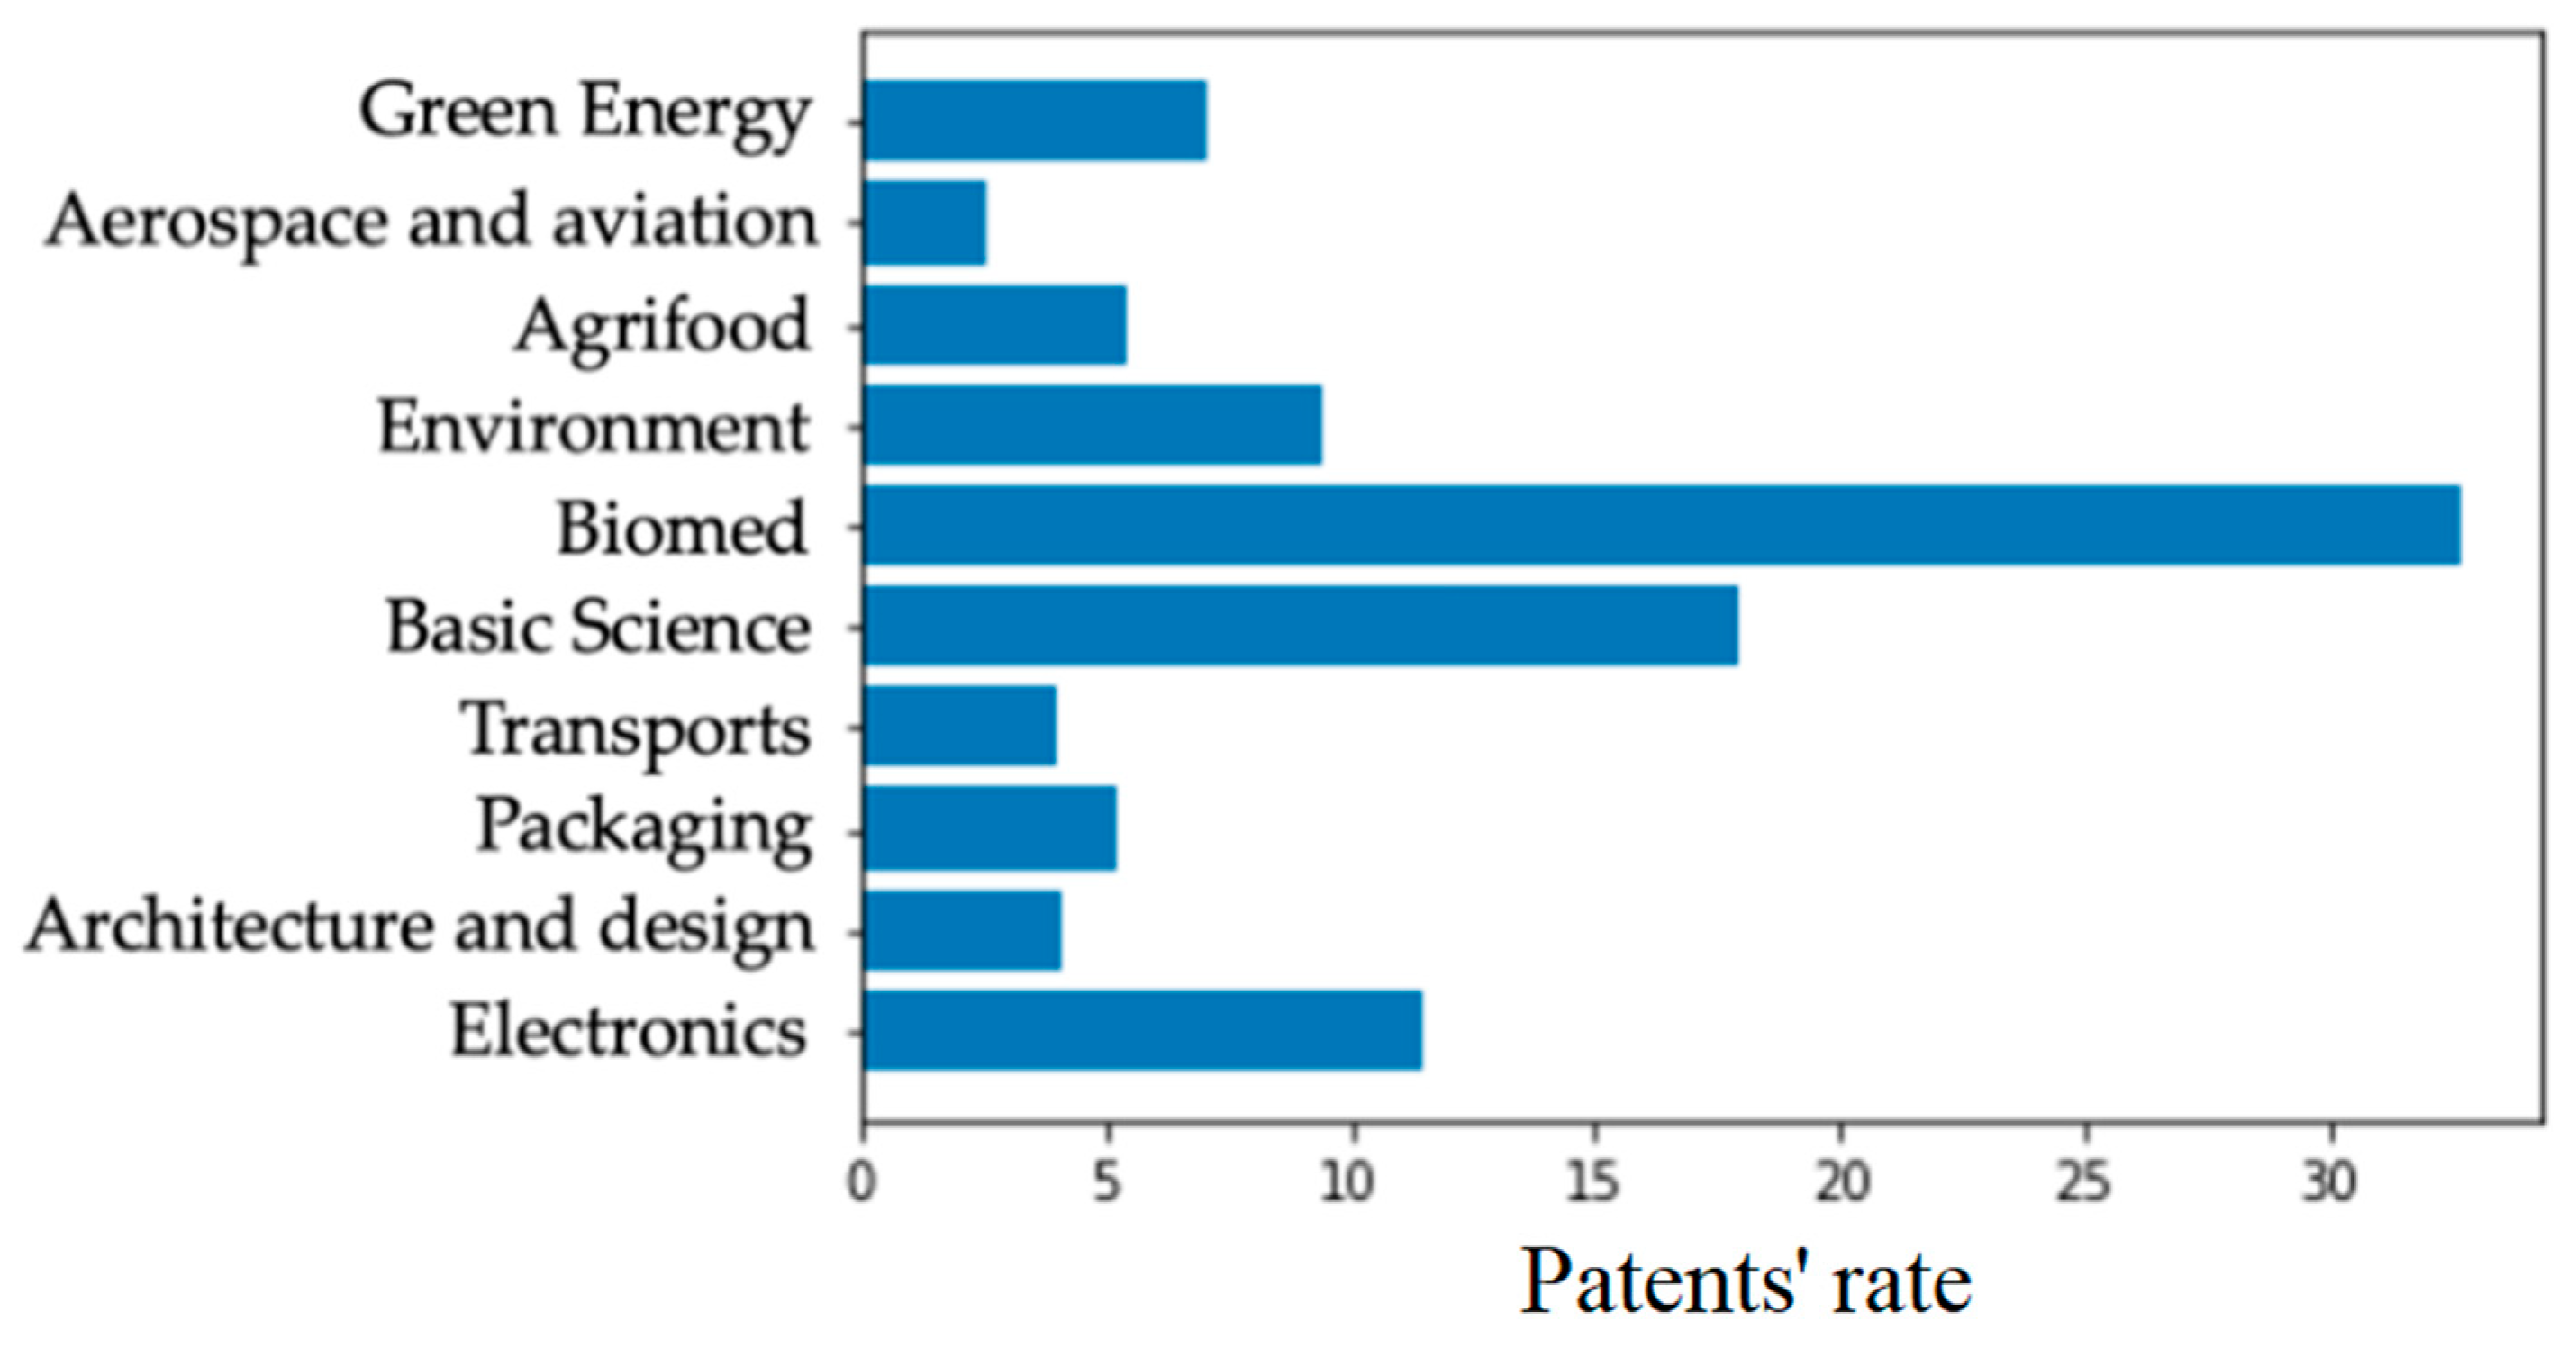
2. Materials
- Aerospace and aviation;
- Agrifood;
- Architecture and design;
- Chemistry, Physics, New materials and Workflows (Basic Science);
- Energy and Renewables (Green Energy);
- Environment and Constructions (Environment);
- Health and Biomedical (Biomed);
- Informatics, Electronics and Communication Systems (Electronics);
- Manufacturing and Packaging (Packaging);
- Transport.
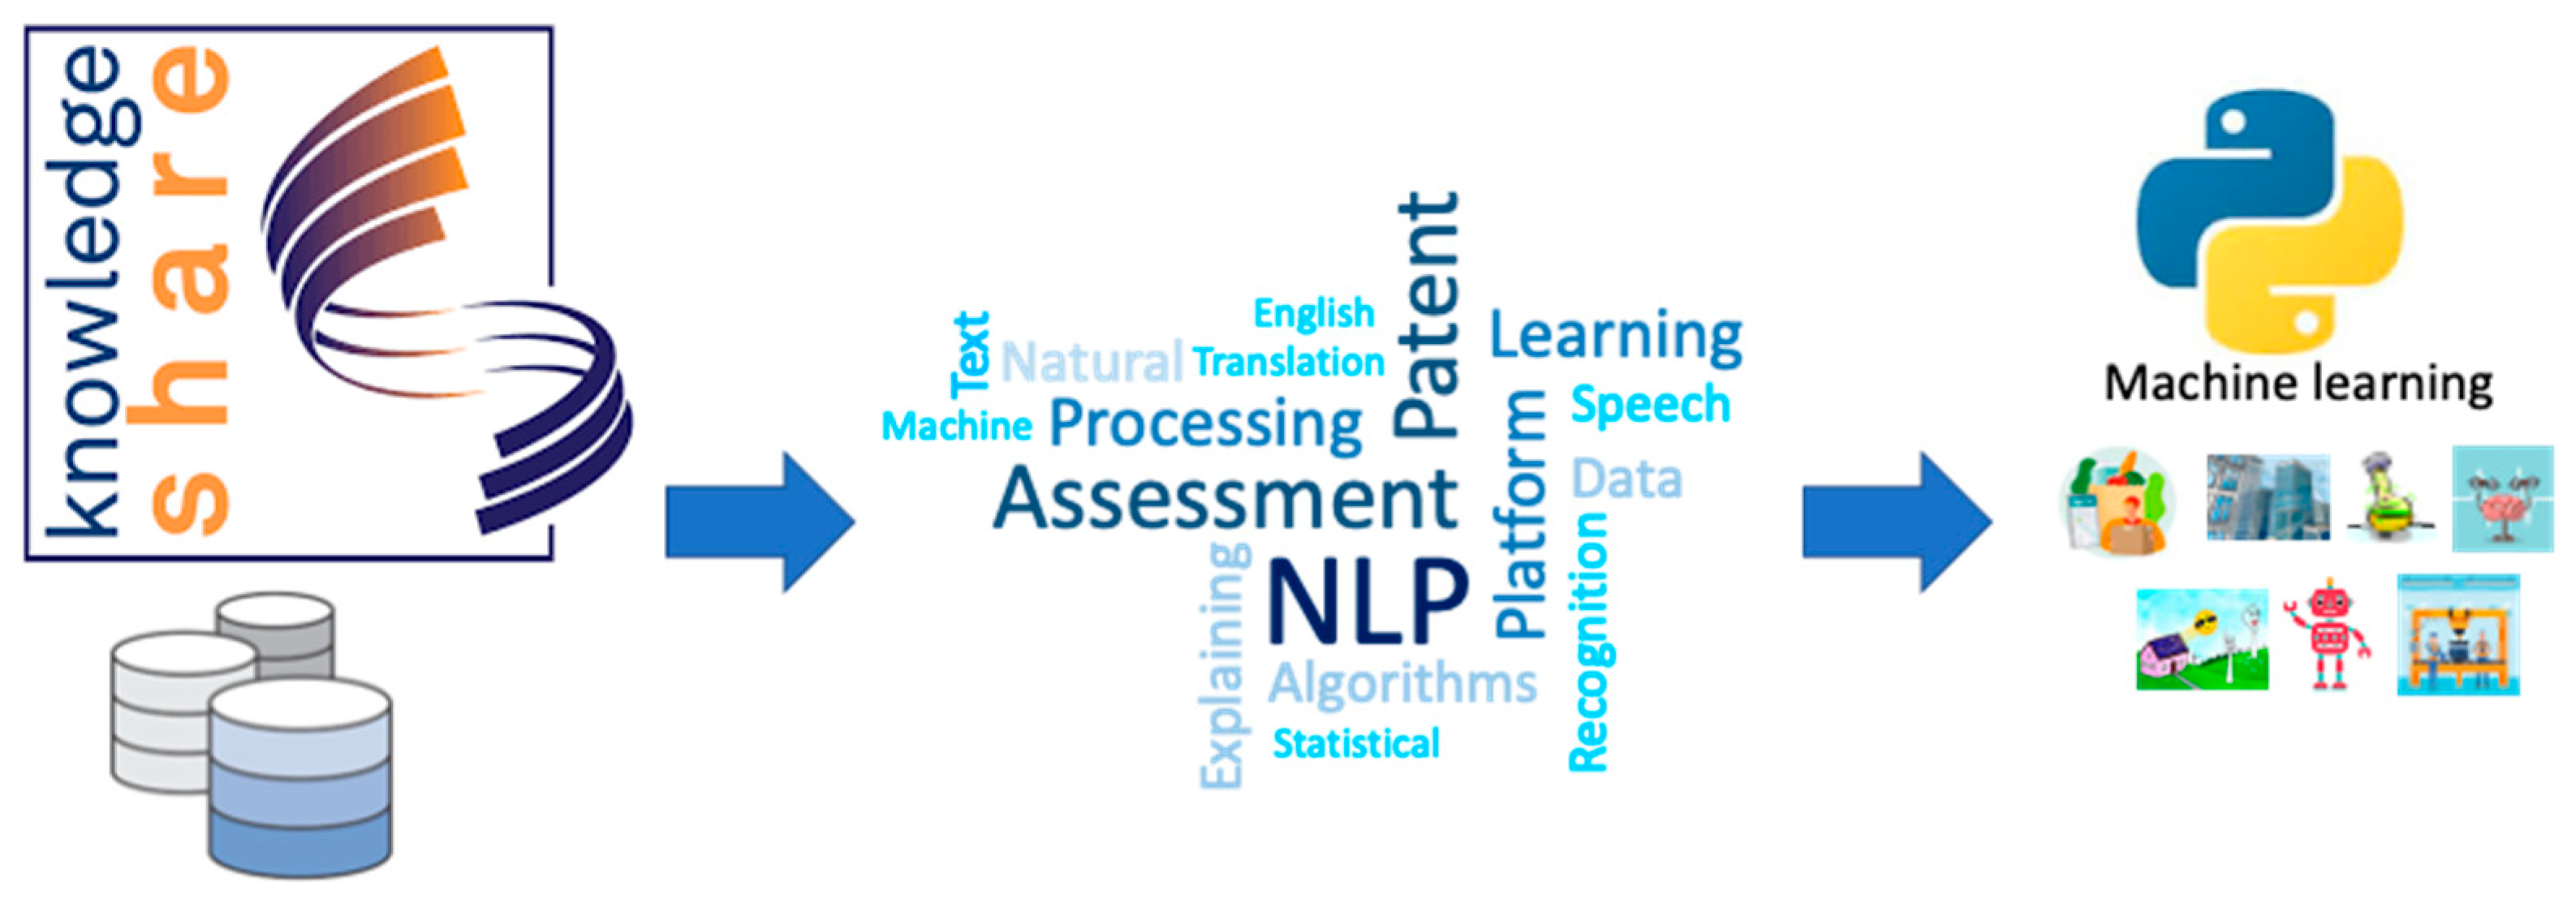
3. Methods
3.1. The Overall Flowchart
3.2. From Patents to Feature Representation
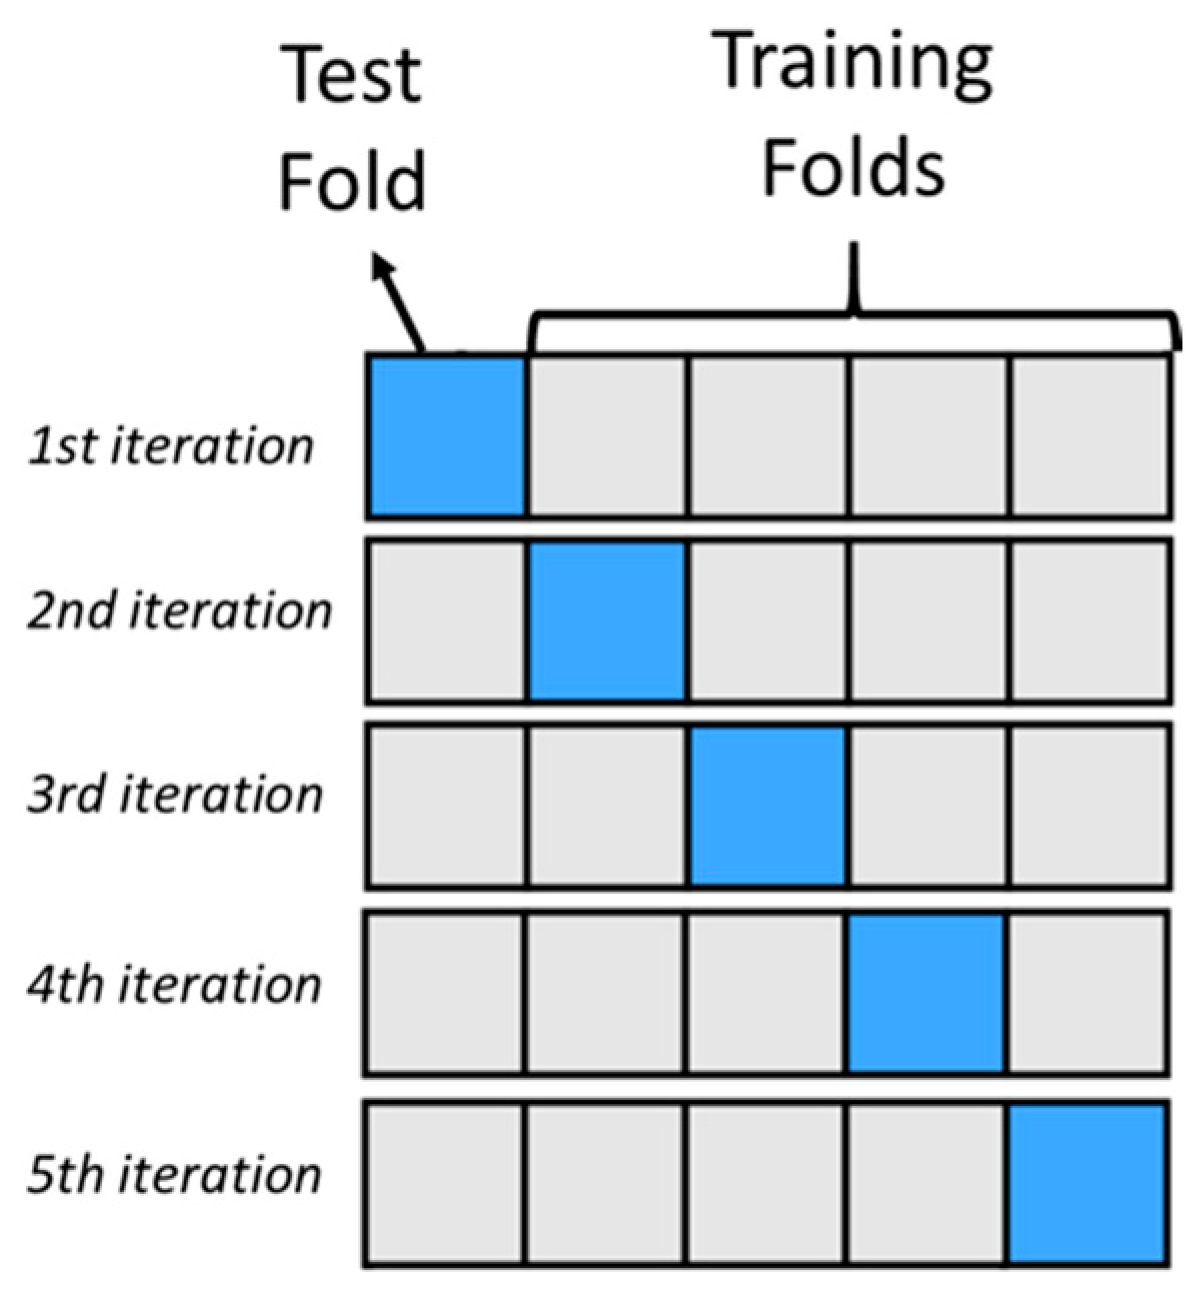
3.3. Patent Categorization as a Multi-Class Classification Problem
3.4. Mitigating Class Imbalance: SMOTE
4. Results
4.1. Top-k Performance Measures
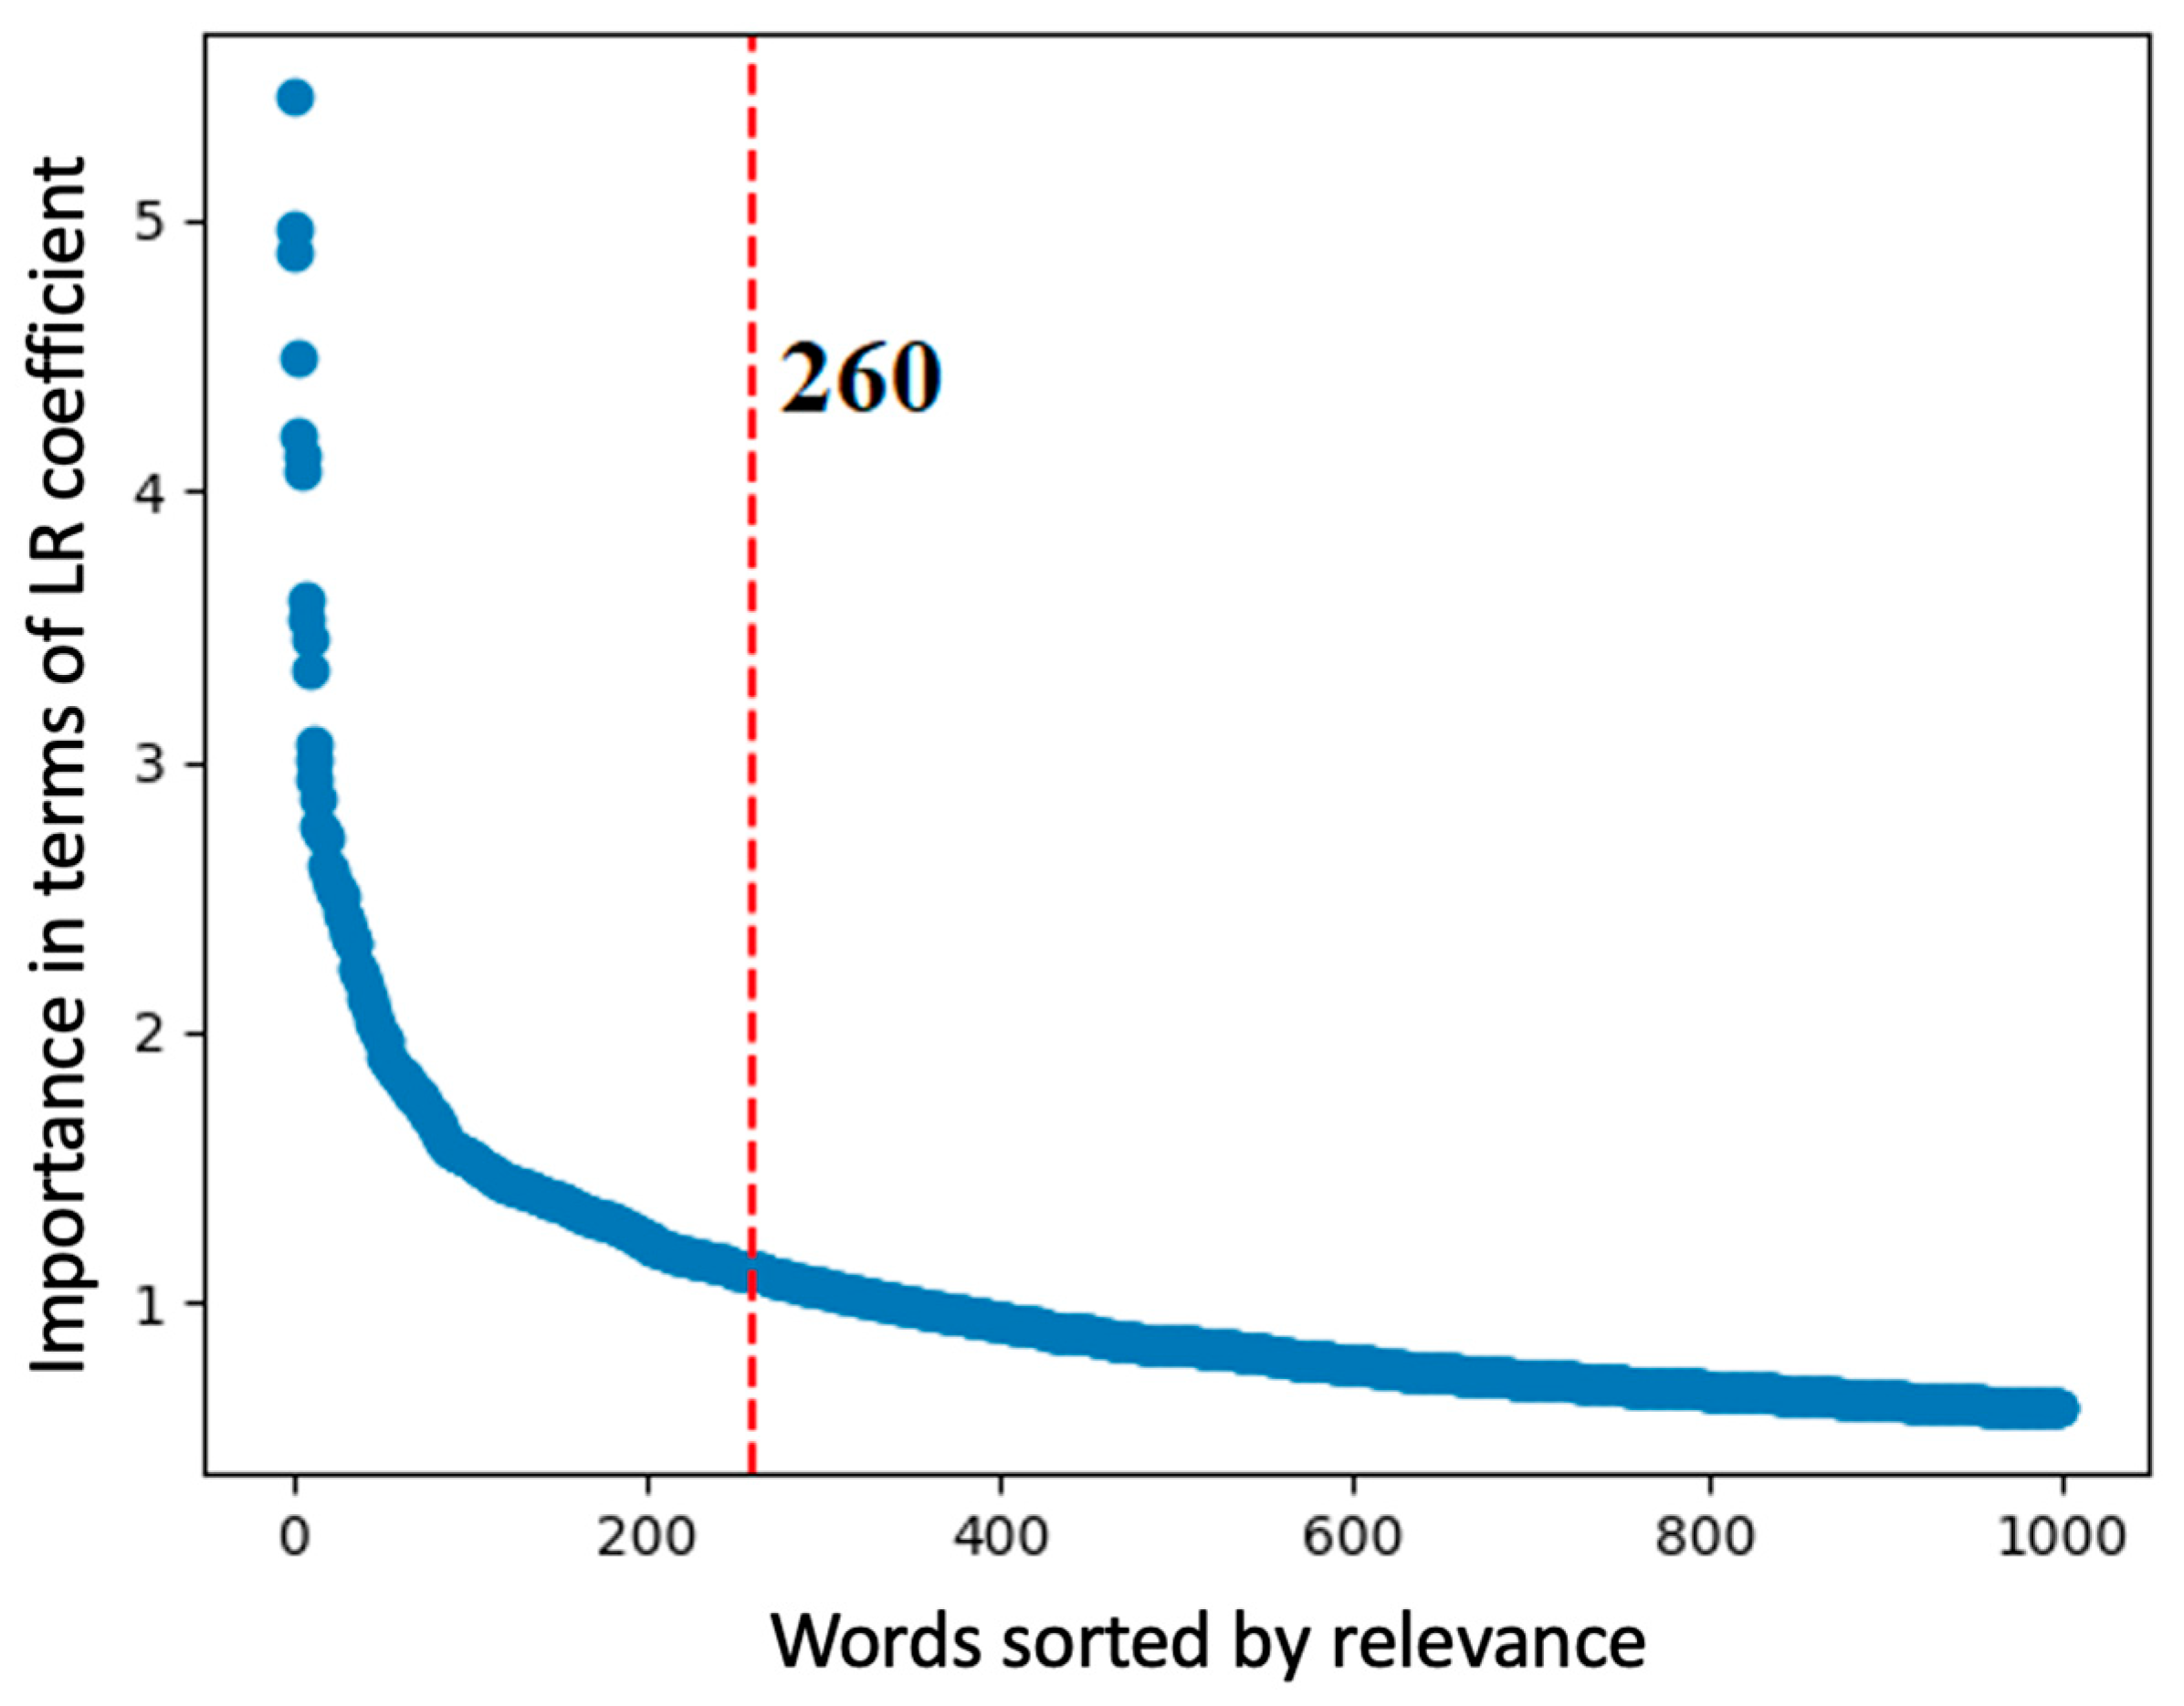
4.2. How Words Influence Patent Classification
4.3. Confounding Categories for the Best Classifier
5. Discussion
5.1. Best Method Performance
5.2. Categories’ Keywords and How They Explain the Confusion Frequencies
6. Conclusions
Author Contributions
Funding
Institutional Review Board Statement
Informed Consent Statement
Data Availability Statement
Acknowledgments
Conflicts of Interest
Appendix A

| Word | Category |
|---|---|
| food | Agrifood |
| energy | Green Energy |
| building | Environment |
| solar | Green Energy |
| heat | Green Energy |
| product | Agrifood |
| plant | Agrifood |
| patient | Biomed |
| cell | Biomed |
| battery | Green Energy |
| wine | Agrifood |
| water | Environment |
| electricity | Green Energy |
| construction | Environment |
| component | Packaging |
| oil | Agrifood |
| animal | Agrifood |
| user | Electronics |
| object | Packaging |
| material | Packaging |
| particle | Basic Science |
| extract | Agrifood |
| concrete | Environment |
| signal | Electronics |
| network | Electronics |
| information | Electronics |
| data | Electronics |
| photovoltaic | Green Energy |
| tissue | Biomed |
| power | Green Energy |
| thermal | Green Energy |
| fuel | Green Energy |
| packaging | Packaging |
| vegetable | Agrifood |
| gas | Green Energy |
| panel | Environment |
| milk | Agrifood |
| solvent | Basic Science |
| element | Environment |
| electrical | Green Energy |
| tumor | Biomed |
| seismic | Environment |
| communication | Electronics |
| circuit | Electronics |
| waste | Agrifood |
| piece | Packaging |
| optical | Electronics |
| machine | Packaging |
| olive | Agrifood |
| disease | Biomed |
| steel | Environment |
| farm | Agrifood |
| software | Electronics |
| device | Electronics |
| edible | Agrifood |
| liquid | Basic Science |
| chemical | Basic Science |
| blood | Biomed |
| network | Green Energy |
| fruit | Agrifood |
| tool | Packaging |
| structure | Environment |
| process | Basic Science |
| structural | Environment |
| material | Basic Science |
| flow | Green Energy |
| mechanical | Packaging |
| joint | Packaging |
| stiffness | Packaging |
| diagnosis | Biomed |
| electromagnetic | Electronics |
| paper | Packaging |
| bottle | Agrifood |
| metal | Basic Science |
| detector | Basic Science |
| surgical | Biomed |
| system | Green Energy |
| acid | Agrifood |
| image | Electronics |
| drug | Biomed |
| frame | Packaging |
| site | Environment |
| radar | Environment |
| human | Biomed |
| water | Green Energy |
| nanoparticles | Basic Science |
| polymer | Basic Science |
| package | Packaging |
| microorganism | Agrifood |
| environmental | Environment |
| air | Environment |
| wall | Environment |
| tag | Packaging |
| transmission | Electronics |
| pesticide | Agrifood |
| sensor | Environment |
| marine | Environment |
| content | Agrifood |
| generator | Green Energy |
| monitoring | Environment |
| sample | Basic Science |
| ion | Basic Science |
| exchanger | Green Energy |
| shaft | Packaging |
| reactor | Green Energy |
| stinger | Packaging |
| combustion | Green Energy |
| starch | Agrifood |
| high | Basic Science |
| polymeric | Packaging |
| lithium | Green Energy |
| robot | Packaging |
| system | Packaging |
| efficiency | Green Energy |
| mortar | Environment |
| clinical | Biomed |
| anchor | Environment |
| integrate | Packaging |
| laser | Packaging |
| force | Packaging |
| industrial | Packaging |
| invasive | Biomed |
| random | Electronics |
| remote | Electronics |
| treatment | Biomed |
| quantum | Electronics |
| rfid | Packaging |
| property | Basic Science |
| chain | Packaging |
| hand | Electronics |
| compound | Basic Science |
| diagnostic | Biomed |
| therapeutic | Biomed |
| part | Packaging |
| coli | Agrifood |
| limb | Packaging |
| hydrogen | Green Energy |
| defect | Packaging |
| microalgae | Agrifood |
| ph | Basic Science |
| code | Electronics |
| ceramic | Basic Science |
| grid | Green Energy |
| color | Agrifood |
| printing | Packaging |
| strain | Agrifood |
| maintenance | Environment |
| drone | Electronics |
| pathology | Biomed |
| screw | Packaging |
| bone | Biomed |
| antenna | Electronics |
| fiber | Packaging |
| mushroom | Agrifood |
| test | Environment |
| position | Electronics |
| gene | Biomed |
| composite | Basic Science |
| ultrasound | Biomed |
| cancer | Biomed |
| flight | Packaging |
| generation | Green Energy |
| wearable | Environment |
| sludge | Environment |
| manufacturing | Packaging |
| automotive | Packaging |
| module | Electronics |
| orchard | Agrifood |
| fat | Agrifood |
| therapy | Biomed |
| tunnel | Green Energy |
| cycle | Green Energy |
| mode | Electronics |
| surface | Basic Science |
| inspection | Environment |
| field | Basic Science |
| brain | Biomed |
| load | Environment |
| electronic | Electronics |
| tanning | Packaging |
| cell | Green Energy |
| beam | Basic Science |
| air | Green Energy |
| event | Electronics |
| produce | Green Energy |
| fiber | Basic Science |
| enzyme | Basic Science |
| membrane | Basic Science |
| system | Electronics |
| precursor | Basic Science |
| surgery | Biomed |
| polymer | Packaging |
| conversion | Green Energy |
| biomass | Green Energy |
| oxygen | Packaging |
| seed | Agrifood |
| syngas | Green Energy |
| gripping | Packaging |
| kinematic | Packaging |
| hot | Packaging |
| algorithm | Electronics |
| biomass | Agrifood |
| turbine | Green Energy |
| emission | Environment |
| material | Environment |
| virtual | Electronics |
| molecule | Biomed |
| production | Agrifood |
| cement | Environment |
| additive | Packaging |
| output | Electronics |
| good | Agrifood |
| risk | Biomed |
| environmental | Agrifood |
| cheese | Agrifood |
| natural | Agrifood |
| steam | Green Energy |
| biodegradable | Packaging |
| infection | Biomed |
| polyurethane | Packaging |
| graph | Electronics |
| bit | Electroncis |
| constraint | Packaging |
| connect | Green Energy |
| heart | Biomed |
| recovery | Environment |
| area | Electronics |
| ground | Environment |
| critical | Packaging |
| receive | Electronics |
| model | Electronics |
| traditional | Environment |
| insert | Packaging |
| activity | Biomed |
| radio | Electronics |
| stereolithography | Packaging |
| mean | Environment |
| automatic | Environment |
| treatment | Basic Science |
| implement | Electronics |
| capable | Packaging |
| pack | Green Energy |
| hmd | Packaging |
| characteristic | Agrifood |
| foam | Basic Science |
| conductive | Packaging |
| reaction | Basic Science |
| electric | Packaging |
| specific | Biomed |
| voltage | Green Energy |
| reactor | Basic Science |
| vitro | Biomed |
| noise | Electronics |
| soil | Agrifood |
| arm | Packaging |
| circular | Packaging |
| plenoptic | Basic Science |
| reinforcement | Environment |
| radiation | Basic Science |
| roof | Environment |
Appendix B
References
- Council Recommendation on the Guiding Principles for Knowledge Valorisation, 2022 Interinstitutional File: 2022/0233(NLE). Available online: https://eur-lex.europa.eu/eli/reco/2022/2415/oj/eng (accessed on 15 May 2023).
- EU Valorization Policy. 2020. Available online: https://research-and-innovation.ec.europa.eu/system/files/2020-03/ec_rtd_valorisation_factsheet.pdf (accessed on 16 May 2023).
- Trappey, A.; Trappey, C.V.; Hsieh, A. An intelligent patent recommender adopting machine learning approach for natural language processing: A case study for smart machinery technology mining. Technol. Forecast. Soc. Change 2021, 164, 120511. [Google Scholar] [CrossRef]
- Lybbert, T.J.; Zolas, N.J. Getting patents and economic data to speak to each other: An ‘algorithmic links with probabilities’ approach for joint analyses of patenting and economic activity. Res. Policy 2014, 43, 530–542. [Google Scholar] [CrossRef]
- Asche, G. “80% of technical information found only in patents”—Is there proof of this? World Pat. Inf. 2017, 48, 16–28. [Google Scholar] [CrossRef]
- Giordano, V.; Chiarello, F.; Melluso, N.; Fantoni, G.; Bonaccorsi, A. Text and dynamic network analysis for measuring technological convergence: A case study on defense patent data. IEEE Trans. Eng. Manag. 2021, 70, 1490–1503. [Google Scholar] [CrossRef]
- Puccetti, G.; Giordano, V.; Spada, I.; Chiarello, F.; Fantoni, G. Technology identification from patent texts: A novel named entity recognition method. Technol. Forecast. Soc. Change 2023, 186, 122160. [Google Scholar] [CrossRef]
- Daim, T.U.; Rueda, G.; Martin, H.; Gerdsri, P. Forecasting emerging technologies: Use of bibliometrics and patent analysis. Technol. Forecast. Soc. Change 2006, 73, 981–1012. [Google Scholar] [CrossRef]
- Huang, Y.; Zhu, F.; Porter, A.L.; Zhang, Y.; Zhu, D.; Guo, Y. Exploring technology evolution pathways to facilitate technology management: From a technology life cycle perspective. IEEE Trans. Eng. Manag. 2020, 68, 1347–1359. [Google Scholar] [CrossRef]
- Altuntas, S.; Dereli, T.; Kusiak, A. Forecasting technology success based on patent data. Technol. Forecast. Soc. Change 2015, 96, 202–214. [Google Scholar] [CrossRef]
- Kim, G.; Bae, J. A novel approach to forecast promising technology through patent analysis. Technol. Forecast. Soc. Change 2017, 117, 228–237. [Google Scholar] [CrossRef]
- Kyebambe, M.N.; Cheng, G.; Huang, Y.; He, C.; Zhang, Z. Forecasting emerging technologies: A supervised learning approach through patent analysis. Technol. Forecast. Soc. Change 2017, 125, 236–244. [Google Scholar] [CrossRef]
- Karvonen, M.; Kässi, T. Patent citations as a tool for analysing the early stages of convergence. Technol. Forecast. Soc. Change 2013, 80, 1094–1107. [Google Scholar] [CrossRef]
- Abbas, A.; Zhang, L.; Khan, S.U. A literature review on the state-of-the-art in patent analysis. World Pat. Inf. 2014, 37, 3–13. [Google Scholar] [CrossRef]
- Ernst, H. Patent information for strategic technology management. World Pat. Inf. 2003, 25, 233–242. [Google Scholar] [CrossRef]
- Thorleuchter, D.; Van den Poel, D.; Prinzie, A. A compared R&D-based and patent-based cross impact analysis for identifying relationships between technologies. Technol. Forecast. Soc. Change 2010, 77, 1037–1050. [Google Scholar]
- Aristodemou, L.; Tietze, F. The state-of-the-art on Intellectual Property Analytics (IPA): A literature review on artificial intelligence, machine learning and deep learning methods for analysing intellectual property (IP) data. World Pat. Inf. 2018, 55, 37–51. [Google Scholar] [CrossRef]
- Tseng, F.M.; Hsieh, C.H.; Peng, Y.N.; Chu, Y.W. Using patent data to analyze trends and the technological strategies of the amorphous silicon thin-film solar cell industry. Technol. Forecast. Soc. Change 2011, 78, 332–345. [Google Scholar] [CrossRef]
- Trappey, A.J.; Chen, P.P.; Trappey, C.V.; Ma, L. A machine learning approach for solar power technology review and patent evolution analysis. Appl. Sci. 2019, 9, 1478. [Google Scholar] [CrossRef]
- Choi, Y.; Park, S.; Lee, S. Identifying emerging technologies to envision a future innovation ecosystem: A machine learning approach to patent data. Scientometrics 2021, 126, 5431–5476. [Google Scholar] [CrossRef]
- Yu, X.; Zhang, B. Obtaining advantages from technology revolution: A patent roadmap for competition analysis and strategy planning. Technol. Forecast. Soc. Change 2019, 145, 273–283. [Google Scholar] [CrossRef]
- Georgiou, K.; Mittas, N.; Ampatzoglou, A.; Chatzigeorgiou, A.; Angelis, L. Data-Oriented Software Development: The Industrial Landscape through Patent Analysis. Information 2023, 14, 4. [Google Scholar] [CrossRef]
- EPO. India and Europe Explore the Impact of Industry 4.0 on the Patent System; Technical Report; European Patent Office: Munich, Germany, 2016. [Google Scholar]
- Gubbi, J.; Buyya, R.; Marusic, S.; Palaniswami, M. Internet of Things (IoT): A vision, architectural elements, and future directions. Future Gener. Comput. Syst. 2013, 9, 1645–1660. [Google Scholar] [CrossRef]
- Günther, W.A.; Mehrizi, M.H.R.; Huysman, M.; Feldberg, F. Debating big data: A literature review on realizing value from big data. J. Strateg. Inf. Syst. 2017, 26, 191–209. [Google Scholar] [CrossRef]
- Intellectual Property Action Plan Implementation. 2022. Available online: https://single-market-economy.ec.europa.eu/industry/strategy/intellectual-property/intellectual-property-action-plan-implementation_en (accessed on 16 May 2023).
- Bellantuono, L.; Monaco, A.; Amoroso, N.; Aquaro, V.; Bardoscia, M.; Loiotile, A.D.; Lombardi, A.; Tangaro, S.; Bellotti, R. Territorial bias in university rankings: A complex network approach. Sci. Rep. 2022, 12, 4995. [Google Scholar] [CrossRef]
- Demarinis Loiotile, A.; De Nicolò, F.; Agrimi, A.; Bellantuono, L.; La Rocca, M.; Monaco, A.; Pantaleo, E.; Tangaro, S.; Amoroso, N.; Bellotti, R. Best Practices in Knowledge Transfer: Insights from Top Universities. Sustainability 2022, 14, 15427. [Google Scholar] [CrossRef]
- Hu, T.; Zhang, Y. A spatial–temporal network analysis of patent transfers from US universities to firms. Scientometrics 2021, 126, 27–54. [Google Scholar] [CrossRef]
- Deng, W.; Ma, J. A knowledge graph approach for recommending patents to companies. Electron. Commer. Res. 2021, 22, 1435–1466. [Google Scholar] [CrossRef]
- Chen, H.; Deng, W. Interpretable patent recommendation with knowledge graph and deep learning. Sci. Rep. 2023, 13, 2586. [Google Scholar] [CrossRef]
- Lee, J.S.; Park, J.H.; Bae, Z.T. The effects of licensing-in on innovative performance in different technological regimes. Res. Policy 2017, 46, 485–496. [Google Scholar] [CrossRef]
- Wang, Y.; Ning, L.; Chen, J. Product diversification through licensing: Empirical evidence from Chinese firms. Eur. Manag. J. 2014, 32, 577–586. [Google Scholar] [CrossRef]
- McDevitt, V.L.; Mendez-Hinds, J.; Winwood, D.; Nijhawan, V.; Sherer, T.; Ritter, J.F.; Sanberg, P.R. More than money: The exponential impact of academic technology transfer. Technol. Innov. 2014, 16, 75–84. [Google Scholar] [CrossRef]
- Roessner, D.; Bond, J.; Okubo, S.; Planting, M. The economic impact of licensed commercialized inventions originating in university research. Res. Policy 2013, 42, 23–34. [Google Scholar] [CrossRef]
- ASTP Survey Report. 2019. Available online: https://www.astp4kt.eu//assets/documents/Report%20-%20ASTP%20Survey%20on%20KT%20Activities%20FY2019.pdf (accessed on 16 December 2022).
- Chen, J.; Chen, J.; Zhao, S.; Zhang, Y.; Tang, J. Exploiting word embedding for heterogeneous topic model towards patent recommendation. Scientometrics 2020, 125, 2091–2108. [Google Scholar] [CrossRef]
- Du, W.; Wang, Y.; Xu, W.; Ma, J. A personalized recommendation system for high-quality patent trading by leveraging hybrid patent analysis. Scientometrics 2021, 126, 9369–9391. [Google Scholar] [CrossRef]
- Haghighian Roudsari, A.; Afshar, J.; Lee, W.; Lee, S. PatentNet: Multi-label classification of patent documents using deep learning based language understanding. Scientometrics 2022, 27, 207–231. [Google Scholar] [CrossRef]
- Krestel, R.; Chikkamath, R.; Hewel, C.; Risch, J. A survey on deep learning for patent analysis. World Pat. Inf. 2021, 65, 102035. [Google Scholar] [CrossRef]
- Yun, J.; Geum, Y. Automated classification of patents: A topic modeling approach. Comput. Ind. Eng. 2020, 147, 106636. [Google Scholar] [CrossRef]
- Souza, C.M.; Meireles, M.R.; Almeida, P.E. A comparative study of abstractive and extractive summarization techniques to label subgroups on patent dataset. Scientometrics 2021, 126, 135–156. [Google Scholar] [CrossRef]
- Gomez, J.C.; Moens, M.F. A survey of automated hierarchical classification of patents. In Professional Search in the Modern World: COST Action IC1002 on Multilingual and Multifaceted Interactive Information Access; Springer: Cham, Switzerland, 2014; pp. 215–249. [Google Scholar]
- Technology Transfer System Handbook. Available online: https://www.polito.it/imprese/trasferimento/TTS_handbook.pdf (accessed on 22 December 2022).
- Chowdhary, K.R. Fundamentals of Artificial Intelligence; Springer: New Delhi, India, 2020; pp. 603–649. [Google Scholar]
- Schaffer, C. Selecting a classification method by cross-validation. Mach. Learn. 1993, 13, 135–143. [Google Scholar] [CrossRef]
- Wu, X.Z.; Zhou, Z.H. A unified view of multi-label performance measures. In Proceedings of the International Conference on Machine Learning (PMLR), Sydney, NSW, Australia, 6–11 August 2017; pp. 3780–3788. [Google Scholar]
- Ebert, S.; Müller, T.; Schütze, H. Lamb: A good shepherd of morphologically rich languages. In Proceedings of the 2016 Conference on Empirical Methods in Natural Language Processing, Austin, TX, USA, 1–5 November 2016; pp. 742–752. [Google Scholar]
- Camacho-Collados, J.; Pilehvar, M.T. From word to sense embeddings: A survey on vector representations of meaning. J. Artif. Intell. Res. 2018, 63, 743–788. [Google Scholar] [CrossRef]
- Gerlach, M.; Shi, H.; Amaral, L.A.N. A universal information theoretic approach to the identification of stopwords. Nat. Mach. Intell. 2019, 1, 606–612. [Google Scholar] [CrossRef]
- Sarica, S.; Luo, J. Stopwords in technical language processing. PLoS ONE 2021, 16, e0254937. [Google Scholar] [CrossRef] [PubMed]
- Jivani, A.G. A comparative study of stemming algorithms. Int. J. Comp. Tech. Appl. 2011, 2, 1930–1938. [Google Scholar]
- Hassani, K.; Lee, W.S. Visualizing natural language descriptions: A survey. ACM Computing Surveys (CSUR) 2016, 49, 1–34. [Google Scholar] [CrossRef]
- Baeza-Yates, R.; Ribeiro-Neto, B. Modern Information Retrieval; ACM Press: New York, NY, USA, 1999; Volume 463. [Google Scholar]
- Aizawa, A. An information-theoretic perspective of tf–idf measures. Inf. Process. Manag. 2003, 39, 45–65. [Google Scholar] [CrossRef]
- Li, S.; Hu, J.; Cui, Y.; Hu, J. DeepPatent: Patent classification with convolutional neural networks and word embedding. Scientometrics 2018, 117, 721–744. [Google Scholar] [CrossRef]
- Jung, G.; Shin, J.; Lee, S. Impact of preprocessing and word embedding on extreme multi-label patent classification tasks. Appl. Intell. 2023, 53, 4047–4062. [Google Scholar] [CrossRef]
- Hu, J.; Li, S.; Hu, J.; Yang, G. A hierarchical feature extraction model for multi-label mechanical patent classification. Sustainability 2018, 10, 219. [Google Scholar] [CrossRef]
- Zuva, K.; Zuva, T. Evaluation of information retrieval systems. Int. J. Comput. Sci. Inf. Technol. 2012, 4, 35. [Google Scholar] [CrossRef]
- Lee, J.S.; Hsiang, J. Patent classification by fine-tuning BERT language model. World Pat. Inf. 2020, 61, 101965. [Google Scholar] [CrossRef]
- Hosmer, D.W., Jr.; Lemeshow, S.; Sturdivant, R.X. Applied Logistic Regression; John Wiley & Sons: Hoboken, NJ, USA, 2013; Volume 398. [Google Scholar]
- Shi, T.; Horvath, S. Unsupervised learning with random forest predictors. J. Comput. Graph. Stat. 2006, 15, 118–138. [Google Scholar] [CrossRef]
- Rameshbhai, C.J.; Paulose, J. Opinion mining on newspaper headlines using SVM and NLP. Int. J. Electr. Comput. Eng. (IJECE) 2019, 9, 2152–2163. [Google Scholar] [CrossRef]
- Chen, T.; Guestrin, C. Xgboost: A scalable tree boosting system. In Proceedings of the 22nd ACM SIGKDD International Conference on Knowledge Discovery and Data Mining, San Francisco, CA, USA, 13–17 August 2016; pp. 785–794. [Google Scholar]
- Bentéjac, C.; Csörgő, A.; Martínez-Muñoz, G. A comparative analysis of gradient boosting algorithms. Artif. Intell. Rev. 2021, 54, 1937–1967. [Google Scholar] [CrossRef]
- Hastie, T.; Tibshirani, R.; Friedman, J.H.; Friedman, J.H. The Elements of Statistical Learning: Data Mining, Inference, and Prediction; Springer: New York, NY, USA, 2009; Volume 2, pp. 1–758. [Google Scholar]
- Hilbe, J.M. Logistic Regression Models; CRC Press: Boca Raton, FL, USA, 2009. [Google Scholar]
- Chauhan, V.K.; Dahiya, K.; Sharma, A. Problem formulations and solvers in linear SVM: A review. Artif. Intell. Rev. 2019, 52, 803–855. [Google Scholar] [CrossRef]
- Japkowicz, N.; Stephen, S. The class imbalance problem: A systematic study. Intell. Data Anal. 2002, 6, 429–449. [Google Scholar] [CrossRef]
- Guo, X.; Yin, Y.; Dong, C.; Yang, G.; Zhou, G. On the class imbalance problem. In Proceedings of the 2008 Fourth International Conference on Natural Computation, Jinan, China, 18–20 October 2008; IEEE: Piscataway, NJ, USA, 2008; Volume 4, pp. 192–201. [Google Scholar]
- Chawla, N.V.; Bowyer, K.W.; Hall, L.O.; Kegelmeyer, W.P. SMOTE: Synthetic minority over-sampling technique. J. Artif. Intell. Res. 2002, 16, 321–357. [Google Scholar] [CrossRef]
- Blagus, R.; Lusa, L. SMOTE for high-dimensional class-imbalanced data. BMC Bioinform. 2013, 14, 106. [Google Scholar] [CrossRef] [PubMed]
- Fall, C.J.; Törcsvári, A.; Benzineb, K.; Karetka, G. Automated categorization in the international patent classification. In ACM SIGIR Forum; ACM: New York, NY, USA, 2003; Volume 37, pp. 10–25. [Google Scholar]
- Hepburn, J. Universal language model fine-tuning for patent classification. In Proceedings of the Australasian Language Technology Association Workshop, Dunedin, New Zealand, 10–12 December 2018; pp. 93–96. [Google Scholar]
- Verberne, S.; D’hondt, E.K.L.; Oostdijk, N.H.J.; Koster, C.H. Quantifying the challenges in parsing patent claims. In Proceedings of the 1st International Workshop on Advances in Patent Information Retrieval at ECIR 2010, Milton Keynes, UK, 28–31 March 2010. [Google Scholar]
- Loiotile, A.D.; De Nicolò, F.; Monaco, A.; Tangaro, S.; Loccisano, S.; Conti, G.; Agrimi, A.; Amoroso, N.; Bellotti, R. Innovations and Emerging Technologies: A Study of the Italian Intellectual Property Knowledge Database. In Proceedings of the ICAART, Lisbon, Portugal, 22–24 February 2023. [Google Scholar]

| Metric | RC | LR | RF | SVM | XGB |
|---|---|---|---|---|---|
| 0.181 (0.022) | 0.801 (0.024) | 0.755 (0.026) | 0.793 (0.023) | 0.764 (0.023) | |
| 0.139 (0.017) | 0.679 (0.022) | 0.645 (0.024) | 0.674 (0.022) | 0.648 (0.021) | |
| 0.157 (0.019) | 0.735 (0.022) | 0.695 (0.024) | 0.728 (0.022) | 0.701 (0.021) |
| Metric | RC | LR | RF | SVM | XGB |
|---|---|---|---|---|---|
| P@2 | 0.184 (0.013)) | 0.544 (0.013) | 0.503 (0.016) | 0.518 (0.016) | 0.508 (0.016) |
| R@2 | 0.286 (0.022) | 0.867 (0.016) | 0.813 (0.022) | 0.830 (0.018) | 0.818 (0.021) |
| F1@2 | 0.224 (0.019) | 0.669 (0.013) | 0.622 (0.018) | 0.637 (0.016) | 0.627 (0.017) |
| Predicted Label | Agrifood | Environment | Basic Science | Green Energy | Electronics | Packaging | Biomed |
|---|---|---|---|---|---|---|---|
| True Label | |||||||
| Agrifood | 68.1 (9.1) | 6.2 (3.3) | 7.2 (2.1) | 2.1 (1.0) | 5.1 (2.2) | 1.1 (0.4) | 10.2 (4.1) |
| Environment | 4.5 (3.2) | 42.1 (8.2) | 19.3 (6.2) | 13.4 (4.4) | 13.2 (4.1) | 6.2 (2.2) | 3.1 (1.0) |
| Basic Science | 6.2 (2.1) | 6.7 (2.2) | 51.1 (5.1) | 6.2 (3.1) | 7.6 (2.1) | 3.1 (1.0) | 20.4 (4.1) |
| Green Energy | 3.8 (1.1) | 11.2 (2.3) | 11.2 (3.2) | 56.9 (8.2) | 13.2 (5.3) | 2.1 (0.5) | 3.4 (1.1) |
| Electronics | 1.8 (0.2) | 4.5 (0.8) | 6.5 (1.9) | 6.8 (1.8) | 64.3 (5.2) | 5.6 (1.2) | 14.5 (2.2) |
| Packaging | 8.7 (1.3) | 8.2 (1.2) | 23.8 (3.2) | 5.2 (1.4) | 23.9 (8.4) | 24.8 (2.1) | 10.8 (2.1)) |
| Biomed | 1.1 (0.1) | 1.8 (0.2) | 8.8 (1.1) | 1.6 (0.1) | 9.7 (1.1) | 2.8 (0.7) | 77.8 (2.3) |
Disclaimer/Publisher’s Note: The statements, opinions and data contained in all publications are solely those of the individual author(s) and contributor(s) and not of MDPI and/or the editor(s). MDPI and/or the editor(s) disclaim responsibility for any injury to people or property resulting from any ideas, methods, instructions or products referred to in the content. |
© 2025 by the authors. Licensee MDPI, Basel, Switzerland. This article is an open access article distributed under the terms and conditions of the Creative Commons Attribution (CC BY) license (https://creativecommons.org/licenses/by/4.0/).
Share and Cite
Amoroso, N.; Demarinis Loiotile, A.; Pantaleo, E.; Conti, G.; Loccisano, S.; Tangaro, S.; Monaco, A.; Bellotti, R. An Italian Patent Multi-Label Classification System to Support the Innovation Demand and Supply Matching. Sustainability 2025, 17, 6425. https://doi.org/10.3390/su17146425
Amoroso N, Demarinis Loiotile A, Pantaleo E, Conti G, Loccisano S, Tangaro S, Monaco A, Bellotti R. An Italian Patent Multi-Label Classification System to Support the Innovation Demand and Supply Matching. Sustainability. 2025; 17(14):6425. https://doi.org/10.3390/su17146425
Chicago/Turabian StyleAmoroso, Nicola, Annamaria Demarinis Loiotile, Ester Pantaleo, Giuseppe Conti, Shiva Loccisano, Sabina Tangaro, Alfonso Monaco, and Roberto Bellotti. 2025. "An Italian Patent Multi-Label Classification System to Support the Innovation Demand and Supply Matching" Sustainability 17, no. 14: 6425. https://doi.org/10.3390/su17146425
APA StyleAmoroso, N., Demarinis Loiotile, A., Pantaleo, E., Conti, G., Loccisano, S., Tangaro, S., Monaco, A., & Bellotti, R. (2025). An Italian Patent Multi-Label Classification System to Support the Innovation Demand and Supply Matching. Sustainability, 17(14), 6425. https://doi.org/10.3390/su17146425