1. Introduction
The contemporary world has entered a new era of turbulence and transformation. Prominent challenges include the deterioration of the global geopolitical situation, the rise of unilateralism and protectionism, the global economy’s deep recession, and the increasing frequency of financial crises. These factors have significantly accelerated the restructuring of the global value chain (GVC) and caused substantial changes in international division of labor. As frontier fields of the global technological revolution and industrial transformation, digital technology and the digital economy are reshaping the logistics industry ecosystem by deeply integrating inter-country connection networks. Smart logistics represents New Quality Productive Forces within the logistics sector, and it has emerged as a focal point of industrial competition. The global network, with its real-time information interaction, demand forecasting synergy, and dynamic resource matching, has emerged as a key driver of the logistics system’s digital transformation. The digitalization of the global logistics industry has enabled developed economies, such as the United States, Europe, and Japan, to construct global transportation, logistics, and supply chain service systems. These efforts aim to control major global logistics channels and reshape global industrial and supply chains to sustain their dominance in the upstream segments of the global value chain. In recent years, developed economies have imposed strategic restrictions, decoupling measures, and sanctions on critical national technological fields to preserve their positions in the global value chain and maintain competitive advantages in high-tech sectors. Several countries have faced export limitations and technology embargoes in emerging technologies, such as artificial intelligence, semiconductors, supercomputing, and 5G. Under the backdrop of competition dominating in the field of science and technology, how various countries and logistics enterprises can seize the digital opportunities to reduce the overall energy consumption of the logistics industry and achieve the goal of green and low carbon has become an urgent problem to be solved at present.
Scholars from home and abroad have undertaken extensive research on green logistics development. Chinese scholars [
1,
2,
3,
4,
5,
6,
7,
8,
9,
10,
11,
12,
13] constructed a multidimensional logistics index system to examine the logistical growth of Chinese provinces, taking into account significant elements of environmental sustainability development. Cheng G and Shushan Z [
8] referred to logistics-related policy documents issued in China and academics’ definitions of smart logistics. They selected the first-level indicators that summarize more comprehensively, which are the power of development, the development environment, and the development benefits. Foreign scholars [
14,
15,
16,
17,
18,
19,
20] constructed a green logistics performance index, with countries in Asia [
21], Africa [
22], and Europe as research objects. They mainly explored the aspects that influence green logistics efficiency, such as green logistics technologies and policy support.
This study constructs a green logistics indicator system from the three perspectives of development dynamics, development environment, and development benefits, while taking green and low-carbon elements into account. To gauge the degree of green logistics, this study employs a creative use of integrated methodologies and gathers a significant amount of pertinent national data. This study compares and analyzes the results to provide a basis for national and regional development strategies for the logistics industry. Simultaneously, it provides a theoretical foundation for the implementation of intensive development, the pooling of social resources, cost reduction and efficiency enhancement, and countries’ achievement of carbon neutrality.
2. Literature Review
This article discusses two topics: the construction of the green logistics level system and the comprehensive method of cloud model–entropy value–TOPSIS.
2.1. Green Logistics Level
In recent years, countries around the world have paid increasing attention to the sustainable development of logistics. The research on the evaluation index system of green logistics is becoming increasingly in-depth. Scholars have constructed multiple evaluation systems from different dimensions. Early logistics evaluation mainly focused on economic benefits and operational efficiency, while modern research pays more attention to environmental sustainability, resource utilization efficiency, and low-carbon development.
According to the data released by the World Bank database in 2021, traditional logistics performance evaluations mainly rely on indicators such as logistics infrastructure, transportation efficiency, and economic contribution. However, with the prominence of environmental issues, scholars have begun to incorporate carbon emissions, energy consumption, and ecological impacts into the evaluation system. Zaman K and Shamsuddin S [
5] used the logistics performance index to explore the impact on energy, the environment, and economic health. The results showed that the logistics performance index in terms of “timeliness” significantly increased the gross domestic product per unit of energy usage, health expenditure, and per capita income. The logistics index in terms of “infrastructure” increased renewable energy and reduced carbon emissions, providing a theoretical basis for scholars’ subsequent research on green logistics.
Scholars have constructed indicators for the development level of green logistics from different aspects. Especially considering the influence of environmental factors [
1], green and low carbon have become the focus of industrial transformation at present, and green logistics is a crucial strategy for the logistics industry’s long-term development. Renxiang Z [
2], Baoyou Z [
3], and Xiangrong L et al. [
4] constructed the logistics economy, the high-quality development level of China’s logistics industry, and the green logistics development level from five aspects of the new development concept. The emergence of new green products and technologies has promoted the green development of cold chain logistics. Xuemei F et al. [
6,
7] constructed an evaluation index system for the green development level of cold chain logistics. Cheng G and Shushan Z [
8] investigated the characteristics of smart logistics formation and included indicators with digital elements in the smart logistics system design. They condensed the first-level indicators with consensus based on the Implementation Opinions on the Construction of Intelligent Logistics and Distribution System issued by China and the connotation of intelligent logistics defined by academics. The final selection of three first-level indicators, namely, development momentum, development environment, and development benefits, provided a more comprehensive overview of the actual level of intelligence in the logistics industry. Under the background of the government’s promotion of the in-depth integration and innovative development of the logistics industry and manufacturing industry, Weihua L et al. [
9] constructed an evaluation index system based on the characteristics of the logistics industry and the manufacturing industry, and conducted analyses of spatial differentiation and spatiotemporal evolution characteristics [
10,
11]. With the application of unmanned aerial vehicles in the logistics field, the low-altitude economy has risen rapidly as an emerging industry. Yuekuan Z [
12] studied the issues of low-altitude economic development and sustainable smart cities, which are closely related to smart logistics. Xinyu K et al. [
13] constructed and analyzed the green development level on provincial-level air logistics using data from Chinese provinces.
Internationally, scholars are also conducting more in-depth research on green logistics. Foreign scholars [
14,
15,
16] constructed the green logistics performance index (GLPI), which combines the logistics performance index (LPI) and the environmental performance index (EPI). Among them, the LPI is released by the World Bank and includes six indicators: the efficiency of the customs clearance process, the quality of trade- and transport-related infrastructure, the ease of arranging competitively priced shipments, the quality of logistics services, the ability to track and trace consignments, and the frequency with which shipments reach the consignee within the scheduled time. It is used to measure the cross-border logistics efficiency of various economies. Some scholars employ LPI data for empirical logistics research [
17,
18,
19,
20]. However, the LPI does not account for carbon emissions. Ahmad U A et al. [
21] explored the impact of green logistics performance (GLP) on sustainability indicators in African countries. He concluded that green logistics practices can enhance the quality of the environment, stimulate economic growth, and boost trade competitiveness. Khayyat M et al. [
23] concluded that high environmental awareness, a positive organizational culture, green logistics technologies, and more robust policy support can realize environmental protection and improved logistical efficiency. Alasmari T et al. [
22] explored the evolution of logistics research in Saudi Arabia, emphasizing the global transition to sustainable and technologically driven logistics.
2.2. Cloud Model–Entropy Value–TOPSIS Comprehensive Method
The logistics evaluation method system has undergone a significant transformation from a single method to a composite method. Traditional subjective evaluation methods, such as the analytic hierarchy process (AHP) [
24] and the Delphi method [
25], rely on expert experience and are vulnerable to cognitive biases. Objective evaluation methods, including the entropy method [
26], principal component analysis (PCA) [
27], etc., can reduce subjective interference but ignore domain knowledge. This binary opposition has given rise to the third-generation evaluation methods that combine subjective and objective aspects, such as the AHP–entropy weight method [
28], the DEA–Tobit model method, and the comprehensive weighting method of entropy weight and coefficient of variation, etc.
The cloud model, as an effective tool for handling qualitative–quantitative conversion, realizes the expression of concept uncertainty through the three digital characteristics of Ex, En, and He. Wang H et al. [
29] proposed a new multicriteria decision-making (MCDM) method based on multigranularity cloud rough sets (MGCRSs) and flexible language expressions (FLEs) for measuring the comprehensive index system of green energy. In the field of logistics, Zixue G et al. [
30] constructed regional logistics decarbonization development evaluation indicators from three dimensions: low-carbon logistics environment support, low-carbon logistics strength, and low-carbon logistics potential. The cloud numerical characteristic values and cloud membership degrees are determined by using the cloud model theory, and the index weights are determined in combination with the entropy weight method. The comprehensive calculation research object belongs to the comprehensive determination degree of the logistics decarbonization level and calculates the comprehensive evaluation index. In terms of logistics, there are relatively few studies on the application of cloud models.
The entropy method reflects the degree of index dispersion through information entropy. Lobzang C et al. [
31] proposed a new concept of a hybrid network analysis method, ANP–entropy weight and Holt exponential smoothing model, and conducted a short-term prediction of groundwater quality. This method mainly combines time series to present a dynamic entropy weight model. Xie Y et al. [
32] optimized the entropy weight model and combined it with multicriteria decision analysis, making regional predictions more accurate.
TOPSIS is widely applied in logistics research, especially when combined with other methods to construct a new functional evaluation model, for example, the entropy weight–TOPSIS method [
33], which can utilize panel data and combine with regression models. It can quantify the changes and improvement paths of emergency logistics response capabilities in different regions under different events.
Zhao D et al. [
34] combined the subjective evaluation method of the cloud model with the objective evaluation method and proposed a comprehensive calculation method of cloud model–entropy value–TOPSIS. The specific manifestations are as follows: First, in the cloud model stage, language variables are transformed into cloud digital features to solve the problem of quantifying qualitative indicators. The second stage is the entropy method stage, where based on the cloudified data, objective weights are calculated to correct the subjectivity of cloud model parameters. The third stage is the TOPSIS stage, where the schemes are sorted using the quantified values and weights output from the first two stages. This method is used to measure the evaluation of national power development, and its results are relatively in line with the actual situation, attracting the attention of the logistics academic circle.
In summary, Chinese scholars consider more comprehensive indicator dimensions when constructing the level of green logistics development, but the research object is mostly Chinese provinces, while foreign scholars have not taken into account the development dimensions of the logistics industry when measuring the development of green logistics. Carbon emissions and the rate of renewable energy consumption are also not included. This study combines the strengths of domestic and international scholars studying logistics development. It comprehensively constructs a multidimensional indicator system that includes crucial indicators, such as carbon emission intensity, renewable energy utilization rate, and logistics performance. This study takes 51 nations around the world as research subjects. For the first time, it utilizes the cloud model–entropy value–TOPSIS method for green logistics assessment. This study explores the spatial and temporal evolution characteristics of the green logistics level, providing countries, enterprises, and scholars with a panoramic perception of global green logistics development. Simultaneously, it provides new analytical perspectives and methodological references.
3. Methods
This study attempted multiple measurement methods to compare the degree of conformity between the results and reality. Finally, this study adopted the cloud model–entropy value–TOPSIS method to measure the level of green logistics. The specific steps were as follows:
Step 1. Cloud Model.
In the index weights, the cloud model combines the fuzziness and randomness of the indicators, obtains quantitative data through qualitative language expressions, intuitively reflects the universal laws in the indicators, and makes the evaluation results objective and reliable. Refer to the calculation method of Qian G [
35].
Step 1.1. Let us set it as a quantitative domain. C is a qualitative concept on U. If the quantitative value is and is a random implementation of C, and the degree of certainty of with respect to C is a random number with a stable tendency, that is, , , , , , then the distribution of on the domain U is called a cloud, and each X is called a cloud drop. This corresponds to the green logistics level index system constructed in Table 3 of Part 4. Indicator System, which includes 3 first-level indicators and 12 second-level indicators.
The indicator set is recorded as:
. Among them, is the first-level indicator in U.
is the index set of the second-level indicators in U.
is the index set of the third-level indicators in U.
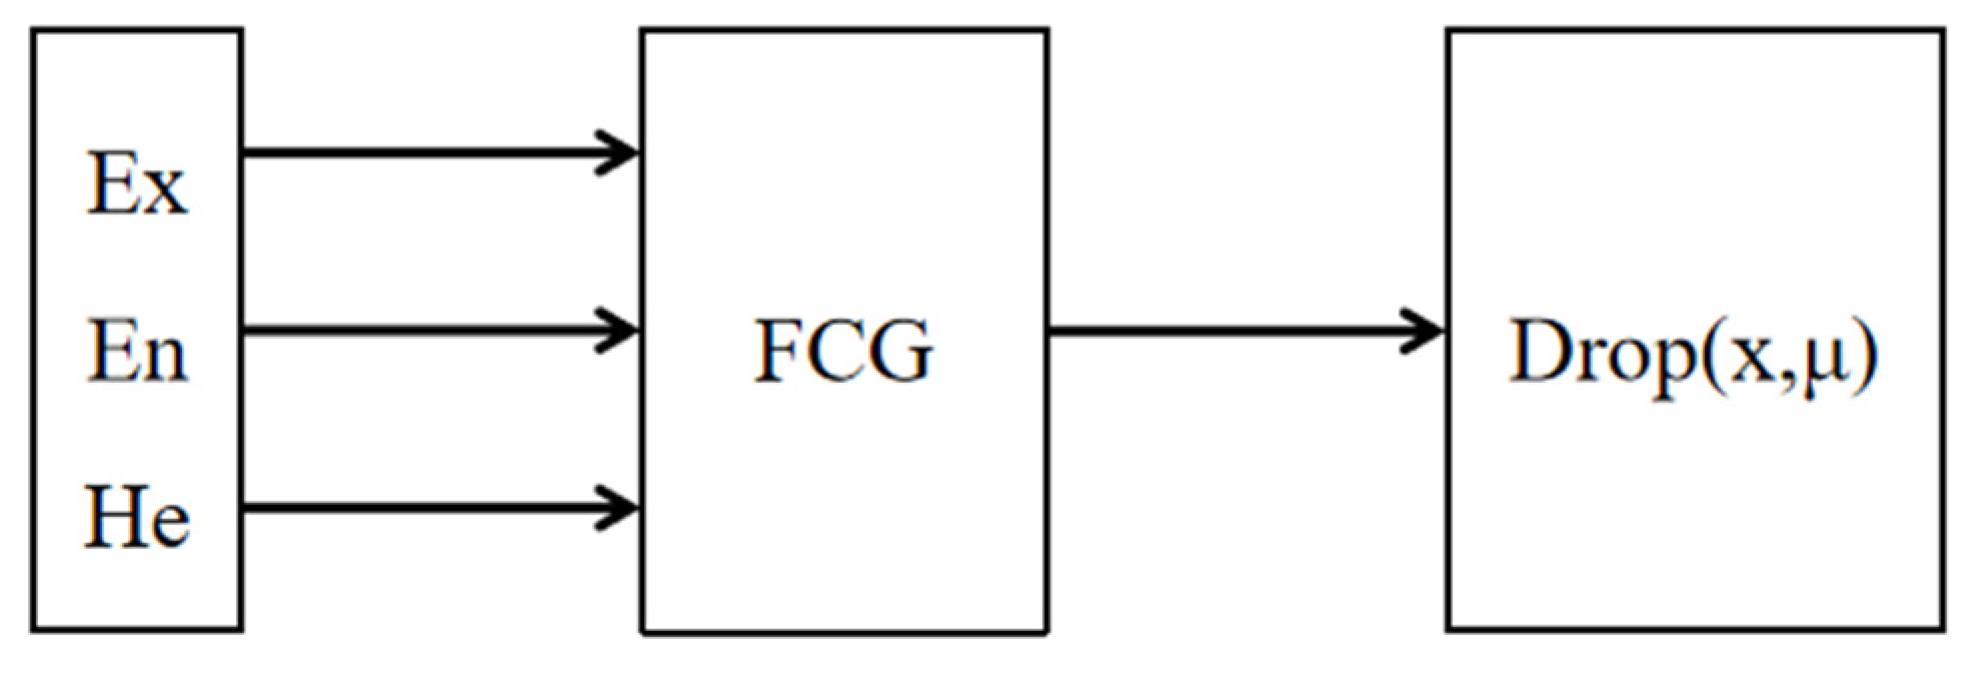
The overall representation is represented by the mathematical expected value (Ex), entropy (En), and hyper-entropy (He). The expected value, Ex, is the mathematical expectation of the distribution of cloud droplets in the domain space. The entropy, En, is jointly determined by the randomness and fuzziness of the concept. The greater the entropy, the greater the dispersion degree of the cloud droplets and the lower the certainty degree of the cloud droplets. Hyper-entropy, He, is the uncertainty of entropy, which is intuitively manifested as the thickness of the cloud. The smaller the hyper-entropy, the higher the degree of acceptance of the concept; the larger the hyper-entropy, the more difficult it is to accept. The cloud model includes two basic algorithms: forward cloud and reverse cloud. The forward cloud algorithm realizes the transformation from qualitative concepts represented by digital characteristics to quantitative datasets, and from connotation to extension. The forward cloud algorithm constitutes a forward cloud generator, as shown in
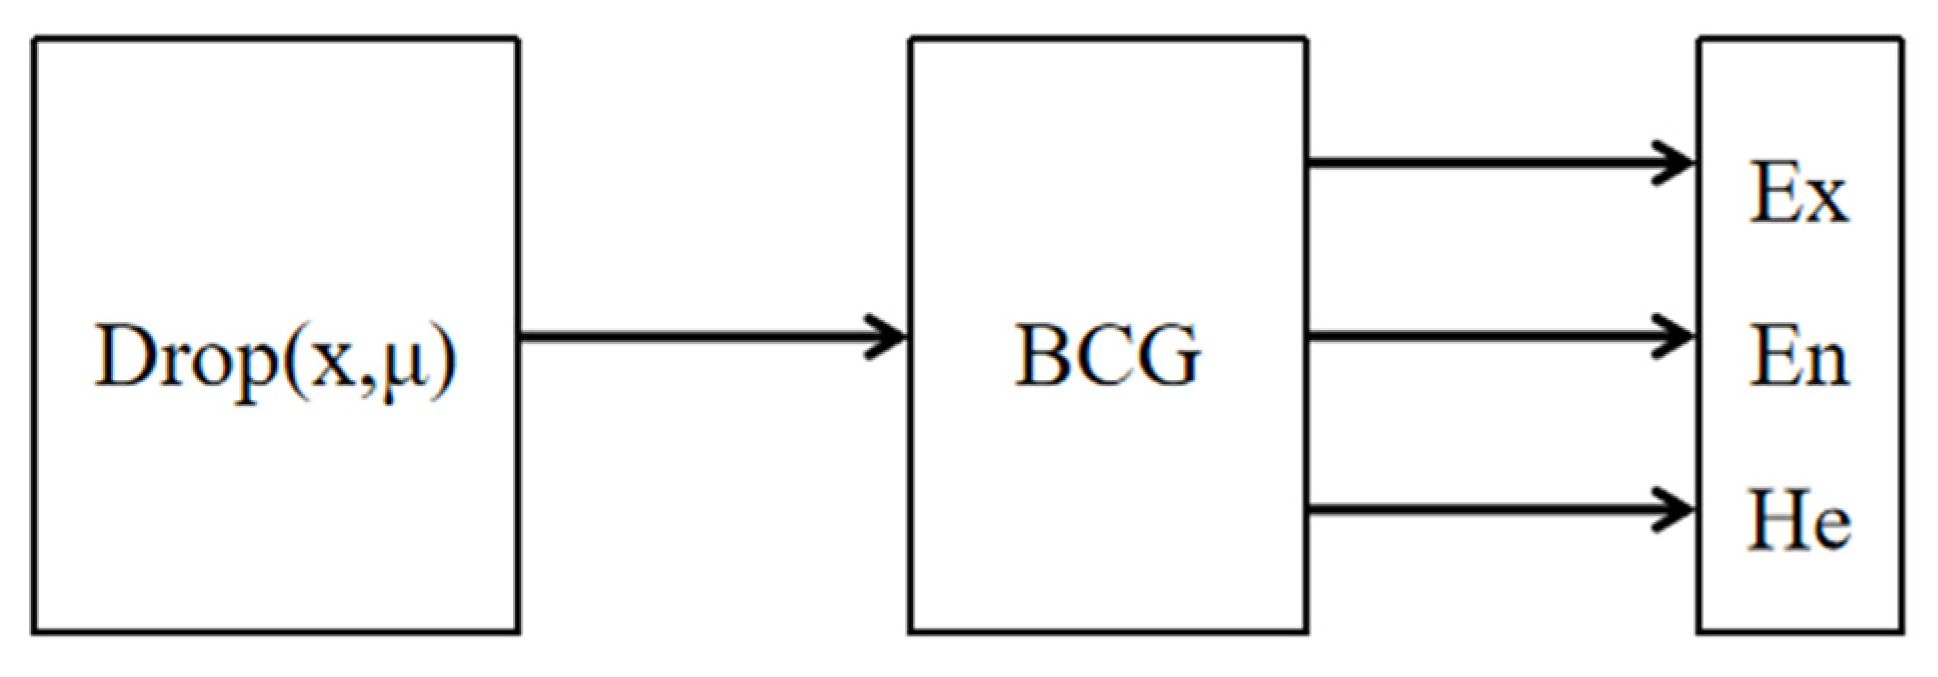
Figure 1, which generates cloud droplets using three digital features. The reverse cloud algorithm realizes the acquisition of digital features representing qualitative concepts from a set of sample datasets, which is a transformation from extension to connotation. The reverse cloud algorithm constitutes a reverse cloud generator. As shown in
Figure 2, three digital features were generated based on cloud droplets: Ex, En, and He.
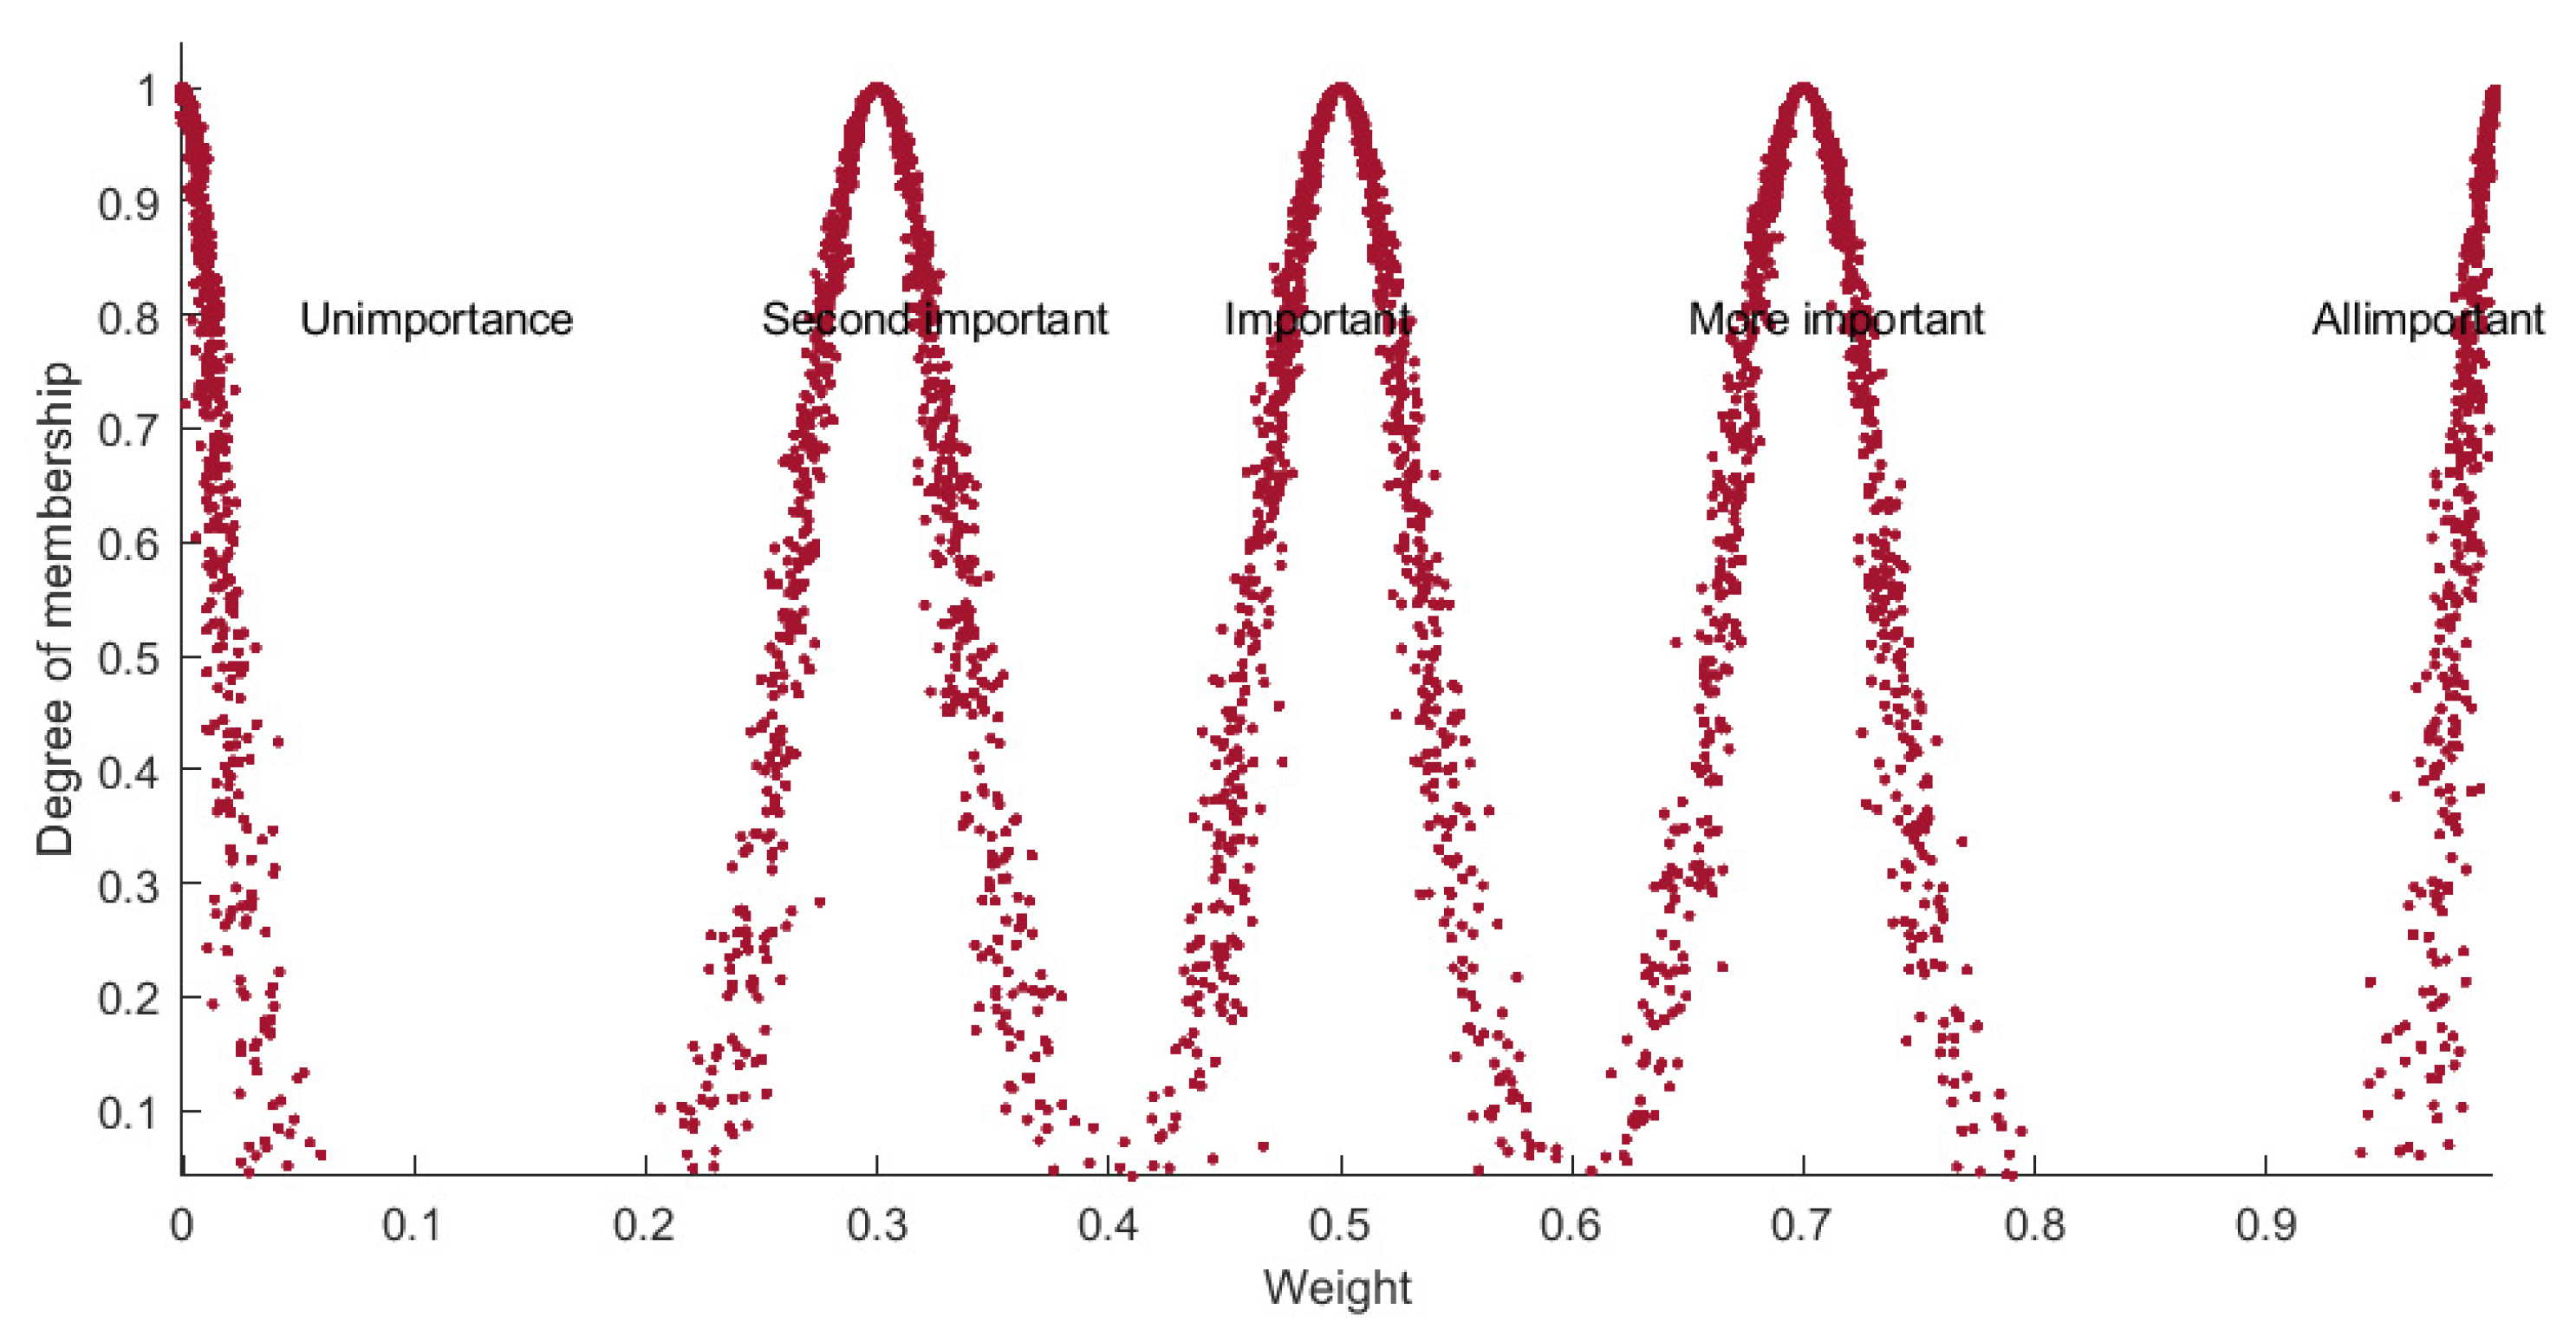
Step 1.2. Generate the cloud model of the weighted comment set. Please ask experts in the logistics field to describe the intensity of factors influencing the development of the logistics industry. The intensity is divided into five levels, from unimportant to very important, with level one being the lowest and level five the highest. The higher the level, the stronger the influence intensity of the factor. The weighted comment set is:
We mapped the concepts of the five levels equally to [0, 1], as shown in
Table 1.
We denote the cloud models of these five weight levels in sequence as:
The weight evaluation cloud is constructed using the 3En principle. The calculation of the expected value and entropy is shown in the formula as:
According to the correspondence principle between conceptual maturity and ambiguity, the hyper-entropy
is taken as
. The weighted comment cloud diagram generated by using MATLAB2022 software is shown in
Figure 3.
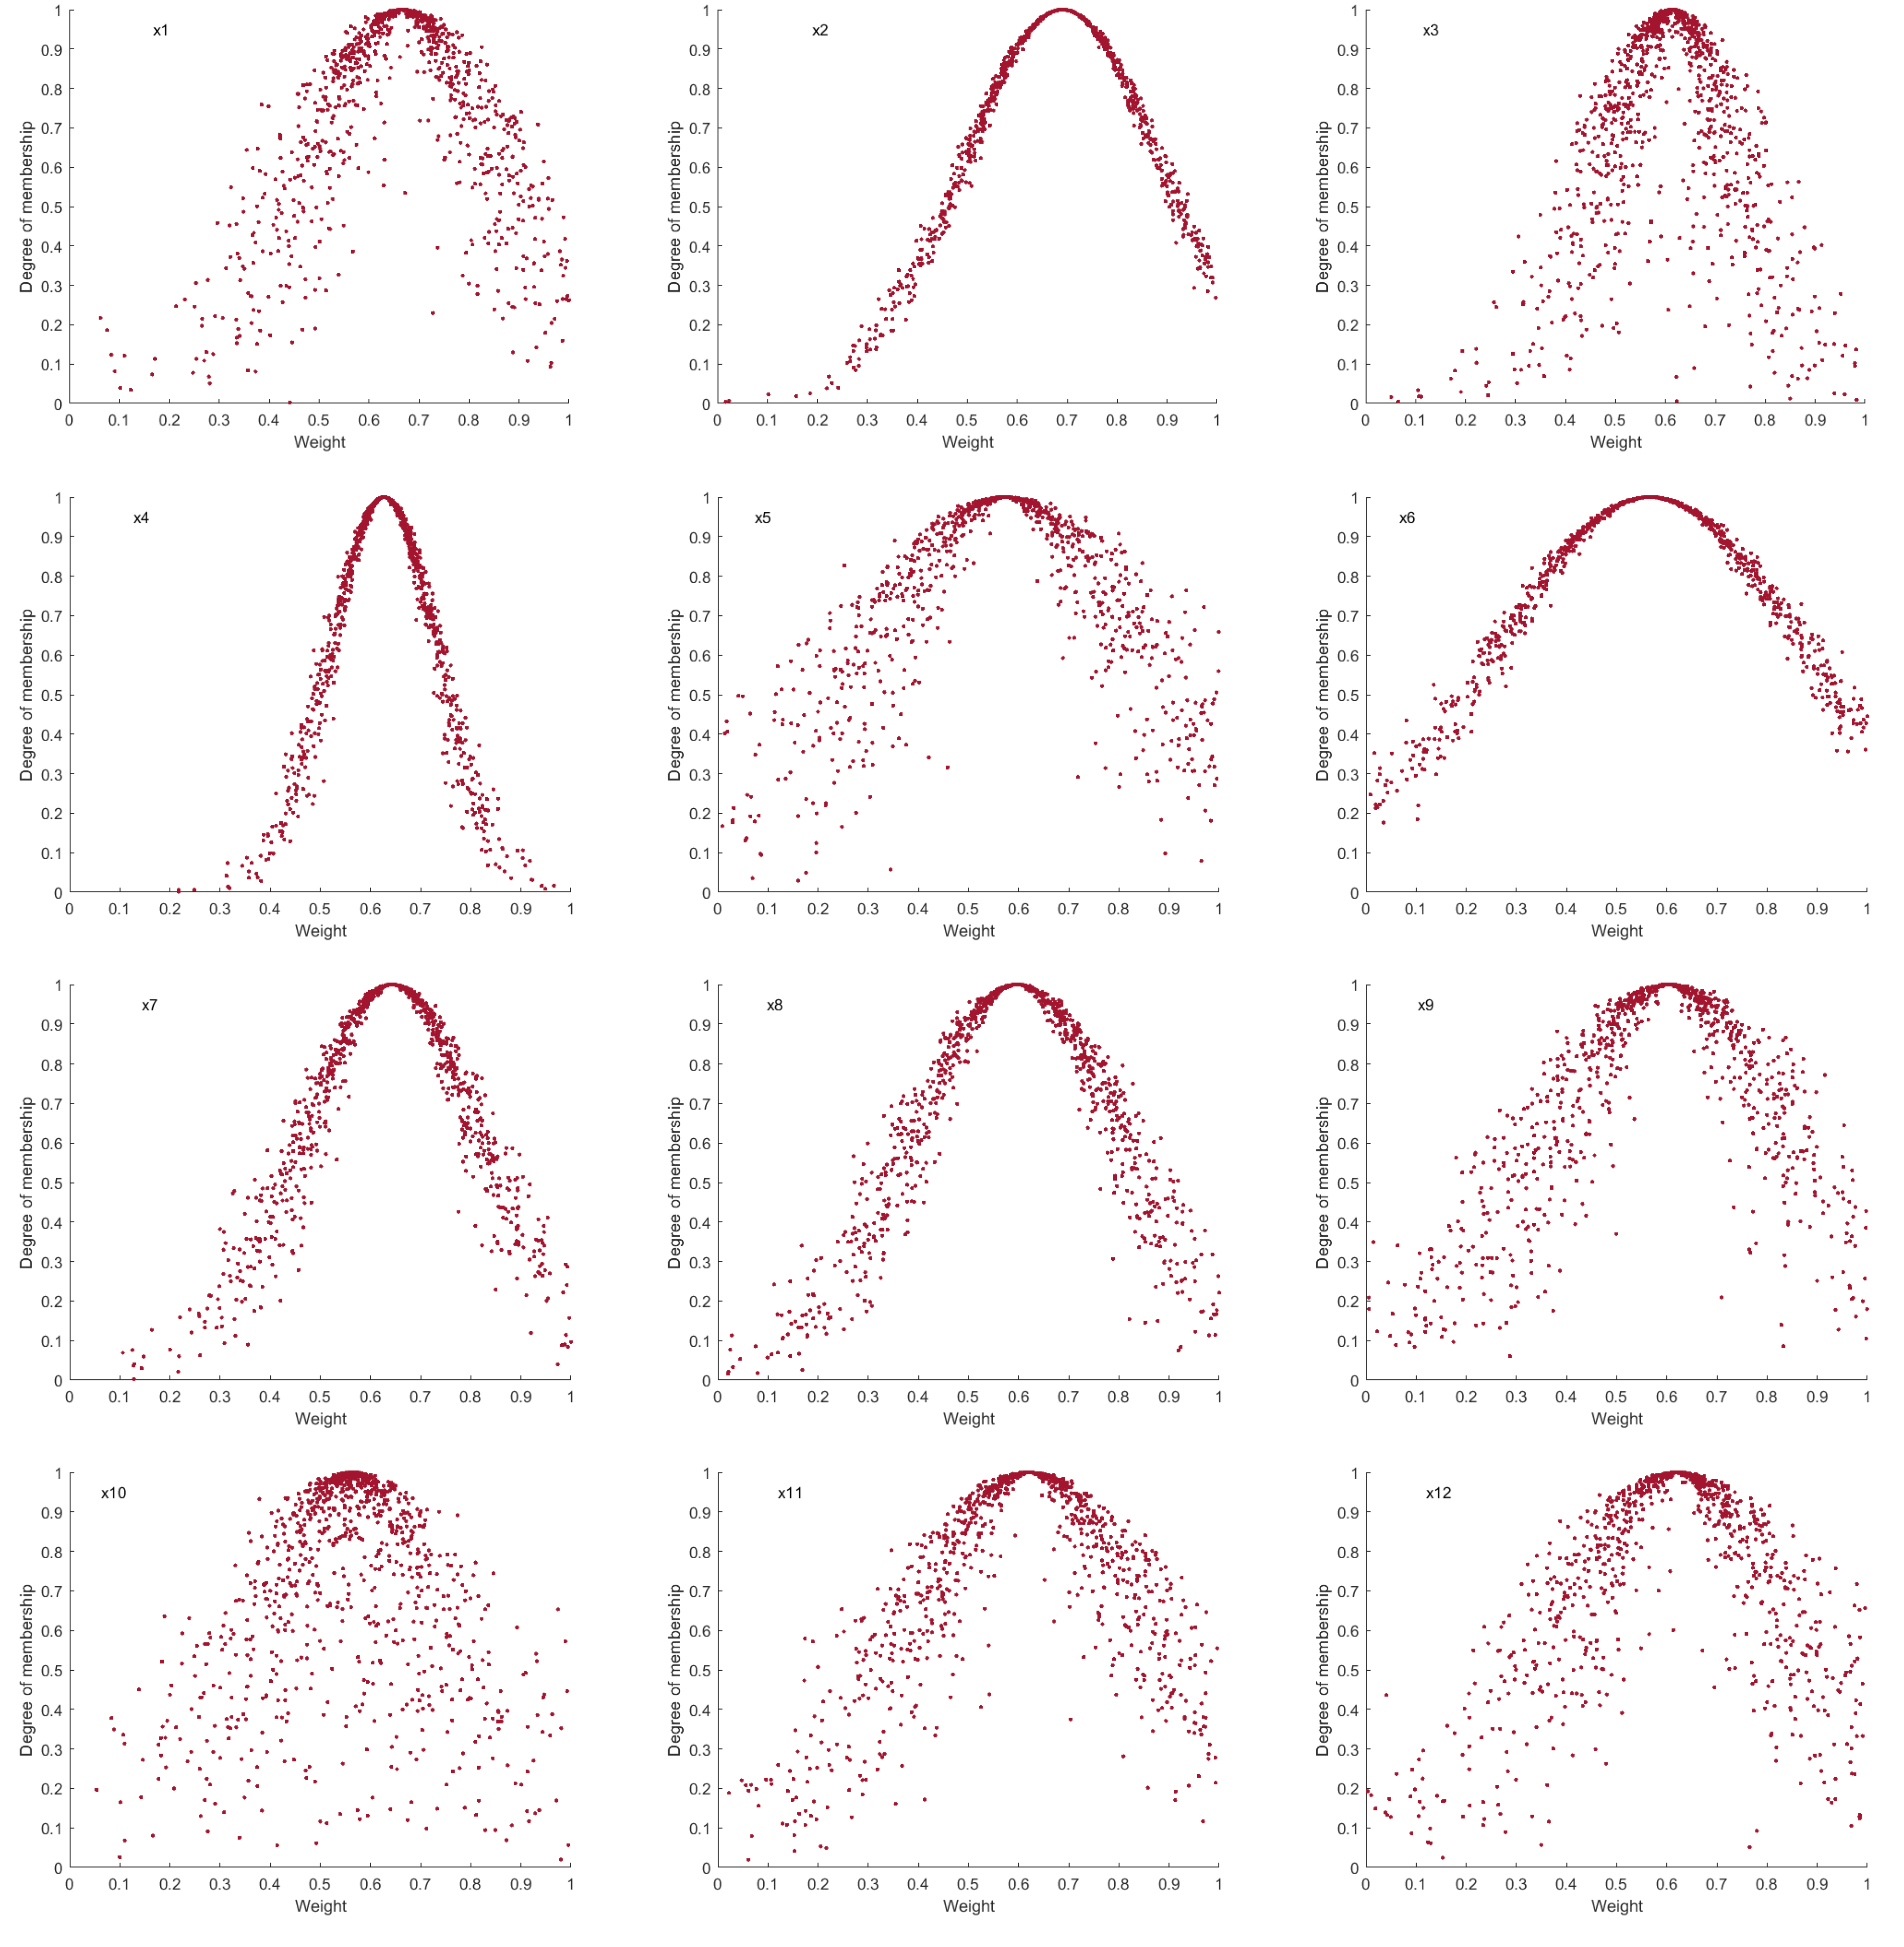
Step 1.3. Generate the cloud model of the final-level index weights. To ensure that the evaluation indicators’ weights were reasonable and scientific, we invited a total of 30 experts from the China Federation of Logistics and Purchasing, university teachers engaged in logistics research, and domestic and foreign logistics enterprise managers to rate the 12 indicators. The initial weights of the indicators were produced by gathering and evaluating data from these 30 experts, and the cloud model was utilized to continuously make the weights scientific and sensible. The digital features of the cloud model were generated by using the reverse cloud generator algorithm, and then the cloud map was produced by the forward cloud generator. The first scoring result was fed back to the experts, who conducted the second scoring. This process was repeated multiple times to finally ensure that the cloud map converged from fogging to condensation. The following text takes the final-level indicator “flow distance” as an example to illustrate the digital characteristics of the generated indicator weight cloud model and the determination process of the weight cloud graph.
The first step was to collect the evaluation data of “circulation distance” by the 30 experts in the logistics field. At the same time, in combination with the language values of the experts’ evaluations and referring to the weight levels and ranges in
Table 1, we converted the qualitative evaluation data of the experts into quantitative measurement values. The mean value method was used to generate three characteristic values of the “flow distance” weight data in the reverse cloud generator. The calculation formula is:
“Flow distance” transformed the experts’ understanding of the weights of the 12 indicators from a foggy state to a more mature one, generating a weight cloud map, as shown in
Figure 4. The index weight cloud graph was relatively close to the standard cloud graph.
Step 1.4. Generate the cloud model of advanced indicator weights. The integrated cloud, also known as the parent cloud, essentially elevates the concept of integrating n languages of the same type into a concept of language values with a broader meaning, and then into a more general concept to obtain a higher-level parent cloud. In the indicator system, advanced indicators represent concepts with higher comprehensiveness, which coincides with the connotation of the comprehensive cloud. Therefore, the secondary indicators can be regarded as the parent cloud of the tertiary indicators, and the primary indicators can be regarded as the parent cloud of the secondary indicators. The digital characteristics of the comprehensive cloud can be calculated based on the digital characteristics of all sub-clouds. The calculation formulas for the digital characteristics of the first-level indicators are:
Based on the above Formulas (6)–(8), the expected values and entropy values of the cloud models of the first-level and second-level indicators in the evaluation index system were calculated layer by layer from bottom to top. The final weight values of the index system were obtained by normalizing the weights of the same-level indicators according to Formula (9). The results of digital characteristics and weights are shown in
Table 2.
Step 1.5. Drawing on the method used by Defu Z et al. [
34] and applying the 3En principle, it was transformed into interval
, and the calculation formula is as follows:
Step 2. Entropy Method.
Step 2.1. Construct the evaluation matrix , , where is the index value of the i-th evaluation object among the j-th indicators, m is the number of objects to be evaluated, and n is the number of evaluation indicators.
Step 2.2. Standardize the matrix to obtain the standard matrix , and calculate the positive and negative indicators.
Step 2.3. Calculate the proportion of each evaluation index:
Step 2.4. Calculate the entropy values of each evaluation index. In Equation (14), when
is 0, the definition of
is 0 and the value range is
;
,
:
Step 2.5. Calculate the weights of each evaluation index:
Step 2.6. Calculate the evaluation value:
Step 2.7. Convert the evaluation value to the interval number .
Step 3. TOPSIS Method.
Step 3.1. The interval number
is calculated based on the cloud model, where
represents the upper bound and
represents the lower bound. The interval number
is calculated from the entropy value, where
represents the upper bound and
represents the lower bound.
represents the weight of the target matrix. Here, it was taken as 0.5. We calculated the
and
matrices. The formulas were as follows:
Step 3.2. Determine the positive ideal solution
and the negative ideal solution
:
Step 3.3. Calculate the distance between each evaluation object and the positive ideal solution and the negative ideal solution:
Step 3.4. Calculate the closeness degree between the evaluation object and the ideal solution:
The larger the value of is, the higher the level of green logistics will be.
4. Indicator System
Climate change, such as extreme weather and sea-level rise, has raised the risk of ecosystem collapse. The international community has reached an agreement on emission reductions and established carbon neutrality and carbon peaking targets. The traditional high-carbon paradigm challenges resource limits as well as industrial competition. New energy technology advancements are reshaping the global economic landscape. Carbon tariffs, green finance, and other tools are forcing supply chains to decarbonize. The low-carbon economy has emerged as an essential strategy for balancing environmental security, economic growth, and global governance. The green transformation of the logistics industry, as one of the greatest sources of carbon emissions, has become an international consensus. The green logistics level indicator system takes into account carbon emission intensity as well as the fraction of green energy. This is not only a practical requirement to respond to the emission reduction objective of The Paris Agreement, but also a vital quantitative tool for promoting low carbonization throughout the industry chain. These two indicators are directly related to optimizing the energy structure and raising the operational efficiency of the logistics system. They provide measurable and comparable core dimensions for evaluating industrial green performance. From the perspective of both policy and technology, carbon emission intensity reflects the carbon dioxide emissions per unit of transportation turnover, which may be used to intuitively measure the low-carbon technology level of logistics firms. The fraction of green energy reflects the scale of application of clean energy in vehicles, storage, and other segments, which is a key observation point for energy structure transformation.
To summarize, this study incorporated carbon emission intensity and green energy share variables into the green logistics level indicator system. Carbon emission intensity was calculated by dividing carbon dioxide emissions by the total trade import and export of the logistics business. This might intuitively show the carrying capacity of the logistics regional environment in the face of pollutant discharges and resource use. The green energy ratio [
36] directly showed the logistics industry’s transition from traditional fossil energy to clean energy sources, such as wind and solar energy, and it was a significant indication of the decarbonization process.
Negative externalities, such as carbon emissions, noise pollution, and road dust caused by logistics and transportation linkages, will have a direct impact on the atmosphere, water, and land. The energy consumption of warehousing facilities and the efficiency with which packaging trash is treated have a significant impact on the area ecosystem’s stability. Quantified carbon emission indicators allow for the systematic evaluation of the actual impact of the existing logistics model on the natural environment, as well as the provision of a scientific basis for developing pollution prevention and control strategies and optimizing the use of green technologies. This ensures a dynamic balance between logistical development and ecological carrying capacity, resulting in a true improvement in both economic efficiency and environmental advantages.
This study drew on the practices of Cheng G and Shushan Z [
8] to construct three first-level indicators: development momentum, development environment, and development benefits. The development momentum reflects the state’s investment in the logistics industry, including the scale of logistics talent, production capacity, technological innovation ability [
37], and financial expenditure. The most important of these is the investment in technological innovation, which has an impact on the logistics industry’s upgrading and digital transformation [
38]. Logistics development, as reflected in the development environment, is constrained by the country’s geography and economic level. Road density, internet infrastructure, carbon emission intensity, and the fraction of green energy all have an impact on green logistics development. The carbon emission intensity and the fraction of green energy, in particular, should ensure that the logistics industry moves toward green and sustainable development, as well as that the establishment of a high-quality ecological environment contributes to the quality and stability of the economy.
The development efficiency reflects the output of a country in the logistics industry. The logistics performance, intellectual property, commodity trade, and freight capacity can demonstrate the changes and comparative differences in the efficiency of various economies. Intellectual property represents the output in the field of scientific and technological innovation. Based on the above analysis and data availability, this study chose 12 secondary indicators to construct a comprehensive indicator system of green logistics level, as shown in
Table 3.
Data on the indicators are primarily sourced from the World Bank and UNCTADstat. The World Bank database comprises over 7000 indicators from more than 200 nations and regions throughout the globe. It focuses on the three main areas of economy, society, and the environment, including climate change, the environment, and trade. It can provide full data assistance for studies on green logistics (at the same time, all data are open to the public free of charge, with strong accessibility, and are listed as official citation sources by international organizations, such as the IMF and WTO, with international recognition). The UNCTADstat Data Centre focuses on maritime transport, the environment and related trade, the digital economy and technology, etc. It provides more detailed statistics on goods trade volume, split down by commodity group and method of transportation, as well as transportation expenditures and effort, average freight rates, and transport cost intensity. The UNCTADstat Data Centre is an excellent resource for developing a logistics indicator system.
Given that some developing countries lack precise data on their indicators. Many countries lack data prior to 2000. The sample examined in this study was a panel of 51 major countries from 2000 to 2022, with specific indicators shown in column 3 of
Table 3 (third-level indicators). After filtering and organizing by year and economy, it was discovered that there were a few nations and years with missing data. To augment the data, the study obtained data from the United Nations Economic Commission for Europe database, the Asian Development Bank, and the official statistical offices of specific nations, with the goal of ensuring data completeness and consistency. Missing values that could not be added were filled in by the interpolation method.
5. Measurement Results and Analysis of Green Logistics Level
In this study, the cloud model–entropy value–TOPSIS method was used to calculate the composite scores of 51 nations’ green logistics levels from 2000 to 2022. The higher the green logistics level score, the more environmentally conscious the country’s logistics industry is. The first year (2000), the five-year interval (2010, 2015, and 2020), the last year (2022), the annual mean, and the regional mean were selected, and the countries were ranked in ascending order of their 2022 results for each continent, namely, the Americas, Europe, Asia, Oceania, and Africa, as shown in
Table 4. The United States, Germany, China, Australia, and South Africa had the most advanced green logistics systems on each continent. Among these, the United States’ green logistics level was far ahead of other countries, with Singapore ranking second only to China among Asian countries in 2022. This study analyzed the results from two perspectives: developed and developing countries, and then selected example countries to analyze the results in terms of the national logistics industry’s development characteristics.
5.1. Comparative Analysis of Green Logistics Levels in Developed Countries
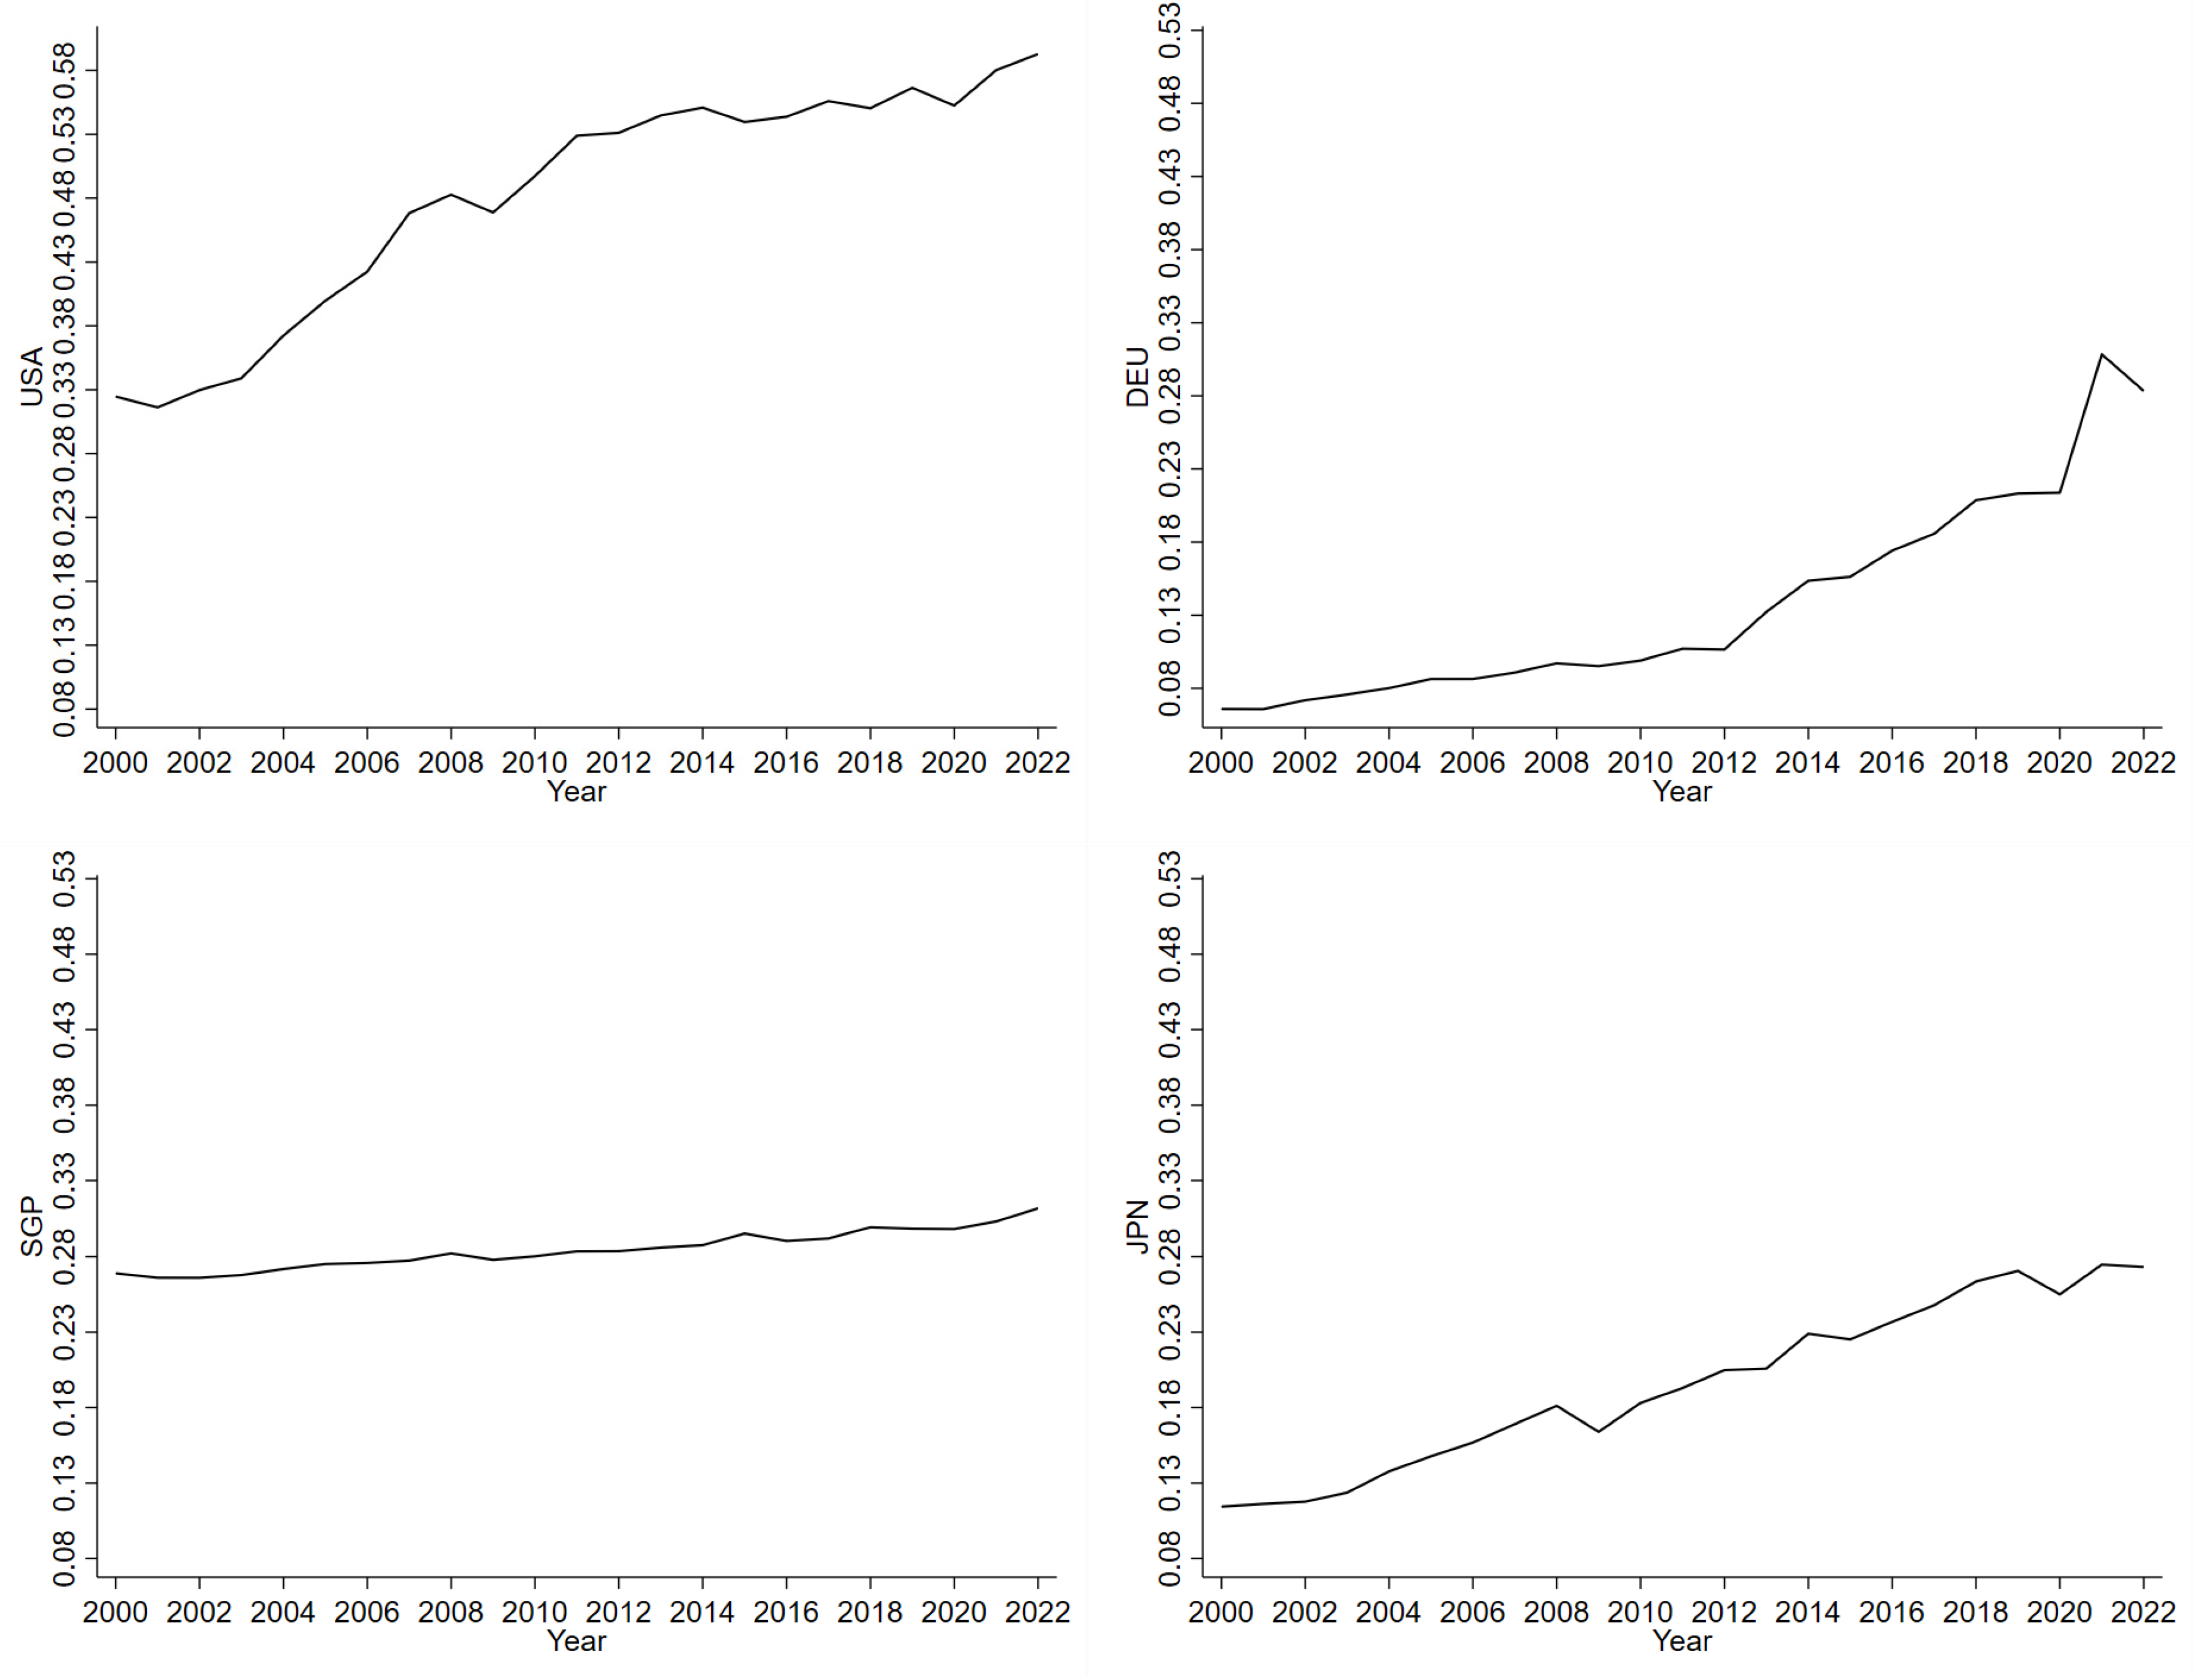
Developed countries have created a comprehensive policy framework and technological standard system to enforce strict carbon regulations. They are widely adopting cutting-edge technologies, such as digital twins and hydrogen fuel cells. This has led to an increasing scale of use of hydrogen energy in the logistics industry. Algorithmic optimization of paths has led to further reduction in fuel consumption. Intelligent warehousing systems help multimodal transportation to improve inventory turnover. Leading enterprises are leading the green transformation of the industrial chain, with a mature circular economy model, a pallet sharing system with a utilization rate of up to 80%, and a reverse logistics cost ratio of less than 5%. Developed countries are leading the international green logistics rulemaking, exporting technical standards through transnational cooperation projects, and realizing systematic transformation through the triple-helix mechanism of “policy-guided-market-driven-technology-enabled”. In terms of logistics carbon emissions, they have made further progress toward green and low carbon. However, there are some difficulties, such as the mismatch between hydrogen fuel cells and heavy-duty vehicles, insufficient coverage of charging piles or hydrogen refueling stations, slow progress of intelligent transformation, and so on. This study selected representative developed countries for analysis, including the United States, Germany, Singapore, and Japan. The trend of green logistics level in typical developed countries was plotted, as shown in
Figure 5.
As shown in
Figure 5, the level of green logistics in the United States in 2022 was well ahead of other countries, with values above 0.32, indicating a consistent growth trend from 2000 to 2022. According to institutional economics, the United States internalizes environmental externalities through the market signaling mechanism, driving businesses to lower their carbon emissions year after year. Some states have authorized legislation to implement the “total control and trading” strategy, establishing a regional carbon price system and encouraging a doubling of the adoption rate of new energy logistics vehicles. Furthermore, the synergistic effect of industrial policies has been used, with a combination of subsidies for technical research and development, special infrastructure bonds, and tax breaks through the establishment of the twin goal of “smart + environmentally friendly”. United Parcel Service (UPS), a logistics corporation in the United States, has reconfigured its reverse logistics network to incorporate return processing nodes into core hub nodes. It uses an intelligent sorting system and distributed warehousing to deliver an 800% increase in return response efficiency. Simultaneously, it uses standardized reusable package design in conjunction with blockchain traceability technology to track material flow, resulting in a closed loop for packaging lifecycle management. The model transformed the old linear logistics system into a resource-renewable ecosystem that meets the sustainable development goals of the ESG (environmental, social, and governance) strategy framework. However, due to disparities in environmental rules among U.S. states, there was a nearly 41% difference in logistics carbon emission intensity between the Midwest and the coastal regions, and hydrogen vehicles are expensive. The logistics business in the United States still has a lot of space for future improvement in terms of energy efficiency and emission reduction.
Germany’s green logistics level increased from 2000 to 2022, reaching a medium level of 0.0659 to 0.2833. In 2000, Germany legally adopted the Renewable Energy Act, which established set feed-in tariffs for renewable energy power generation in order to support the development of renewable energy sources, such as wind power, solar photovoltaic, and other renewable energy. The 2019 Climate Protection Act implemented a carbon pricing mechanism to reduce logistics carbon emissions to a 144 million-ton inflection point by 2021. Germany’s green logistics growth demonstrates clear policy-driven characteristics. Currently, German third-party logistics companies are under cost pressure due to a 12% freight rate increase, and the falling amount of free carbon permits (down to 30% by 2025) is exacerbating the operational burden. This incremental development validates the environmental Kuznets curve theory, demonstrating that green logistics requires policy and technical collaboration to overcome the tipping point. The EU Carbon Border Adjustment Mechanism (CBAM) and the U.S. Clean Competition Act have different accounting rules. This has resulted in a 15% to 20% rise in compliance expenses for international logistics organizations. Walmart’s cross-border transportation incurs an additional 3% tariff expense due to different requirements.
Singapore’s green logistics level remained high from 2000 to 2022, rising from 0.269 to 0.312. Singapore, being the only developed country in Southeast Asia, has consistently ranked the first in the world in terms of the LPI due to its exceptional geographic hub location and institutional advantages. Singapore’s smart port building, channel optimization system, single-ship berthing, photovoltaic conversion, automated storage centers, and other technical amenities have resulted in a significant reduction in carbon emissions. Currently, there are concerns of universality in green transformation, such as essential technologies like hydrogen heavy trucks dependent on European and American suppliers, as well as insufficient participation of small and medium-sized firms in green equipment conversion.
From 2000 to 2022, Japan’s green logistics level rose from 0.1144 to 0.2731. In 2009, Japan established an environmental load reduction target in the Comprehensive Logistics Policy Outline, and strict limits were imposed by mandating the use of five types of low-emission trucks, among other things. By 2022, the Tokyo metropolitan region had already determined that 90% of its logistics vehicles would meet the most recent emission regulations. The development of major applications, such as pilot hydrogen heavy-duty vehicles, the ECRS principle, and the maritime–railway intelligent connection system, have all resulted in significant reductions in carbon emissions. However, there are regional disparities, technical dependence, and the predicament of small and medium-sized businesses in retrofitting.
Overall, industrialized countries have relatively high levels of green logistics. This is because they have developed policies relating to green logistics to create a policy-driven system. The percentage of practitioners receiving green skills training is high. Logistics companies in wealthy countries can receive green bond funding at low interest rates. The United States, Germany, and other countries have advanced technology and equipment, and they control the core technology of green logistics through patent barriers, so the rate of carbon intensity reduction in developed countries’ logistics industries is much faster than that of developing countries. However, there are certain issues in industrialized countries, such as regional imbalance, a low penetration rate of green logistics facilities, and small and medium-sized logistics firms suffering exorbitant expenses due to green transformation.
5.2. Comparative Analysis of Green Logistics Levels in Developing Countries
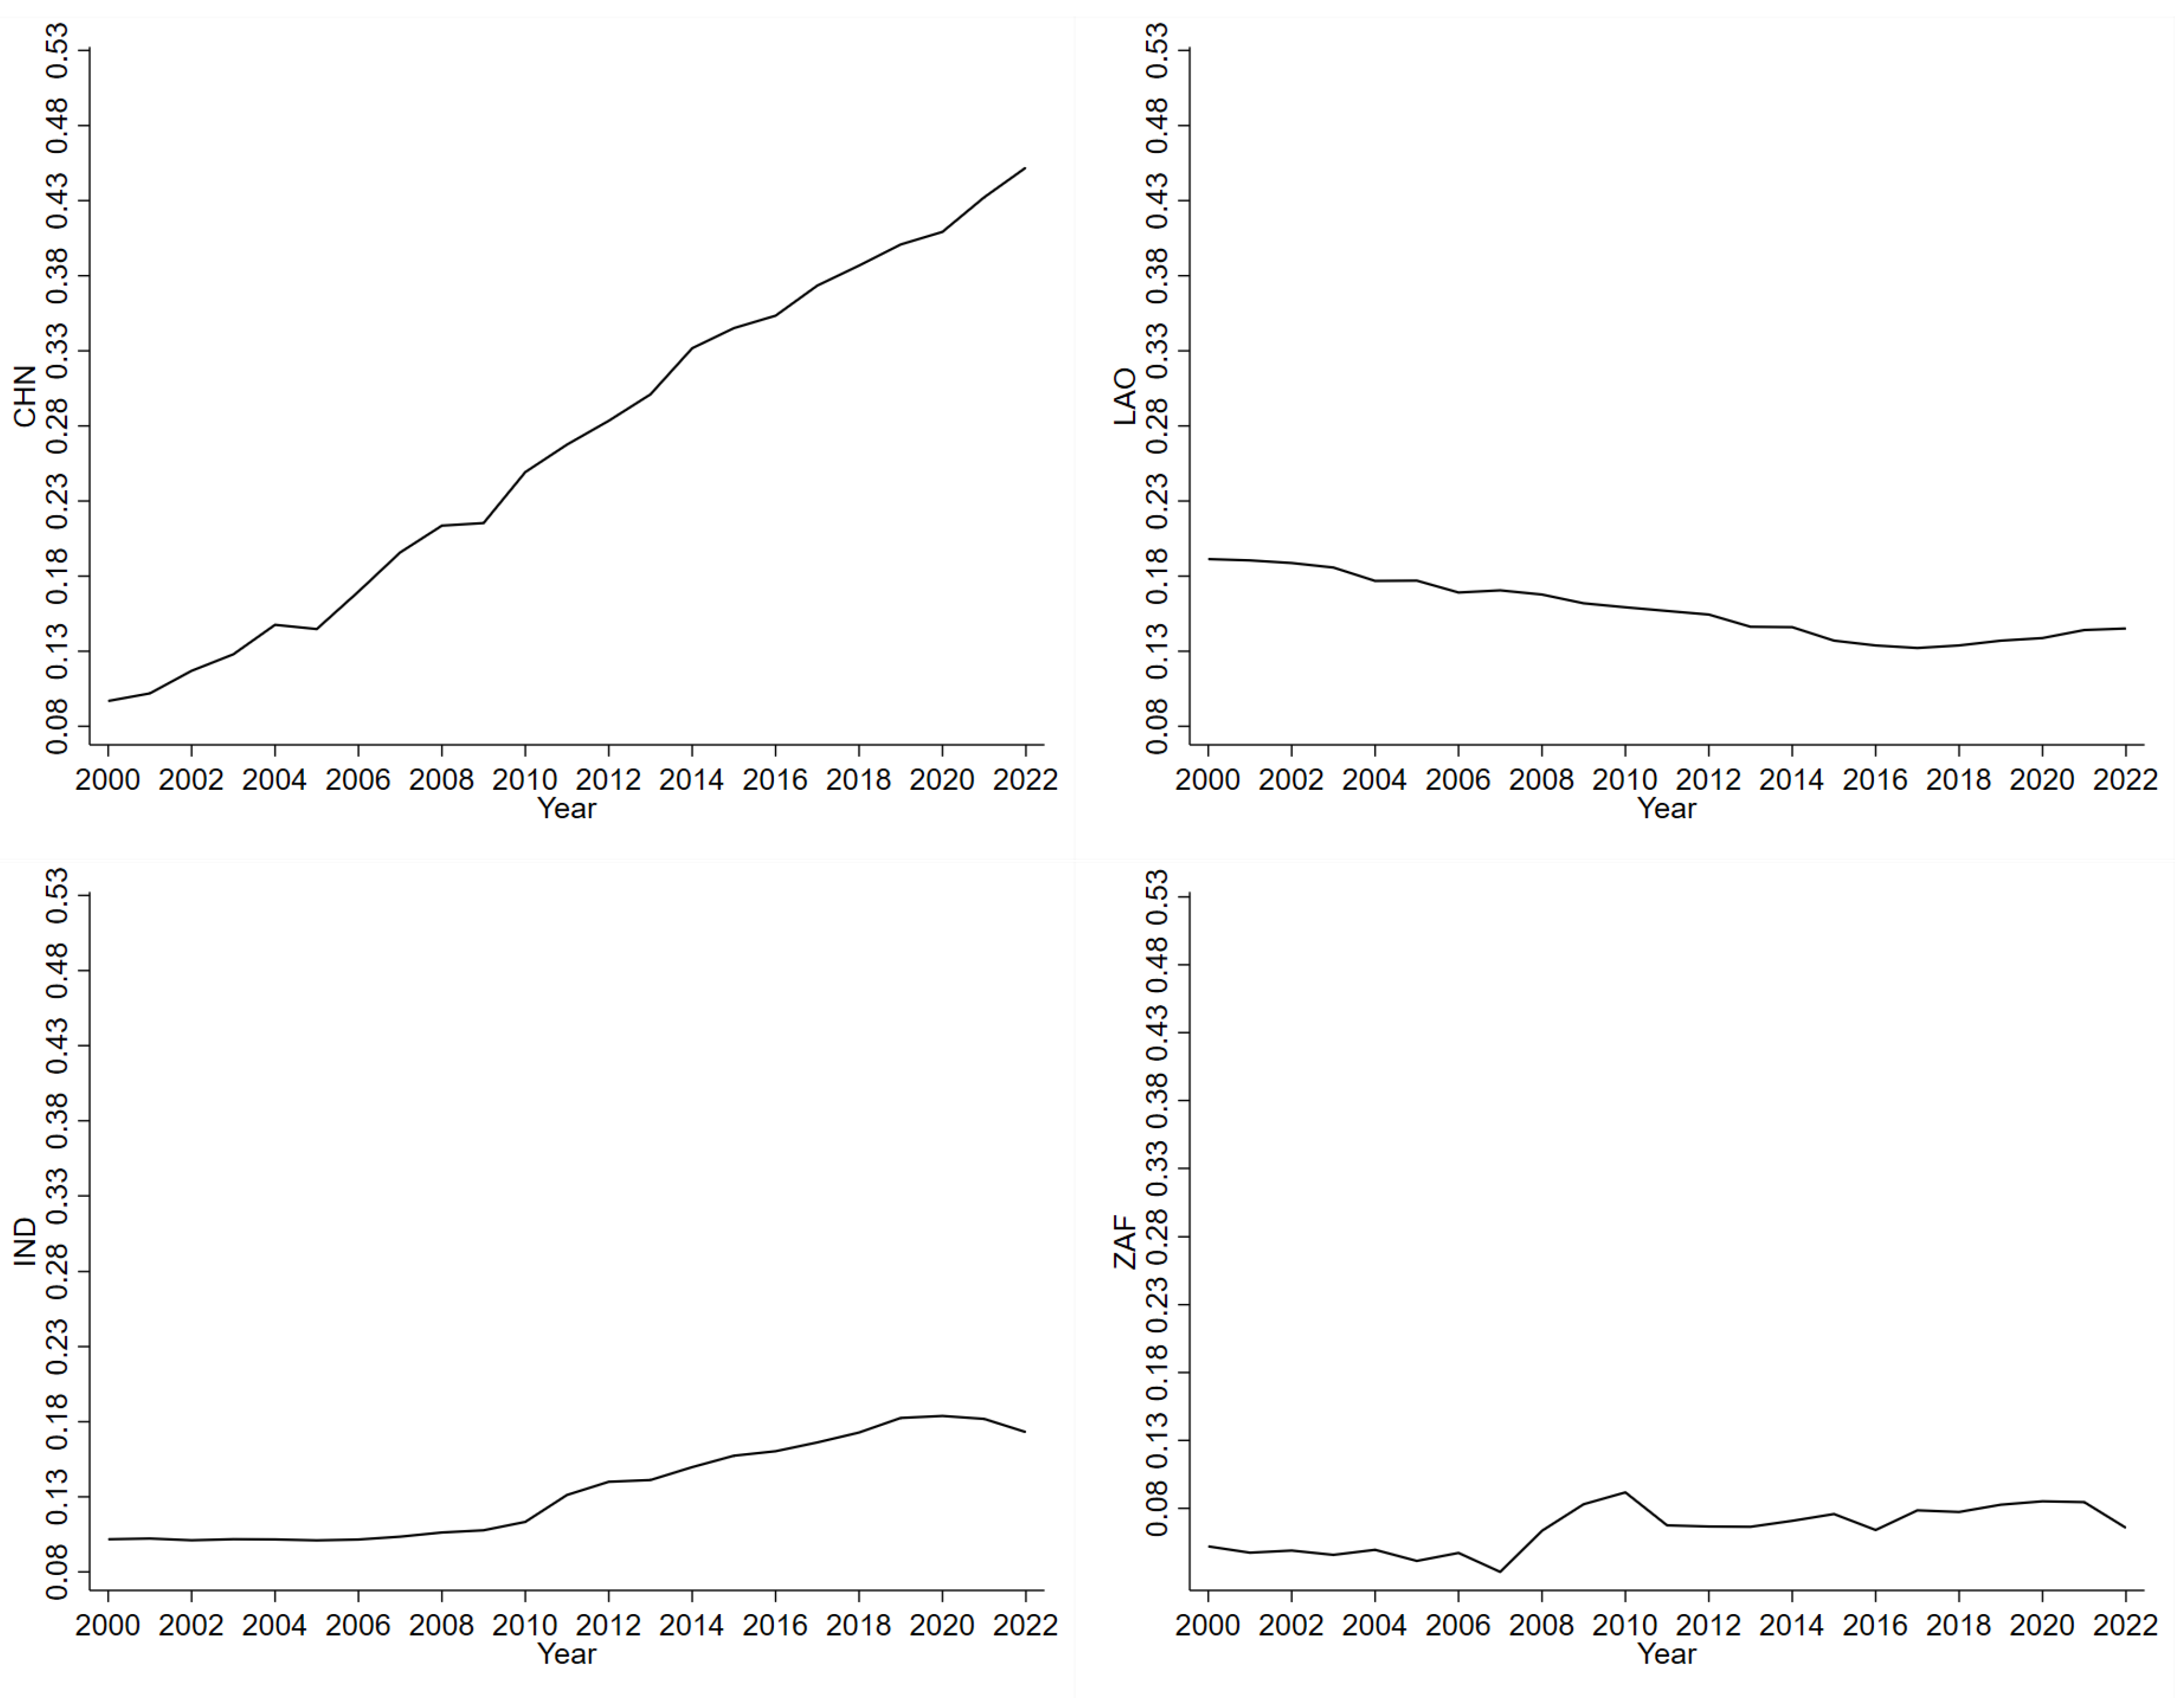
Developing countries lack unified green logistics standards, have poorly designed policies, face challenges in establishing logistics infrastructure, and have inefficient cross-sectoral cooperation. Their primary logistics technology and equipment are imported, and automation equipment and logistics information platforms have poor penetration rates. Furthermore, the utilization rate of new energy vehicle inputs is low, and the charging piles and other supporting facilities are not distributed evenly. These constraints have made green transformation difficult for certain small and medium-sized firms, which continue to employ outdated, energy-intensive equipment. Logistics costs remain high across society, and lowering carbon emissions from logistics poses significant hurdles. However, some developing nations, such as China, have actively developed green and low-carbon regulations and methodically guided firms to construct environmental management systems in order to achieve green and digital transformation. This study selected representative developed countries for analysis, including China, Laos, India, and South Africa. The trend of the level of green logistics in typical developing countries was plotted, as shown in
Figure 6.
As shown in
Figure 6, China’s green logistics level grew linearly and continuously from 2000 to 2022, rising to the world’s top spot in 2022 with a value of 0.4520 from 0.0969. China introduced the concept of green logistics in 2009 as part of its Adjustment and Revitalization Plan for the Logistics Industry. In recent years, China has reduced carbon emissions by implementing fuel consumption limit standards for operational trucks, introducing a policy to subsidize the purchase of new energy vehicles, launching pilot green logistics cities, and establishing a carbon accounting system for the logistics industry. China has made significant technological advancements. Heavy trucks powered by electricity have increased their operating mileage by 40% in a single day. Photovoltaic roofs, along with AGV robots’ dynamic path planning algorithms, significantly improve green power self-sufficiency and sorting efficiencies. Blockchain traceability technology covers more than 90% of cold chain operations, with a carbon footprint traceability accuracy of 98%. The green logistics software optimizes the shipping path, reducing carbon emissions by around 120,000 tons each year. However, China’s green logistics development is currently hampered by regional development imbalances, hydrogen heavy-duty trucks with a lower electric stack life than international standards, the reliance on imports for cold chain logistics core materials, and the high cost of green packaging.
The level of green logistics in Laos fell between 2000 and 2017, but increased after 2017, with the value rising from 0.1914 to 0.1451. Prior to 2017, Laos relied on traditional fuel transportation for its logistics energy mix because of inadequate infrastructure and technology. Its cross-border logistical clearance was inefficient, bulk commodities shipping was the norm, and environmental investment was consistently low. After 2017, Laos actively participated in the Belt and Road Initiative, and with the building of the new western land and sea route, cross-border rail transportation’s carbon emission intensity was lowered by 28% compared to roadways. The China–Laos Railway, which opened in 2021, incorporated China’s intelligent logistics management system, cutting idling by 19%. Laos has joined the RCEP mechanism for mutual recognition of regional environmental norms, and its cross-border commodities packaging recycling rate has risen to 42%. Despite improvements in green logistics, Laos continues to face challenges, such as contradictions in new energy transformation, insufficient financing for green transformation, and a lack of regional synergy.
India’s level of green logistics was low prior to 2010, but has since improved, with the value rising from 0.1017 to 0.1731. India’s infrastructure is underperforming, high-carbon emission diesel trucks dominate the market, there has been a long-standing lack of comprehensive environmental protection rules, there are few multimodal hubs, and cold chain logistics losses are substantial. This has resulted in low levels of green logistics in India. In recent years, the implementation of Green Logistics Certification, the commissioning of the automated terminal at the Mumbai port, the construction of solar-powered warehousing facilities, and the popularization of new energy logistics vehicles have all helped to reduce the logistics industry’s carbon emissions. Currently, India is dealing with cross-border logistics issues based on high-carbon maritime transportation, regional development imbalances, and a low penetration rate of low-carbon technologies and equipment.
Between 2000 and 2022, South Africa’s level of green logistics was consistently low. The value changed from 0.0519 to 0.0656 near the end of the world’s main countries’ ranking. It has a competitive advantage in Africa’s financial and logistics sectors. It is a resource-dependent economy, with mining accounting for more than 30% of the GDP for many years. Commodity transportation is based on high-carbon diesel trucks, which account for 65% of the total freight. South Africa’s industrial sector is weak, and the local green packaging business is small. South Africa’s railroad development is not flawless, with too much reliance on public transportation and ineffective policies.
Overall, developing countries have a low-to-medium degree of green logistics. This is due to developing countries facing similar issues, such as technology dependency, financial discrimination, unequal access to green skills training, inadequate infrastructure, and lagging legislation. High license fees for technology transfer further impede the spread of sustainable technologies. The cost of funding green bonds in developing countries is three times that of developed countries. International financial institutions practice “carbon discrimination” against impoverished countries. The availability of green skills training for practitioners is limited, and the content of the training lags behind the actual rate of technological innovation. These structural disparities have produced a vicious cycle in the development of green logistics in developing nations, trapping them in a “high-carbon lock-in.”
6. Spatial–Temporal Evolution Analysis of Green Logistics Level
The current level of green logistics in various countries and at what stage of development remains to be discussed. Especially since the 21st century, in the era of digital economy, what are the evolutionary characteristics of logistics development in various countries? Based on this, this paper deeply discussed the spatial and temporal evolution characteristics of the green logistics level, analyzed from two aspects of time and space, selected typical countries for comparative analysis, excavated the logic behind it, and enriched the theoretical basis for the development of green logistics in various countries.
6.1. Analysis of Time Evolution Characteristics of Green Logistics Level
Table 4 shows that the yearly average value for 51 nations was 0.1217, and the regional averages for 2000 and 2022 were 0.0962 and 0.1295, respectively, demonstrating that the logistics industry as a whole is rapidly transitioning to green and low-carbon. This is closely related to the changes brought about by information technology advancements, the increase in the level of logistics informatization, intelligence, and standardization, and the establishment of a modern logistics system that is socialized, specialized, informatized, and low carbon. The highest value was in the United States, with 0.3246 and 0.5929 in 2000 and 2022, respectively, while Myanmar’s MMR had the lowest value, with 0.055 in 2022. This demonstrates that there is a significant discrepancy between countries. The United States, as a representative of developed countries, has an extremely developed logistics industry and is in a leading position in the world. Developing countries, such as Myanmar, were previously at a low level of green logistics development due to imperfect infrastructures, relatively backward technologies, and a lack of specialized talents in logistics science and technology research and development.
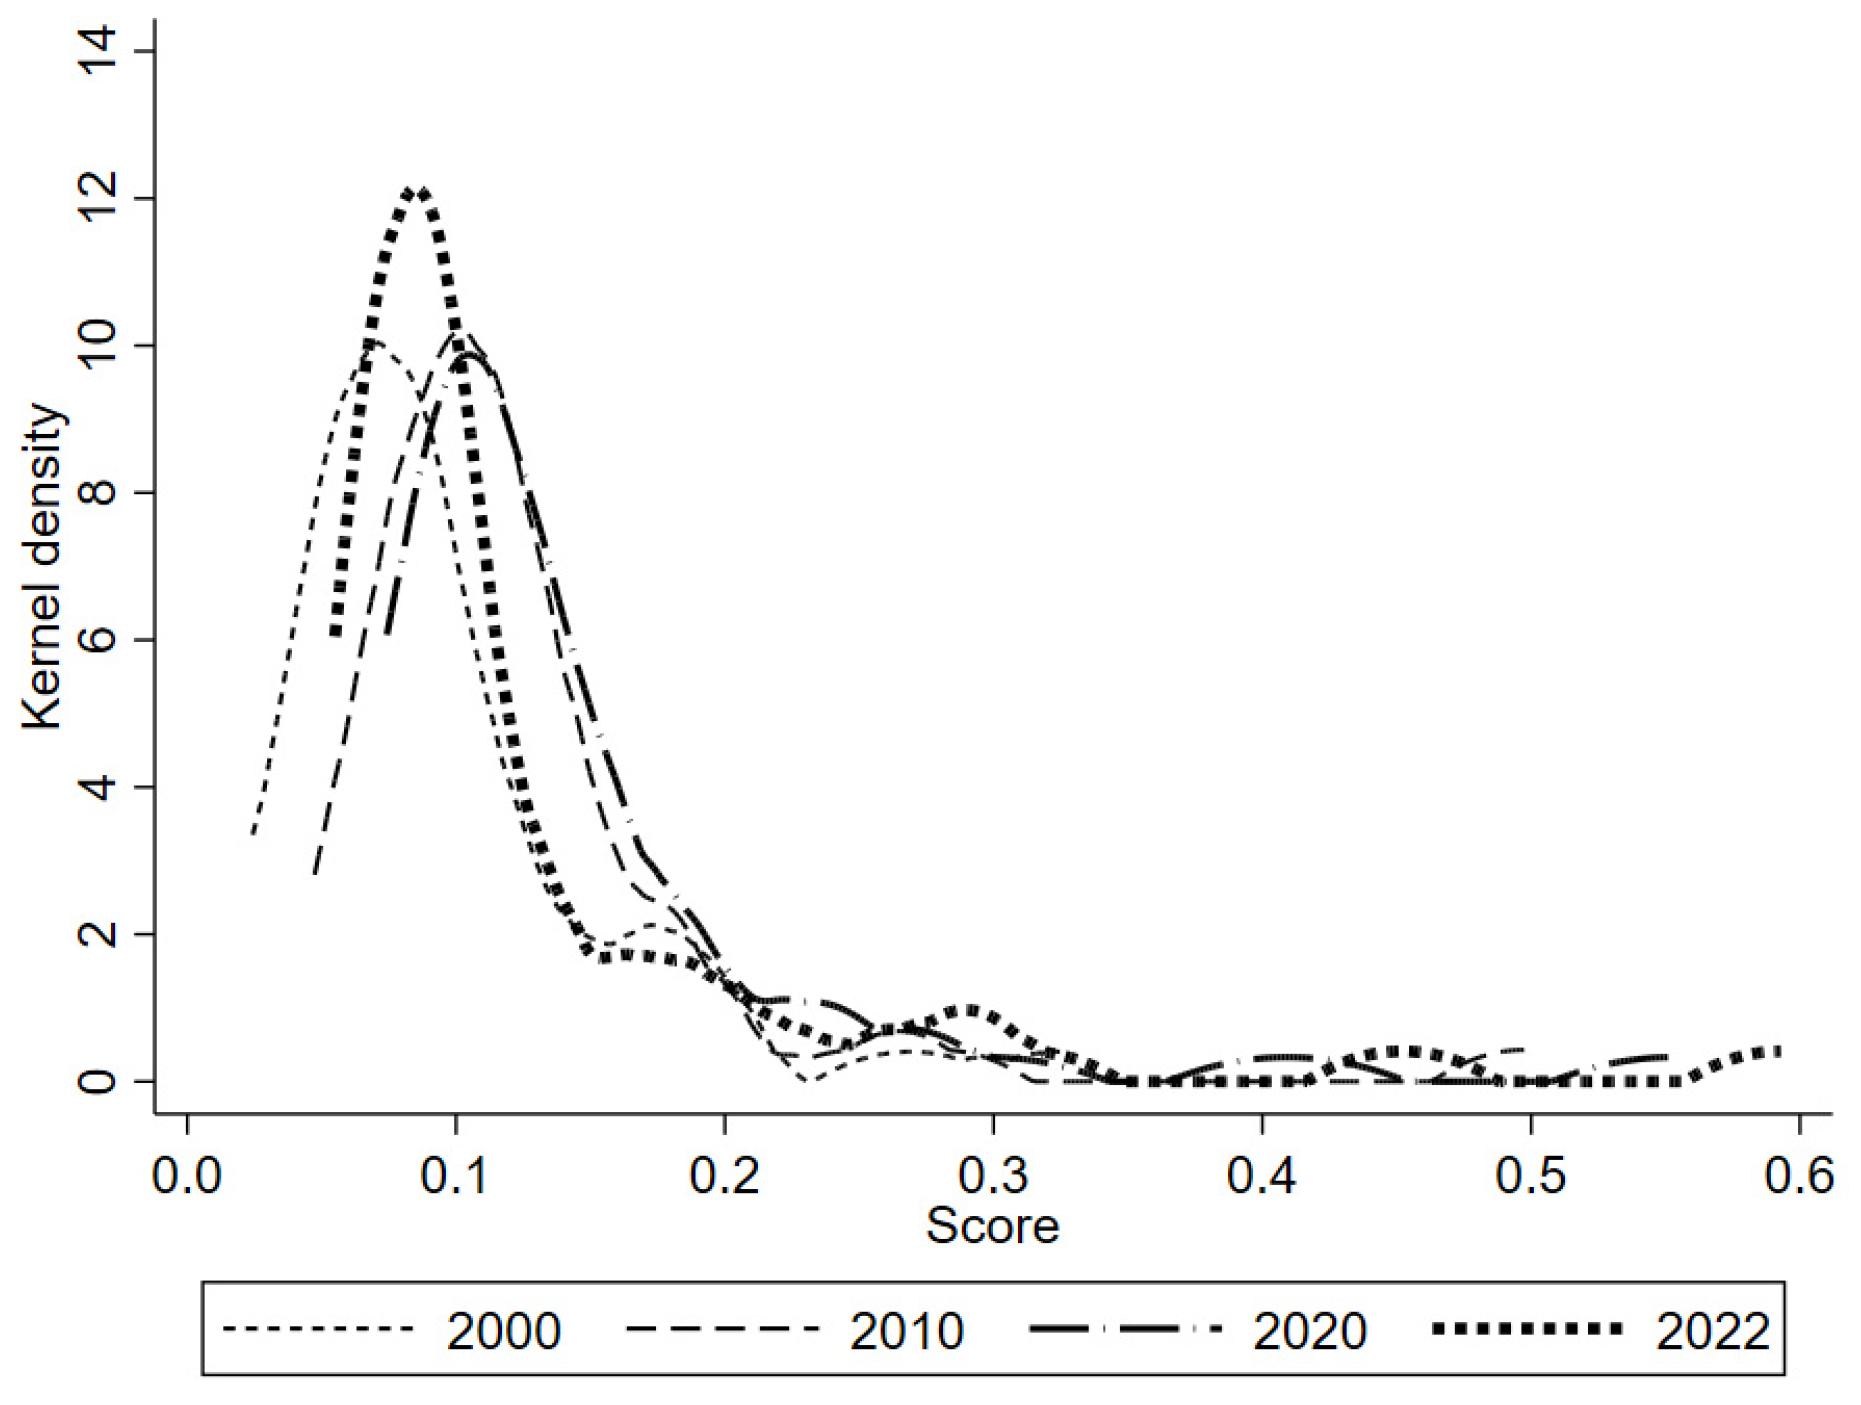
The measurement data from 2000, 2010, 2020, and 2022 were selected to draw the kernel density distribution of green logistics level from 2000 to 2022, as shown in
Figure 7. From the perspective of time, the kernel density function moved backward with time from 2000 to 2022, indicating that the global green logistics level was increasing year by year. The kernel density of the green logistics development level was distributed on the right side, and there was a maximum value, such as the United States, Singapore, China, Malta, and so on. The kernel density curve changed from a single-peak shape in 2000 to a single-peak shape in 2022, with the peak of the wave shifting to the right from 2000 to 2020 and to the left from 2020 to 2022, with the height of the wave shifting upwards and the width of the wave narrowing, and with the height and width of the wave displaying an “I” shape. This suggests that the gap between countries’ levels of green logistics will gradually expand, with significant polarization occurring between 2000 and 2020. The wave’s height was about identical from 2010 to 2020, and it was increasing year after year. This implies that after 2020, there will be fewer nations with low levels of green logistics, and that low-level countries will prefer to rise to high levels of green logistics development.
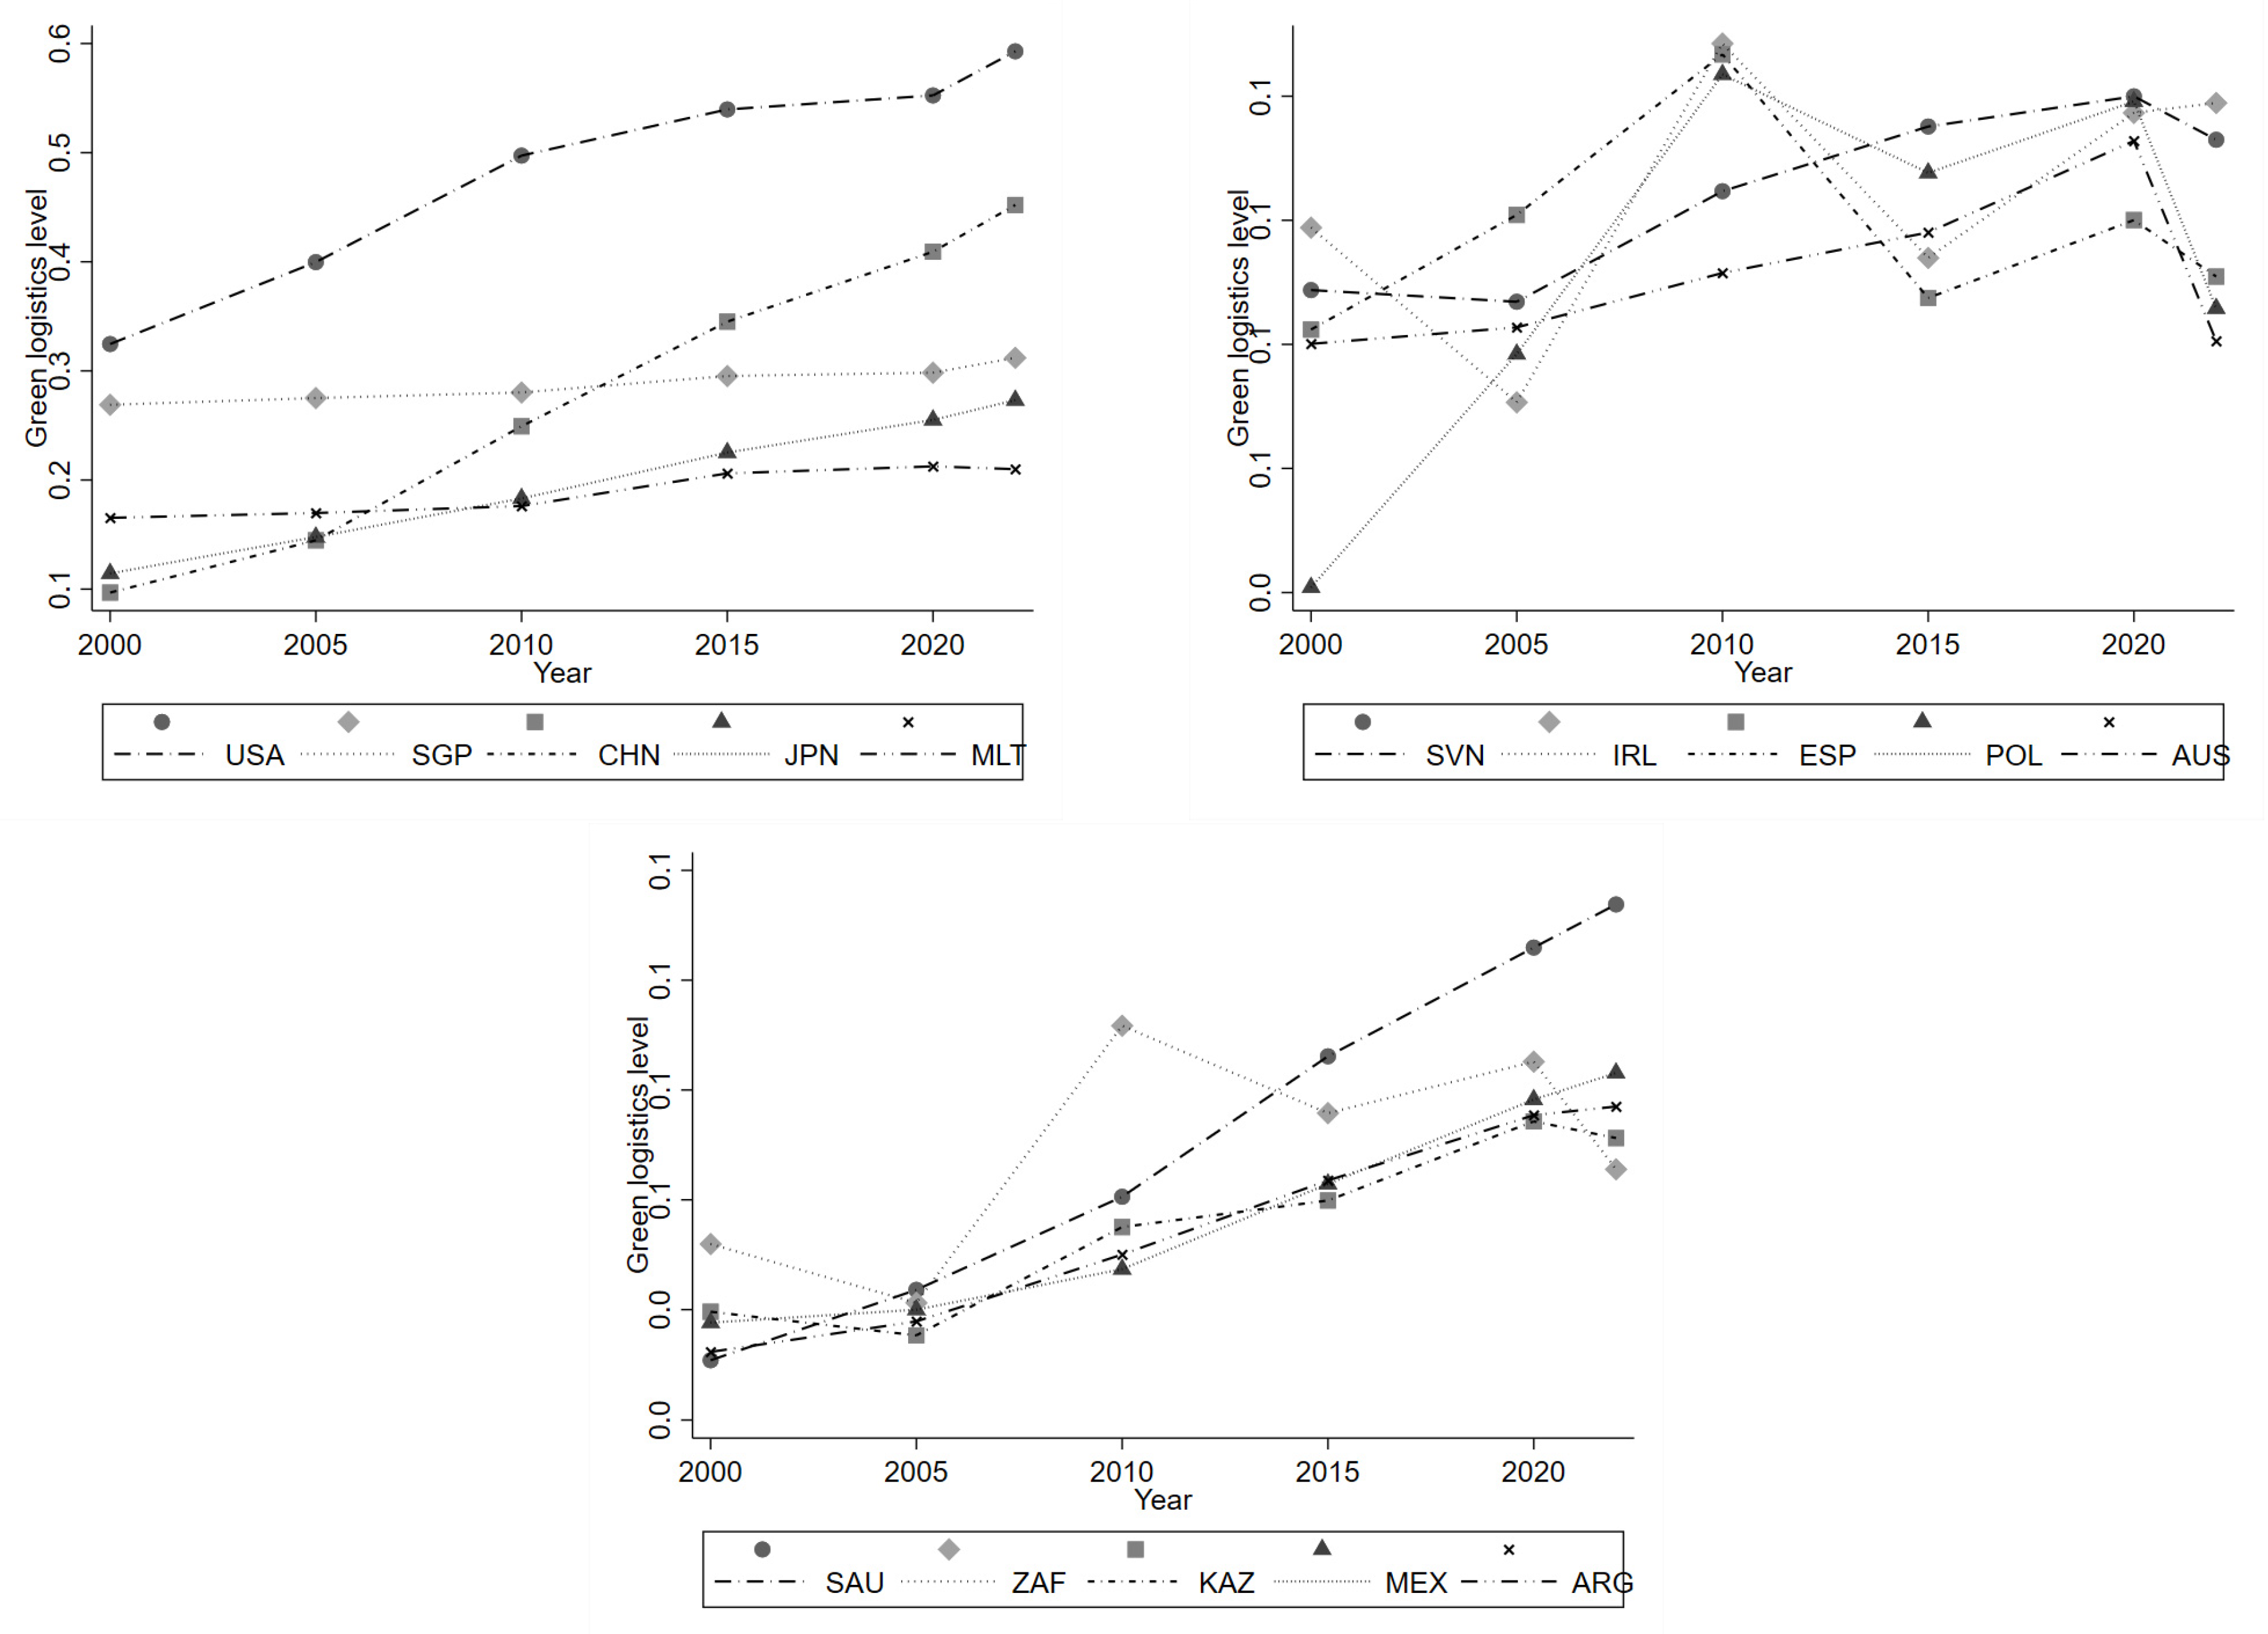
In this study, data from the top five (USA, SGP, CHN, JPN, and MLT), middle five (SVN, IRL, ESP, POL, and AUS), and lowest five (SAU, ZAF, KAZ, MEX, and ARG) countries ranked in terms of green logistics level were selected in order of their annual means, and the time trend was plotted, as shown in
Figure 8. When comparing country development trends, it is clear that the United States’ green logistics level of growth has been rising year after year, and it has held the lead. China is in the top five countries, from the lowest level of rapid leap to the second-highest level, with a clear latecomer advantage. Poland has made the most progress among the five countries in the middle of the scale, while the other countries’ levels of green logistics vary considerably. Among the five countries at the bottom of the green logistics rankings, Saudi Arabia has the most significant improvement. In addition to Mexico, several other countries have seen considerable improvements. Mexico had a significant increase in 2010 but fell year after year after 2010, which might be attributed to contradictory trade policies, structural imbalances in the economy, railroad network deterioration, technical lags, and competitive imbalances in international commerce, among other factors.
6.2. Analysis of Spatial Evolution Characteristics of Green Logistics Level
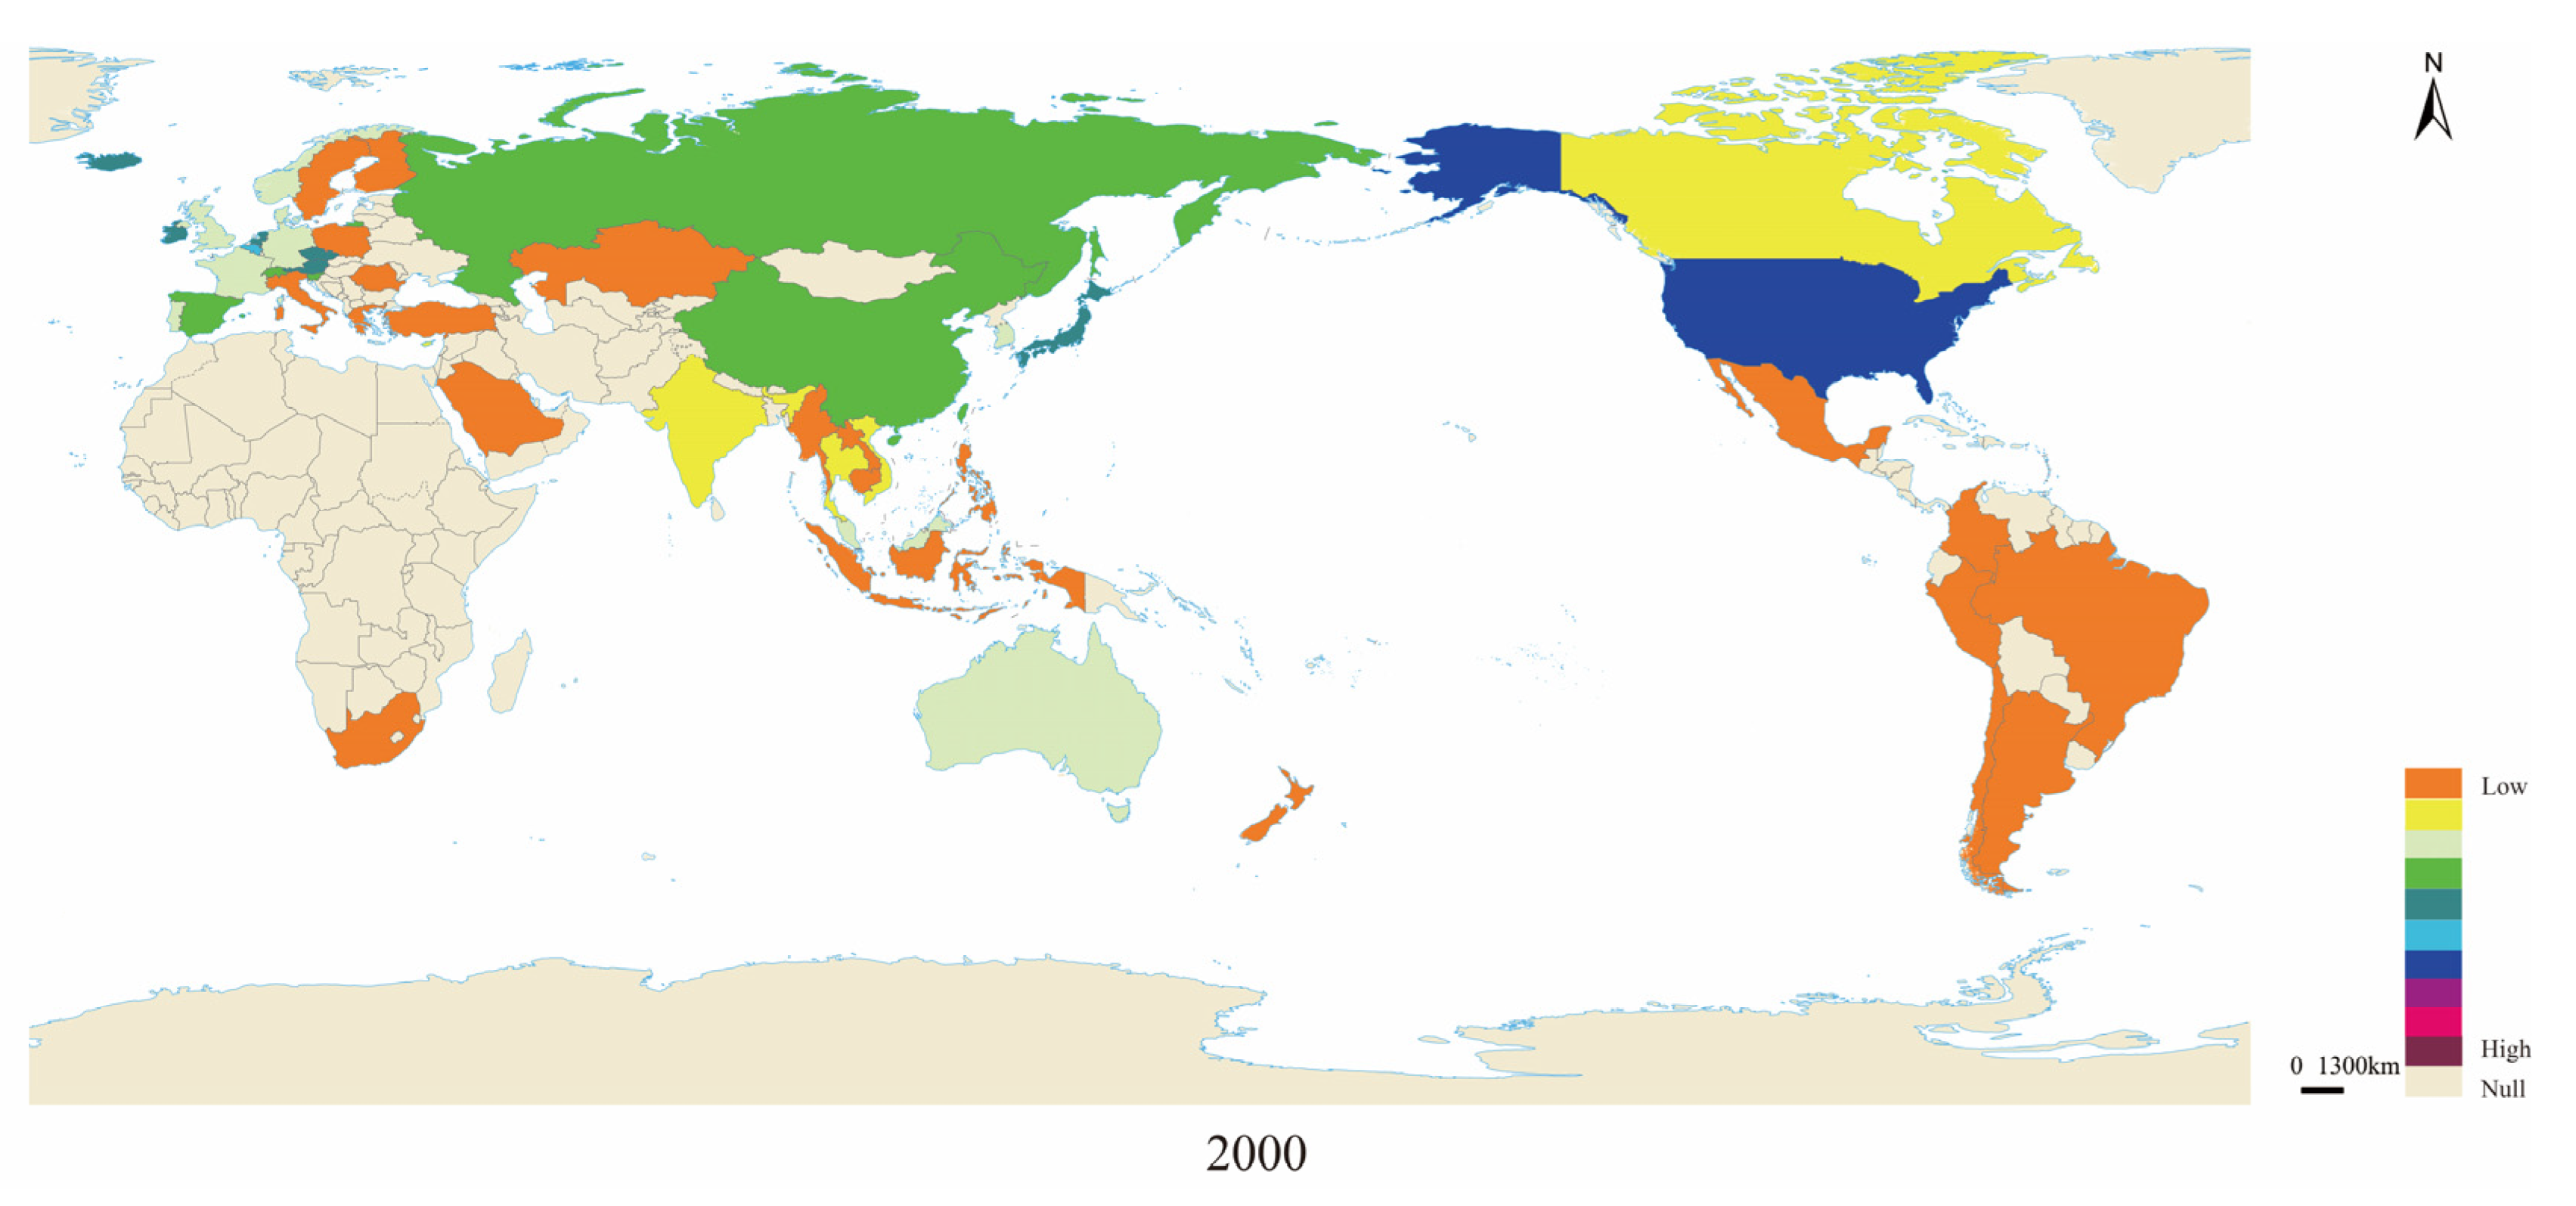
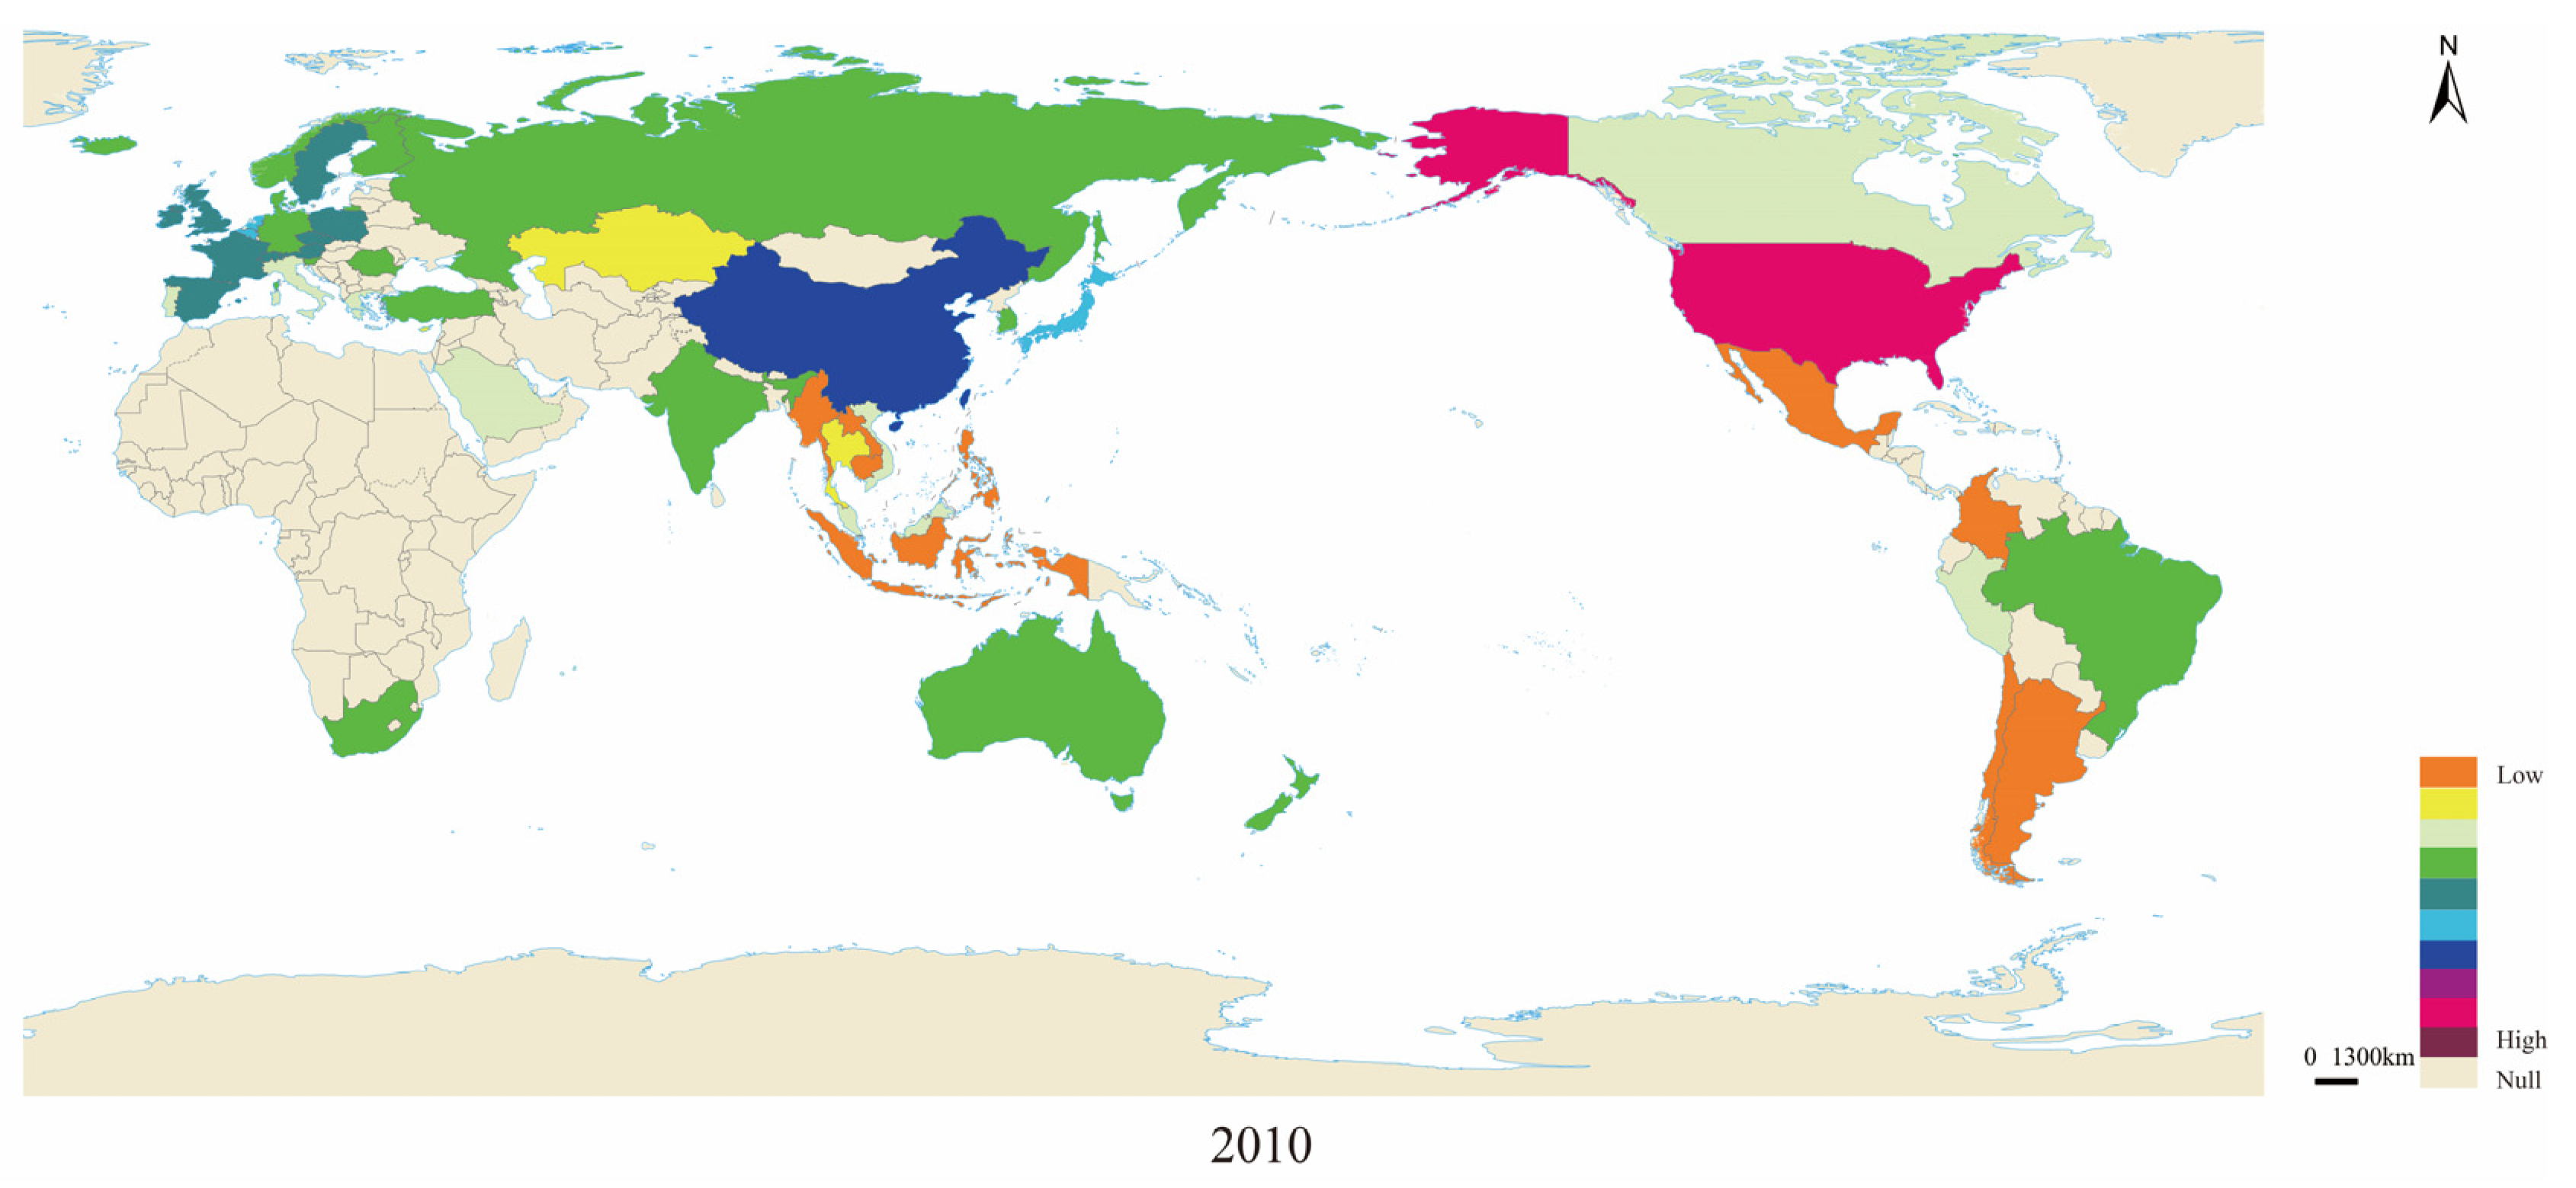
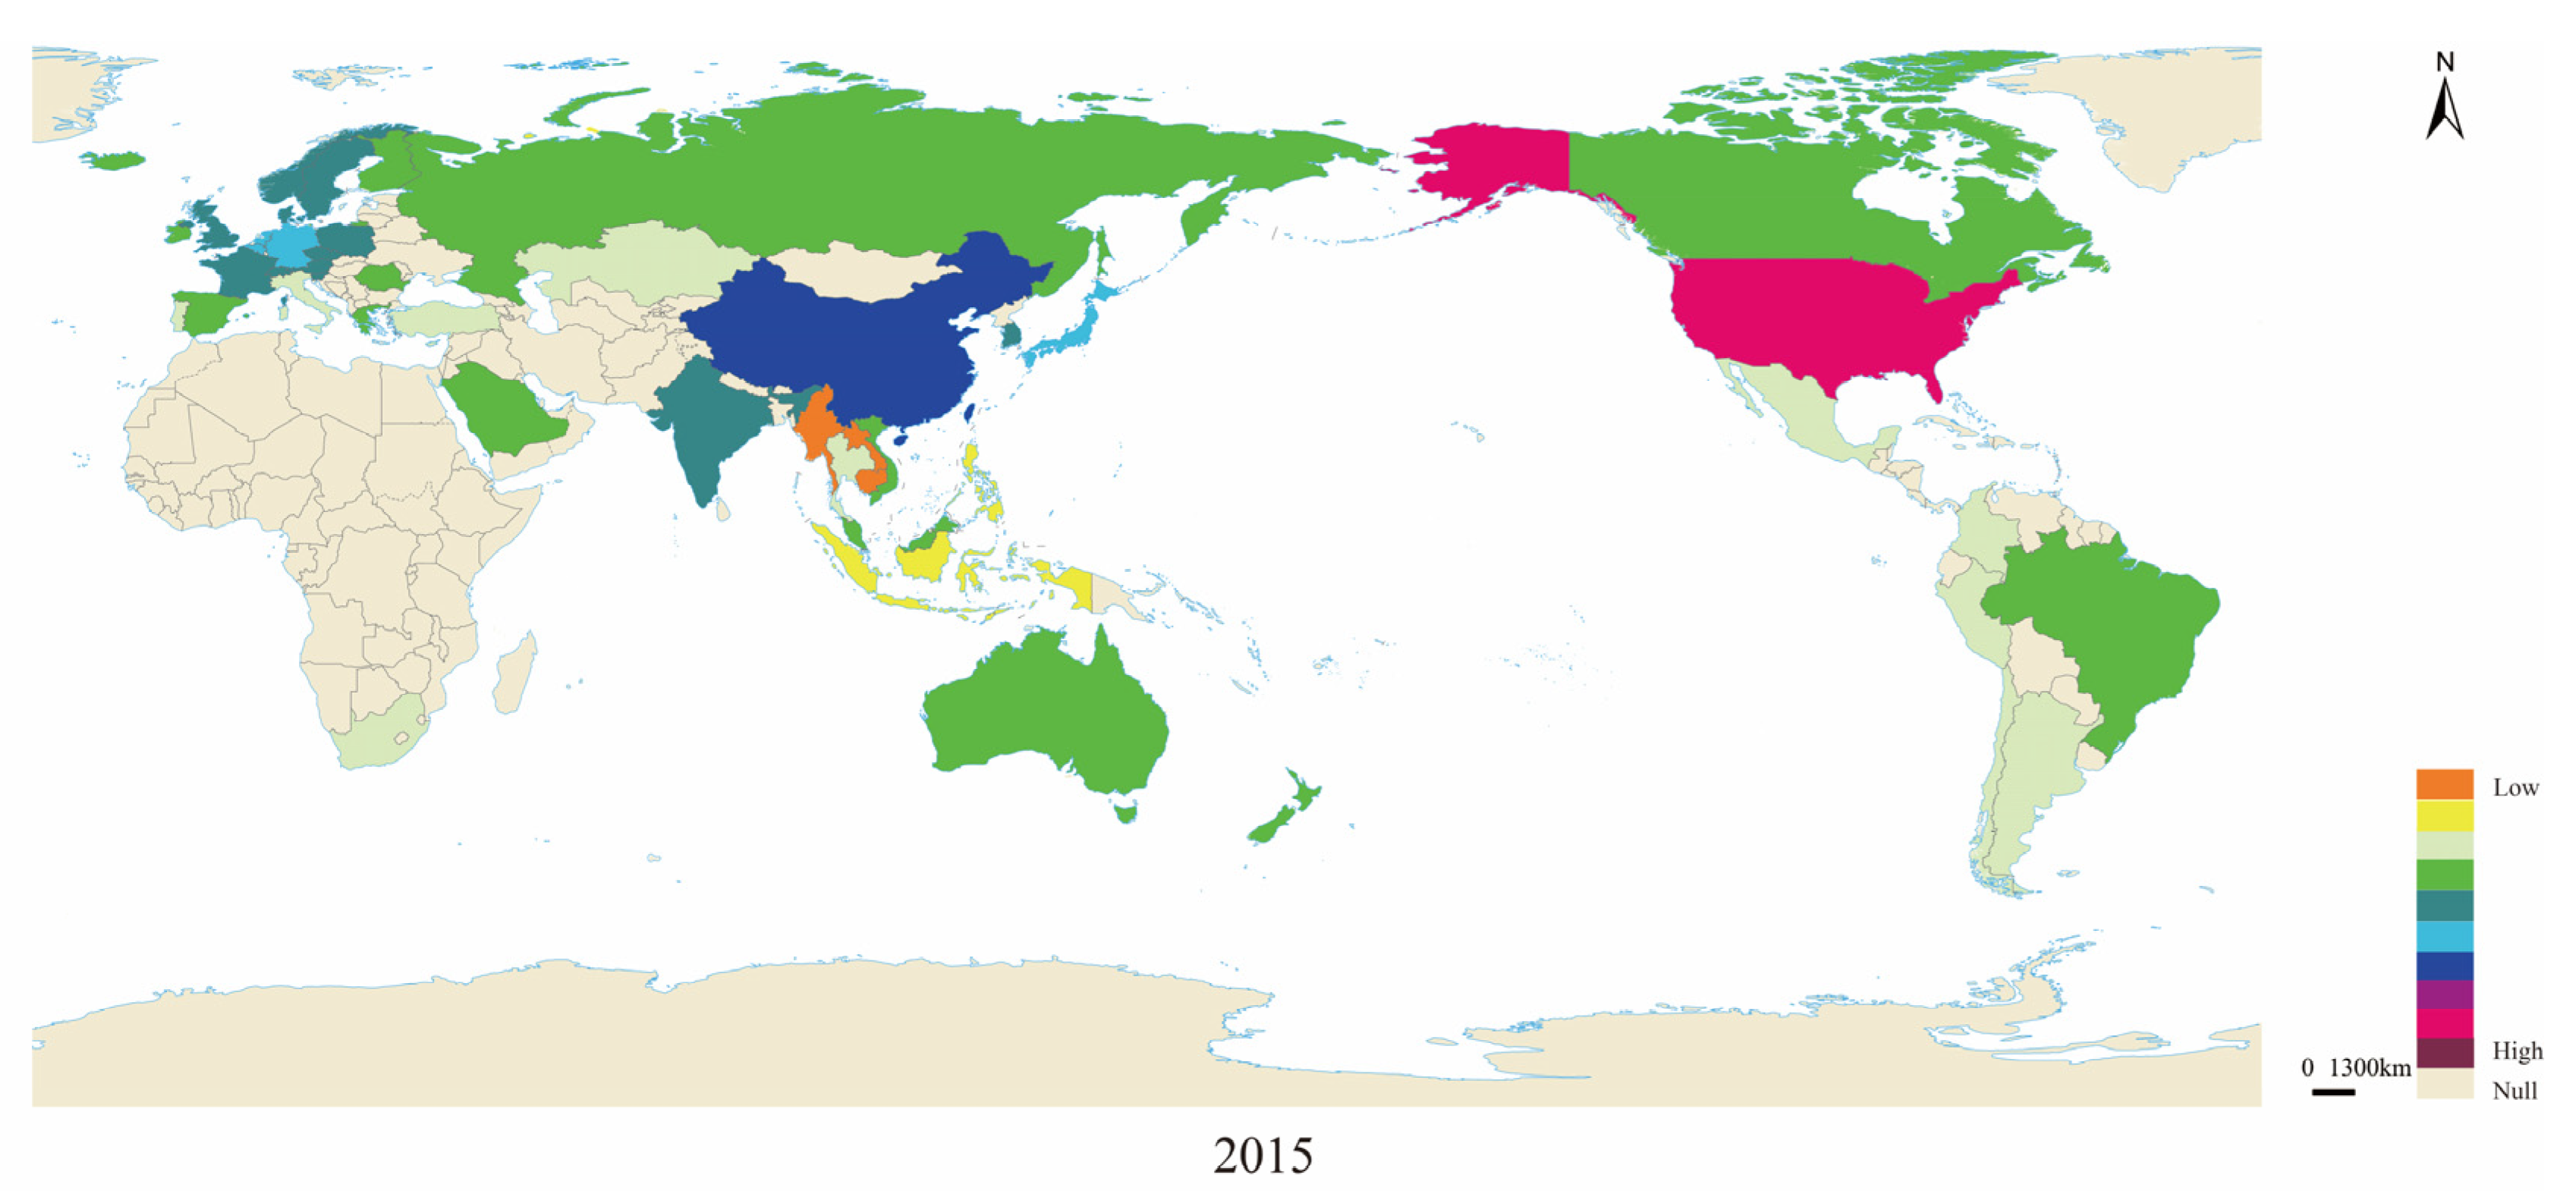
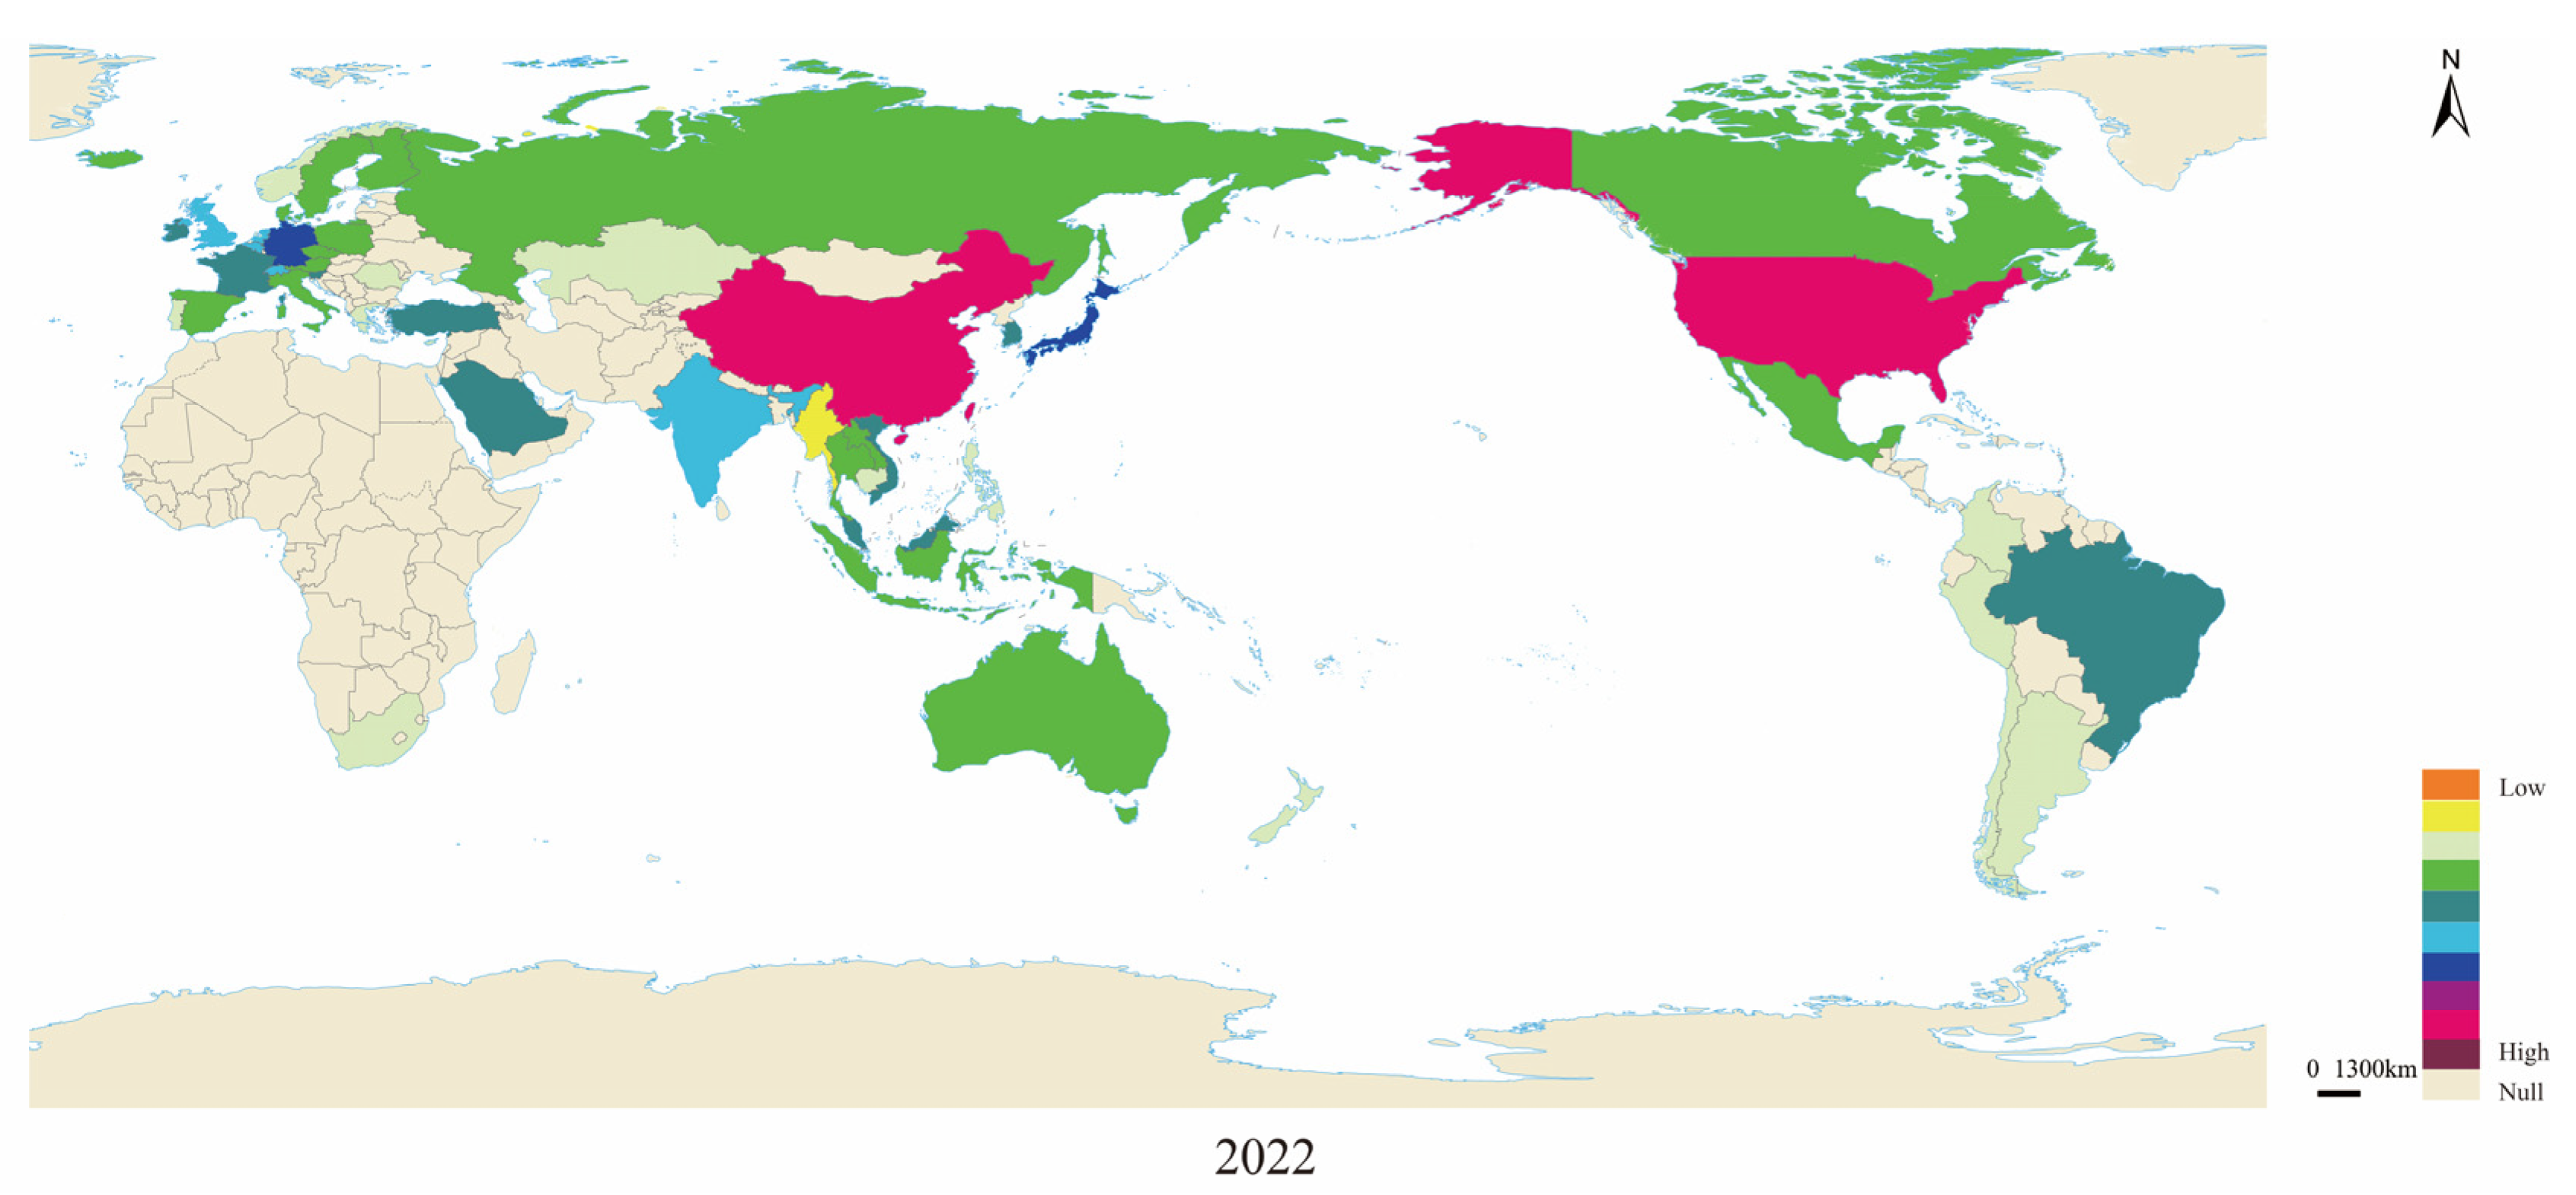
The measurement results of 2000, 2010, 2015, and 2022 were selected, and the green logistics level was divided into 10 categories (0–1) according to the data characteristics and used as the judgment standard of the country’s green logistics development level. Adobe Illustrator 2022 software was used to draw the spatial evolution path map of the green logistics level in major countries in the world, as shown in
Figure 9,
Figure 10,
Figure 11 and
Figure 12. After 23 years of development and evolution of the global logistics industry, the number of countries with extremely low levels of green logistics decreased from 9 to 0, while the number of countries with medium-to-high levels increased from 16 to 21. The number of countries with a somewhat high to extremely high level rose from 2 to 5. On every continent, most countries have modest levels of green logistics. In 2022, most countries’ green logistics levels were expected to decline slightly. This could be related to the COVID-19 pandemic, but the overall green and low-carbon trend in the global logistics industry remained unchanged. During the study sample period, the green logistics level regions in Europe, Asia, the Americas, and Africa were as follows:
① South and North America and Oceania. In 2000, the regional average for green logistics in North and South America was in the lower-middle range, and it was in the upper-middle range between 2010 and 2022. Among them, the green logistics in the United States was at a high level in 2000 and at a very high level in 2010–2022. This is closely related to the development environment, infrastructure improvement, and natural resource conditions of the logistics industry in the United States. In addition, the third-party logistics operation and management level was relatively advanced, and the integrated logistics management system was implemented. The government supported the advanced information technology platform, attached importance to the low-carbon development of logistics, and actively cooperated with specialized logistics enterprises, which promoted the efficiency of logistics operation and the optimization of logistics costs in the United States. Compared with other countries in the Americas, the level of logistics development in the United States was greatly in a leading position. The green logistics of Australia and New Zealand in Oceania was at a low level in 2000, entered the middle and lower level in 2010, and Australia entered the middle and upper level in 2020, but declined in 2022.
② Asia. Green logistics in Asia was in the upper-medium range from 2000 to 2015, and it reached a pretty high level in 2020–2022. The regional average is increasing year by year. From 2000 to 2022, Singapore’s green logistics development was at a somewhat high level. The annual average was the highest in Asia and was in a leading position in the world. Because it is in the Strait of Malacca, it has a superior geographical location, has a modern land and air transportation network, and vigorously builds logistics infrastructure. Using advanced new automation technologies, such as warehousing and sorting, customs clearance processes are efficient and cross-border trade opportunities are abundant, making Singapore the world’s largest logistics center. China, the world’s second largest country by land size, has seen its green logistics development rise year after year, from a lower-middle level in 2000 to a comparatively high level between 2010 and 2015, and then to a very high level in 2020. Since the connection of the “five vertical and seven horizontal” national trunk lines in 2007 greatly promoted the high-quality development of the logistics industry, the road density was at a medium level in the samples examined. With the popularization of the 4G network in China in 2014, the logistics demand and freight capacity have increased year by year, the infrastructure has been further improved, and more new logistics technologies have been developed and put into use. The level of green logistics in China has been raised to the upper-middle level, which has effectively played a late-mover advantage. After the opening of the China–Laos railway at the end of 2021, it has greatly reduced the transportation cost of the industry and promoted the prosperity and development of cross-border trade and logistics between the two countries. Japan’s logistics development was at a medium level until 2010, and at a somewhat high level by 2020. Japan’s logistics industry has flourished in the last century, with a multichannel and multiform modern logistics system network. Since the 21st century, many logistics companies have built a huge logistics network with railway, aviation, and shipping companies, which has greatly promoted the development of logistics industry and management methods.
③ Europe and Africa. Green logistics development in Europe was at a low level in 2000, but after ten years, it reached an upper medium level between 2000 and 2022. The regional average is increasing year by year. Malta and Belgium were at a relatively high level of green logistics development in 2000–2022. Germany reached a somewhat high level of green logistics development in 2022. This is because its international logistics companies have developed rapidly, mastered core logistics technologies and management methods, and are in coastal areas, with multiple ports and important distribution hubs. Countries with Britain, France, Germany, and Switzerland as the core have formed a stable centralized transportation system structure, combining ports with air and land transportation on the European continent. The integration of regional logistics networks has gradually strengthened the relationship between coastal ports, indicating that the intermodal logistics network under regional cooperation can obtain greater competitiveness. It requires better infrastructure, stronger logistics technology innovation capabilities, and an expanded industrial scale. South Africa, as Africa’s most developed metropolis and the home of the African logistics industry, was at a very low level of development in 2000, a lower-middle level in 2010, and experienced multiple unstable oscillations in the degree of development of green logistics between 2015 and 2022.
7. Conclusions
The worldwide environmental situation is becoming more severe. To address climate change and achieve the goals of green, low-carbon, and sustainable development, this study assessed the level of green logistics and provided a theoretical foundation for countries to build specialized solutions. The study developed a multidimensional assessment index method for the green logistics level. The study selected 51 major economies worldwide from 2000 to 2022 as the research subjects. The cloud model–entropy value–TOPSIS method was applied to measure the green logistics level. The results of the green logistics level were analyzed from the perspectives of developed and developing countries, and their spatiotemporal evolution characteristics were explored. The conclusions were as follows:
(1) From the perspective of developed countries, the level of green logistics was relatively high. Policy-driven systems, extensive coverage of green skills training, low-interest rate green bond financing, and core green logistics technology have all contributed to developed countries’ strong position. However, there are several issues, such as regional imbalances, limited penetration rates, and large environmental costs.
(2) From the perspective of developing countries, they had low to medium levels of green logistics. Structural disparities, such as technical reliance, finance discrimination, unequal access to green skills training, inadequate infrastructure, and lagging regulations, have trapped developing countries in a “high-carbon lock-in”.
(3) From the perspective of time, the level of green logistics in the world is on the rise year by year. The United States leads the globe in green logistics, with an increasing trend year after year, China is rapidly catching up, with a distinct advantage as a latecomer, and developing countries, such as Myanmar, were previously at a low level. The global distribution of the kernel density of green logistics levels was right-skewed, with extremely large values in the United States, Singapore, China, and Malta. The peak of the kernel density curve had an “I” shape, and the change process revealed that from 2000 to 2020, the difference in green logistics levels between nations gradually widened, resulting in significant polarization. After 2020, the gap between each country’s levels reduced year by year, with nations with low levels of green logistics development tending to rise to high levels.
(4) From the spatial perspective, the green logistics level in each country showed a rising trend year by year vertically, while the horizontal disparity between countries was enormous. After 23 years of development and evolution in the global logistics industry, all countries with extremely low levels of green logistics had improved. The rapid increase in the number of countries with medium to high levels, as well as the three-fold increase in the number of countries with high levels, suggested that the worldwide level of green logistics is improving. In 2022, the majority of countries across all continents were at low levels. Most countries showed a slight decrease in green logistics levels in 2022, probably due to the COVID-19 pandemic, but the overall green and low-carbon trend in the global logistics industry remained unchanged. In terms of annual regional averages, all continents fell into the upper-middle range, with Asia leading the way in green logistics growth, whereas development between continents was highly uneven.
The above conclusions show that the carbon emission intensity of developed countries was much lower than that of developing countries, despite the fact that the number of developing countries is much greater than that of developed countries, and that only by promoting the realization of a green and low-carbon transition in developing countries can we truly achieve sustainable development. This report makes recommendations about boosting technology transfer, giving financial support, strengthening international cooperation, and developing green infrastructure.
- (1)
Boosting technology transfer and giving financial support
Technology transfer and innovation support is necessary. Creating a South–South technology sharing platform and encouraging developed countries to openly license fundamental innovations, such as hydrogen-fueled cold chain equipment and intelligent routing algorithms, via the United Nations Development Program patent pool could be helpful. Companies in poor nations could pay royalties based on a percentage of their revenue. It would be helpful to create technology demonstration facilities in major cities and provide hands-on training, such as photovoltaic storage system integration, as well as accelerate the industrialization and adoption of low-carbon technology. Further, it is important to reduce R&D expenses with government subsidies, concentrate on breakthroughs in cutting-edge technologies, like carbon capture, utilization, and storage (CCUS), and develop commercially viable technology packages, as well as provide financial assistance. Governments could create a special transformation fund, issue climate bonds sponsored by the World Bank, offer preferential loans, and cap the share of green logistical equipment purchased, as well as provide a set number of years of tax breaks and discounts for infrastructure projects, like new energy charging pile development. It could also be beneficial to create a risk hedging mechanism, build carbon emission reduction futures products, and lock in the forward carbon price to avoid market swings.
- (2)
Strengthening international cooperation and developing green infrastructure
Mechanisms for international cooperation are being optimized. The creation of a blockchain-based worldwide carbon footprint accounting system would be beneficial. It is important to realize digital synergy between carbon emission measuring rules for railroads, roadways, and waterways. Opening a carbon data interaction link between the China–Europe liner and the ASEAN freight train would be useful. Countries should encourage mutual recognition of technical requirements for critical equipment, such as charging interfaces for electric trucks and hydrogen energy storage and transportation systems and form a national joint certification organization. Implementing “one-time testing and bilateral certification” for items, including green packaging materials and new energy modes of transportation, as well as shortening the certification process, would be beneficial, as would setting up multiple worldwide carbon-neutral transportation corridors along the Belt and Road. An integrated transportation model of “railroad, shipping, and pipeline” could be created to cut carbon emissions. Greening the energy infrastructure and promoting “photovoltaic + energy storage” microgrids to address power supply issues in remote locations would be helpful, as well as establishing regional clean energy trading platforms and facilitating cross-border green power trade.


