1. Introduction
Since the conclusion of the Paris Agreement, it has become the consensus of most countries and regions to actively deal with global climate issues [
1]. In response to global climate change, countries have set goals for carbon peaking and carbon neutrality, aiming to reach a global peak in greenhouse gas emissions [
2,
3]. At present, UGS is one of the mainstream technologies for energy storage, which can significantly improve energy efficiency and supply stability [
4]. In addition to the conventional use of natural gas as a cushion gas, the existing studies also include relevant research on using nitrogen and CO
2 as a cushion gas [
5]. Natural gas is a kind of clean energy; increasing its proportion in the energy consumption can reduce the emission of greenhouse gases, particularly carbon dioxide [
6,
7,
8].
UGS constructed worldwide can be broadly categorized by type of storage space, namely, depleted gas reservoirs, oil reservoirs, salt caverns, and aquifers. Water-bearing reservoir-typed gas storage (WBR-typed) accounts for 30% of global gas storage, which also plays an important role in the development of gas storage in China [
9]. The construction of water-bearing reservoir-typed gas storage in China started late; thus, the research regarding this type of technology is still at an immature stage [
10].
Among UGS, WBR-typed gas storage has large storage capacity and flexible area selection for UGS construction [
11]. However, unlike depleted hydrocarbon reservoirs, the sealing capacity and stability of the WBR-typed gas storage need to be described clearly, and the underground water flowing characterization is more complicated. For this type of storage, the selection of suitable layers for UGS construction is of great significance [
12]. The evaluation and selection of UGS construction sites mainly consider aspects such as the characteristics of the formation rock, sealing capacity of the caprock, and characteristics of the fluid distribution and migration [
13]. However, there is no comprehensive framework for the assessment and selection of the construction layers of UGS in a multi-layered water-bearing gas reservoir.
The characteristics of reservoir formations are critical factors influencing the establishment and operation of gas storage facilities. They are directly related to the safety, efficiency, and economic viability of a UGS [
14,
15]. The existing research mainly focuses on studying the depositional microfacies, sand distribution, and inter-layer distribution, as well as the lithological and physical properties of the gas reservoir [
16]. The petrophysical properties of a reservoir, such as porosity and permeability, significantly impact the flow and storage efficiency of gas, with higher porosity and permeability generally indicating better gas storage capacity. In addition to structural types and structural dimensions, the petrophysical parameters of the reservoir rocks also affect storage capacity [
17]. Lewandowska et al. [
18] suggested that the static storage capacity of a UGS determined the amount of working gas stored, which depended on the volume of the pore space, the filtration parameters of the reservoir, and the rocks that composed it. Kowalski et al. [
19] used a compositional model to assess the impact of permeability and pore structure on UGS. The results indicated that reservoir petrophysical properties had a significant impact on the subsurface migration of gas. That is, a preliminary understanding and screening of the favorable areas for UGS construction can be achieved by clarifying the geological characteristics of the reservoir [
20].
The sealing capacity of the caprock is a key factor in determining whether a trap structure can be transformed into a UGS [
21]. It is particularly necessary to analyze the factors affecting the sealing capacity of the caprock [
22]. Existing research primarily focus on two aspects of caprock sealing capacity: the macroscopic characteristics and the microscopic structure of the caprock [
23]. The macroscopic factors include lithological composition, distribution range, homogeneity, and continuity, as well as burial depth. Microscopic features are mainly determined by breakthrough pressure, porosity and permeability, diffusion coefficients, and specific surface area [
24]. Typically, drilling, logging, seismic, testing, and production dynamic data can be used to finely delineate the combination and spatial configuration of faults. To accurately delineate the types of trap structures, their morphology, spill points, breakthrough pressure after rock fatigue [
25], and SGR [
26], characteristics such as the type [
27], elements, combination forms, and distribution of fault development can be utilized [
28]. Yang et al. proposed a method for evaluating the stability of fault failure based on the Mohr–Coulomb criterion, the law of Amonton, as well as shear failure and frictional sliding failure of faults [
29]. However, when different types of fault failure were considered, significant variations in the results of the stability evaluation were observed. Wang et al. integrated triaxial tests, constitutive models, and numerical models to investigate the impact of strain rate on the gas storage performance of aquifers [
30]. The results showed that with the increase in the formation’s strain rate, the gas production capacity was significantly improved [
1,
31].
Gas reservoirs selected as storage facilities can sometimes have experienced a long-term production history. During the development of multi-layered water-bearing gas reservoirs, they are highly susceptible to water invasion [
32,
33]. This can lead to complex gas–water two-phase flow in the subsurface [
34]. The distribution and migration of fluids are crucial for the calculation of storage capacity and the design of subsequent injection and production plans. Therefore, clarifying the gas–water distribution is also a key challenge for constructing UGS in a multi-layered water-bearing gas reservoir [
35,
36]. Traditional methods for studying water invasion include core-flooding experiments, micro-scale visual physical models, and nuclear magnetic resonance (NMR) techniques [
37]. On the other hand, in field-scale pilots, numerical simulation technology is generally used to simulate the gas–water distribution and flowing patterns [
38,
39,
40]. Numerical simulation is a pivotal methodology in hydrocarbon reservoir development, employing mathematical models to characterize the flow behavior of oil, gas, water, and injectants through subsurface formations. While the Navier–Stokes equations provide conventional formulations for fluid flow [
41], reservoir simulation models are predominantly underpinned by Darcy’s law to address the multi-phase flow problems inherent in porous media systems.
Selecting favorable layers for UGS construction in a multi-layered water-bearing gas reservoir could be a challenging task [
42,
43]. There are still problems such as incomplete analysis of the sealing capacity of trap structures, unclear understanding of fluid migration patterns, and a lack of systematic research on water invasion characteristics [
44,
45], which led to the failure of the comprehensive assessment of potential UGS construction areas. In response to the above problems, this study proposed a comprehensive framework for the assessment and selection of the construction of vertical layers of UGS in a multi-layered water-bearing gas reservoir. This framework first integrates dynamic testing of geomechanical parameters with quantitative characterization of water invasion, resolving the vertical sealing–water invasion coupled evaluation challenge in multi-layered gas reservoirs. Firstly, according to the geological characteristics, the sedimentary characteristics, sand distribution, inter-layer, lithology, and physical property characteristics of the reservoir were assessed, respectively. The reservoir’s storage characteristics and development potential were quantitatively assessed. Secondly, based on rock mechanical properties, the static sealing capacity of the caprock, the static sealing capacity of faults, and the dynamic sealing capacity of traps were quantitatively evaluated, respectively. Then, numerical simulations were carried out to study the distribution and migration of subsurface fluid, resulting in a detailed and quantitative depiction of water encroachment dynamics. Finally, by integrating results of geomechanical and hydraulic analysis, the favorable layers for UGS construction are selected. Employing the proposed framework, the suitable layers were evaluated and selected for a UGS construction in a multi-layered water-bearing gas reservoir located in northwestern China. The results demonstrated the effectiveness and reliability of the proposed approach. The results of this work served as the fundamentals for the subsequent design of UGS operations. The lessons gained provide insights for the construction of other UGS with similar backgrounds.
3. Proposed Method for the Selection of UGS Construction Site
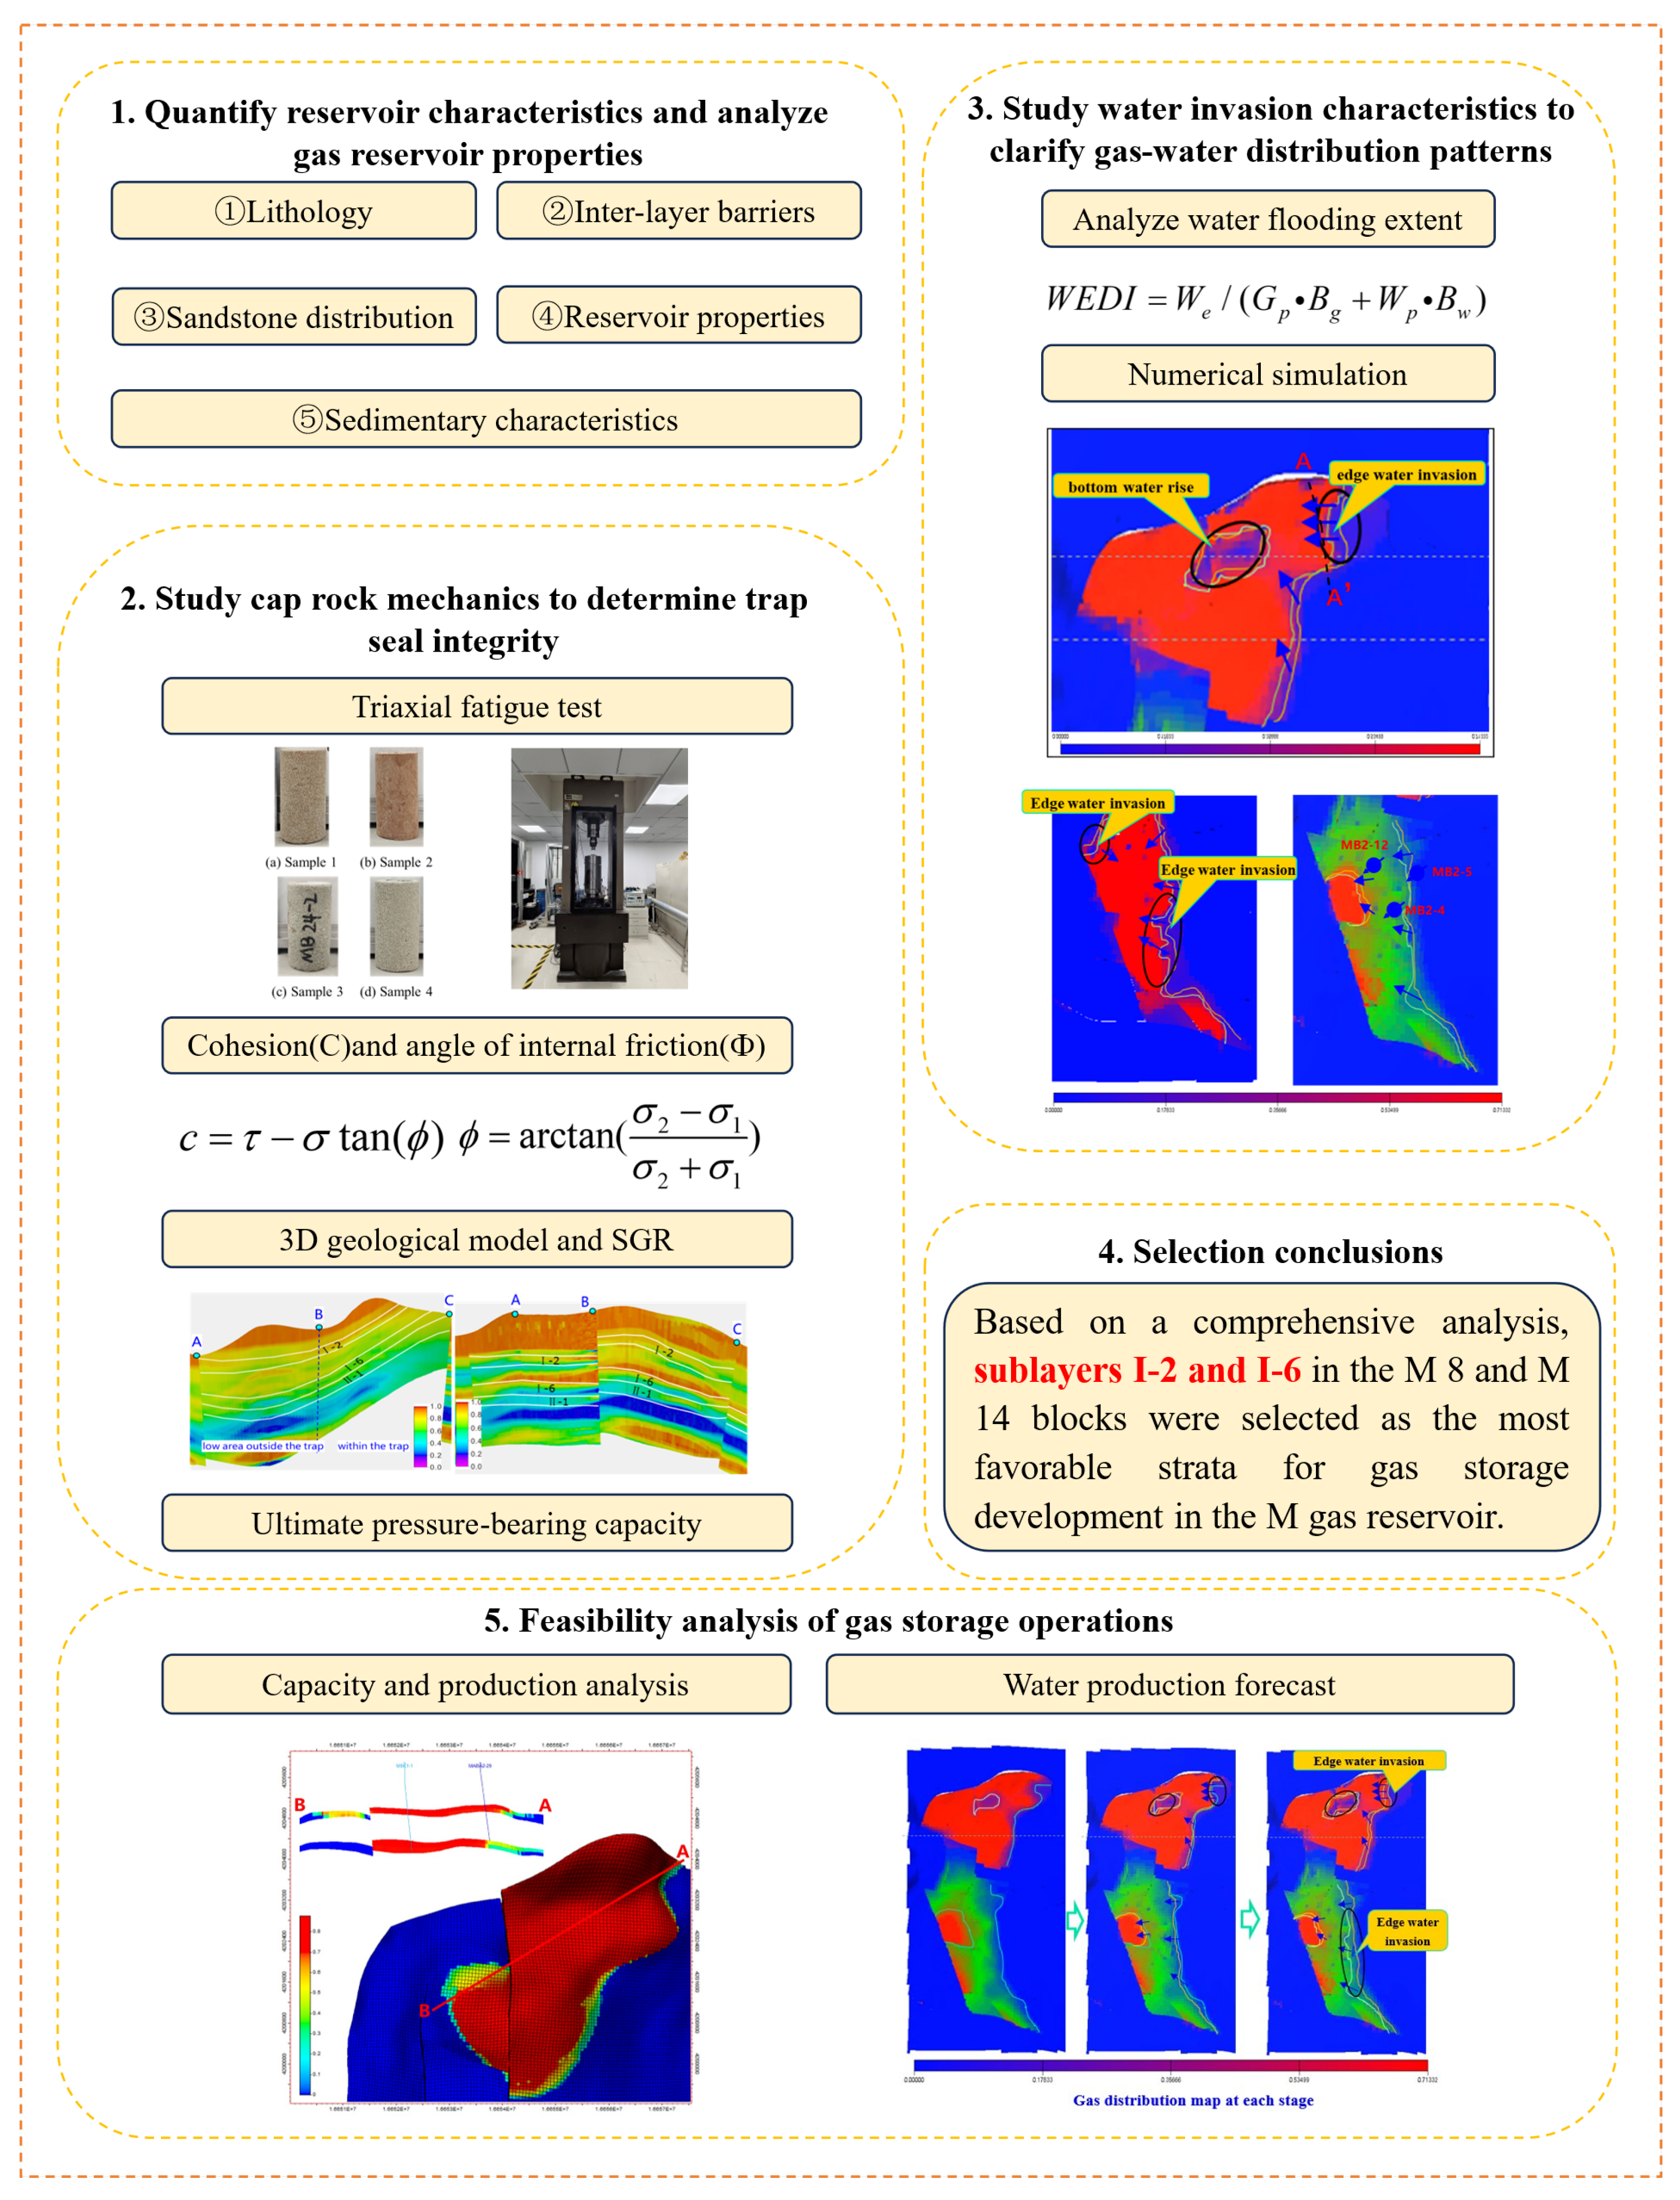
This study proposed a comprehensive workflow for the assessment and selection of the vertical stratification of UGS construction in a multi-layered water-bearing gas reservoir. The vertical stratification of the gas reservoir was quantitatively assessed to filter out the favorable layers considering both geological characteristics and production dynamics features. The workflow contains the following steps, as shown in
Figure 2.
(1) According to geological characteristics, integrated data from well logging, well testing, analytical testing, and core observations were used to analyze the sedimentary characteristics, sand distribution, interbeds, lithology, and reservoir properties in each layer. The connectivity of sands, baffle within the reservoir, the diagenesis of the reservoir, and permeability data were compared and evaluated for each layer.
(2) Based on results of triaxial fatigue tests on the caprock shale, the relationship between the lithological configuration on either side of the fault and the fault SGR was used to analyze the reservoir caprock system. This included assessing the changes in the three-dimensional stress field under injection and production pressure disturbances. The seal integrity of the M gas reservoir was comprehensively evaluated from three aspects: static seal integrity of the caprock, static seal integrity of the fault, and dynamic seal integrity of the trap.
(3) From the perspective of production dynamics, the historical data was studied for conducting a production capacity analysis. The water volume and water-to-gas ratio were then calculated layer by layer through numerical simulation technology. A refined depiction and quantitative characterization of the water encroachment dynamics were carried out. Subsequently, the distribution and migration of gas and water were clarified.
(4) Finally, favorable sub-layers for UGS construction were assessed and selected, based on a comprehensive assessment of reservoir characteristics, trap sealing integrity, and gas–water flowing characteristics. Numerical simulations were then carried out to analyze the feasibility of the construction and operation of the gas storage in the target layers.
3.1. The Evaluation of Geological Characteristics
3.1.1. The Evaluation of Seal Integrity
The evaluation of the sealing integrity of the UGS is the primary and key issue in the feasibility of gas storage construction. It is fundamental for ensuring that natural gas can be reliably stored. The main evaluation targets include the caprock, faults, and spill points.
(1) Static sealing integrity of the caprock
In this study, the sealing capacity of the caprock under cyclic loading was microscopically and quantitatively assessed to determine its durability. Dynamic breakthrough pressure tests, in combination with fatigue experiments, were carried out. The breakthrough pressure was measured after the rock had undergone fatigue. And the mechanical parameters of the rock were calculated.
Rock mechanics parameters focused on in this research mainly include the elastic parameters (such as Poisson’s ratio, elastic modulus, etc.) and strength parameters (such as tensile strength, etc.) [
46,
47].
① Dynamic elastic modulus (Ed)
The calculation method is using Equation (1):
where is
rock density;
and
are the compressional wave slowness and shear wave slowness.
② Poisson’s ratio (μd)
For all isotropic materials, its value lies between 0 and 0.5. The well logging interpretation methodology is formulated as follows:
③ Uniaxial compression strength (UCS)
The relationship between the uniaxial compressive strength and dynamic elastic modulus of sandstone and mudstone, as well as the shale volume of the rock (
), can be described as follows:
④ Cohesion(c)and angle of internal friction ()
In the Mohr–Coulomb criterion, cohesion (
c) is a constant related to the shear strength (
τ) of the material. The formula is as in Equation (4):
where
is the internal friction angle in the Mohr–Coulomb model;
is normal stresses measured during the experiment.
The Mohr’s Circle Method was a common technique used to calculate the internal friction angle. It involved plotting Mohr’s circle based on shear stress and normal stress data obtained from different shear tests.
where σ
1 nd σ
2 were the minimum and maximum normal stresses measured during the experiment.
(2) Fault static sealing integrity
The effectiveness of the fault sealing was directly related to the risk of leakage in the later stages of gas storage. Therefore, in the early stages of gas storage evaluation, it is necessary to use multiple methods to assess the faults.
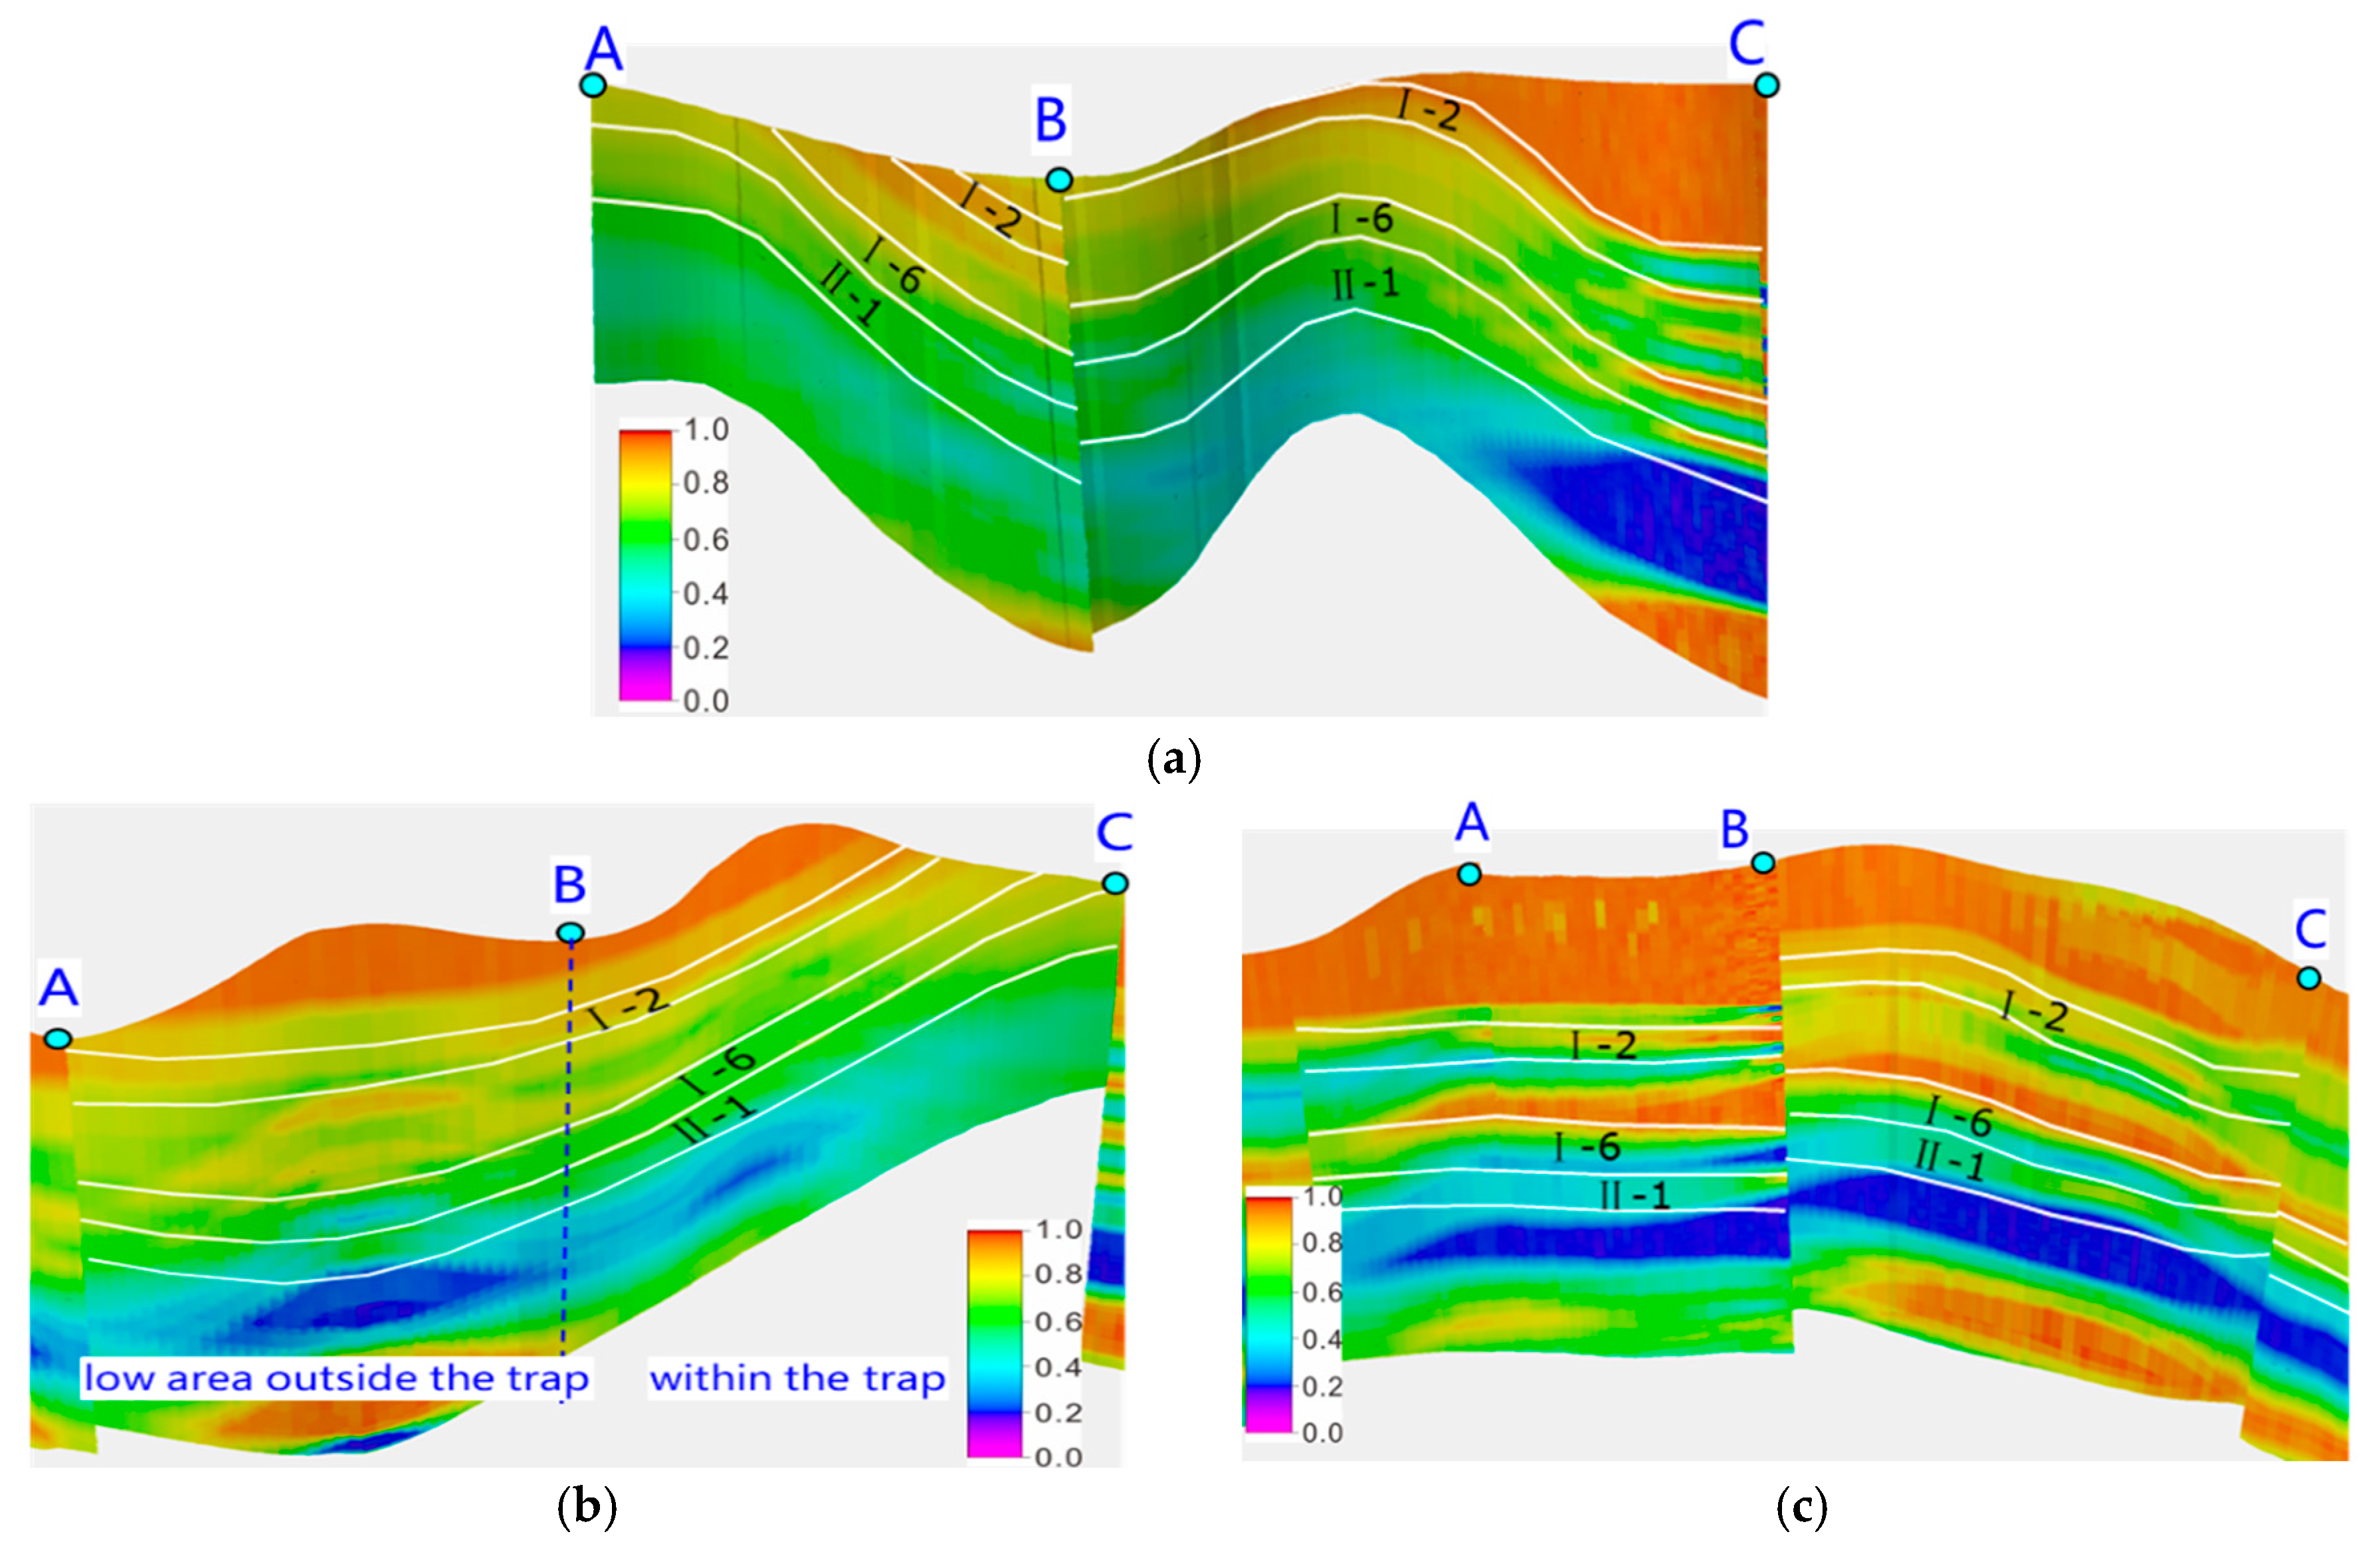
Firstly, based on detailed geological studies of the target gas reservoir, knowledge of sedimentary microfacies, geostatistical principles, and reservoir modeling techniques were utilized. Structural modeling, sedimentary facies modeling, and reservoir property modeling were conducted to predict the distribution of physical parameters between wells and thereby establish a comprehensive 3D geological model of the reservoir properties.
Secondly, the lithologic contact relationship between the two blocks and the distribution of Shale Gouge Ratio (SGR) [
48] were employed to assess the static geological sealing capacity of faults within the storage area. SGR is a parameter used to predict the proportion of shale incorporated into the fault zone as a result of mechanical faulting processes, providing insight into the sealing potential of the fault.
At each point along the fault, the SGR algorithm calculates the shale volume that has slipped past that point on the fault, using Equation (6):
where
is thickness of the stratigraphic layer; D is the fault displacement.
The critical SGR values are often reported to indicate whether a fault seals or not. When the SGR is less than 15% to 20%, it typically indicates the presence of brecciated or fault gouge zones, which lack effective hydrocarbon sealing capacity. Conversely, when the SGR exceeds 50% [
49], it reflects shale smearing, a process in which the fault core is composed of shale or silicate-rich gouge layers. These materials exhibit excellent sealing properties, thereby enhancing the fault’s ability to act as a hydrocarbon seal [
50].
(3) Dynamic sealing capacity of traps
A 3D geomechanical model was constructed using rock mechanics parameters from laboratory experiments and in situ stress data from micro-fracturing tests, integrated with an existing 3D geological model. The gas reservoir development and injection–production operations were simulated to model fluid pressure changes. Through fluid–stress coupling simulations, the dynamic in situ stress field under injection–production disturbances was analyzed, forming a dynamic geomechanical model. Finally, the ultimate pressure-bearing capacity of key geological structures (caprock, faults, and spill points) was evaluated by combining the dynamic stress field with rock mechanics parameters, providing insights into structural integrity and sealing capacity under operational conditions.
3.1.2. The Evaluation of Reservoir Characteristics
The geological characteristics of the gas reservoir were analyzed, focusing on its depositional features across different regions. The source, transportation, and deposition processes of the sediments were identified using integrated data from well logging, mud logging, laboratory analysis, and core observations to determine the depositional environment. The distribution, morphology, and connectivity of the sand bodies were examined to assess the reservoir’s development and storage capacity. Interbedded layers were identified due to their potential impact on vertical and horizontal connectivity. The lithology of the gas reservoir was studied to evaluate its storage properties, permeability, porosity, diagenesis, and overall development potential. The reservoir properties, particularly porosity and permeability, were compared across different regions to directly assess the gas storage capacity of the reservoir.
3.2. Study on the Migration Patterns of Reservoir Fluids
3.2.1. Water Drive Index
The water drive index (WEDI) is calculated using production dynamic data, as in Equation (7) [
51]:
where W
e is cumulative water invasion; G
p is cumulative gas production; B
g is gas volume factor; B
w is water volume factor; W
p is cumulative water production.
3.2.2. Numerical Simulation Method
The compositional simulations were performed using commercial numerical simulators, which employ a finite volume method (FVM) to solve the governing equations of multi-phase flow in porous media. Building upon a fine 3D geological model, grid and attribute data up-scaling was performed to derive the 3D structural and attribute model required for numerical simulation. Corner-point grids were utilized for discretization, with 177 grids in the X-direction (average grid spacing: 20 m) and 281 grids in the Y-direction (average grid spacing: 20 m). Vertically (Z-direction), 24 sub-layers were partitioned according to the distribution of sand bodies and shale barriers. The total number of grids reached 1.19 million. Based on the grid parameters, fluid and reservoir rock properties (as shown in
Table 3) were configured to complete numerical simulation initialization, establishing the foundation for simulating fluid distribution and migration during subsequent cyclic injection–production operations in gas storage reservoirs.
Based on the refined 3D geological modeling results, grid and attribute data were systematically up-scaled to generate a 3D structural and attribute model suitable for numerical simulation. The numerical model was calibrated using historical production data to ensure accurate representation of reservoir dynamics. The history-matched reservoir model was then employed to simulate and characterize the aquifer properties, comprehensively assess the water drive energy, and quantitatively analyze the water invasion dynamics. This included identifying the water invasion direction, calculating the current average gas–water contact, and determining key parameters such as the water invasion area, volume, and rate for each sub-layer. By evaluating the water flooding extent and bottom water energy in each sub-layer, the most favorable sub-layers with significant potential for storage development were identified and prioritized.
4. Results and Discussion
4.1. Geological Characteristics
4.1.1. Trap Sealing Capacity
(1) Caprock Static Sealing Capacity
A thick mudstone layer overlies the M gas reservoir, functioning as the primary caprock in this region. Experimental analyses of inter-layer properties, utilizing lithologies analogous to the reservoir section, revealed that the permeability of the brown mudstone is less than 0.05 mD, confirming its effectiveness as a sealing element.
Breakthrough pressure tests on mudstone inter-layer samples revealed that prior to fatigue, the breakthrough pressure ranged from 5.0 MPa to 11.1 MPa, indicating high breakthrough pressure and superior sealing capacity. Triaxial fatigue tests on the M8 caprock mudstone demonstrated that after 1000 fatigue cycles under pressures of 8–12.8 MPa, the mechanical properties of the caprock remained unaffected (
Table 4). Collectively, these results highlight that the caprock in the storage area exhibits lateral continuity, considerable thickness, low permeability, high fatigue resistance, and excellent sealing capacity (
Figure 3).
(2) Static Sealing Capacity of Fault
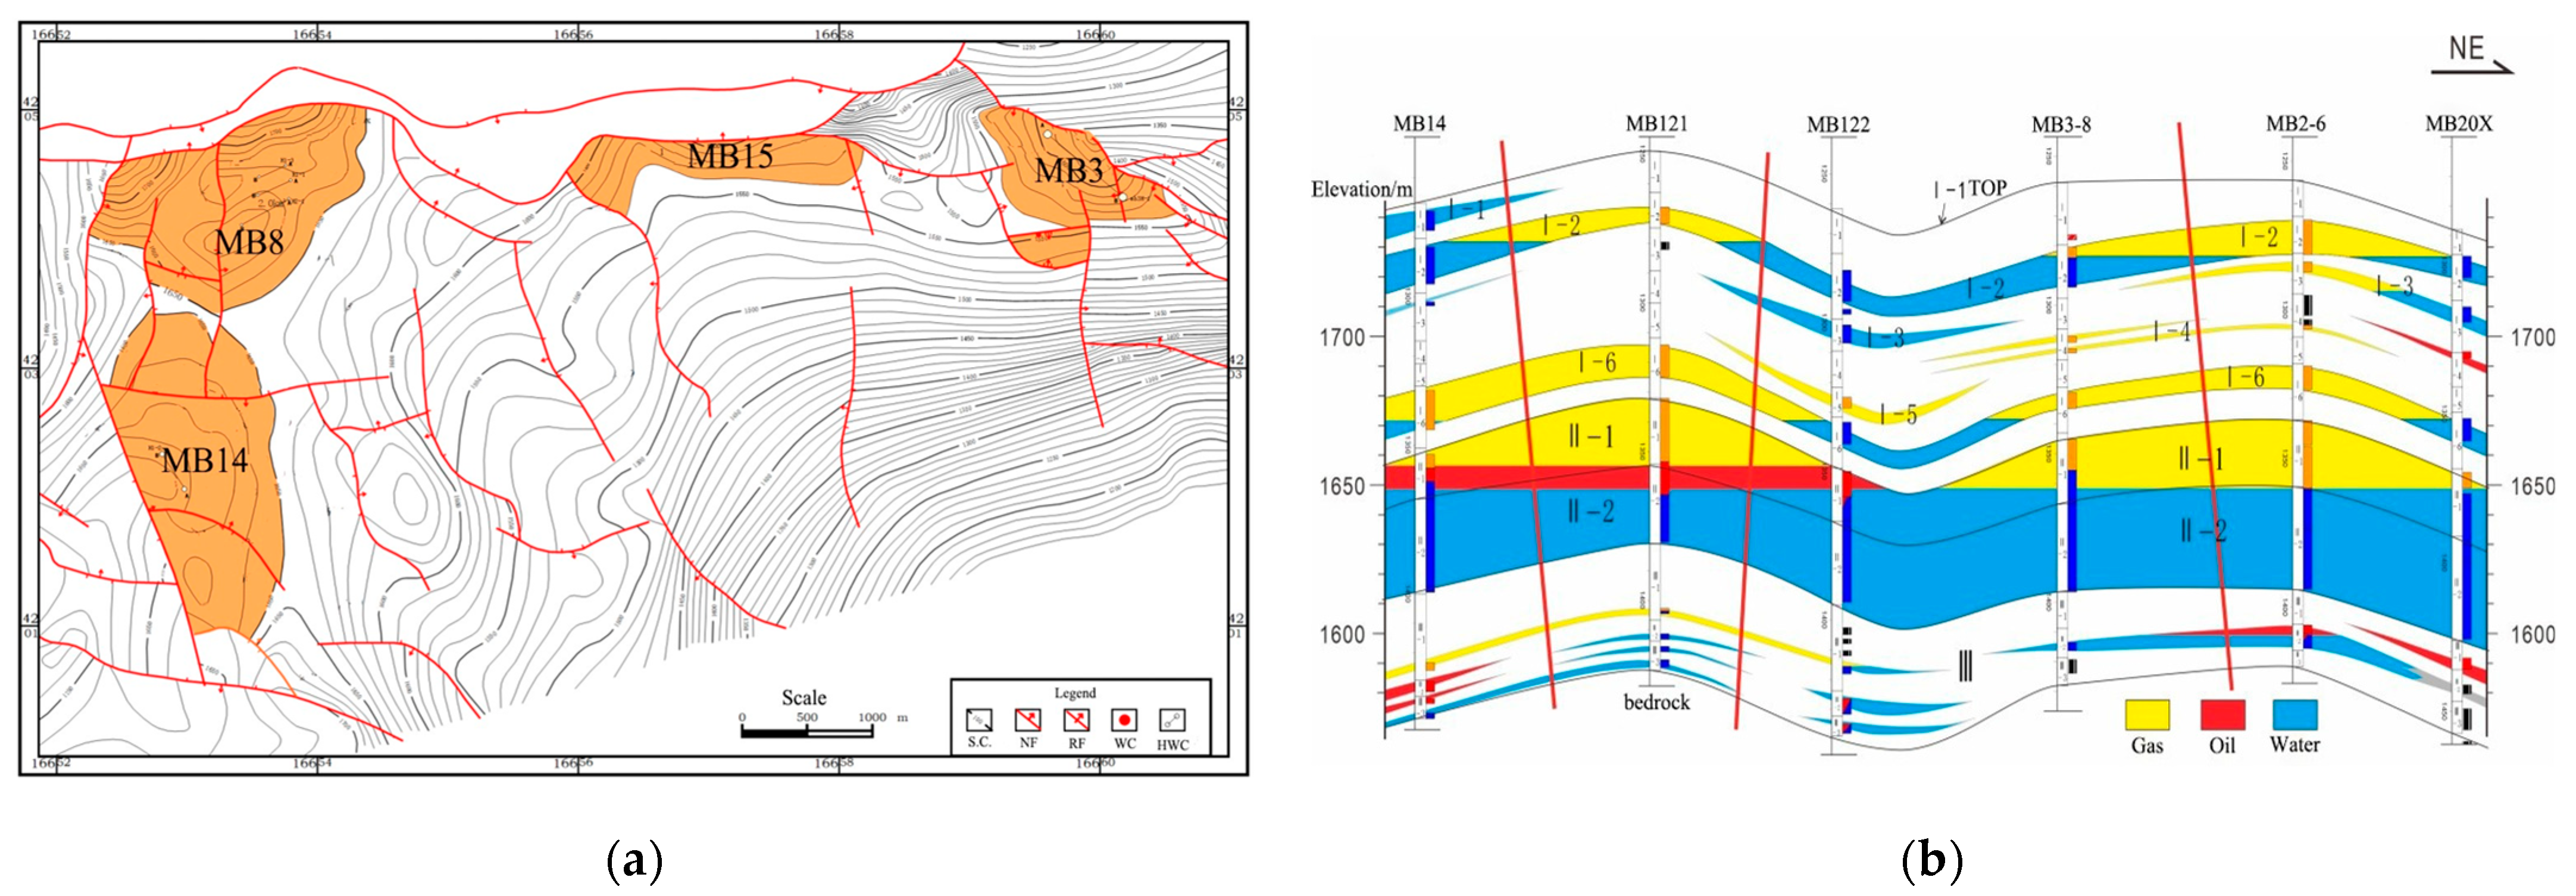
The M gas reservoir is a braided river sedimentary system, with the reservoir depth ranging from 1270 to 1380 m. The porosity of the reservoir ranged mainly from 15% to 25%, and the permeability is mainly between 5 and 500 × 10
−3 μm
2. A refined 3D geological model was constructed to evaluate the static sealing capacity of faults, with specific parameters outlined in
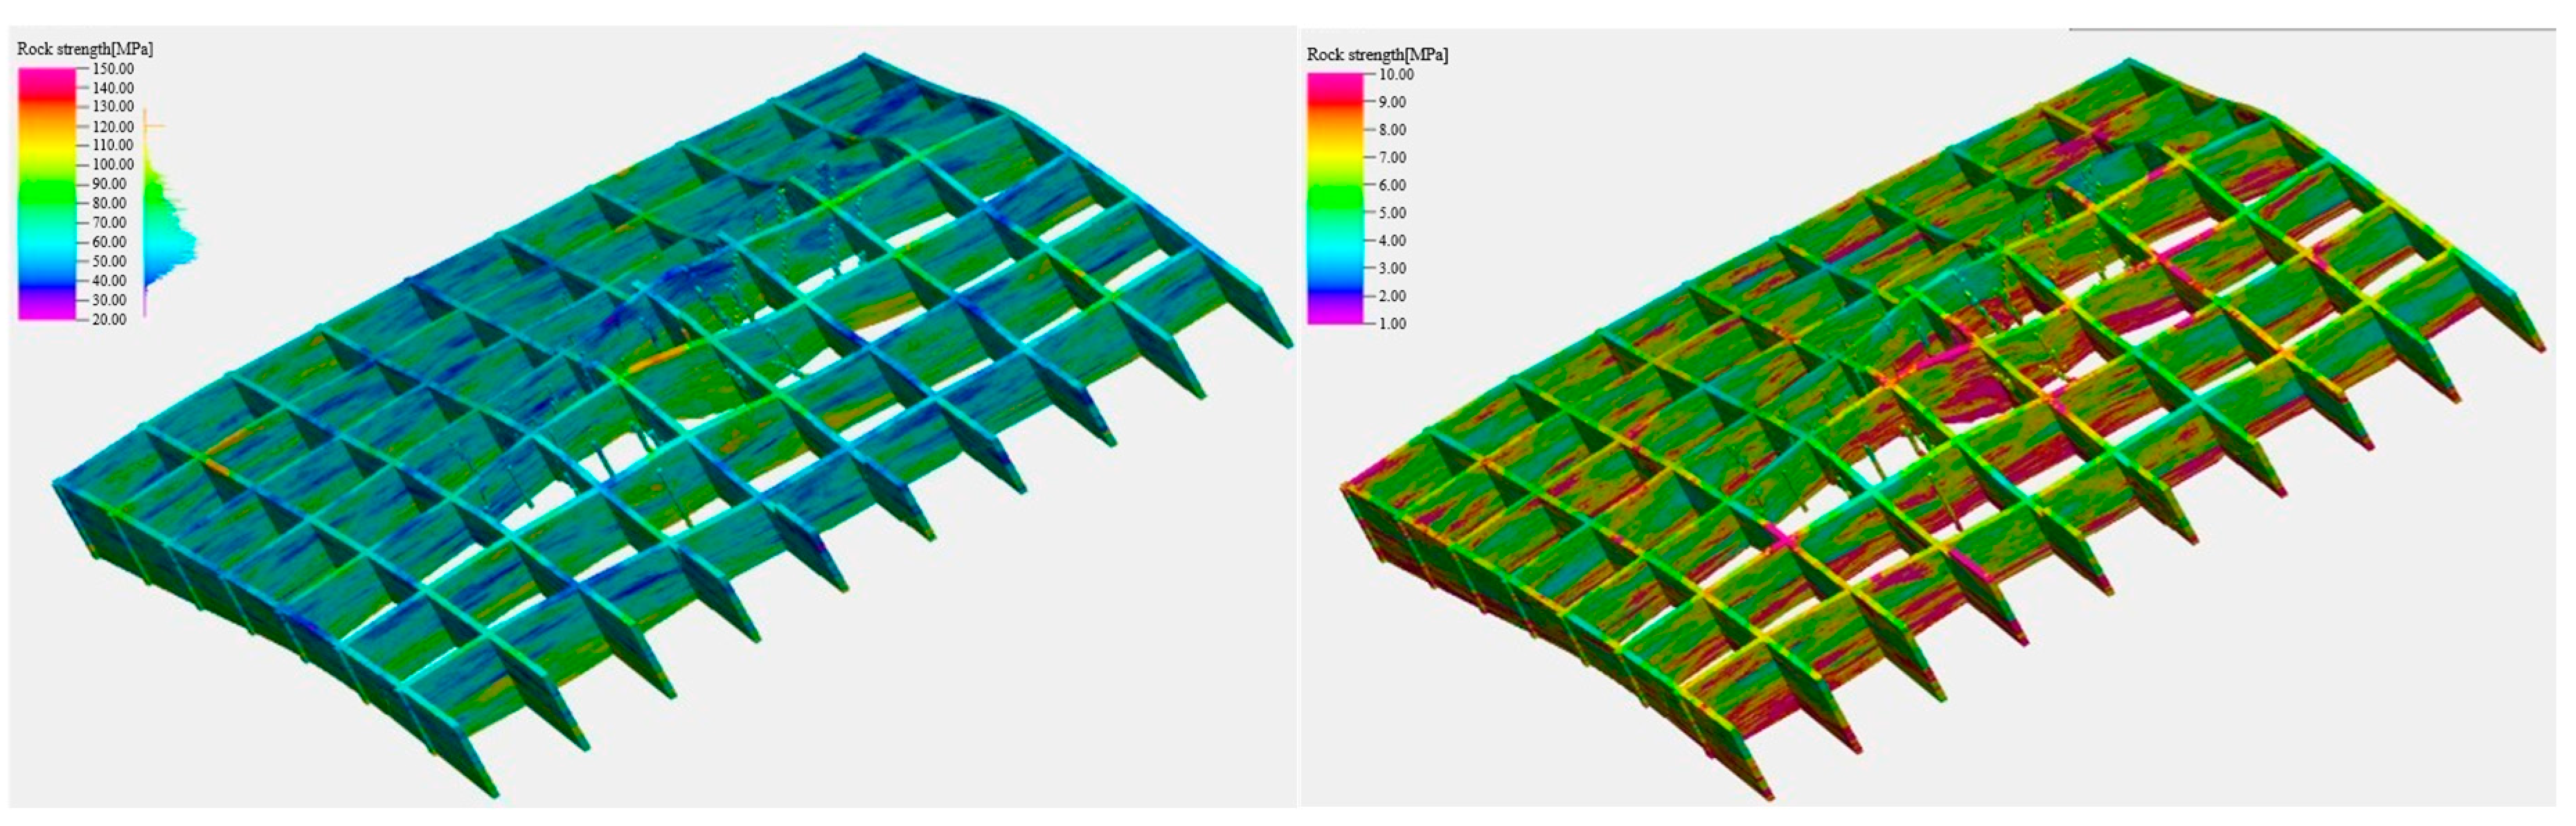
Table 5. Based on the analysis of existing data, the boundary faults within the storage formation exhibited high SGR values (
Figure 4). In contrast, the internal faults displayed limited fault displacement, with sands remaining partially connected. These internal faults exhibited lower SGR values and weaker sealing capacity, thereby preserving internal reservoir connectivity.
(3) Dynamic Sealing Capacity of Traps
① Establishment of a 3D Geomechanical Model
A 3D geomechanical model for the M8 storage area was established using the existing 3D geological model as a framework. This model integrated rock mechanics parameters obtained from laboratory experiments with in situ stress parameters derived from small-scale micro-fracturing tests, incorporating both rock mechanical properties and the distribution of in situ stresses (
Figure 5).
The simulation results showed that the minimum horizontal principal stress exhibited an orientation aligned along the northwest–southeast direction, with magnitudes spanning from 23.1 MPa to 25.8 MPa.
② Evaluation of Ultimate Pressure-Bearing Capacity
When the upper operational pressure is 12.8 MPa, the minimum horizontal principal stress is 26.0 MPa. The maximum safe gas injection pressure is 19.7 MPa. According to the Coulomb–Mohr criterion, the ultimate shear failure pressure capacity of the caprock was calculated to be 25.3 MPa. After applying an 80% safety factor reduction, the safe pressure-bearing capacity was determined to be 20.4 MPa (
Figure 6).
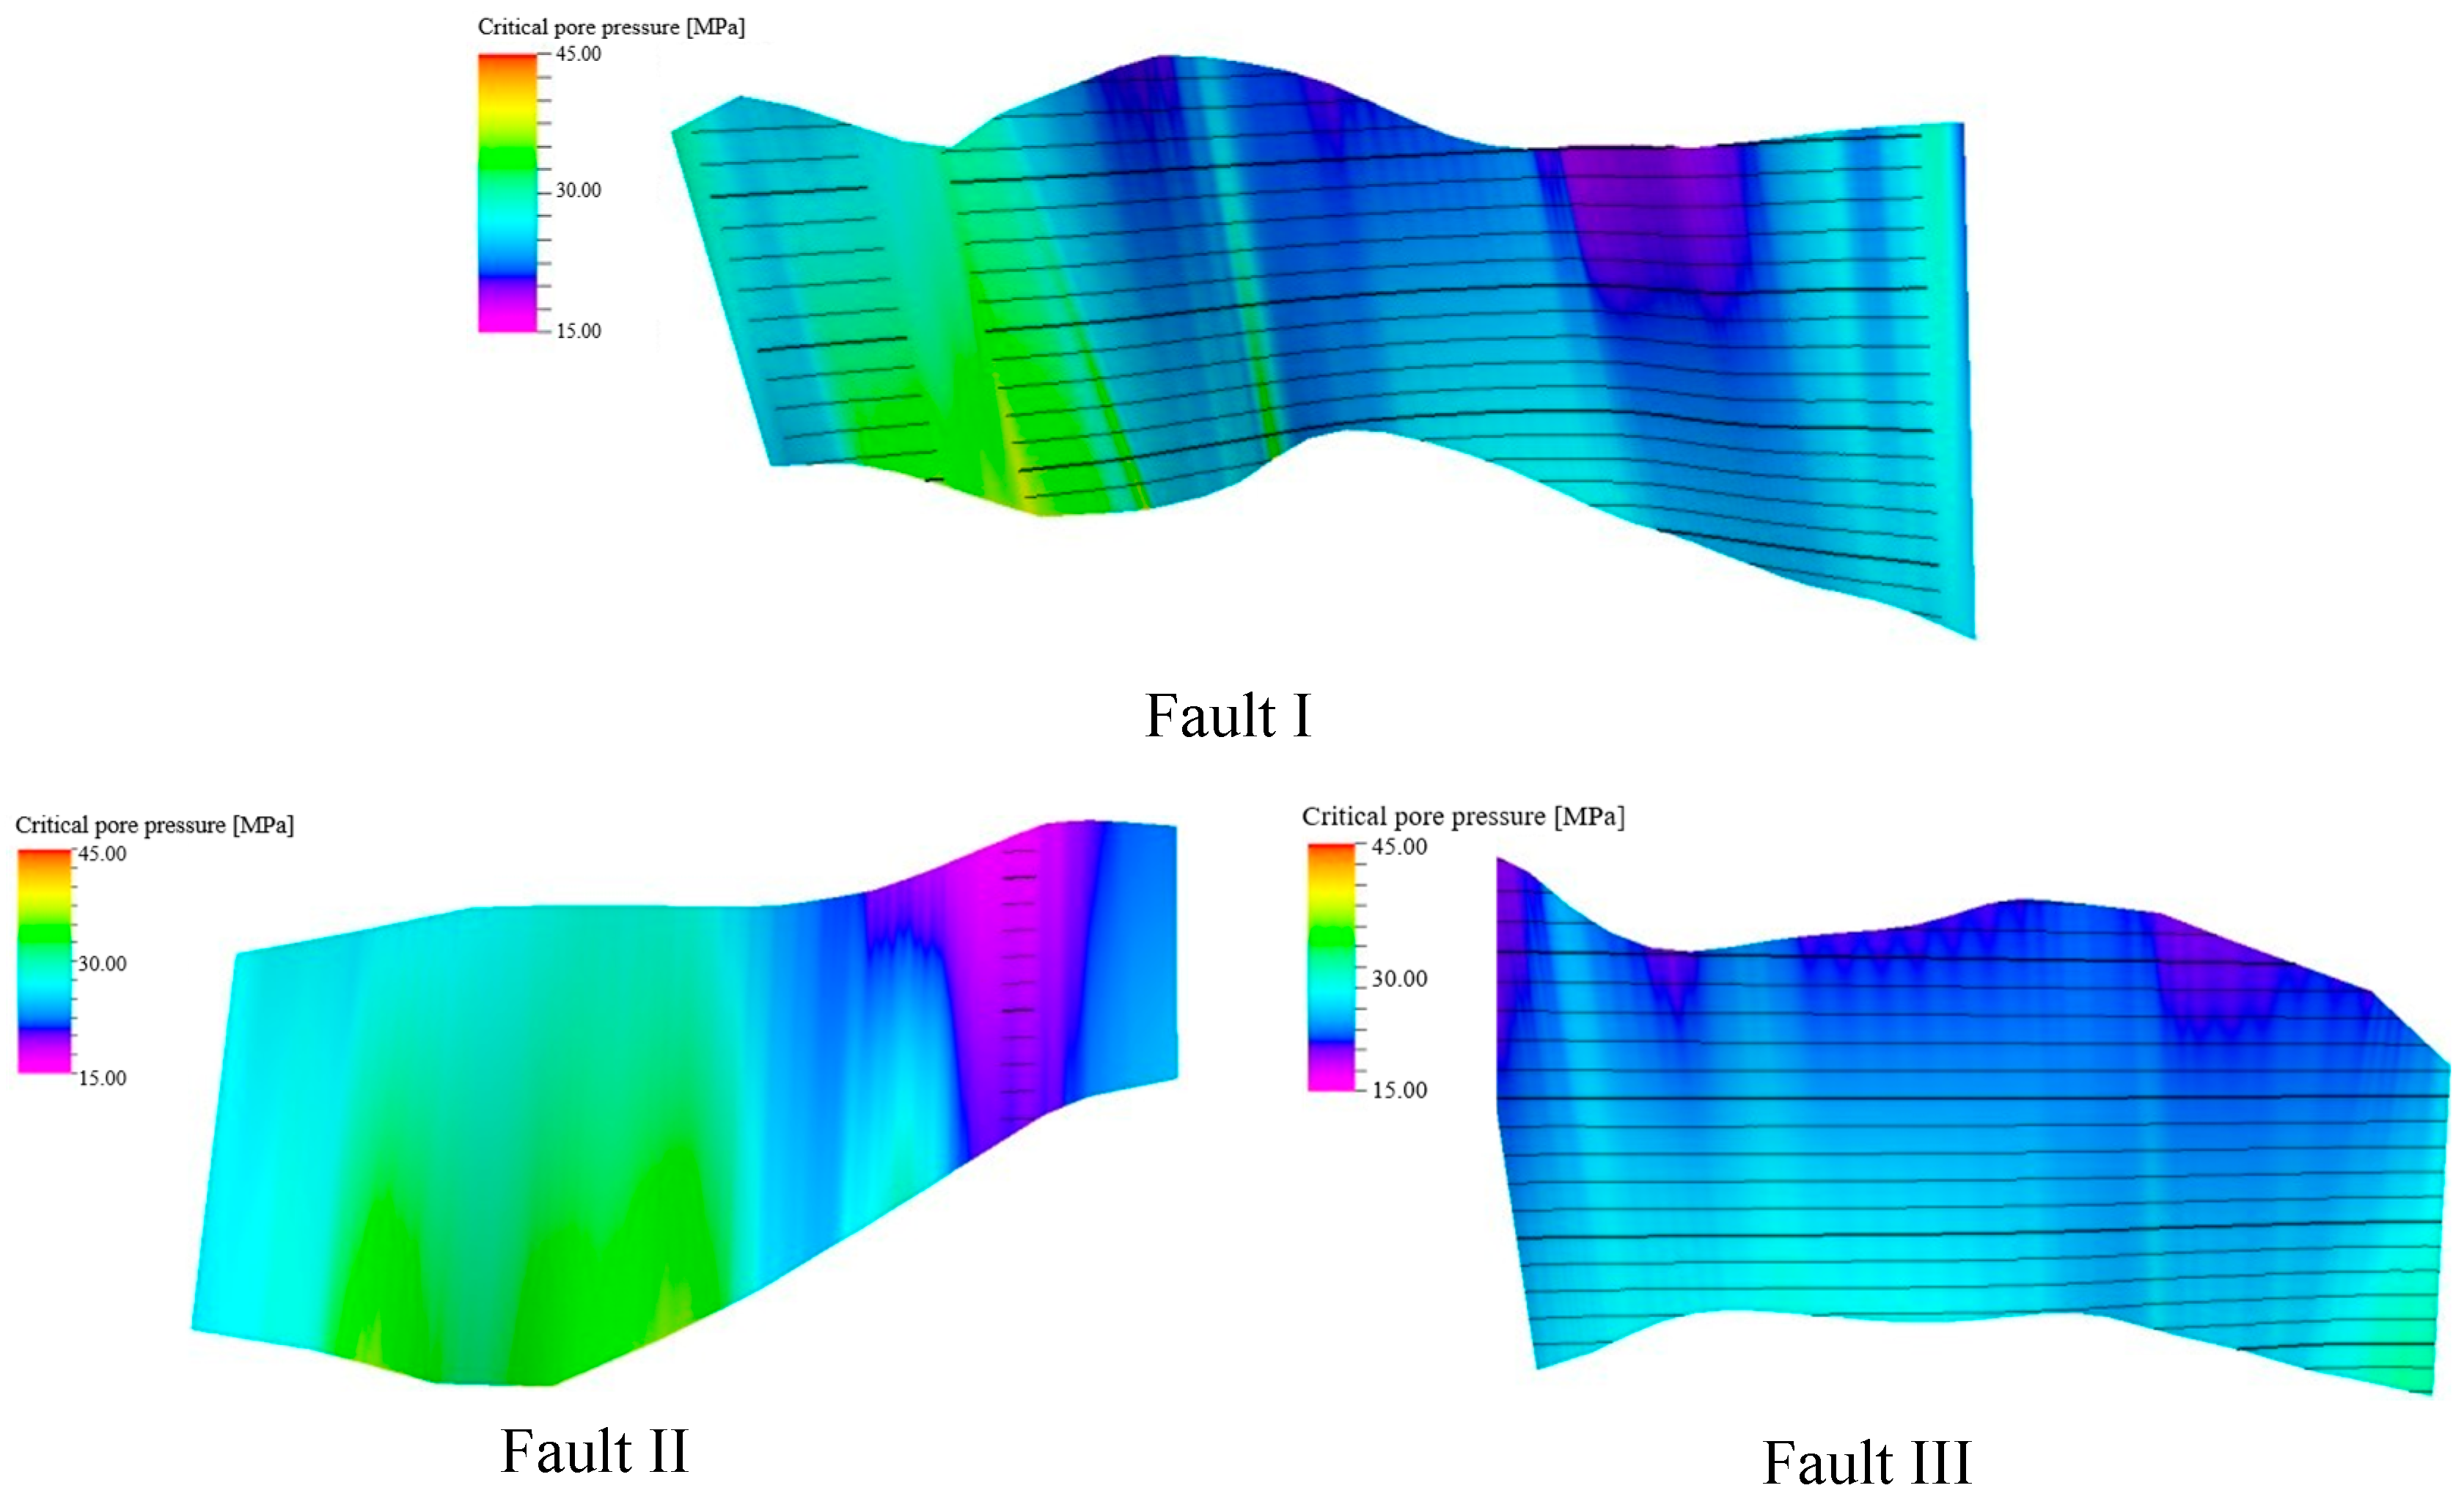
The results demonstrated that after multiple injection–production cycles, the safe pressure-bearing capacities of Fault I, Fault II, and Fault III were determined to be 16.6 MPa, 14.6 MPa, and 17.3 MPa, respectively. The safe pressure-bearing capacity of the internal faults spanned from 18.9 to 22.9 MPa (
Table 6). In summary, the minimum safe pressure-bearing capacity across all faults was established at 14.6 MPa.
③ Rock Mechanics Experiments
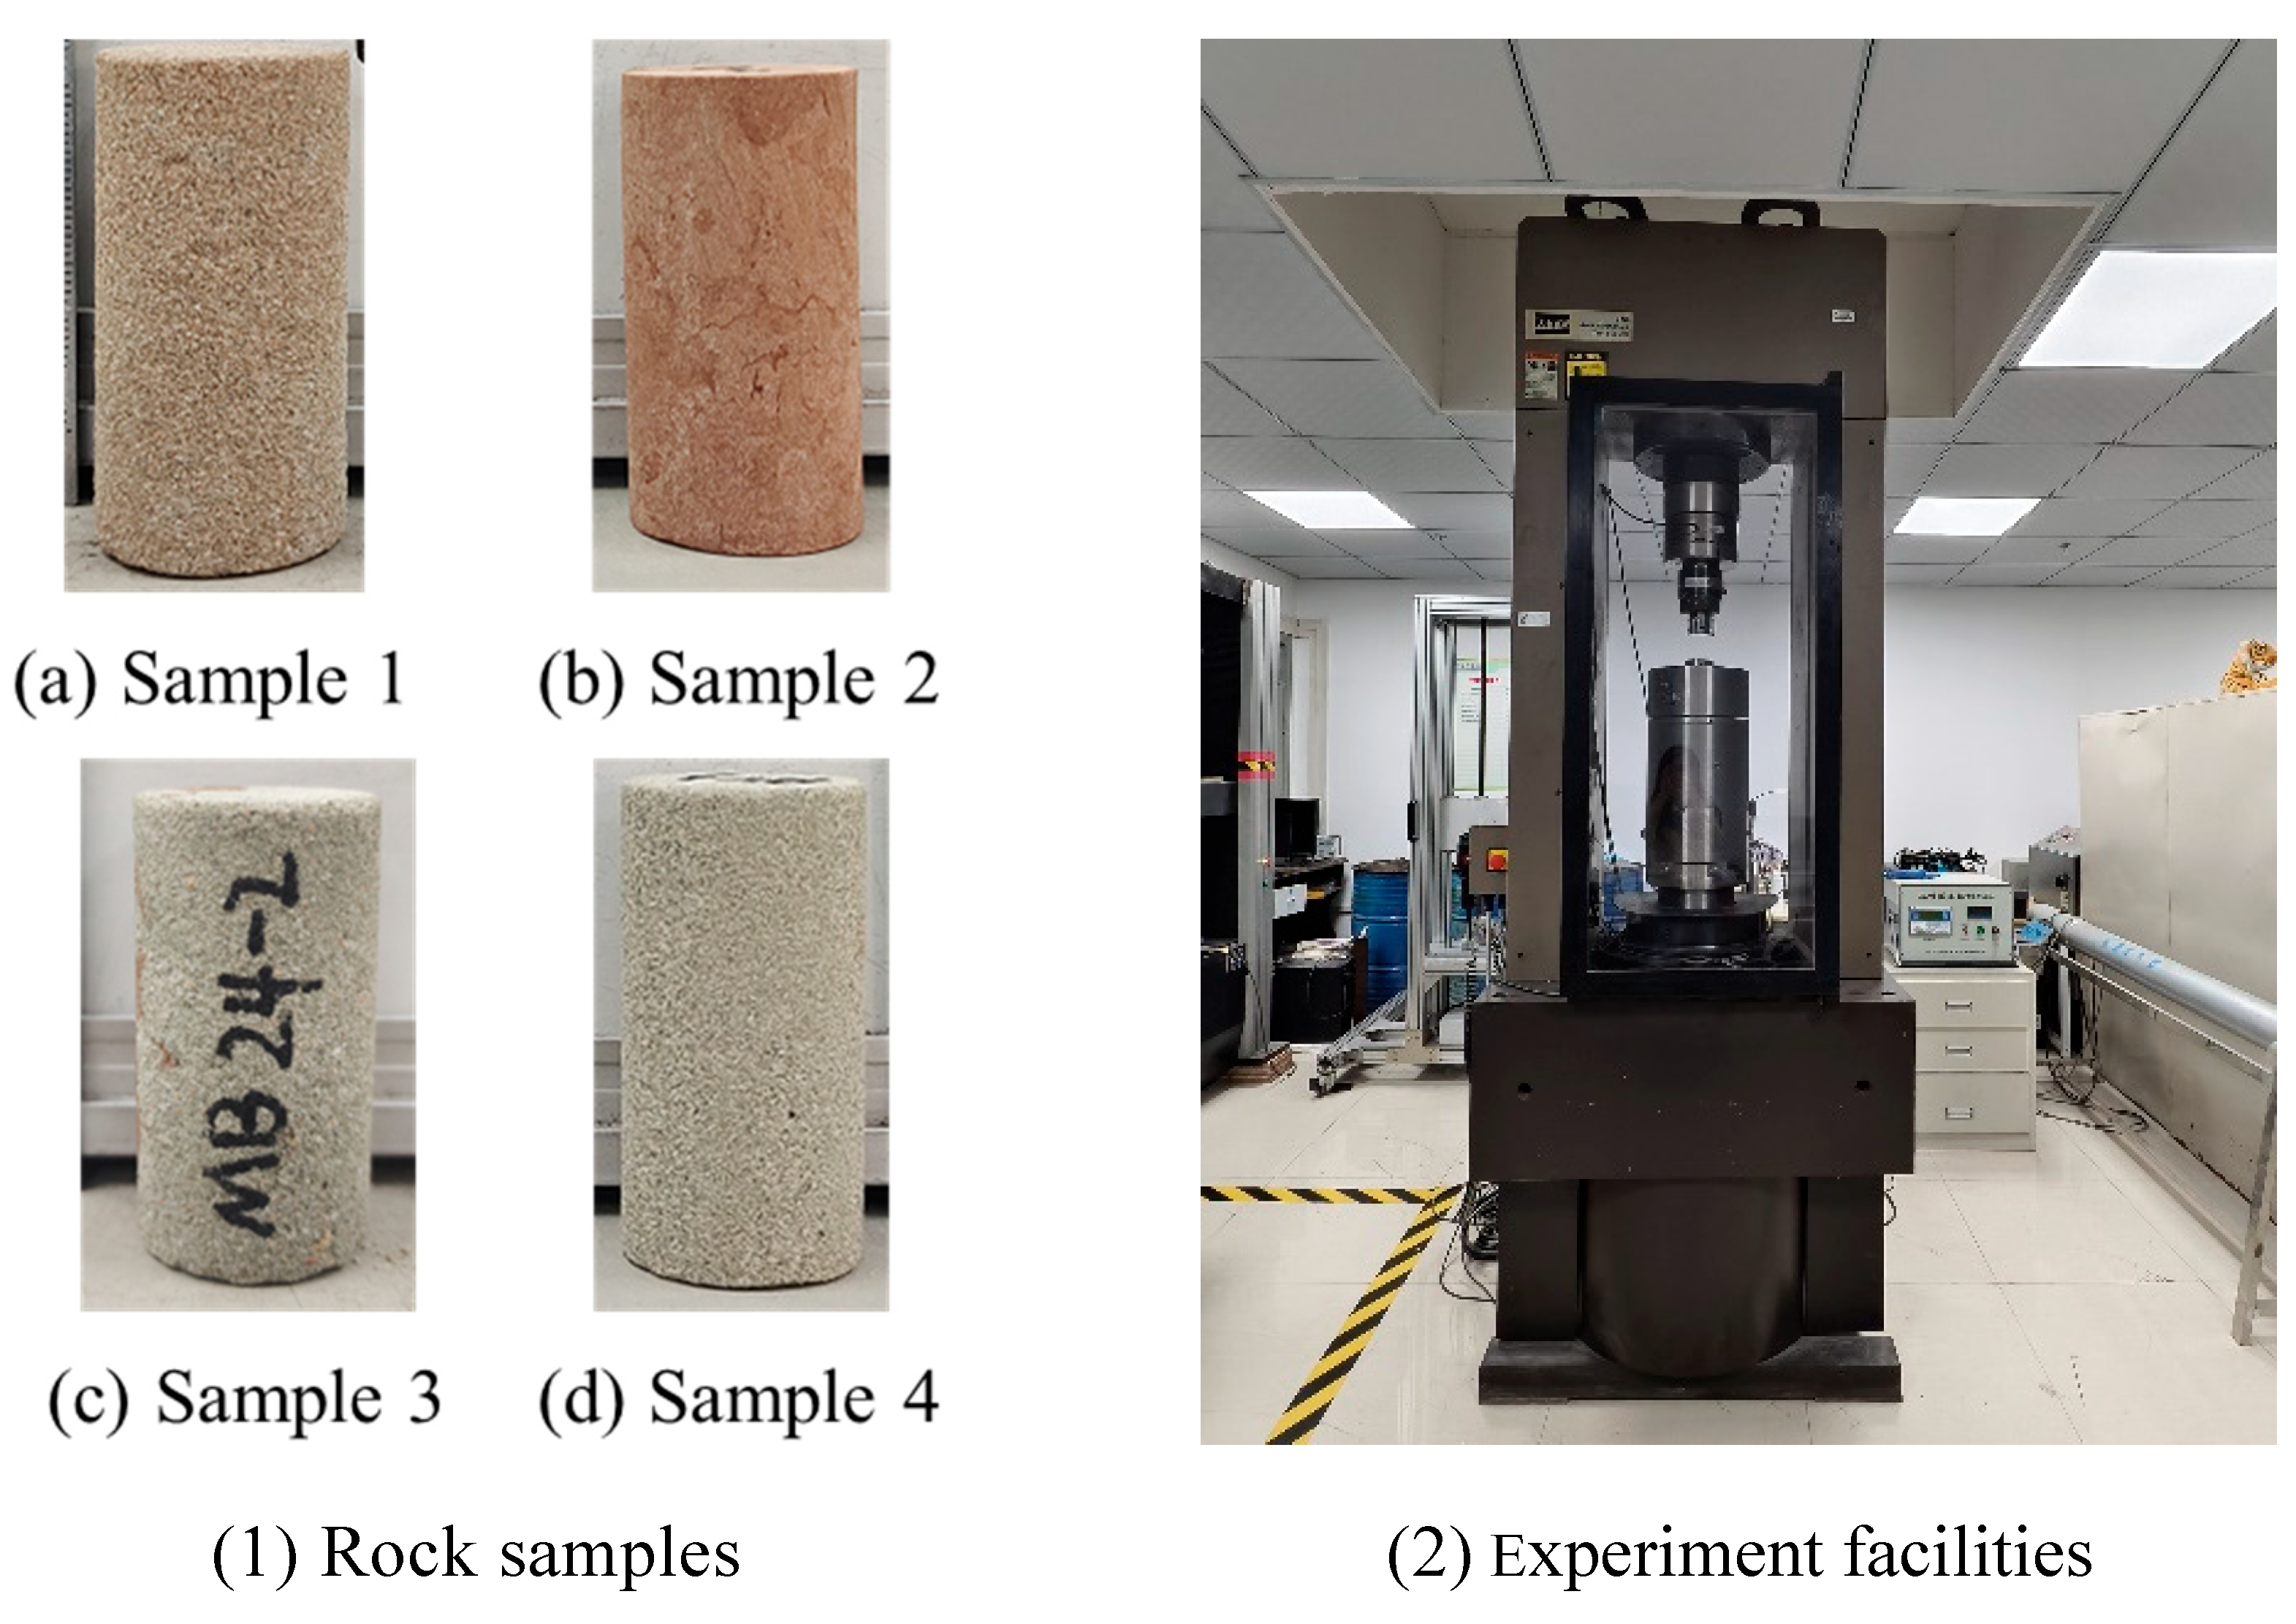
A triaxial compression testing system (MTS-815, Rock Mechanics Test System, USA) was employed to conduct the experiments. The experimental temperature was maintained between 20.3 and 21.5 °C. The samples were retrieved from Well MB and were natural, intact rock cores without structural planes or weathering (
Figure 7).
The samples were cored from the caprock interval at 1195–1255 m, from the formations E32 and E31-I-0, with a diameter of 25.93 mm and a height of 52.53 mm. And the loading direction was perpendicular to the rock samples. The experimental sequence initiates with equipment and pipeline purification, followed by hermetic integrity verification and specimen encapsulation, culminating in the synchronized application of confining pressure, axial stress, and pore fluid pressure; an initial axial load of 1 KN was applied, followed by axial loading at a rate of 10 KN/min until reaching 30 KN. Subsequently, circumferential strain was applied at a rate of 0.03 mm/min until failure occurred.
Combining Equations (1)–(5), the results of the triaxial compression experiment for the M8 Block are listed in
Table 7. Sample 1 exhibited a cohesion of 6.53 MPa and an internal friction angle of 43°. Sample 2 had a cohesion of 22.36 MPa and an internal friction angle of 24°. Sample 3 demonstrated a cohesion of 2.21 MPa and an internal friction angle of 42°. Sample 4 showed a cohesion of 6.58 MPa and an internal friction angle of 35°.
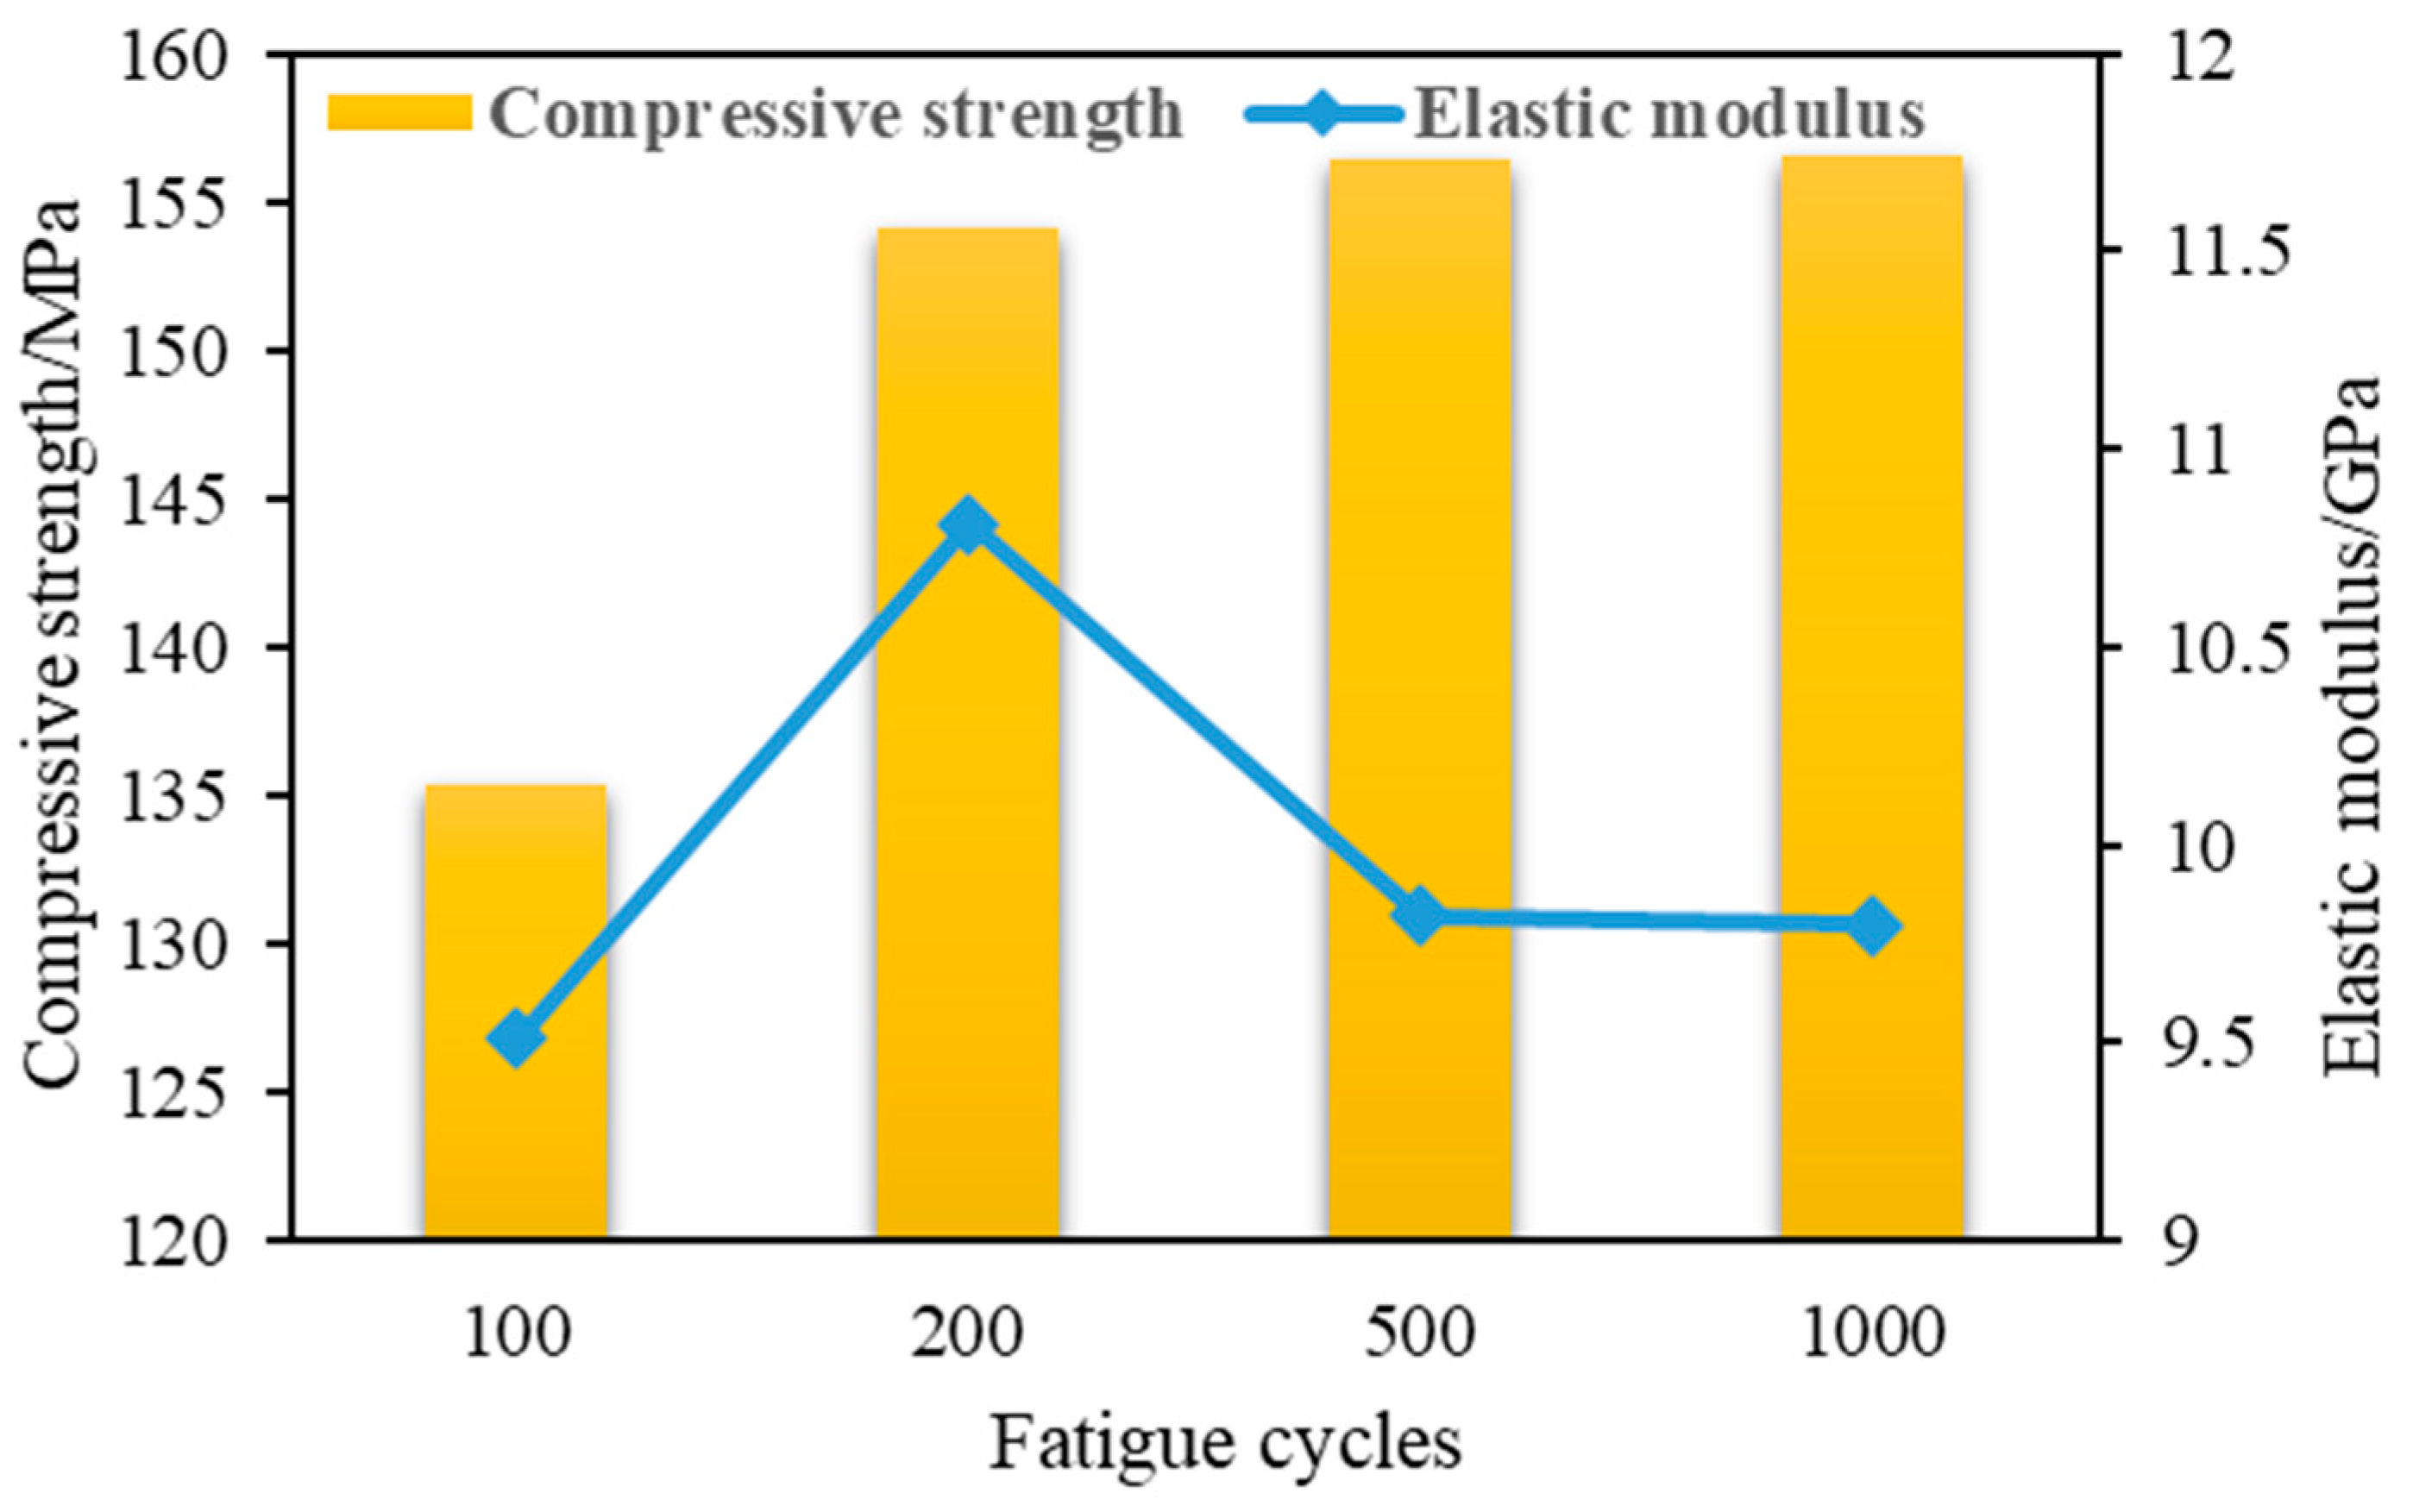
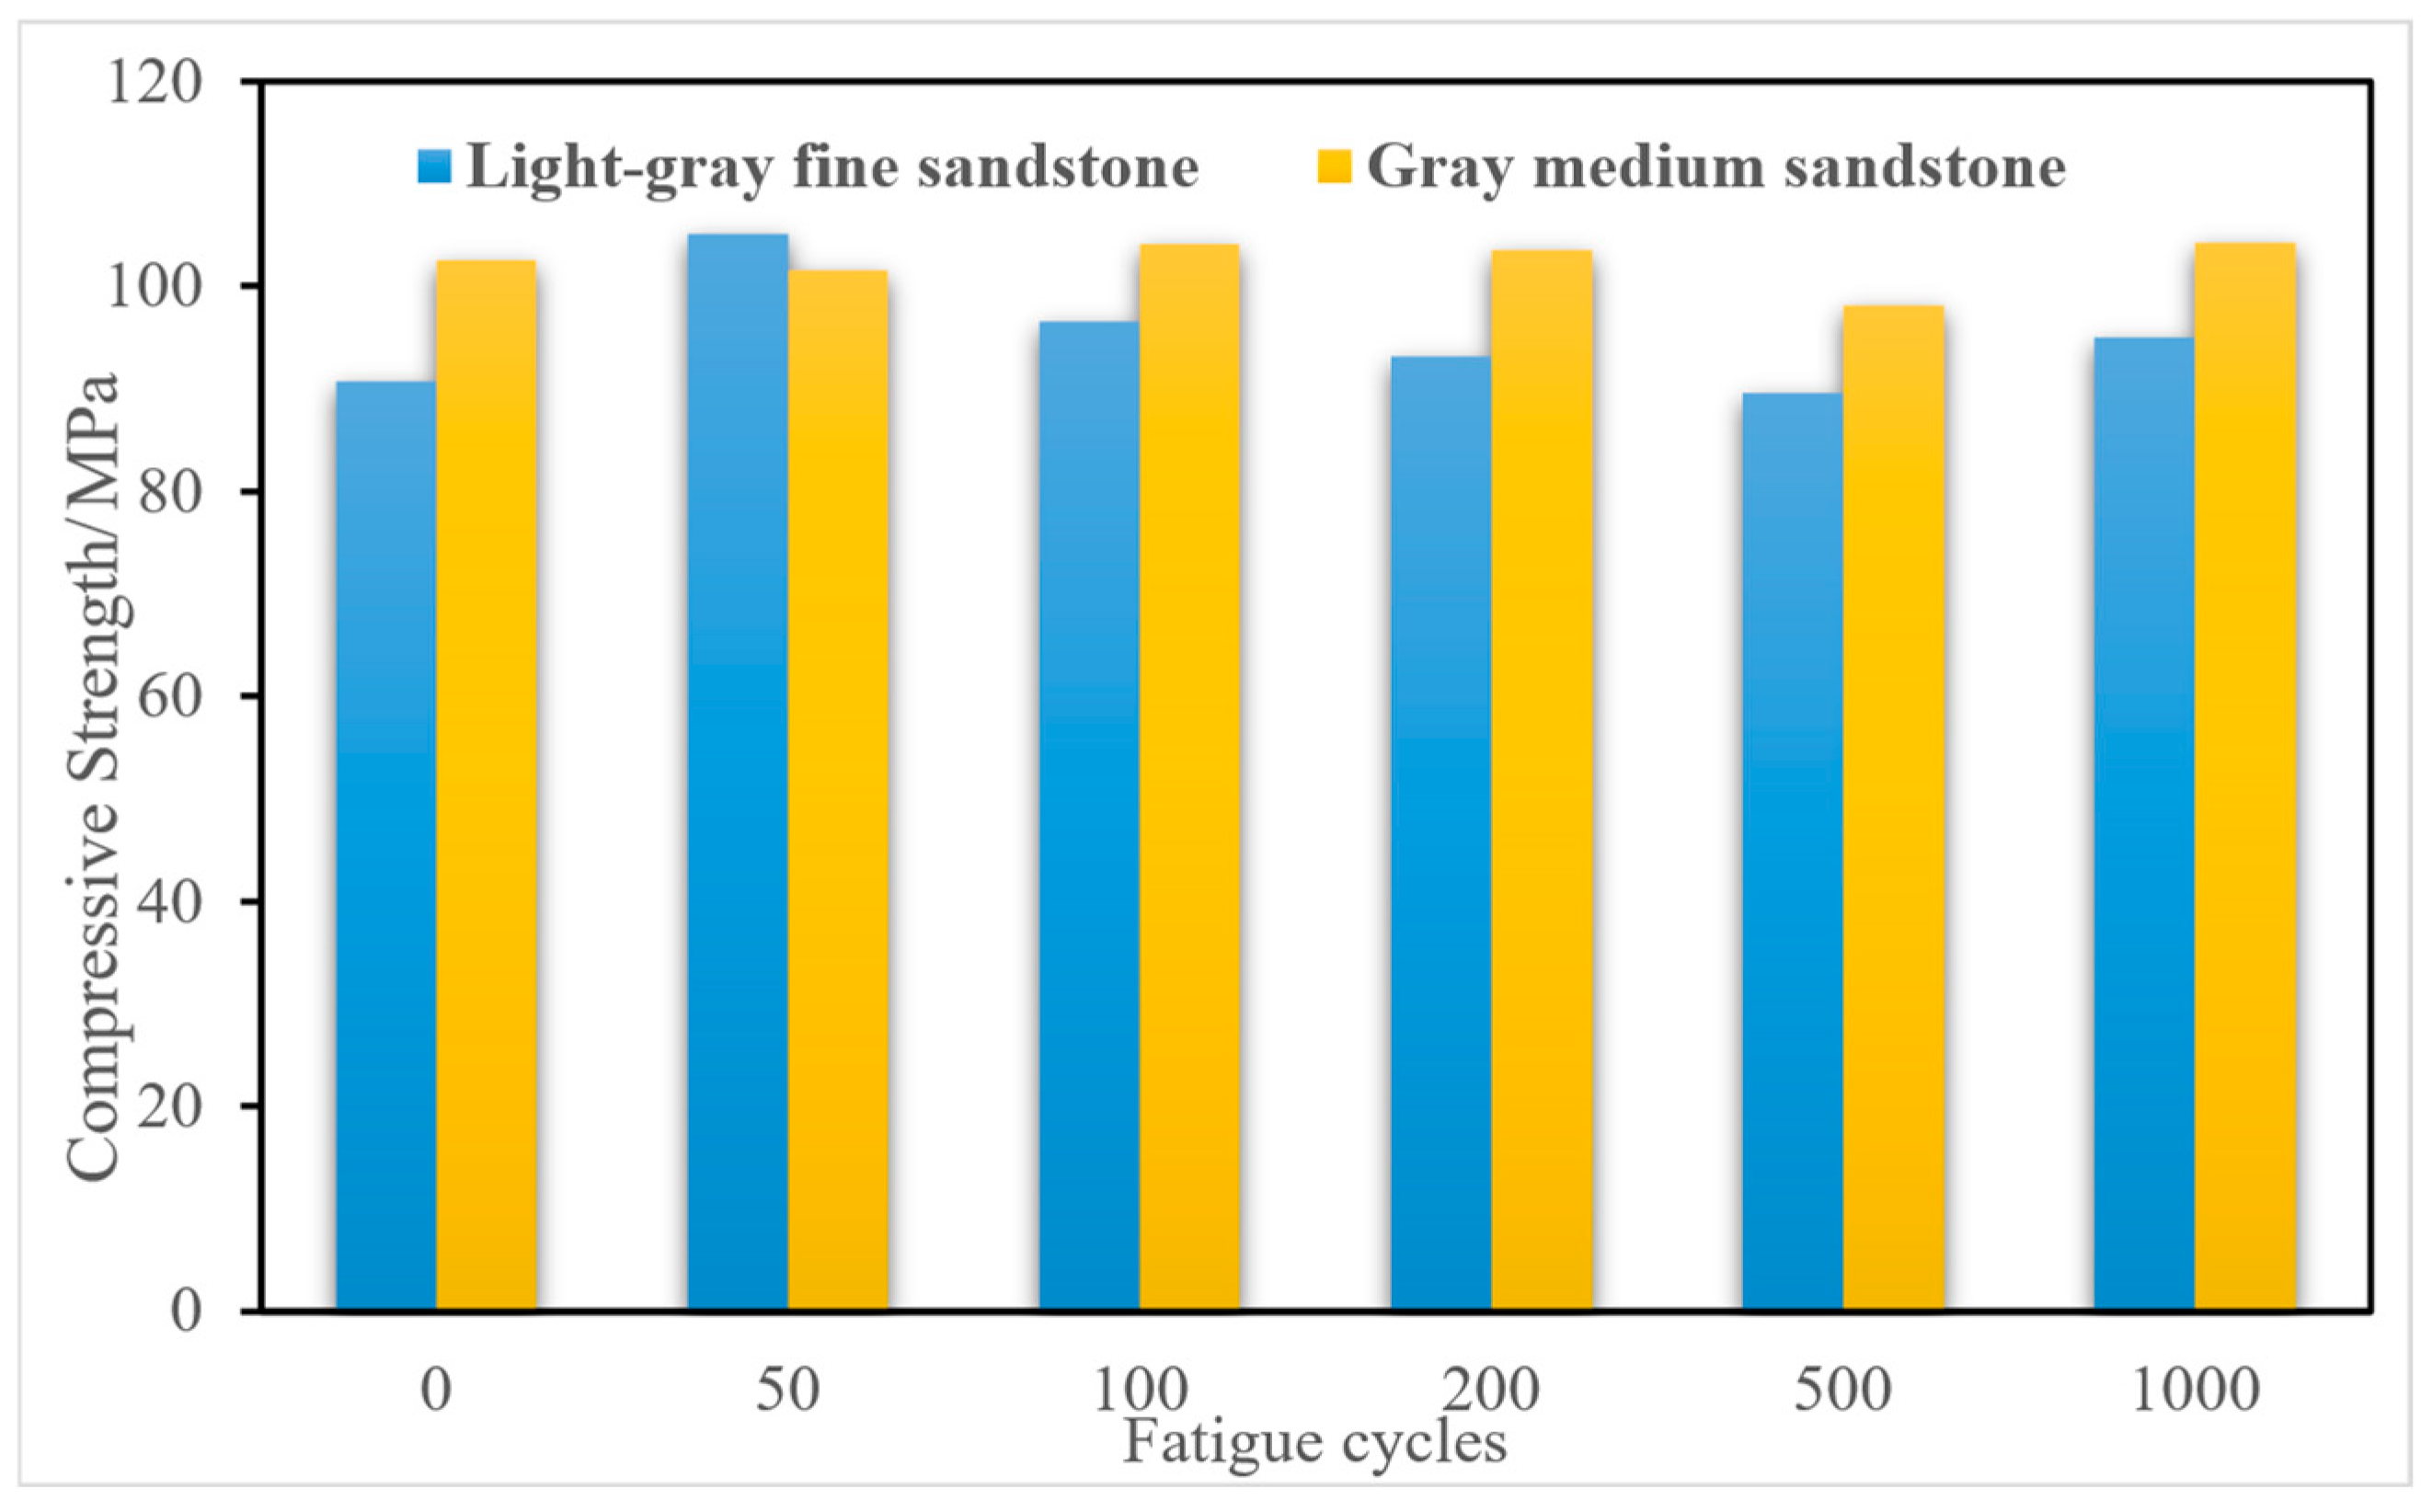
The results of the triaxial fatigue experiments for the light-gray fine sandstone and gray medium sandstone in the M reservoir are presented in
Table 7. The “Core Number” represents the well number and the core number. For example, MB18-3 represents the 3rd core of Well 18 in Gas Reservoir M.
Figure 8 illustrates the comparison of compressive strength for these two sandstones under varying fatigue cycles. The findings indicated that after 1000 fatigue cycles under pressures ranging from 8 to 12.8 MPa, the rock mechanical properties of the reservoir sandstones exhibited minimal to no alteration. This suggests that the sandstones maintain their structural integrity and mechanical characteristics even after extensive cyclic loading, which is crucial for understanding their behavior in dynamic reservoir conditions.
4.1.2. Reservoir Characteristics Evaluation
(1) Depositional Characteristics
In the M8 block, from north to south, the interbedding of river channels and point bars resulted in poor vertical continuity of sand bodies, while lateral superimposition formed continuous sand sheets. In the III layer, deposition was primarily characterized by river channels and floodplains, with poorly developed point bars, narrow channels, and predominantly lenticular sand bodies interspersed with sand–mud layers, exhibiting poor lateral continuity. The II layer was dominated by point bar and channel deposits, featuring wide channels, well-developed point bars, and box-shaped thick sand bodies with good lateral continuity. The I layer was marked by the interbedding of channel and floodplain deposits with sand–-mud inter-layers. During the deposition periods of sub-layers 2 and 6, well-developed point bars and side bars contributed to good sand body connectivity.
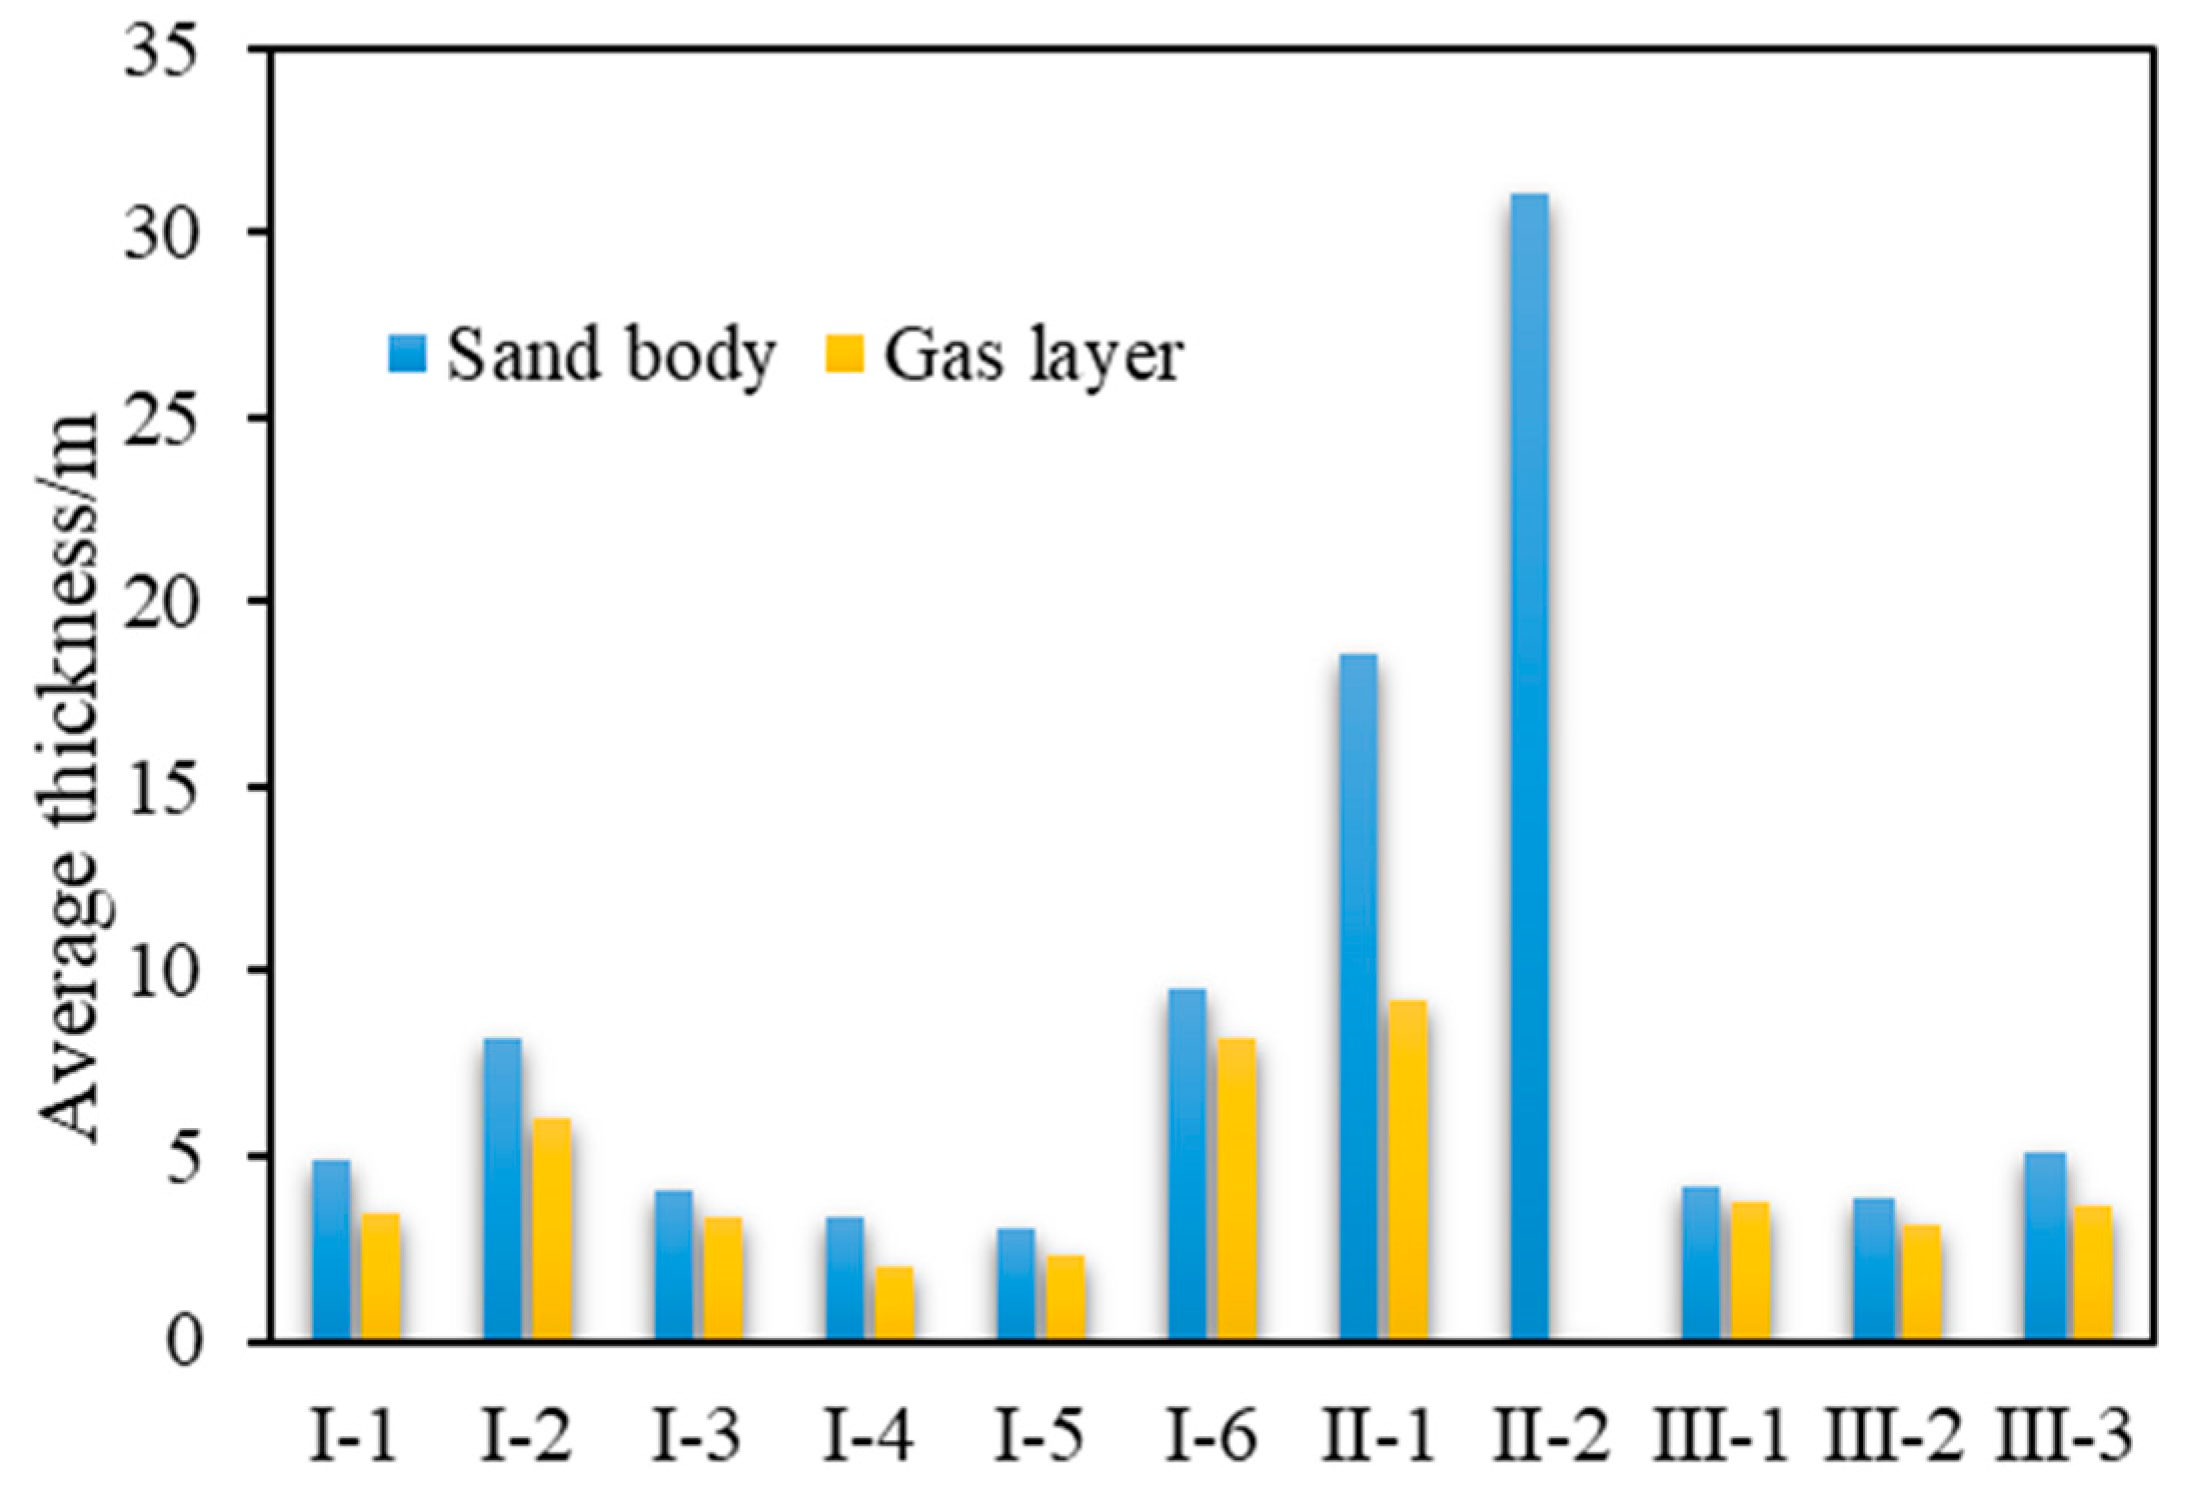
(2) Sandstone distribution
The sand bodies of sub-layers I-2, I-6, II-1, and II-2 exhibited lateral continuity, spanning the entire storage area with relatively greater thickness. In contrast, other sub-layer sand bodies were laterally discontinuous and thinner. Within the I layer, each sub-layer’s sand bodies had moderate thickness, fewer layers, and poor connectivity. The II layer comprised a thick set of sand bodies with good lateral connectivity. In the III layer, each sub-layer’s sand bodies were thin, with more layers but poor lateral connectivity (
Figure 9).
(3) Inter-layer distribution
The inter-layer between sub-layers I-2 and I-6 in the M8 block exhibited stable distribution, with an average thickness of 40.8 m. In Well M-8-P-1, the inter-layer between sub-layers I-2 and I-6 was measured at 33.3 m, slightly thinner compared to adjacent wells.
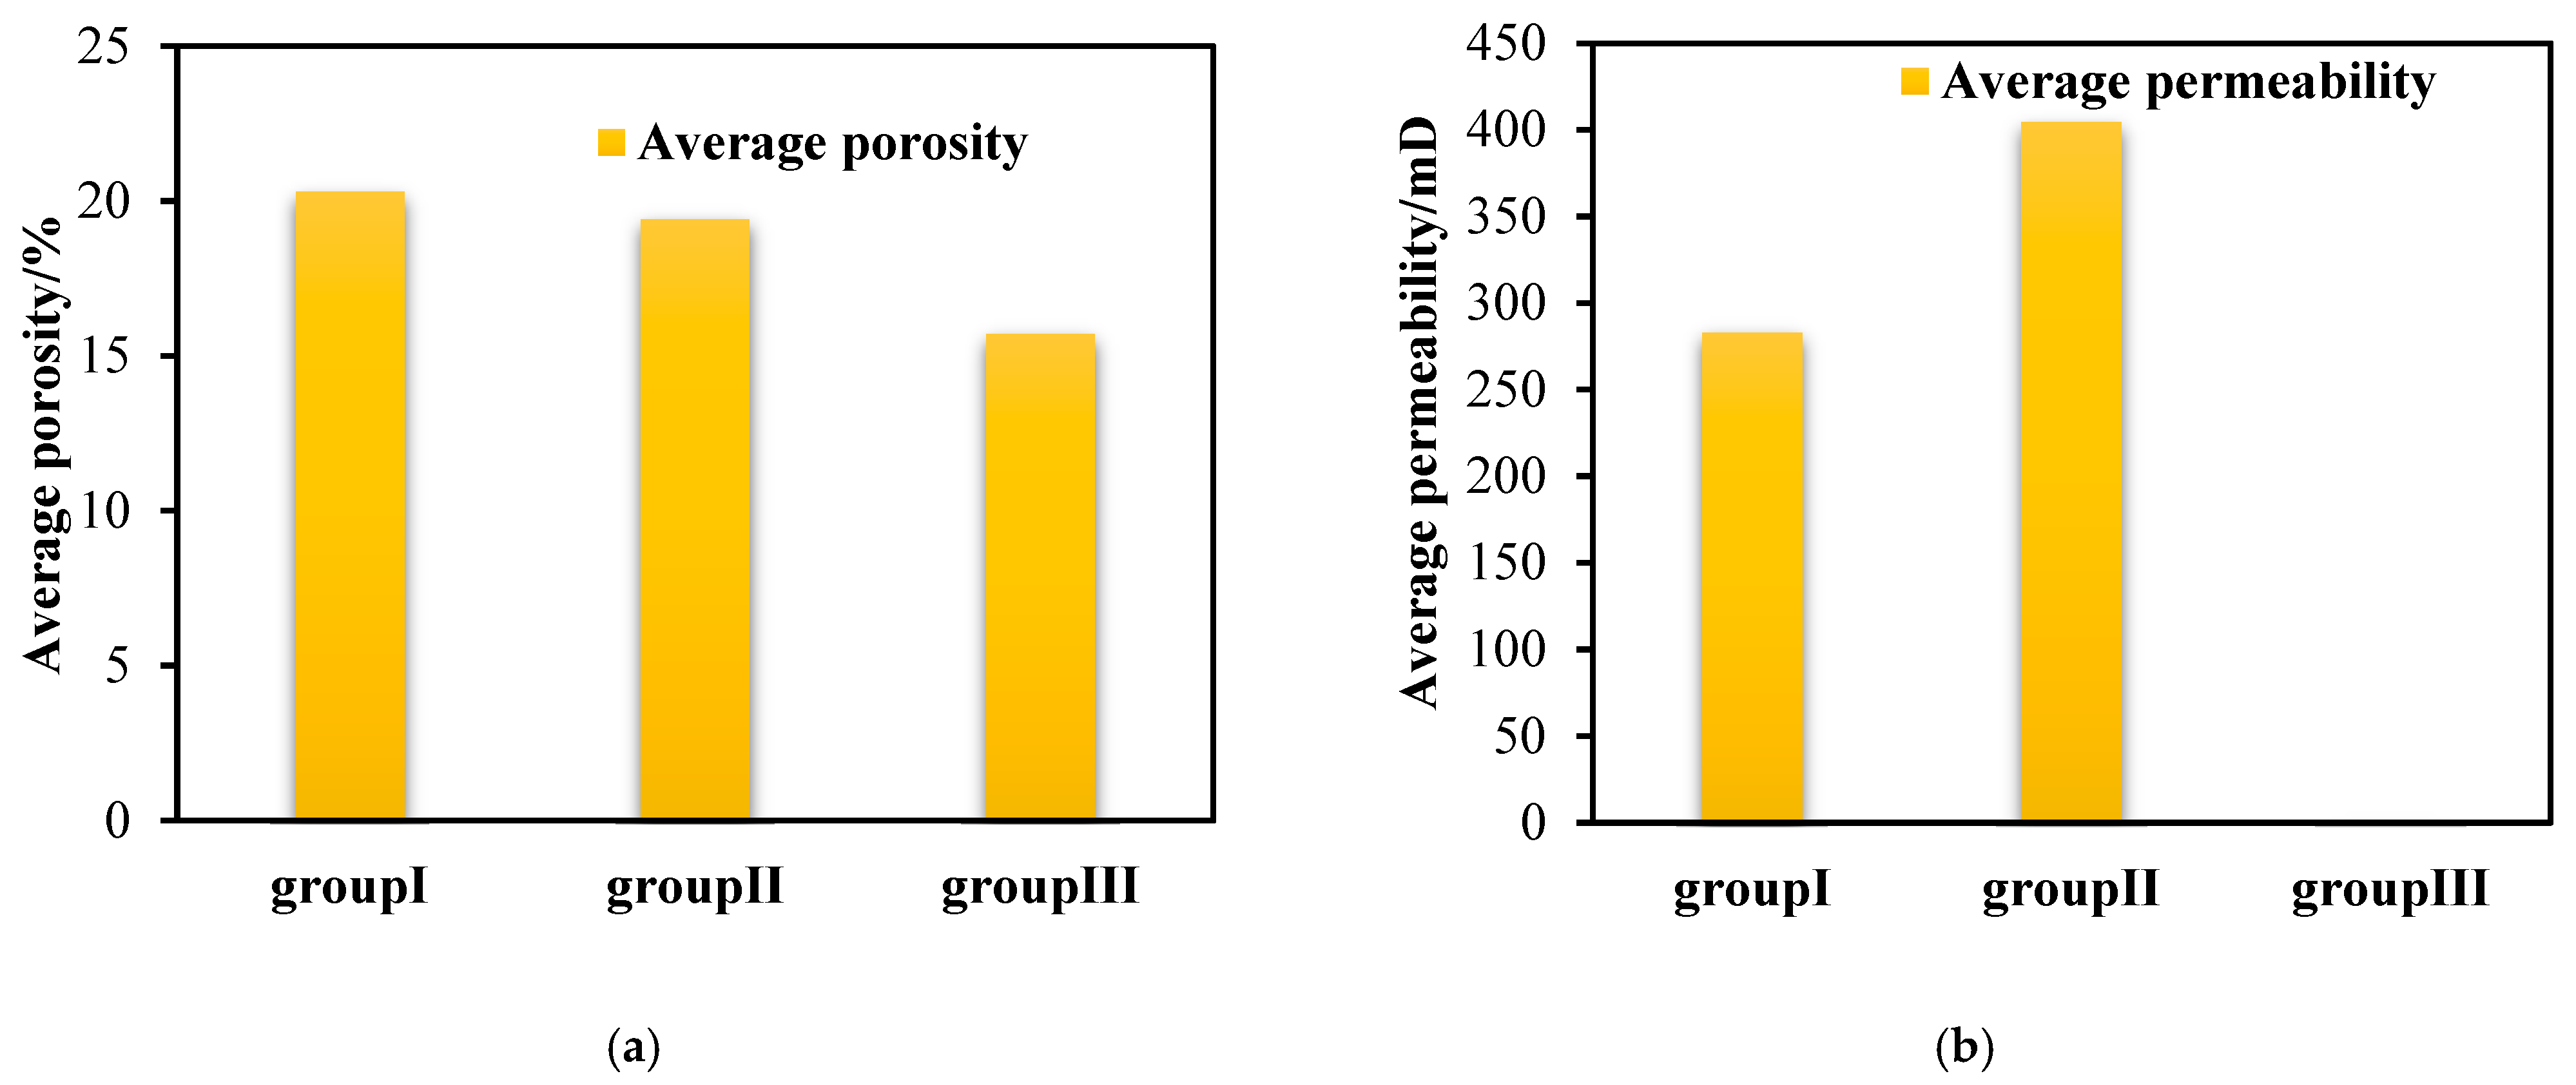
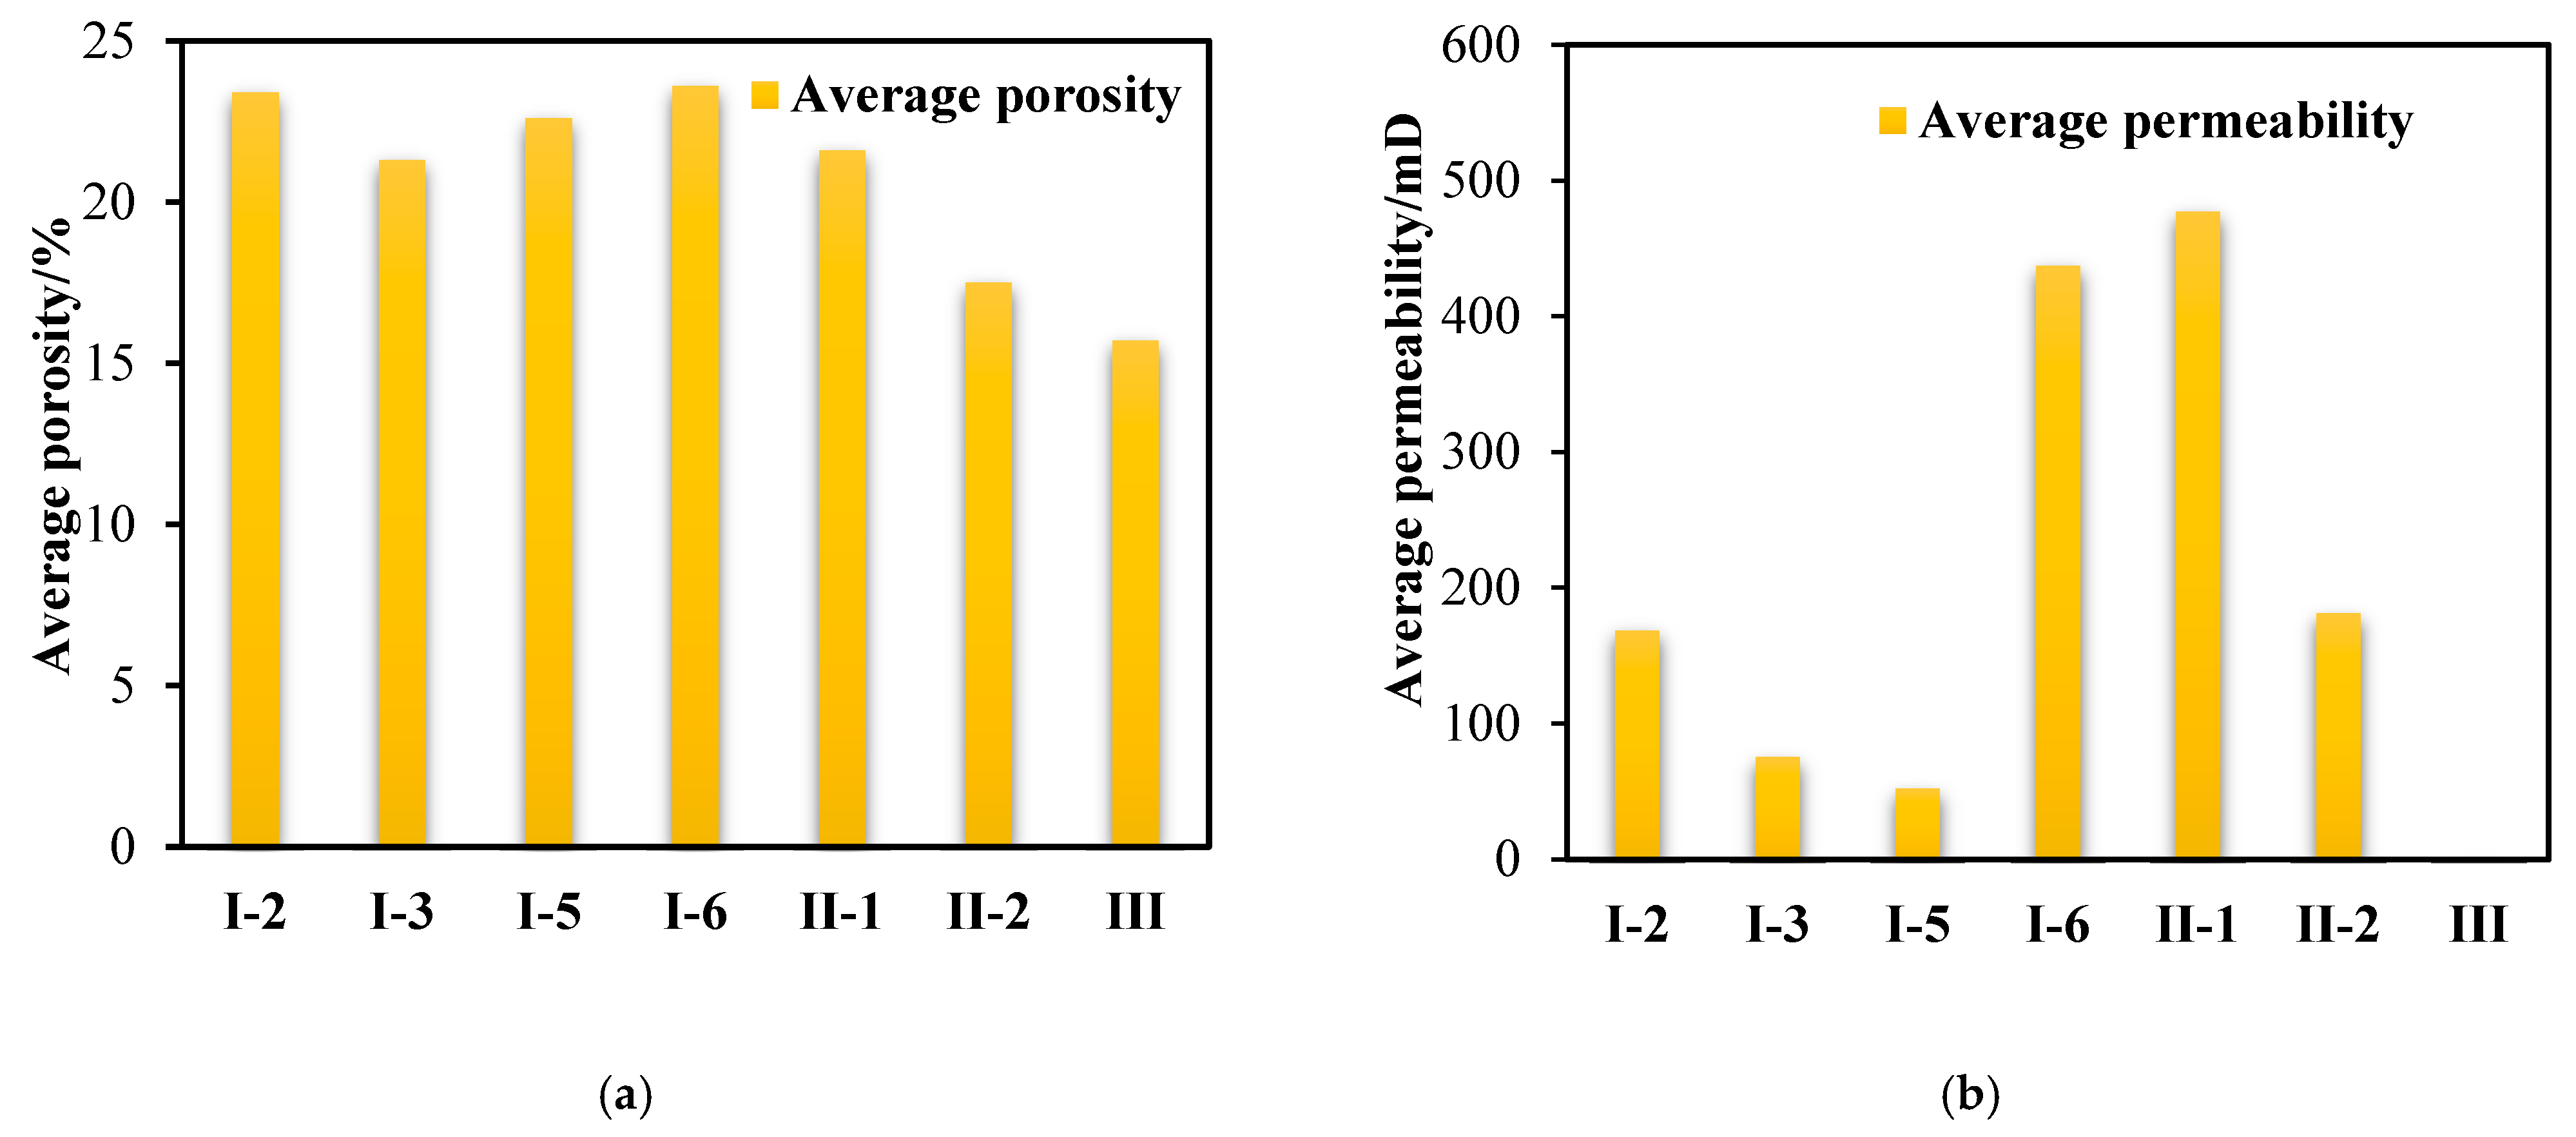
(4) Rock porosity and permeability
Based on the statistical analysis of porosity and permeability (
Figure 10 and
Figure 11), the I and II layers exhibited significantly better reservoir properties compared to the III layer. Specifically, the porosity and permeability values of sub-layers I-2, I-6, and II-1 were superior to those of other sub-layers, indicating that these sub-layers possess the highest reservoir quality. This distribution highlights the variability in reservoir properties across different sub-layers and underscores the importance of targeting these high-quality sub-layers for optimal reservoir development and utilization.
4.2. Migration Patterns of Formation Fluids in the M Gas Reservoir
(1) M 8 block
1. The Evaluation of Water Energy
A numerical model was employed to calculate the aquifer volume for the M8 block after the model was history-matched with the full lifecycle production data. The water drive index was calculated using Equation (7). The water drive indices for the main production layers in the M8 block were found to be 0.02, 0.10, and 0.28, respectively. From top to bottom, the water drive index gradually increases, ranging from weak to moderately strong water drive. The evaluation results were generally consistent with the current water-flooding conditions of each layer (
Table 8).
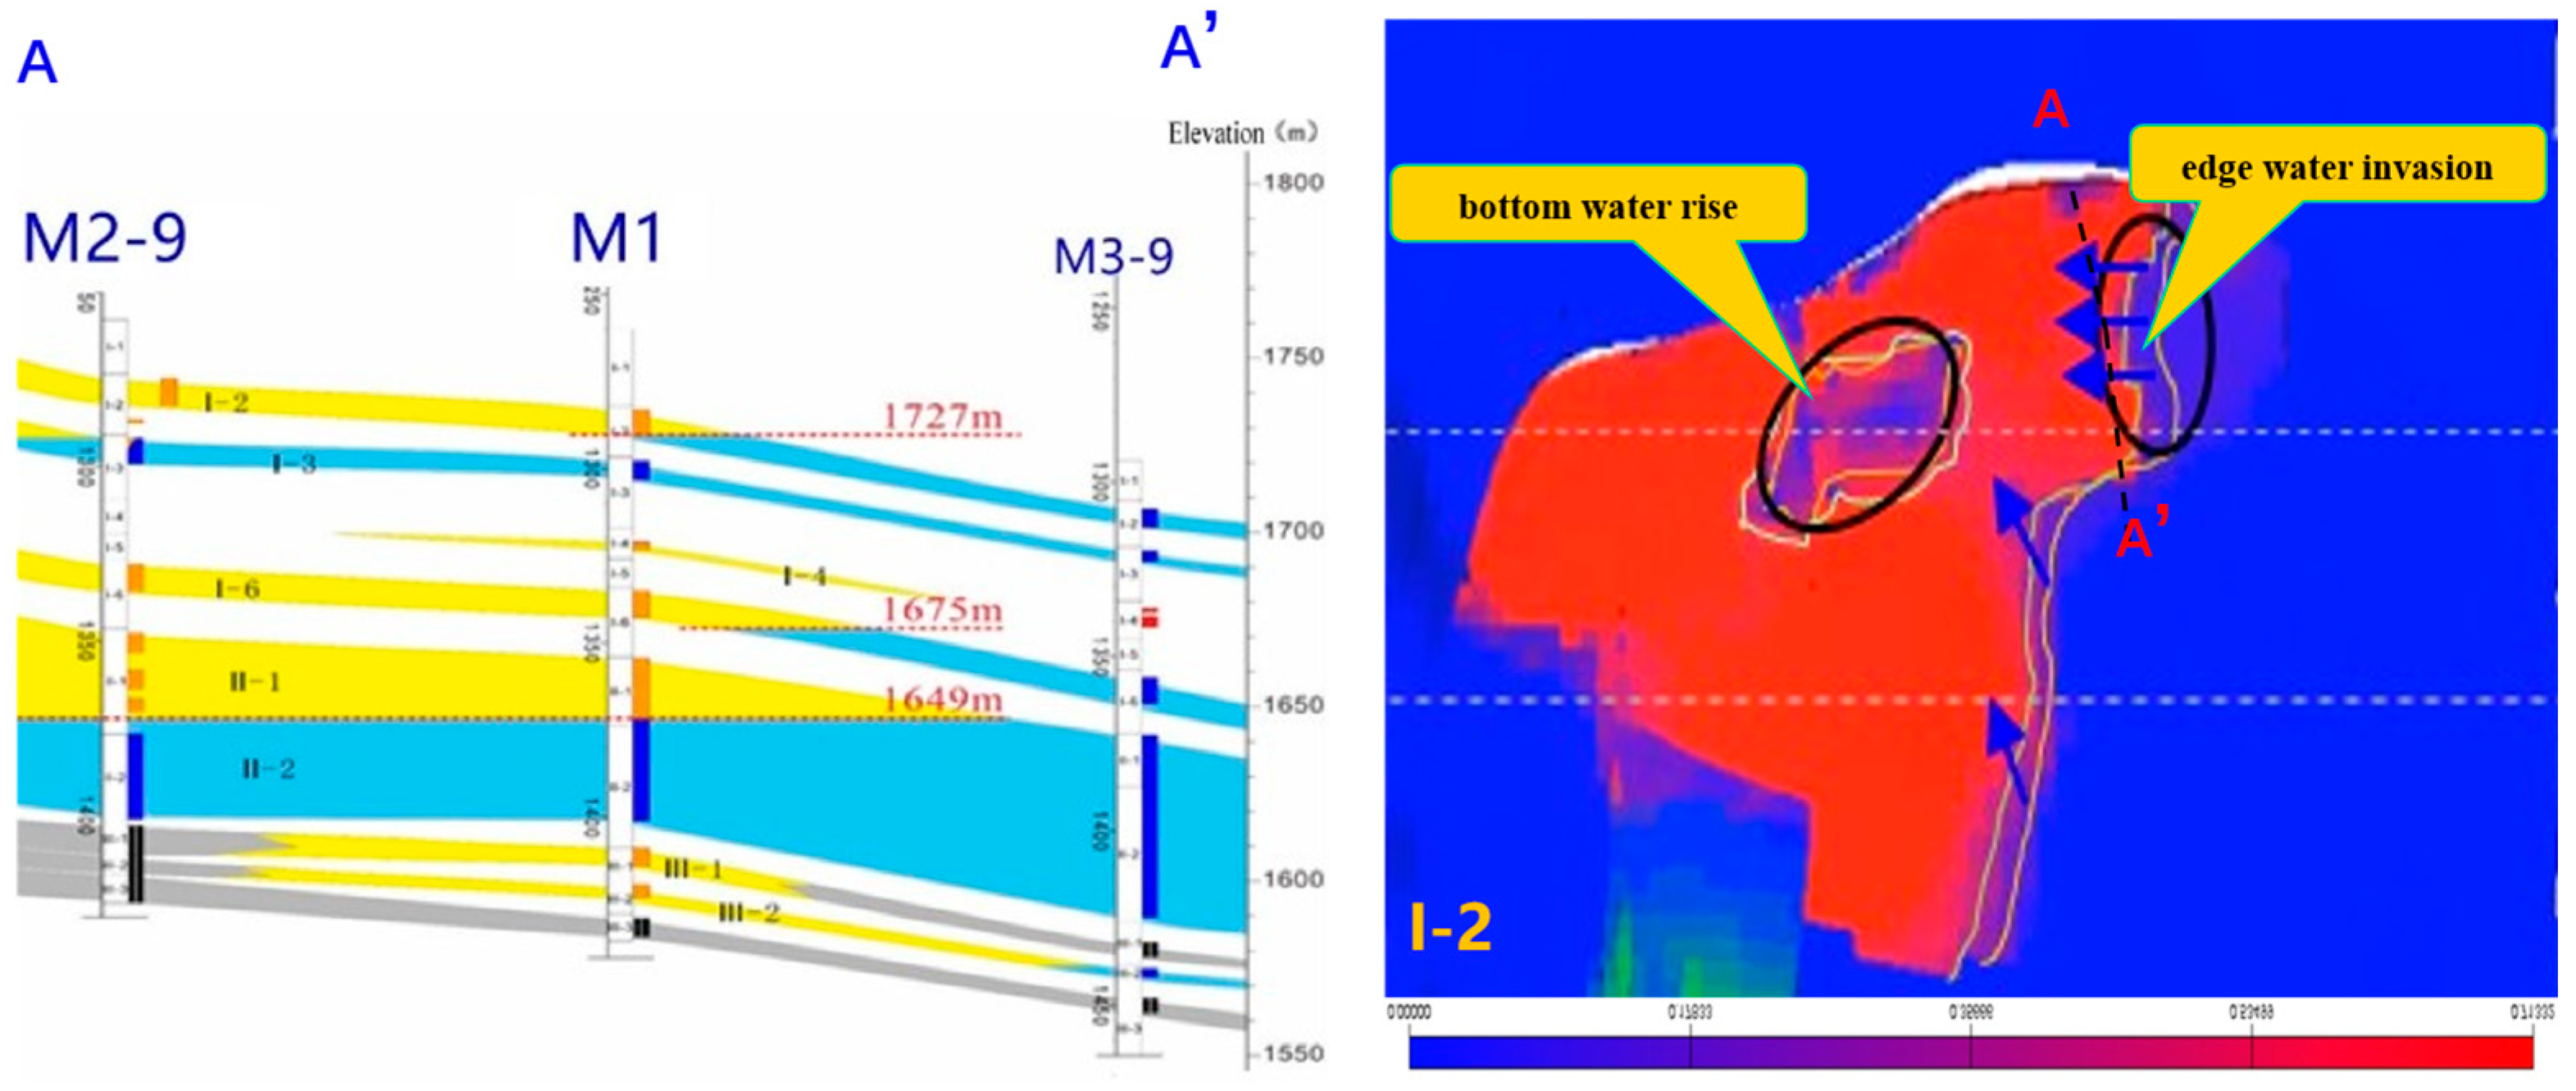
2. Detailed Characterization of Water Invasion Dynamics
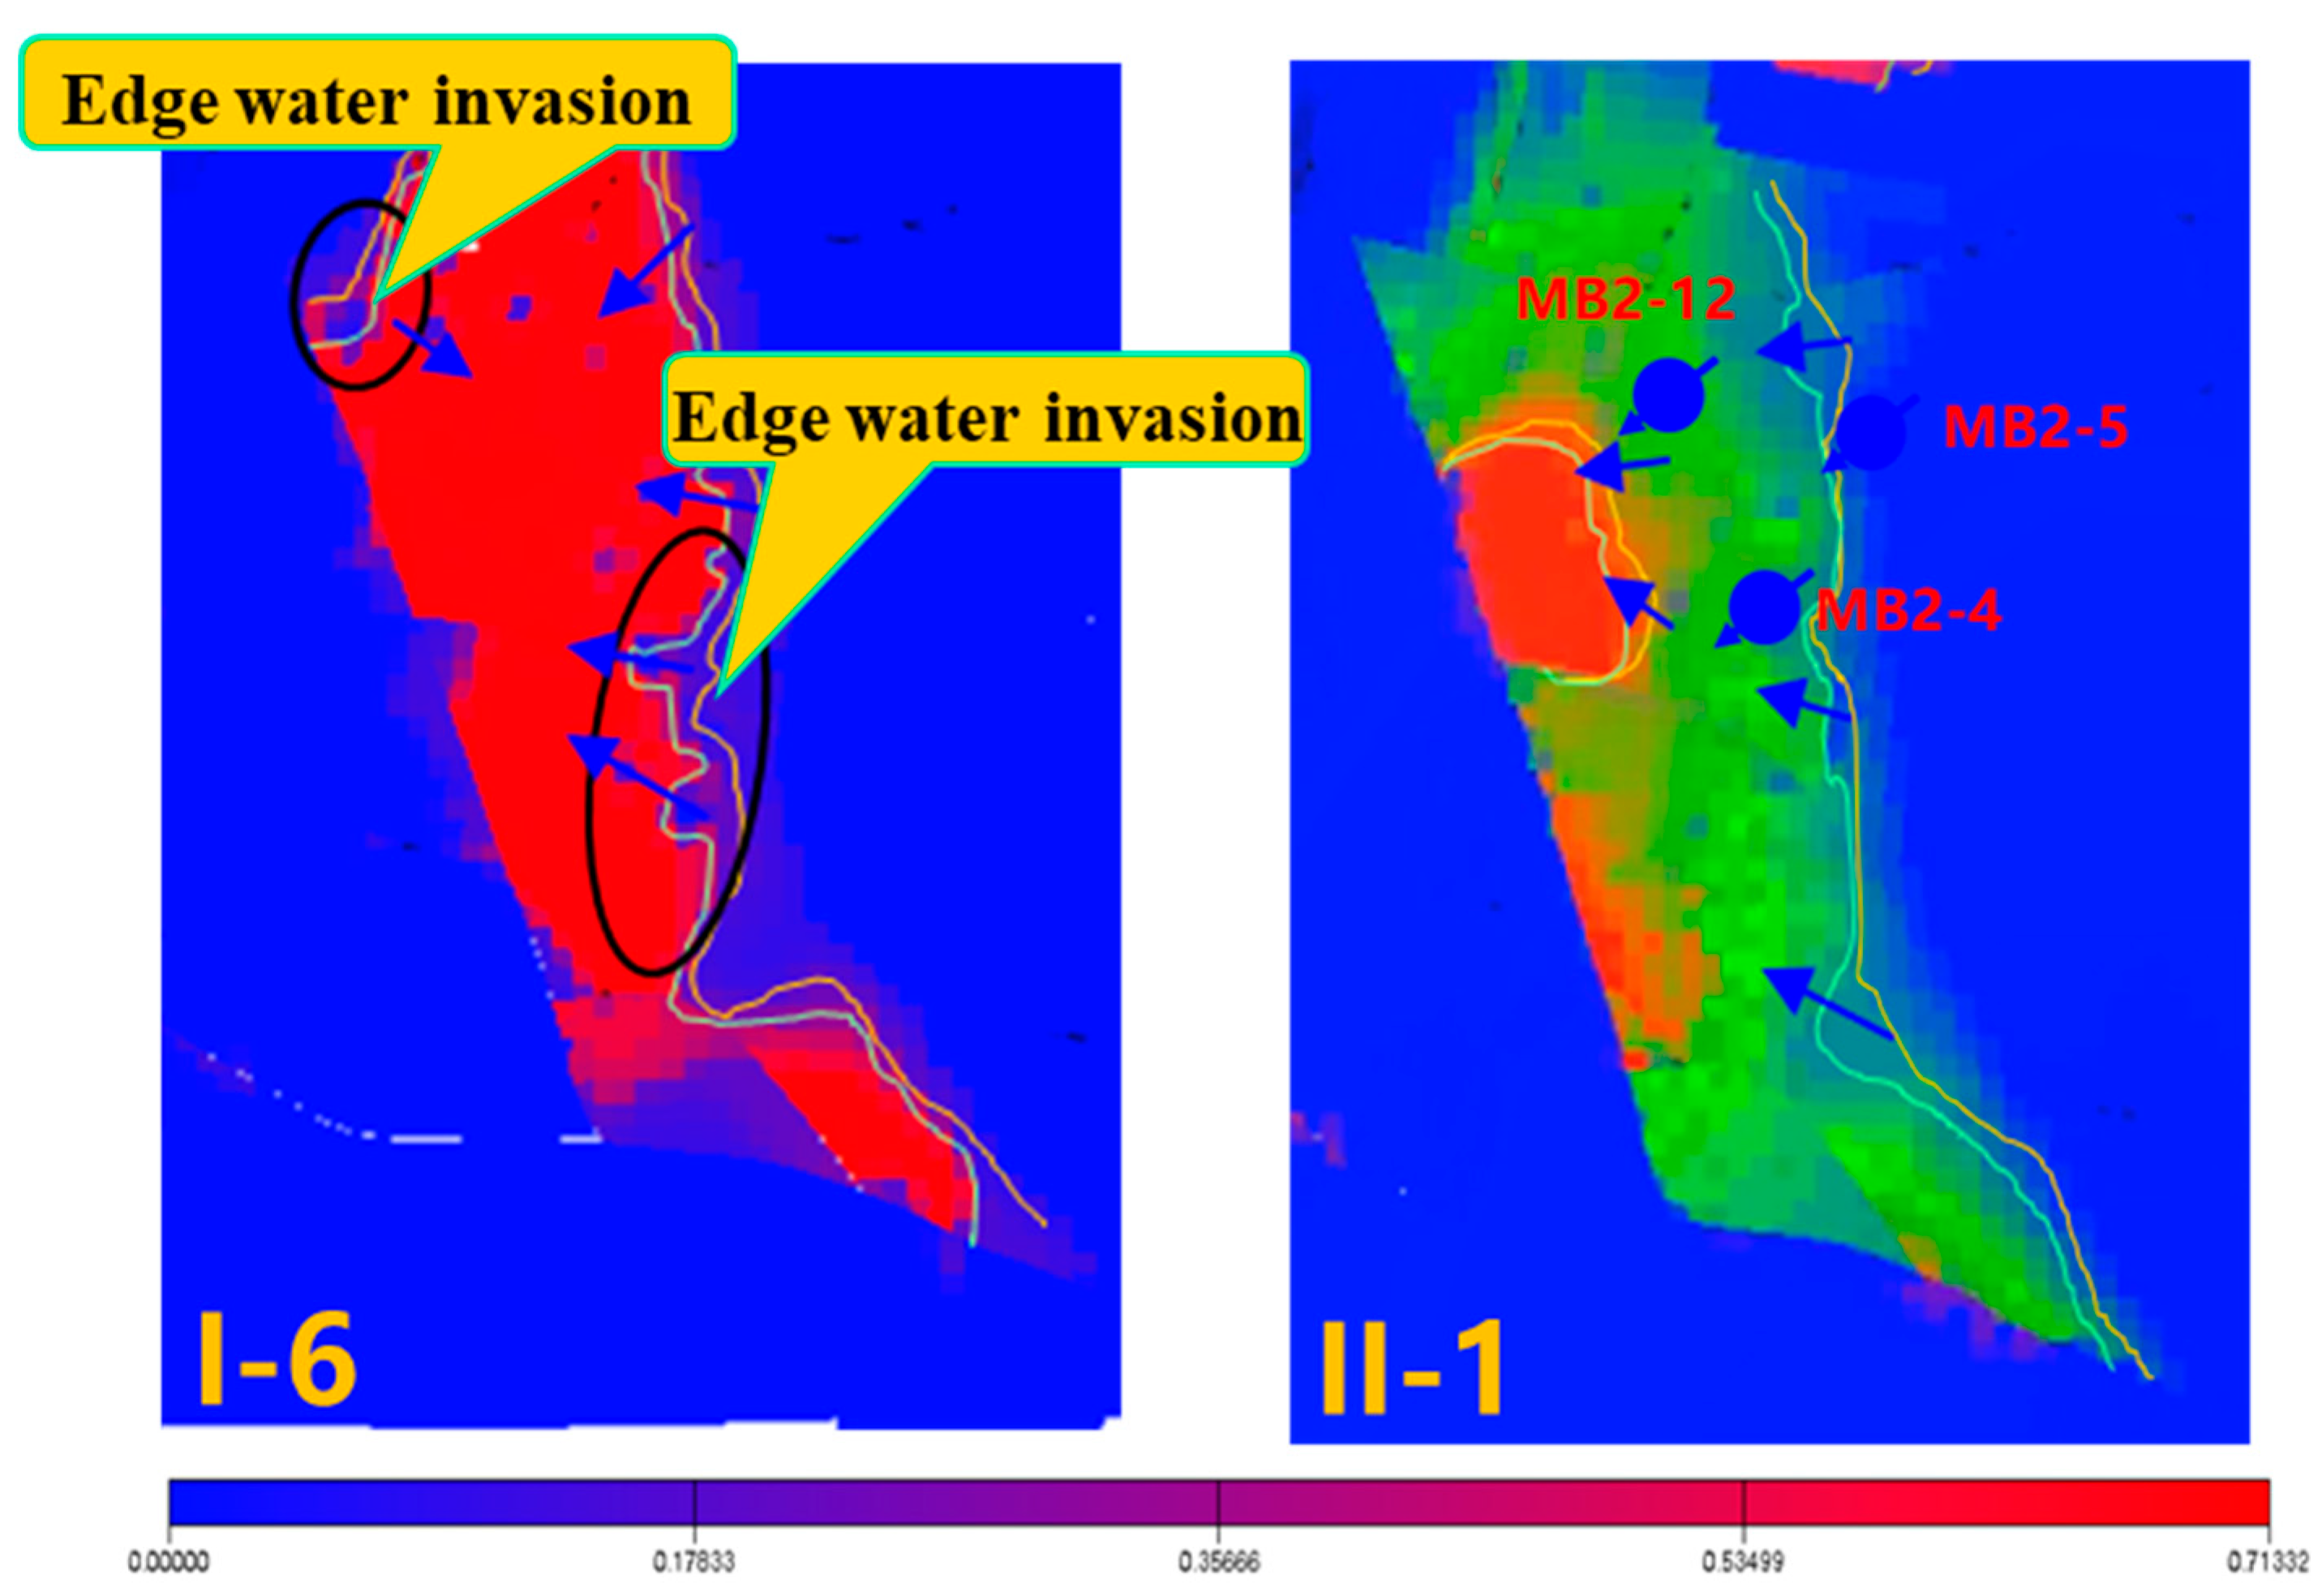
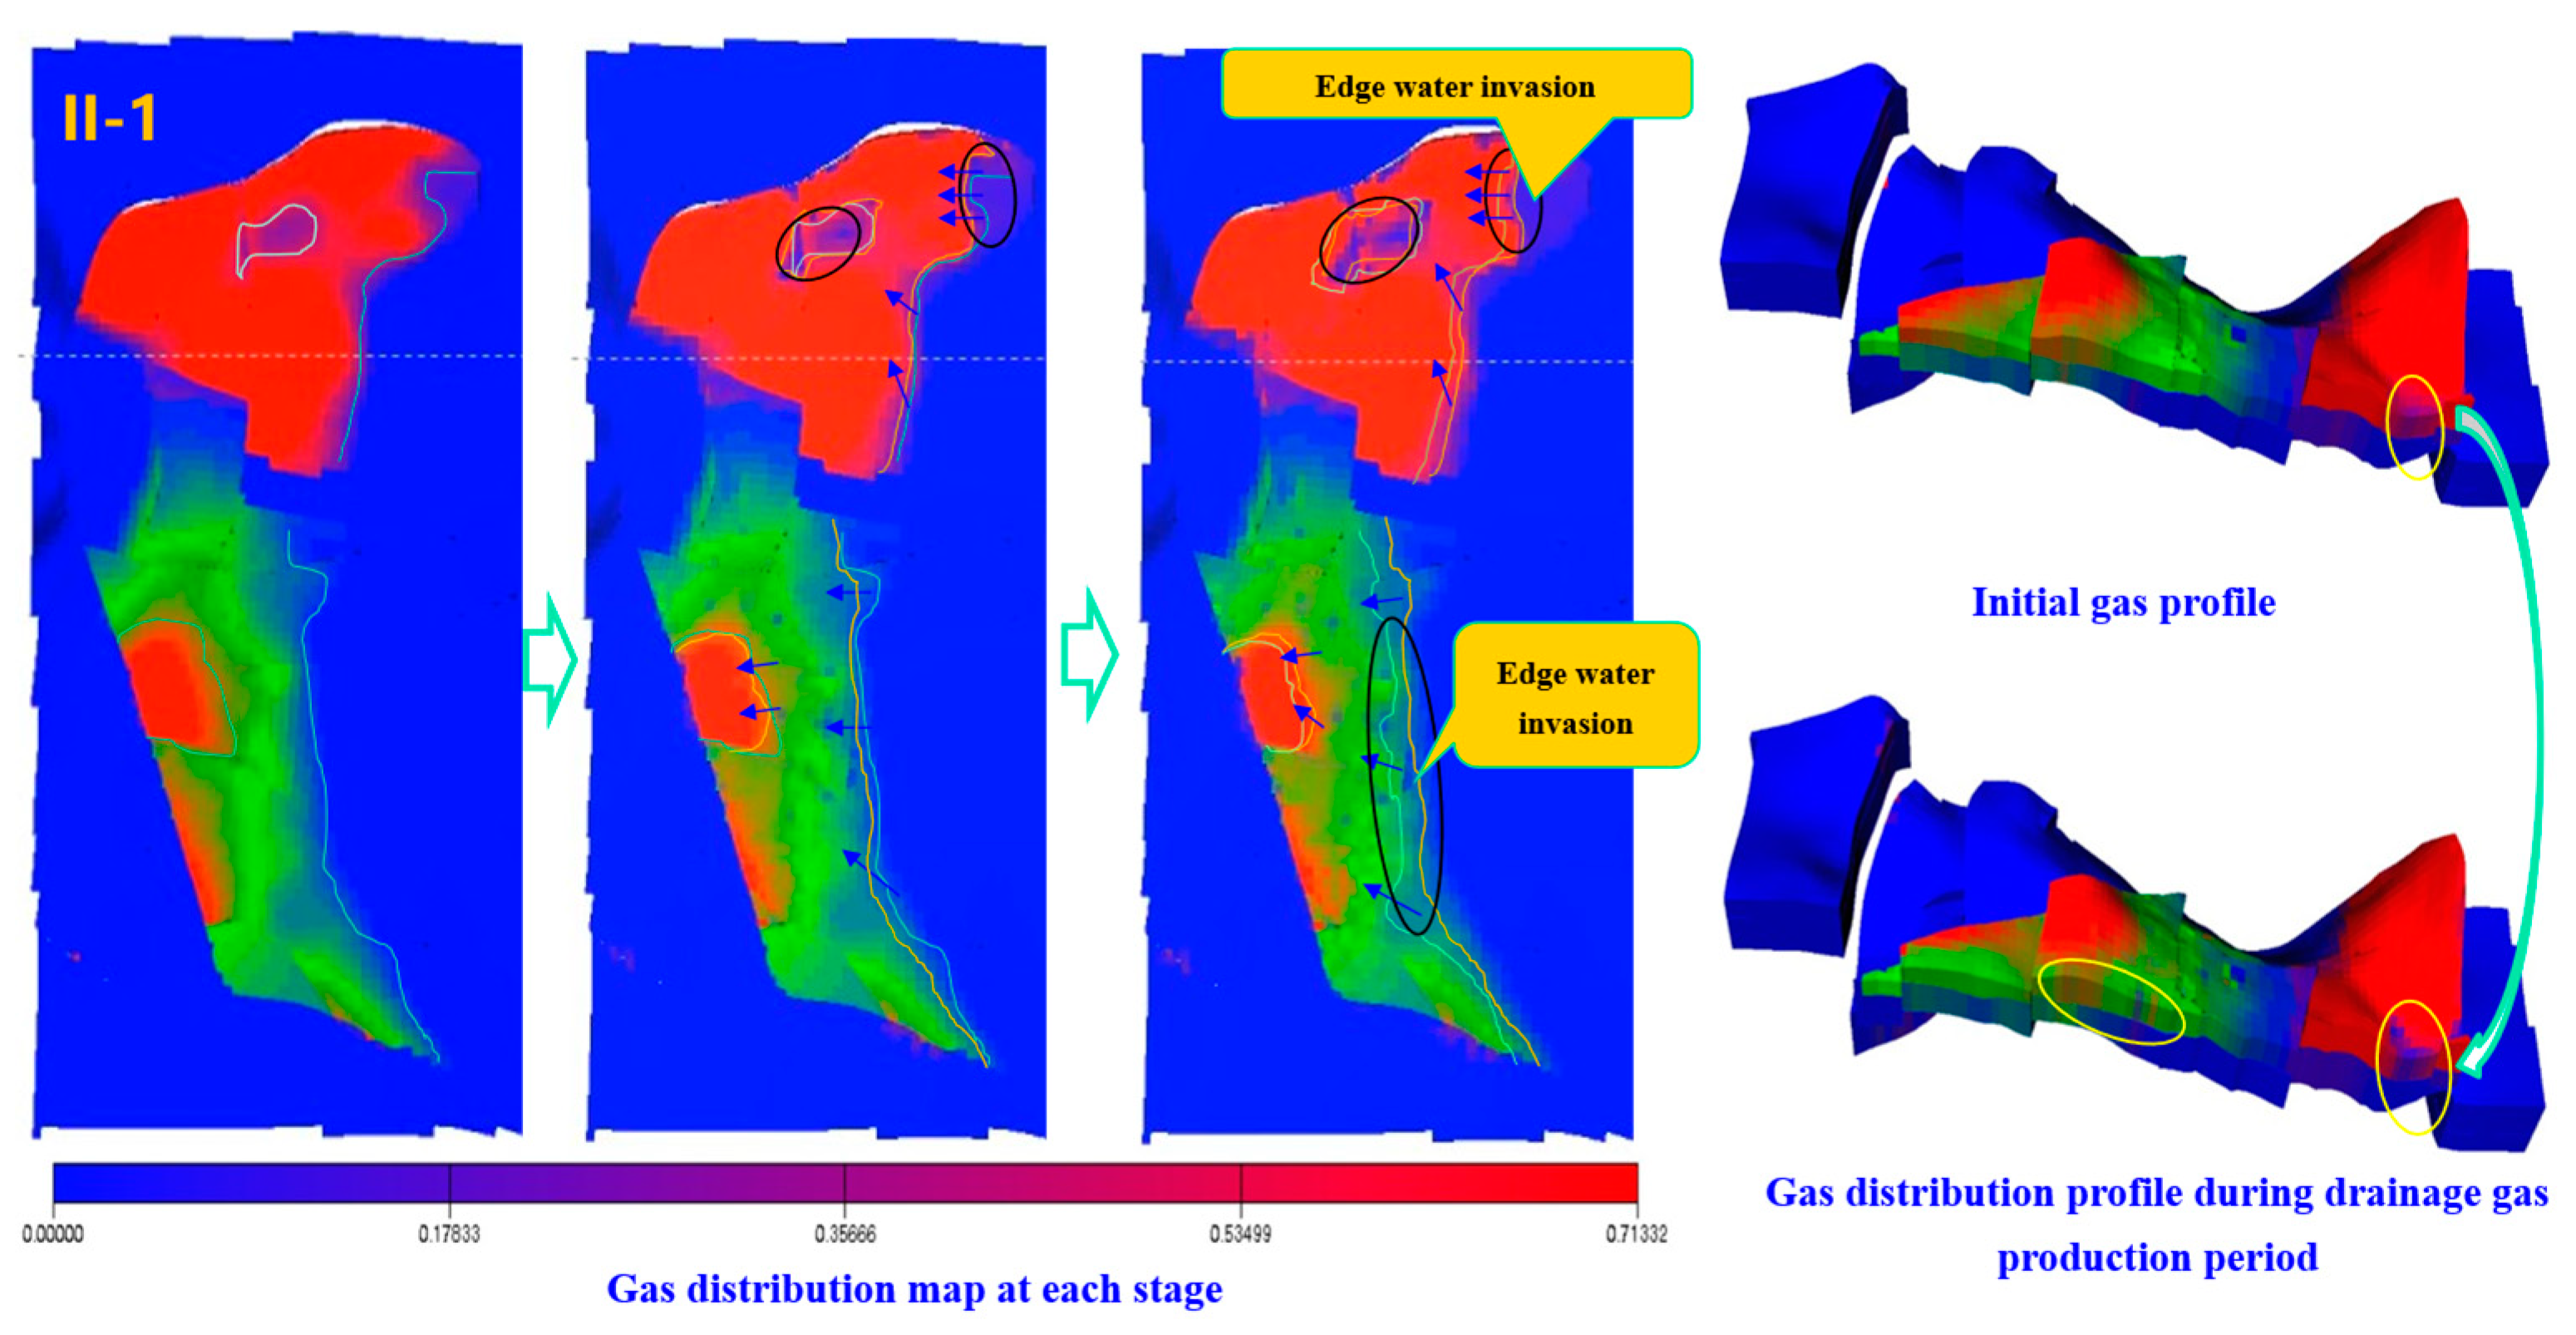
The dynamic history of the entire area shows that gas wells encountering water-producing conditions significantly reduced gas production capacity and extraction efficiency. The direction of edge and bottom water invasion was affected by reservoir property distribution, pressure drop direction, and gas well structural position. Water invasion in the M8 block is predominantly controlled by the pressure drop direction. Affected by bottom water coning, the II-1 layer has a large water influx, with the water-flooded area accounting for 53%. I-2 and I-6 are stratified edge-water gas reservoirs with small water influx, where water-flooded areas account for 33–49% (
Figure 12).
3. Quantitative Characterization of Water Invasion Dynamics
The I-2 layer exhibited minimal water invasion, with an average edge water invasion distance of 75 m and a water invasion rate of 0.12 m/d in the eastern block, compared to 81 m and 0.90 m/d in the western block. The I-6 layer showed moderate water invasion, characterized by an average edge water invasion distance of 130 m and a water invasion rate of 0.17 m/d. The II-1 layer demonstrated pronounced water invasion, with an average bottom water rise height of 28 m and a rise rate of 3.03 m/a. Based on water-flooding extent and bottom water energy, the I-2 and I-6 layers exhibited significant potential for gas storage development, whereas the II-1 layer showed limited storage potential (
Table 9).
(2) M 14 block
1. Static Evaluation of Aquifer Energy
Calculations showed that the I-2 and I-6 layers exhibited moderately weak water drive characteristics, while the II-1 layer demonstrated a stronger water drive. These evaluation results aligned with the current water-flooding conditions observed in each layer (
Table 10).
2. Detailed Characterization of Water Invasion Dynamics
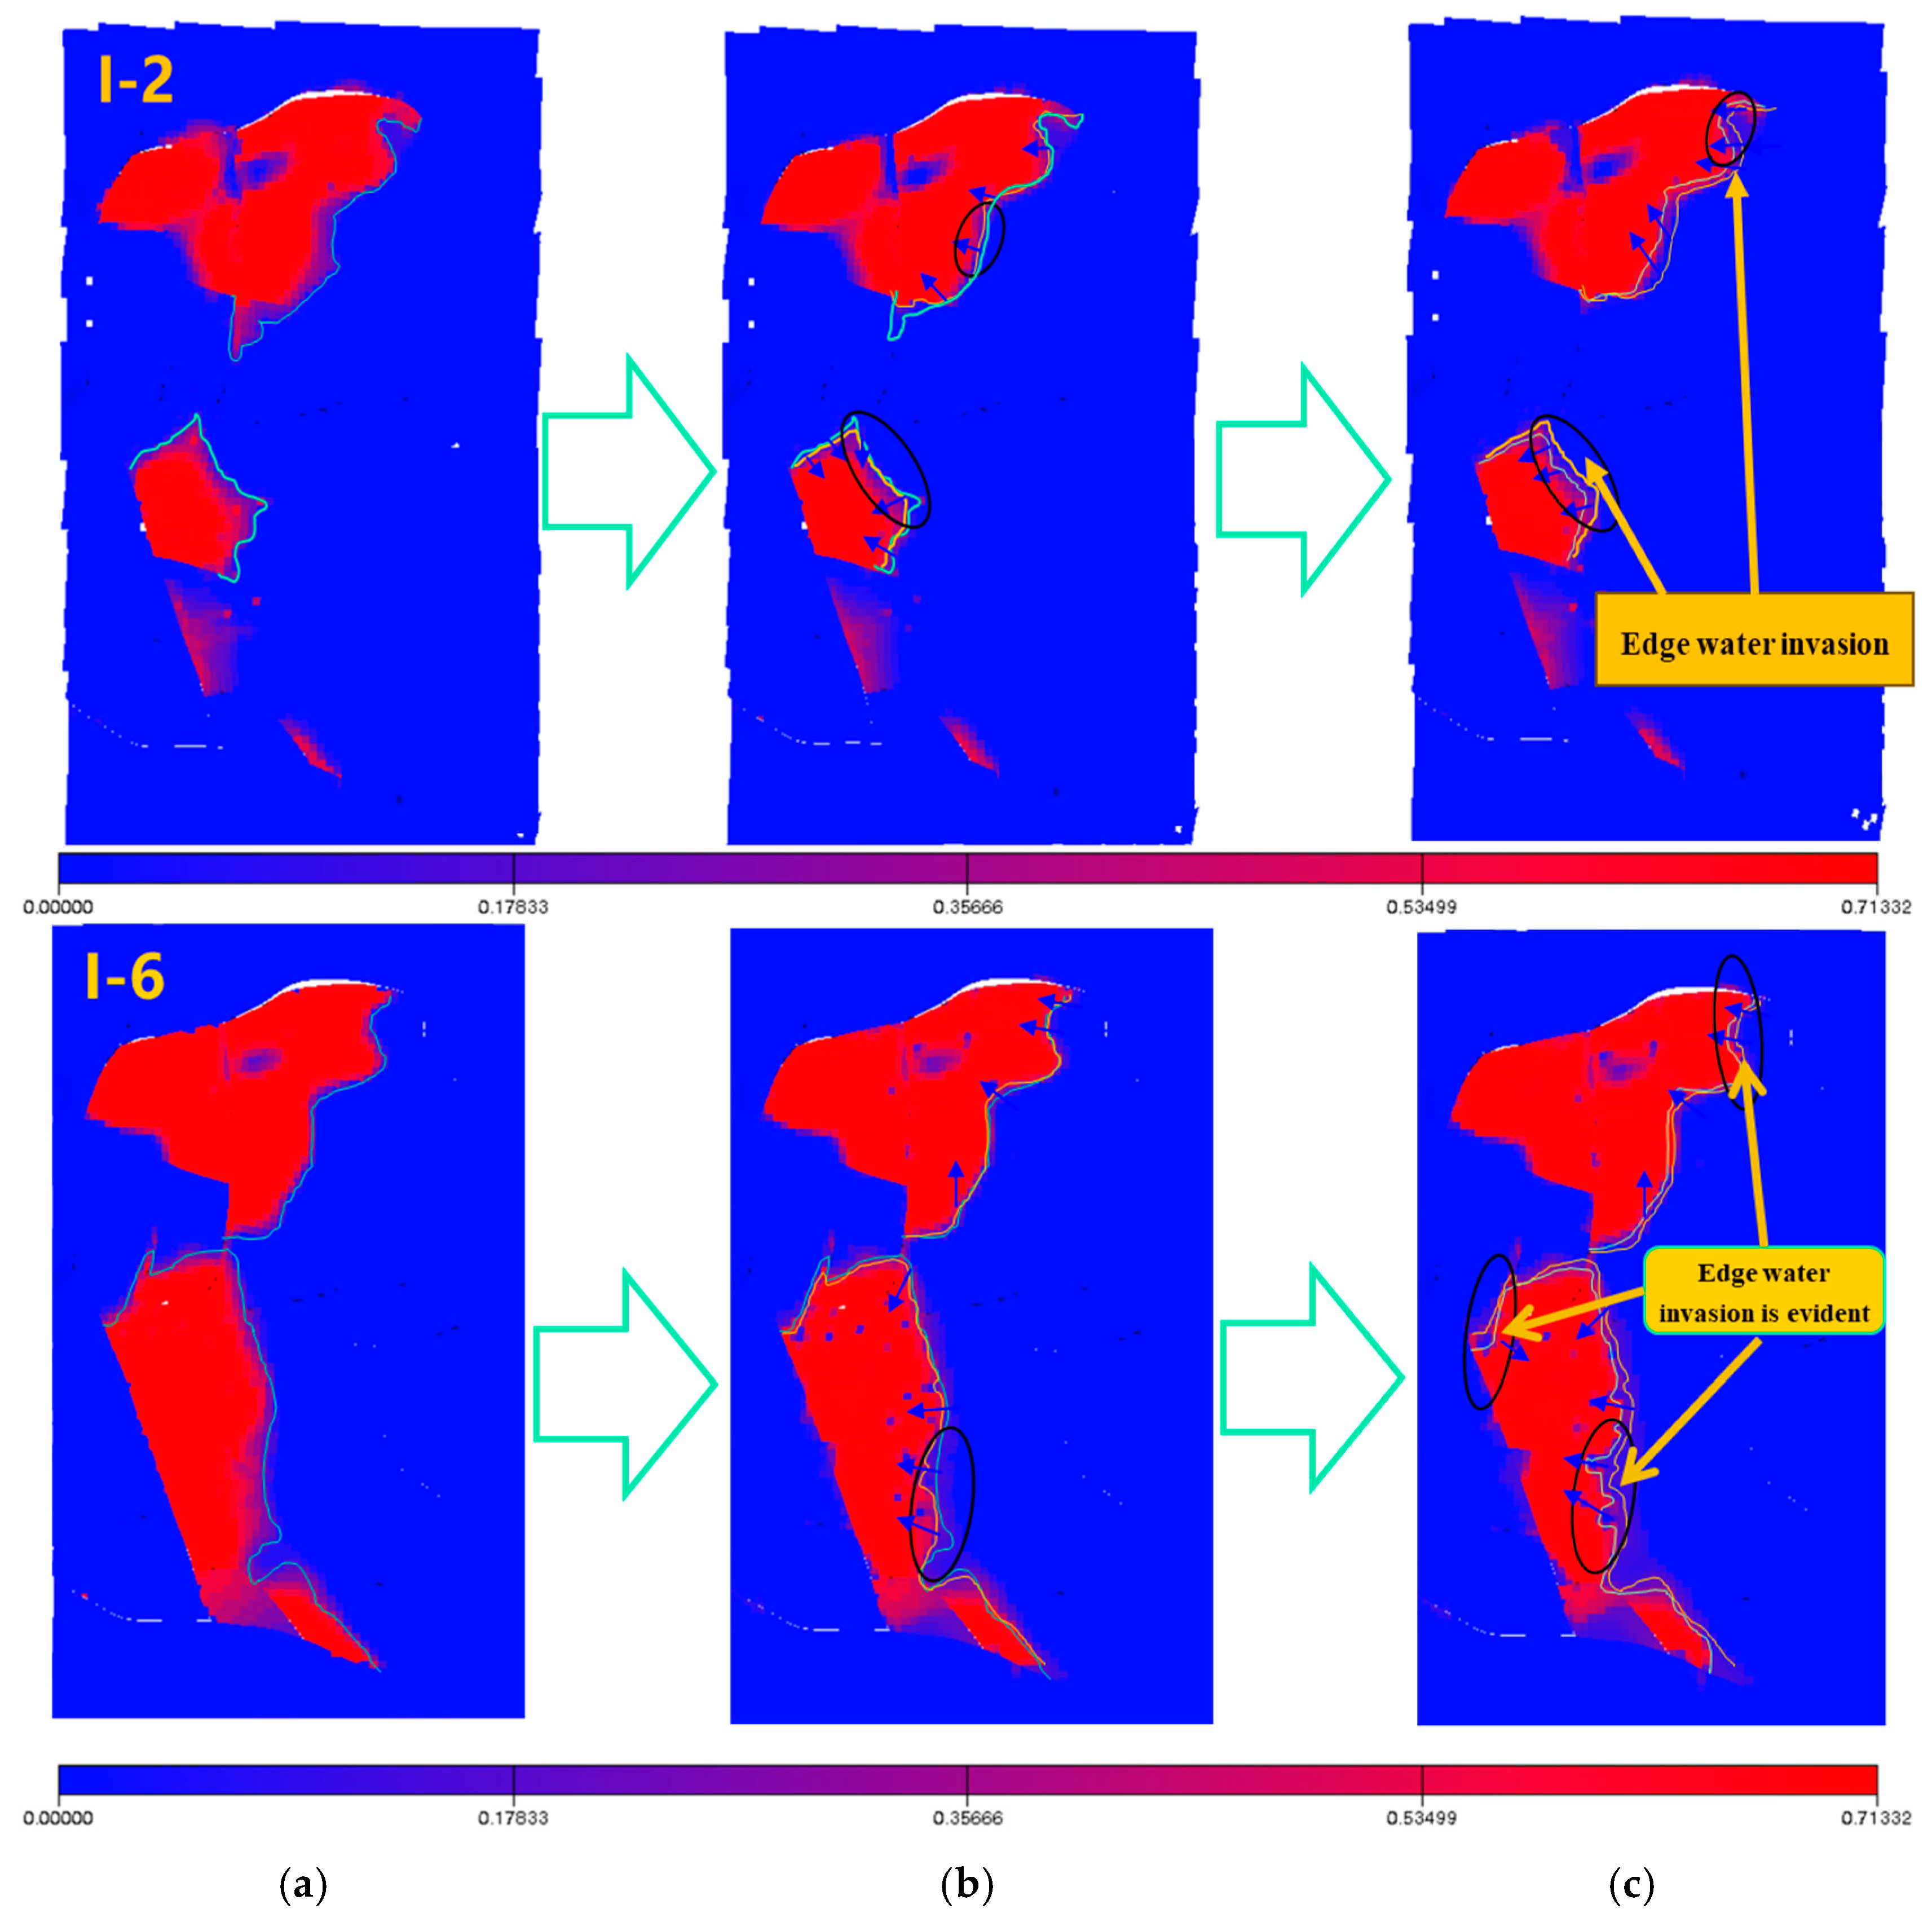
The development dynamics of the M14 block indicate that the historical gas production has led to the formation of water invading the gas-bearing layers, compromising the integrity of the gas layers and diminishing their ability to block bottom water. The direction of water invasion is mainly controlled by the pressure drop. Influenced by water flooding and bottom water coning, the II-1 layer has a significant water influx and a complicated gas–water relationship, with the water-flooded area constituting 74%. I-2 and I-6 are stratified edge-water gas reservoirs featuring small water influx, where the water-flooded areas account for 32–51% (
Figure 13).
3. Quantitative Characterization of Water Invasion Dynamics
The average bottom water rise height was recorded at 29.5 m, with a rise rate of 3.03 m/a (
Table 11). Based on water-flooding extent and bottom water energy, the I-2 and I-6 layers exhibited significant potential for gas storage construction, while the II-1 layer showed limited potential.
The I-2 and I-6 sub-layers in the M8 and M14 blocks exhibited extensive areal distribution with good lateral continuity, substantial thickness, and favorable physical properties. These sub-layers possessed a solid reserve base and exhibited minimal water production impact during the production process. Edge water activity was low, and water invasion was minimal. Overall, these sub-layers met the essential requirements for gas storage capacity and were recommended as optimal layers for gas storage construction.
The II-1 sub-layer exhibited relatively favorable static parameters but was not recommended for gas storage due to its pronounced bottom water energy. Most areas of the sub-layer have been flooded, with a water-flooding degree reaching 70.7%. Therefore, it was deemed unsuitable for gas storage.
4.3. Selection Conclusions
Triaxial fatigue tests on the caprock shale showed that, under pressures of 8–12.8 MPa, 1000 fatigue cycles had no significant impact on the rock mechanical properties of the caprock shale. The caprock in the storage area exhibited laterally continuous distribution, substantial thickness, low permeability, high fatigue resistance, and excellent sealing capacity. Evaluation results indicated that the boundary faults in the storage formation had generally high SGR values. The calculated ultimate shear failure pressure capacity of the caprock was 25.3 MPa, and, after applying an 80% safety factor, the safe pressure capacity was 20.4 MPa. The minimum safe pressure capacity of the faults was 14.6 MPa.
From a geological perspective, the I layer was predominantly characterized by interbedding between channel and floodplain deposits, with alternating sand and mud layers. During the deposition periods of sub-layers I-2 and I-6, point bars and sidebars were well-developed, with good sand connectivity. The reservoir properties of sub-layers I-2 and I-6 were superior to those of other sub-layers, with laterally continuous sandstone distribution covering the entire storage area.
Dynamically, the water drive index of each main production layer in the M 8 and M 14 blocks was calculated, and the evaluation results align with the current water-flooding conditions of the respective layers. In terms of water-flooding degree and bottom water energy, the I-2 and I-6 layers had significant potential for gas storage, while the II-1 layer offered limited potential for storage development.
In conclusion, based on a comprehensive analysis, sub-layers I-2 and I-6 in the M 8 and M 14 blocks were selected as the most favorable strata for gas storage development in the M gas reservoir.
5. Feasibility Analysis of Gas Storage Operations
Due to differences in the gas-bearing area and water flooding extent within the storage formation layer, the injection and production well layout should consider the vertical stacking of gas-bearing zones. Under the principle of maximizing the use of existing wells in complex geological conditions to enhance the economic efficiency of storage development, the feasibility of building a gas storage facility in a multi-layered water-bearing gas reservoir was studied using numerical simulations.
(1) Scheme Design
The design scheme aimed to reach a capacity over six cycles, with a total working gas volume of 263 million cubic meters, of which 152 million cubic meters were allocated to the M 8 block and 110 million cubic meters to the M 14 block. This overall capacity met the design requirements and satisfied peak-shaving needs. The daily water production from the storage was 68 cubic meters, with 36 cubic meters from M 8 and 32 cubic meters from M 14. The mixed well pattern primarily used horizontal wells to control individual storage layers, with combined production and injection through vertical wells.
(2) Capacity and Production Analysis
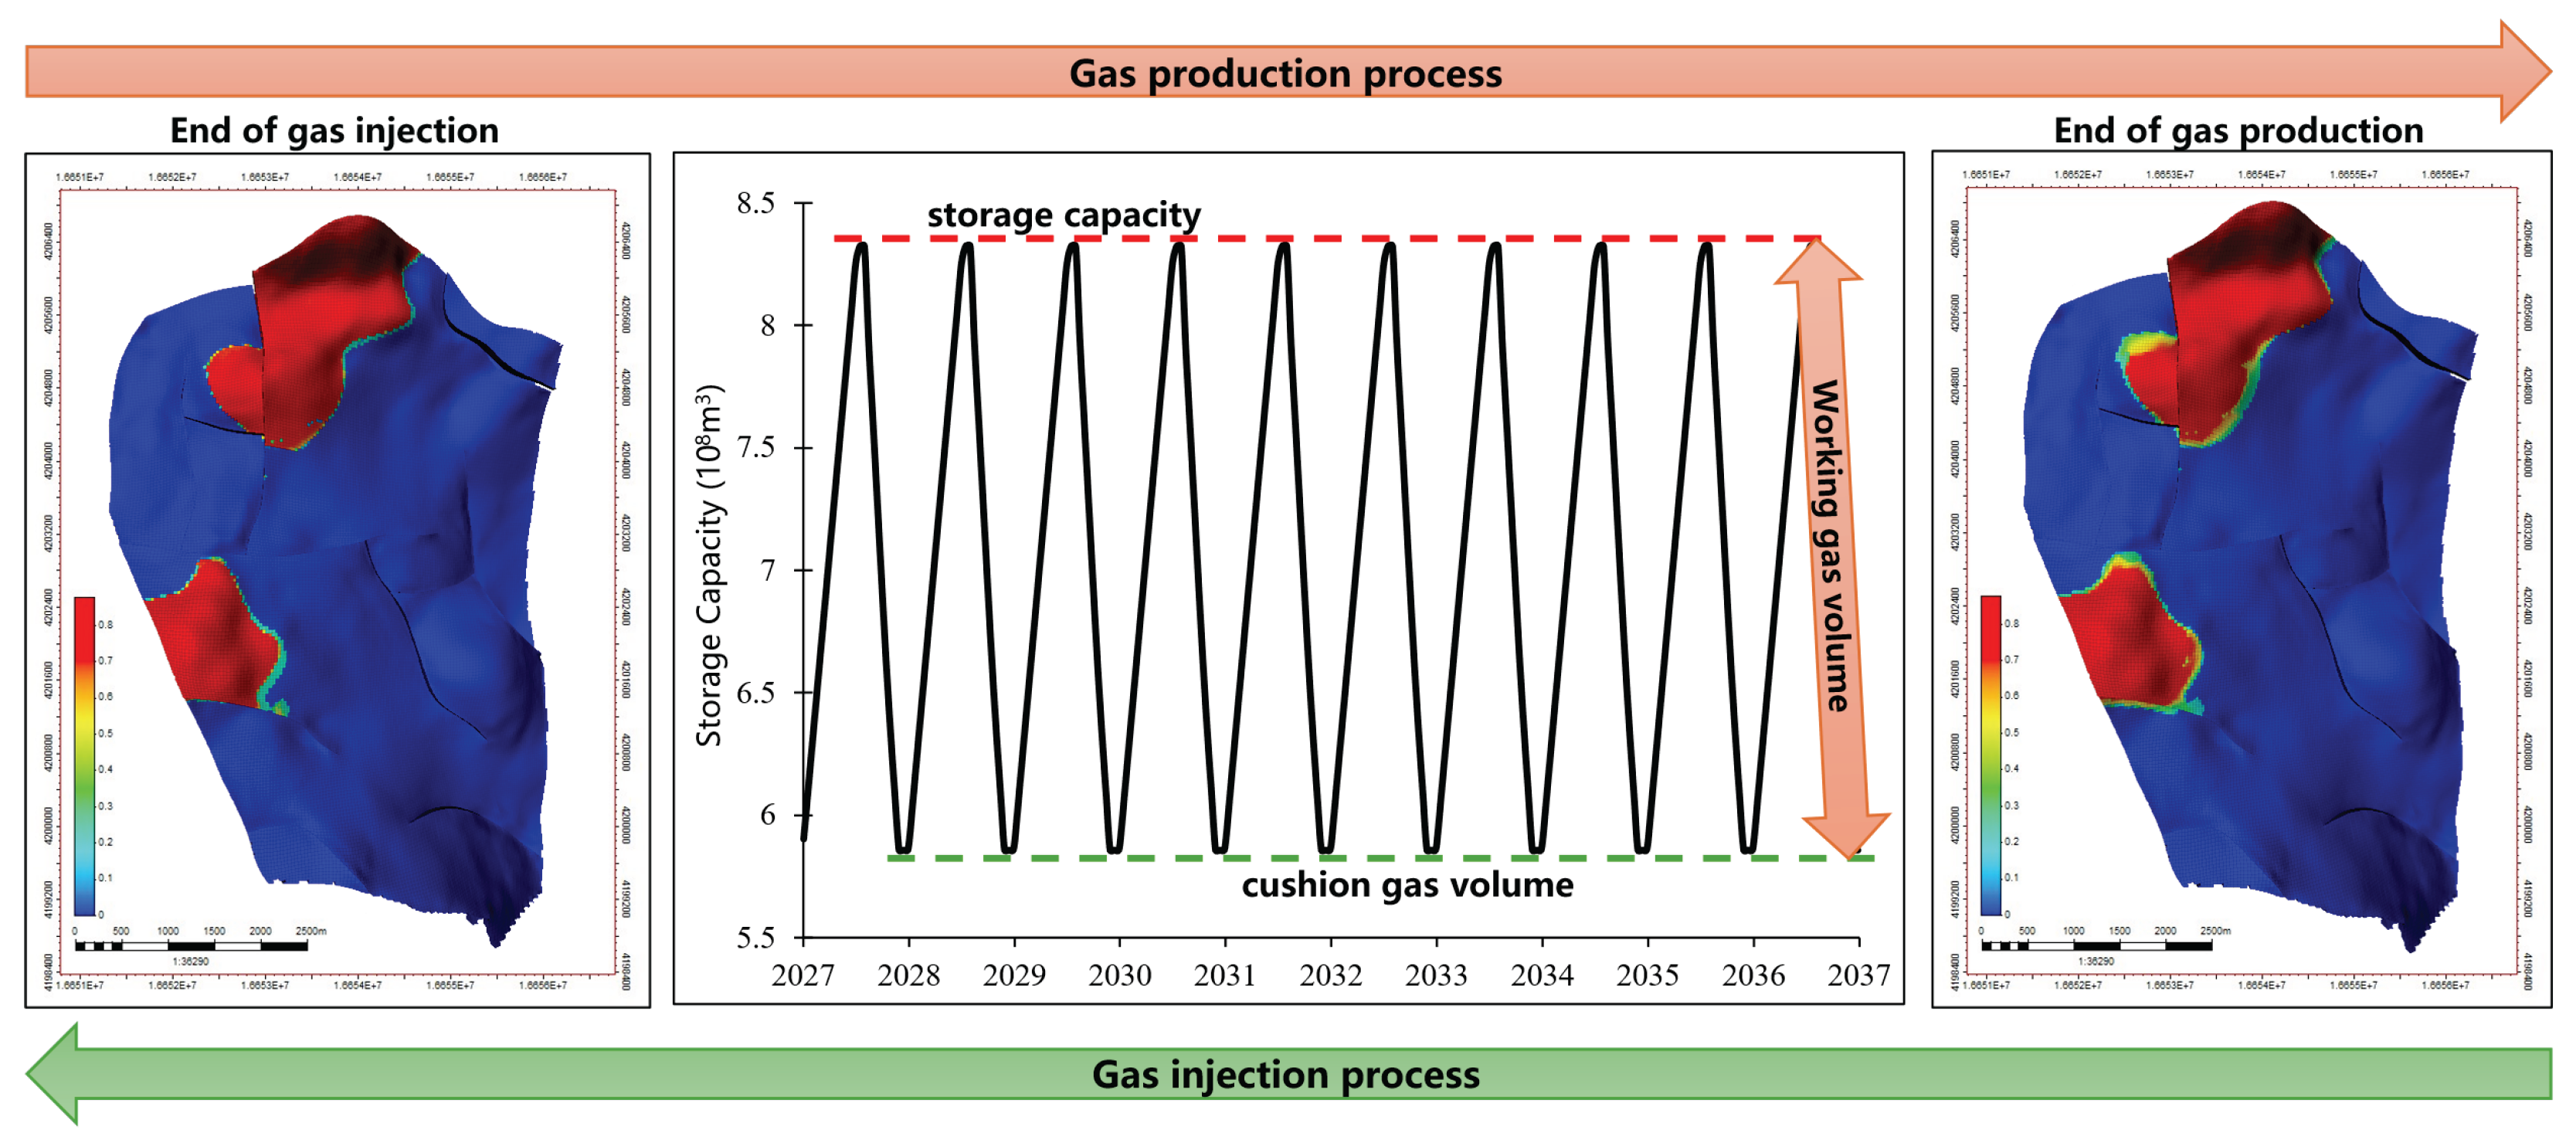
Based on numerical simulation results, the cushion gas was fully replenished within 1–2 cycles. The target gas storage capacity was reached by the 6th cycle, with formation pressure attaining the design target. By the 7th cycle, the reservoir transitions into a stable injection–production phase (
Figure 14). Combined with gas saturation distribution in the M8 and M14 well areas at different stages, the well pattern scheme is considered to have a stable gas–water interface and no significant water invasion under multi-cycle injection–production operations (
Figure 15).
(3) Water Production Forecast
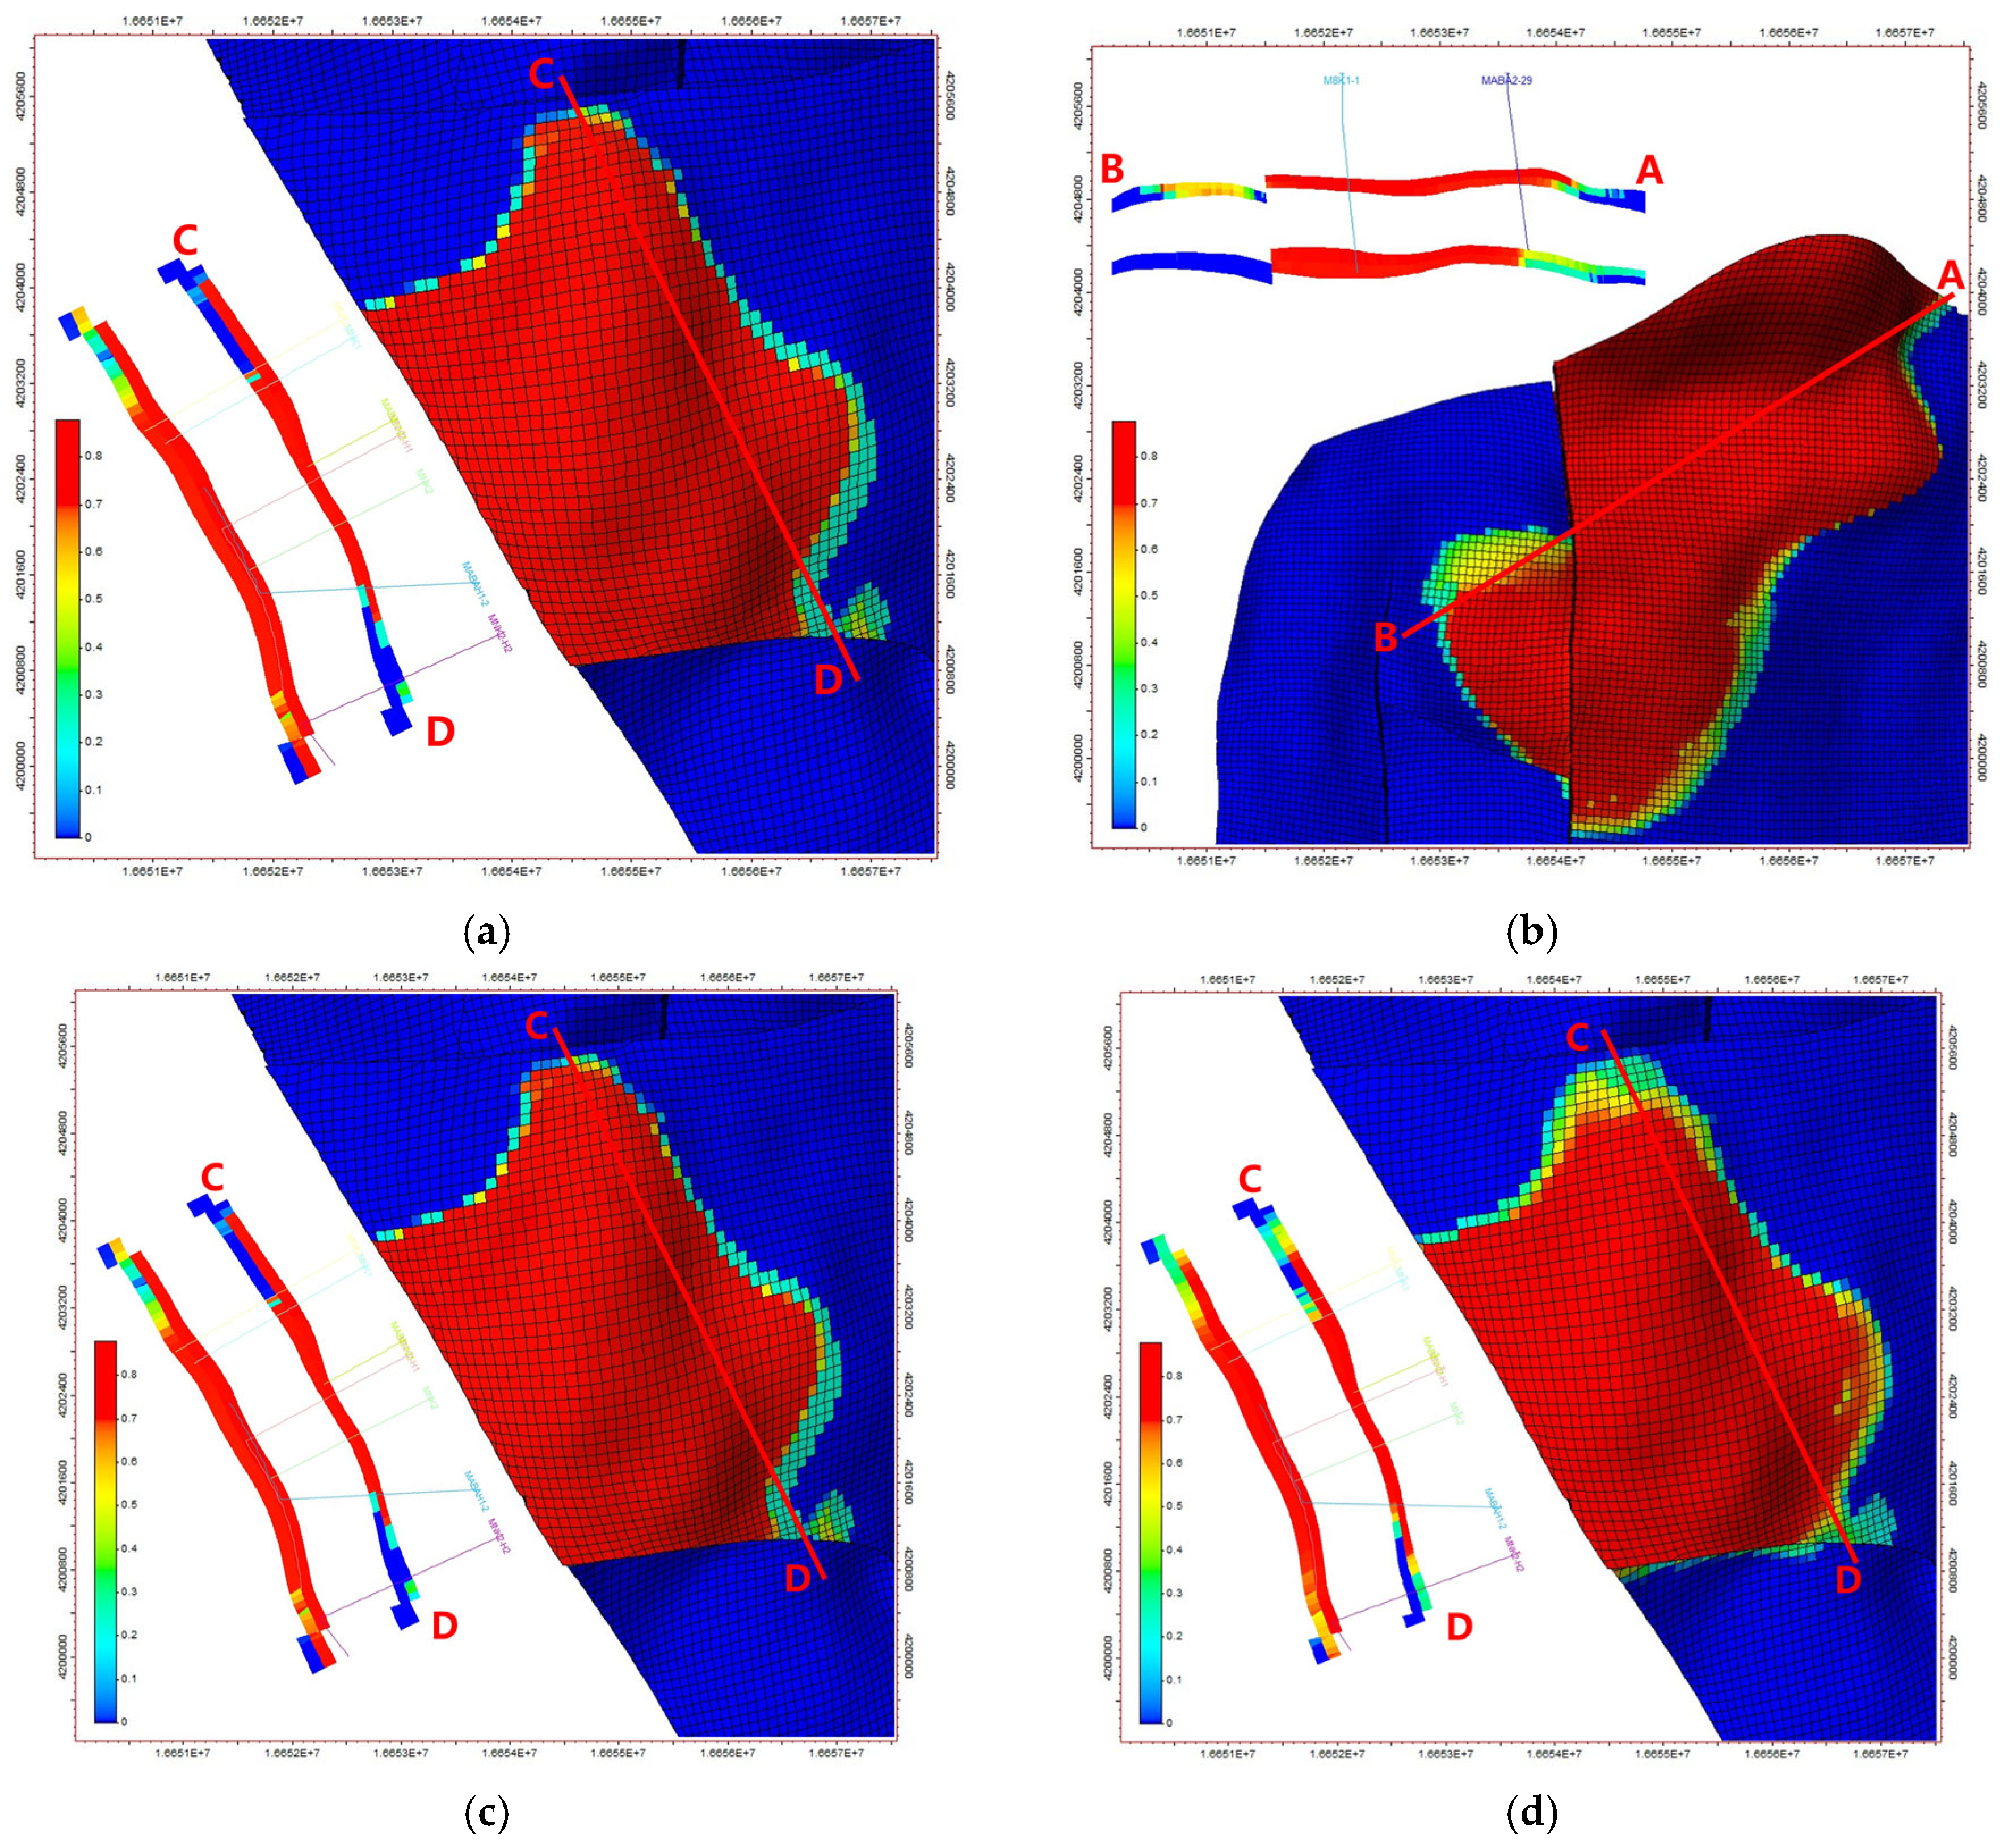
The II-1 layer in the M14 block exhibited significant water invasion and complex gas–water interactions, with a flooded area comprising 74% of the total (
Figure 16). In contrast, the I-2 and I-6 experienced minimal water invasion, with flooded areas accounting for 32% to 51% of their respective regions. Similarly, the II-1 layer of the M8 block demonstrated substantial water intrusion (
Figure 17), with a flooded area of 53%. Conversely, the I-2 and I-6 sub-layers showed limited water invasion, with flooded areas ranging from 33% to 49%. These findings underscore the variability in water invasion across different sub-layers, highlighting the I-2 and I-6 as more favorable for gas storage due to their lower water-flooding extents.
Numerical simulations confirmed the feasibility of gas storage operations, demonstrating minimal damage to the oil rim and effective prevention of bottom water encroachment.
6. Conclusions
This study proposed a comprehensive methodological framework. Applying this framework to the M multi-layered water-bearing gas reservoir in the Qinghai region yielded the following conclusions:
(1) From a geological perspective, during the deposition of I-2 and I-6 in the I layer, well-developed point and side bars resulted in good sand body connectivity and stable inter-layer distribution. The caprock demonstrated lateral continuity, and the boundary faults in the I-2 and I-6 layers had SGR values predominantly above 50%. The caprock shale exhibited excellent sealing capacity, maintaining mechanical integrity after 1000 fatigue cycles under pressure conditions of 8–12.8 MPa.
(2) From the production dynamics perspective, the I-2 and I-6 sub-layers were evidenced by water drive indices of 0.16 and 2.41, respectively. Characterized by weak aquifer energy, lateral continuity, significant thickness, and favorable physical properties, these sub-layers possessed a robust reserve foundation. During production, they exhibited minimal influence from water production, with inactive edge water and low water invasion intensity.
(3) The M8 and M14 blocks were identified as the most promising areas for gas storage construction. Vertically, the I-2 and I-6 sub-layers, distinguished by their weak water invasion energy, were prioritized. Numerical simulations confirmed the feasibility of gas storage operations, demonstrating minimal damage to the oil rim and effective prevention of bottom water encroachment.


