Article

Analysis of PM2.5 Transport Characteristics and Continuous Improvement in High-Emission-Load Areas of the Beijing–Tianjin–Hebei Region in Winter

Beijing Key Laboratory of Atmospheric Pollution Control, Beijing University of Technology, Beijing 100124, China
*
Author to whom correspondence should be addressed.
Sustainability 2025, 17(14), 6389; https://doi.org/10.3390/su17146389
Submission received: 30 April 2025 / Revised: 1 July 2025 / Accepted: 8 July 2025 / Published: 11 July 2025

Abstract

The air quality in the Beijing–Tianjin–Hebei region of China has markedly improved in recent decades. Characterizing current PM2.5 transmission between cities in light of the continuous reduction in emissions from various sources is of great significance for the formulation of future regional joint prevention and control strategies. To address these issues, a WRF-CAMx modeling project was implemented to explore the pollution characteristics from the perspectives of transport flux, regional source apportionment, and the comprehensive impact of multiple pollutants from 2013 to 2020. It was found that the net PM2.5 transport flux among cities declined considerably during the study period and was positively affected by the continuous reduction in emission sources. The variations in local emissions and transport contributions in various cities from 2013 to 2020 revealed differences in emission control policies and efforts. It is worth noting that under polluted weather conditions, obvious interannual differences in PM2.5 transport fluxes in the BTH region were observed, emphasizing the need for more scientifically based regional collaborative control strategies. The change in the predominant precursor from SO2 to NOx has posed new challenges for emission reduction. NOx emission reductions will significantly decrease PM2.5 concentrations, while SO2 and NH3 reductions show limited effects. The reduction in NOx emissions might have a fluctuating impact on the generation of SOAs, possibly due to changes in atmospheric oxidation. However, the deep treatment of NOx has a positive effect on the synergistic improvement of multiple air pollutants. This emphasizes the need to enhance the reduction in NOx emissions in the future. The results of this study can serve as a reference for the development of effective PM2.5 precursor control strategies and regional differentiation optimization improvement policies in the BTH region.

1. Introduction

With the rapid economic development in China, PM2.5 pollution has attracted widespread attention due to its regional and compound pollution characteristics, which have adverse effects on human health [1]. The transport and accumulation of various pollutants in different regions exacerbate pollution levels, posing threats to environmental quality, climate change mitigation, and human health [2]. The spatiotemporal variation in regional air pollution and cross-boundary transport at multiple scales is a critical scientific issue today [3]. Pollutant transport likely plays a vital role in the formation of PM2.5 pollution [4,5]. Fully understanding the impact of air pollutants on PM2.5 concentrations is crucial for developing regional joint control strategies [6].
As an important economic development hub in China, the BTH region has distinct pollution characteristics, further complicated by cross-regional transport [7]. Understanding the contributions of cross-regional transport in the BTH region, as well as regional PM2.5 transport characteristics under winter heavy-pollution conditions and the prevailing monsoon, is essential. From 2013 to 2017, measures such as coal combustion control and steel production capacity reduction were implemented under the Air Pollution Prevention and Control Action Plan, which led to significant air quality improvements [8]. From 2018 to 2020, the Blue Sky Defense Campaign further promoted ultra-low-emission retrofitting for coal-fired power plants and the steel industry [9]. By 2022, the PM2.5 concentration reached 37 μg/m3. However, PM2.5 remains the primary control indicator for the continued improvement of air quality in the future. The analysis of PM2.5 transport effects over larger regions remains limited, and cross-regional transport impacts have not been adequately evaluated [10]. The regional transport of PM2.5 and its major components (especially nitrates, sulfates, and ammonium) also plays an important role across different provinces. These studies demonstrate the substantial contribution of regional transport to severe PM2.5 pollution [11].
In recent years, various methods have been widely applied to evaluate the impact of regional transport on local air quality [12]. For instance, methods such as HYSPLIT, PSCF, and CWT can identify major air mass trajectories and high-contribution source regions [13]. Moreover, multiple transport models, including chemical transport models (CTMs), can quantitatively evaluate transport contributions [14], such as the Particulate Source Apportionment Technology (PSAT) in the Comprehensive Air Quality Model (CAMx) [15,16], the Integrated Source Apportionment Model (ISAM) in the Community Multiscale Air Quality Model (CMAQ) [17], and transport flux calculation methods. Back-trajectory and meteorological analyses have also been extensively used to qualitatively identify and describe key transport directions and pathways [18,19]. Intercity transport plays a significant role in the formation of PM2.5 pollution in the Beijing–Tianjin–Hebei (BTH) region [20].
Despite these methodological advances, key technology gaps remain regarding: (1) how regional transport patterns and local emissions jointly shape PM2.5 pollution across the agglomeration; (2) the changing roles of intercity pollutant transport in influencing pollution severity; and (3) the evolving sensitivity of PM2.5 formation to key precursors under different emission control scenarios.
To address the persistent challenges of PM2.5 pollution in the Beijing–Tianjin–Hebei (BTH) region, particularly in winter, this study employs the WRF-CAMx model [21] to systematically investigate the spatiotemporal dynamics of PM2.5 pollution and its driving mechanisms. By focusing on the winter in three critical years (2013, 2017, and 2020), we analyze PM2.5 transport pathways, intercity source contributions, and the evolving sensitivity of PM2.5 formation to key precursors (NOx, SO2, VOCs). The findings will elucidate the complex interactions between meteorology, emissions, and chemistry underlying winter PM2.5 episodes, thereby providing a scientific basis for joint prevention strategies and emergency response frameworks for sustainable air quality management in the region.

2. Materials and Methods
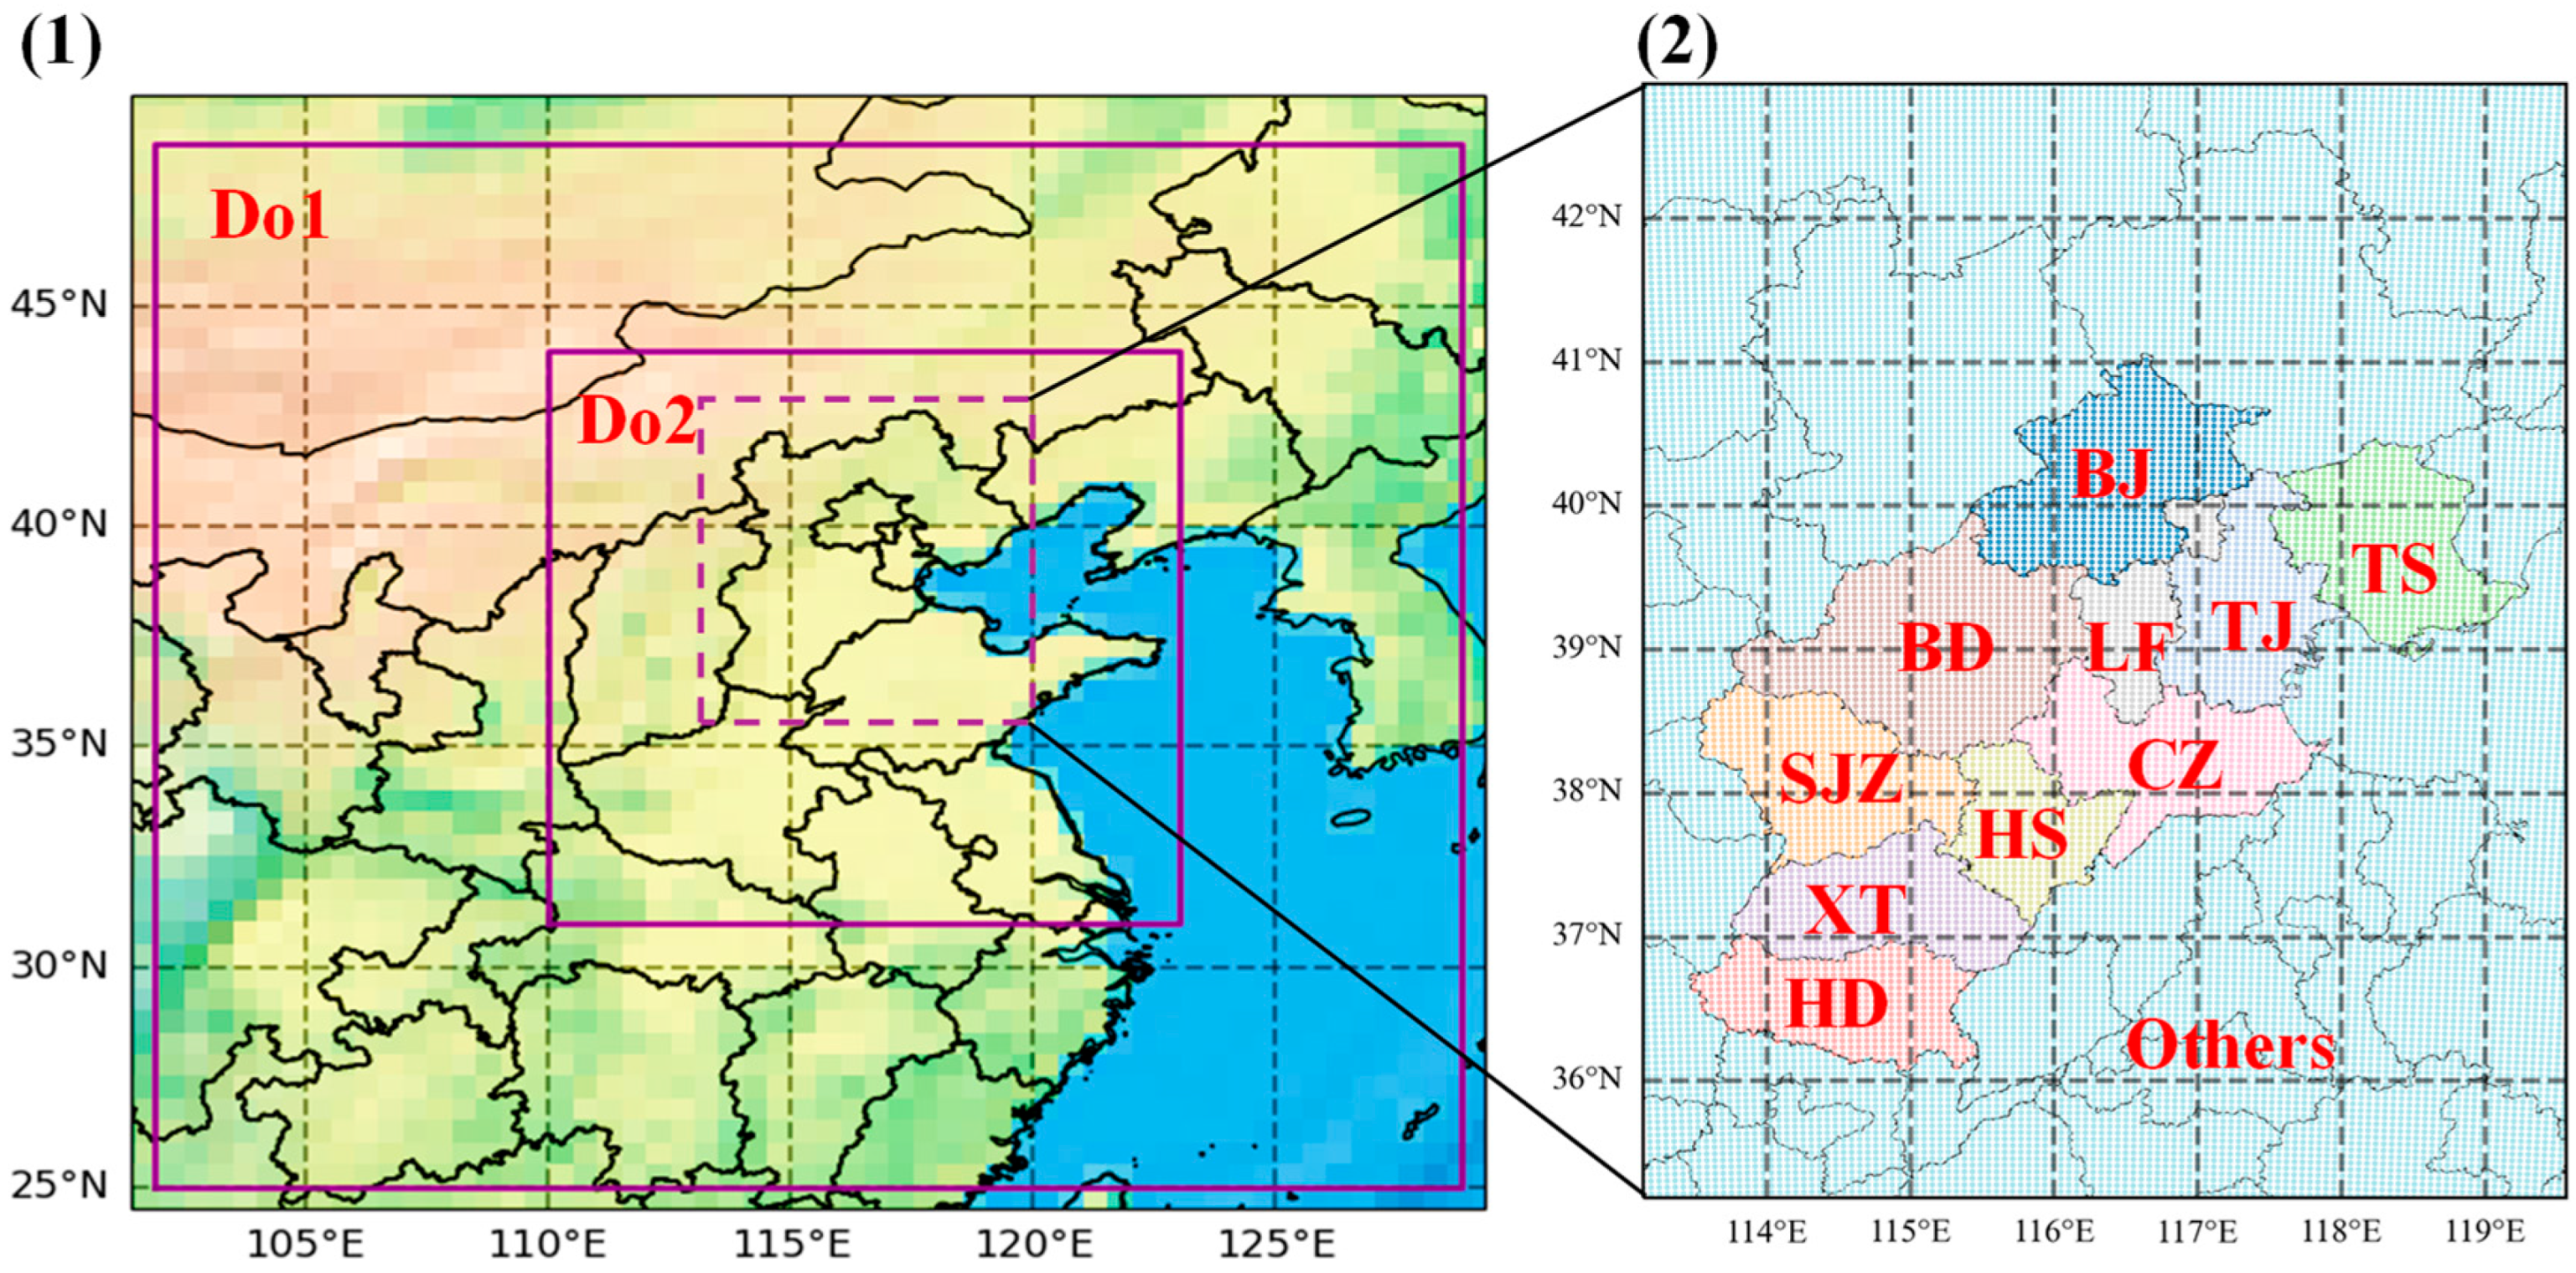
2.1. Data Source

Surface meteorological observation data, including hourly measurements of 10-m wind speed (WS10), 2-m temperature, relative humidity (RH), and atmospheric pressure, were collected from the China Meteorological Administration [22]. These meteorological observations were used to evaluate the accuracy of the meteorological model [23]. Additionally, hourly data for atmospheric pollutants, including PM2.5, were obtained from the China National Environmental Monitoring Center (https://www.cnemc.cn, 3 May 2024) to assess the numerical simulation performance of the air quality model [24]. The background data required for WRF simulations were sourced from the National Centers for Environmental Prediction (NCEP), which provides Final Operational Global Analysis Data (FNL) with a 6-h resolution and a spatial resolution of 1° × 1°. Topographic and land-use data were sourced from the U.S. Geological Survey (USGS) [25]. The topographic and land-use data are global 30 arc-second (about 900 m) resolution topographic data from the United States Geological Survey (USGS).

2.2. Model Configuration

Numerical simulations were conducted for January 2013, 2017, and 2020. The Weather Research and Forecasting (WRF, v4.4) model, developed by the National Center for Atmospheric Research (NCAR), was used to evaluate meteorological factors [26]. The Comprehensive Air Quality Model with Extensions (CAMx, v7.1), a three-dimensional Eulerian photochemical model, was applied to simulate PM2.5 concentration changes. The CAMx model utilized WRF simulation results as meteorological inputs [27]. This study has been extensively validated in previous studies prior to CAMx7.1, ensuring the reliability of the research objectives. Simultaneously optimizing the internal code of the model to improve performance and make it more suitable for the computational needs of a number of scenario simulation combinations. In addition, the stability between PM2.5 traceability and physical and chemical mechanisms was verified by comparing the update logs with the latest version. Two nested simulation domains were selected with spatial resolutions of 36 km × 36 km (Do1) and 12 km × 12 km (Do2). As shown in Figure 1(1), Do1 covered the entirety of China, while Do2 encompassed the Beijing–Tianjin–Hebei (BTH) region. The output from Do1 served as the boundary conditions and initial fields for Do2. Both models used a total of 28 vertical layers from the ground to a height of 20 km in the simulation domain [28]. The σ-coordinates corresponded to altitudes ranging from 0 to 19.3 km, with layer heights at approximately 0, 48, 96, 153, 251, 358, 459, 611, 817, 1001, 1260, 1480, 1781, 2191, 2701, 3306, 3988, 4518, 5188, 5895, 6792, 8595, 10,895, 12,388, 14,010, 15,339, 17,724, and 19,324 m. For the calculation of transport flux, 12 layers (up to approximately 1.8 km in altitude) were primarily considered to analyze vertical distribution characteristics [29]. In the BTH region, the research team developed a high-resolution air pollution emission inventory through years of effort [30,31,32]. Emission inventories outside the BTH region were derived from the Multi-resolution Emission Inventory for China (MEIC 2016) at a spatial resolution of 0.25° × 0.25°. The total emissions inventory included pollutants such as SO2, CO, NOx, NH3, PM2.5, PM10, and VOCs [33].
In this study, the CAMx-PSAT analysis was investigated to assess the source apportionment of high-emission-load cities in the BTH region. The parameter settings mainly include the emission sources, the receptor regions, the identification of pollutant species, etc. The regional source labels included Beijing (BJ), Tianjin (TJ), Shijiazhuang (SJZ), Tangshan (TS), Handan (HD), Xingtai (XT), Baoding (BD), Cangzhou (CZ), Langfang (LF), Hengshui (HS), and other areas (as shown in Figure 1(2)). The receptors were the grids where the national monitoring stations of these cities were located, and the average value of the analysis results of all receptors in each city was calculated. The main species analyzed include EC (Elemental Carbon), POA (Primary Organic Aerosol), SOA (Secondary Organic Aerosol), PS4 (Sulfate), PN3 (Nitrate), PN4 (Ammonium), PFC (crustal elements in fine particulate matter), and PFN (other elements in fine particulate matter). These speciated components were integrated into the total PM2.5 mass calculation.
In addition, Ye et al. [34] employed a multi-gradient simulation approach to assess the surface response of precursors and secondary inorganic aerosols (SNAs). In order to explore the sensitive response relationship between the precursors SO2, NOx, and VOCs and PM2.5, multiple emission reduction scenario combinations of SO2 and NOx, as well as VOCs and NOx, with a resolution of 20% from 0 to 100% were designed, and the simulation results were fitted and interpolated to obtain the contour relationship between precursor emission and PM2.5 concentration.

2.3. PM2.5 Flux Calculation

PM2.5 flux is defined as the mass of PM2.5 transported through a specific vertical surface over a given period [35]. Flux calculation positions were selected at boundary lines extending vertically between target cities and their neighboring cities up to a designated height. Using the WRF-CAMx coupled model, the vertical surface was discretized into multiple vertical grid cells. To obtain the vertical distribution of PM2.5 flux, WRF and CAMx used the same number of vertical layers to extract PM2.5 concentrations and wind vectors corresponding to each layer. Positive and negative fluxes indicate PM2.5 inflow and outflow, respectively, from the BTH region to the surrounding areas. The formula for calculating PM2.5 flux is as follows:
F l u x = i = 1 h l L · H i · c · v · n
where flux represents PM2.5 transport flux, h is the top height, l is the boundary line between two adjacent cities, L is the grid width, H i is the vertical height difference between layer i and i + 1 , c is the PM2.5 concentration in the vertical grid cell, v is the wind vector, and n is the normal vector corresponding to the vertical grid cell.

2.4. Model Evaluation

To validate the accuracy of numerical simulations by the WRF and CAMx models, evaluation standards established by the U.S. Environmental Protection Agency (EPA) were employed [36]. The statistical parameters used included the correlation coefficient (COR), normalized mean bias (NMB), and normalized mean error (NME). Observed and simulated values for PM2.5 concentrations and WS10 were compared for 10 cities: BJ, TJ, SJZ, TS, HD, XT, BD, CZ, LF, and HS [37]. The statistical parameter formulas are as follows [38]:
COR = i = 1 N S i S ¯ O i O ¯ i = 1 N S i S ¯ 2 × i = 1 N O i O ¯ 2
NMB = i = 1 N ( S i O i ) i = 1 N O i
NME = i = 1 N | S i O i | i = 1 N O i
The analysis of transport flux and source apportionment is primarily influenced by PM2.5 concentration and wind field dynamics. Hence, the accuracy of the models was validated using PM2.5 concentrations and wind speeds as representative factors. Table 1 compares the observed and simulated near-surface PM2.5 concentrations and meteorological factors for January 2013, 2017, and 2020 in three representative cities (BJ, TJ, and SJZ). The PM2.5 simulations showed good reproducibility, with COR ranging from 0.72 to 0.90, NMB ranging from −0.27 to −0.11, and NME ranging from 0.26 to 0.41. For the meteorological model, the COR ranged from 0.69 to 0.80, NMB ranged from 0.19 to 0.41, and NME ranged from 0.31 to 0.52, indicating that the simulated values of wind speed are somewhat high. Overall, compared with the recognized acceptable model performance thresholds (COR ≥ 0.7, |NMB| ≤ ± 0.3) in EPA and EMEP air quality studies and similar studies [39,40], the simulated results closely matched the observed values, exhibiting high correlations and deviations within acceptable ranges. This indicates the excellent performance of the models, making them suitable for further analysis of PM2.5 transport characteristics.

3. Results and Discussion

3.1. The Characteristics of PM2.5 Concentration and Pollutant Emissions

The spatial distribution of PM2.5 concentration changes in January for the representative years of 2013, 2017, and 2020 illustrates the effectiveness of pollution control efforts and their spatial disparities, as shown in Figure 2. The implementation of atmospheric pollution control measures at different stages has significantly improved air quality in the BTH region. During the Air Pollution Prevention and Control Action Plan Phase (2013–2017), PM2.5 concentrations in cities across the BTH region reduced by 23% to 51%. Cities with severe pollution, such as SJZ and XT, saw more substantial improvements, with PM2.5 concentrations decreasing by 44.8% and 50.6%, respectively. In the Blue Sky Defense Phase (2018–2020), PM2.5 concentrations in BTH cities continued to decline, with reductions ranging from 21% to 35%. This improvement was largely attributed to scientifically based regional joint prevention and control measures, with significant reductions in PM2.5 concentrations in key transport corridor cities [41], such as BJ, BD, and SJZ. Overall, the southern and eastern parts of the BTH region experienced the most significant pollution reductions, primarily due to the high-quality implementation of measures targeting key industries, such as steel, cement, and coking, as well as ultra-low-emission retrofits for coal-fired boilers. These efforts led to substantial reductions in emissions from these pollution sources.
Figure 3 illustrates the variations in PM2.5 precursor emissions in the BTH region from 2013 to 2020. The annual emissions of PM2.5, NOx, and SO2 exhibited a consistent downward trend over this period, with Beijing demonstrating the most significant reductions. In the three representative years of 2013, 2017, and 2020 taken as examples, the annual PM2.5 emissions decreased from 1.12 million tons in 2013 to 670,000 tons in 2017, and further to 500,000 tons in 2020. This represents reductions of 40% and 55% in 2017 and 2020, respectively, compared to 2013 levels. Notably, Beijing achieved the most substantial reduction, with a 59% decrease in PM2.5 emissions by 2020 relative to 2013. Similarly, SO2 emissions declined from 2.39 million tons in 2013 to 900,000 tons in 2017, and subsequently to 610,000 tons in 2020, corresponding to reductions of 62% and 75% in 2017 and 2020, respectively, compared to 2013. Beijing again led in SO2 reduction, achieving a remarkable 90% decrease by 2020 compared to 2013 levels. In contrast, NOx emissions showed a more modest decline, decreasing from 2.90 million tons in 2013 to 2.33 million tons in 2017, and further to 2.09 million tons in 2020, representing reductions of 20% and 28% in 2020 and 2017, respectively, relative to 2013. Tianjin exhibited the most significant NOx reduction, with a 31% decrease in 2020 compared to 2013.
The observed reductions in pollutant emissions correlate strongly with the concurrent improvements in PM2.5 concentrations, demonstrating the significant efficacy of emission control measures in enhancing air quality. These improvements can be primarily attributed to the implementation of the Air Pollution Prevention and Control Action Plan (2013–2017) [42], which focused on coal combustion control and capacity reduction in the steel industry, particularly targeting coal-smoke pollution. Furthermore, during the Blue Sky Protection Campaign phase (2018–2020) [43], the adoption of ultra-low-emission retrofits and the implementation of scientifically informed regional joint prevention and control strategies contributed substantially to the marked reduction in PM2.5 concentrations, especially in cities along the HD-SJZ-BJ transport corridor [44].
The substantial emission reductions achieved in the BTH region, particularly in Beijing, underscore the effectiveness of stringent air quality management policies and regional collaborative efforts. The differential reduction rates among pollutants reflect the varying challenges and technological advancements in controlling different emission sources, with SO2 showing the most dramatic improvements due to successful coal-related interventions, while NOx reductions have been more gradual, potentially reflecting the increasing contribution of mobile sources to overall emissions. These findings provide valuable insights for the formulation of future air quality improvement strategies and highlight the importance of sustained, targeted emission control measures in achieving long-term air quality goals.

3.2. Characteristics of PM2.5 Transport Flux in the BTH Region

The study of transport flux at different heights can explore the main pollutant transport channels and their high-altitude positions, and reveal the causes of transport patterns by combining meteorological and geographical characteristics. The sum of all heights can determine whether the study area is a net pollution acceptance or a net pollution output. The vertical distribution characteristics of PM2.5 transport flux in the BTH region during January 2013, 2017, and 2020 (shown in Figure 4) reveal consistent patterns and variations across different altitudes, influenced by regional emissions, meteorological conditions, and transport dynamics. In January 2013, the net inflow or outflow directions of PM2.5 from Liaoning, Shanxi, and Henan into the BTH region remained consistent across altitudes, while Inner Mongolia and Shandong exhibited opposite net flux directions at similar altitudes. Below 153 m, Inner Mongolia showed net outflow to the BTH region, shifting to net inflow above 359 m. Shandong contributed a net inflow below 252 m but transitioned to a net outflow above 359 m. The BTH region experienced net inflow at near-surface levels and net outflow at higher altitudes, resulting in an overall net outflow of PM2.5.
In January 2017, the BTH region acted as a significant “source” of PM2.5, with inflow exceeding outflow at various altitudes due to local emissions and transport effects. The primary near-surface net inflow originated from Inner Mongolia, while higher-altitude inflow came from Shanxi. The total net flux of PM2.5 between 252 to 817 m reached its maximum value of 621 t/d at 359 m, reflecting a balance between ground-level and high-altitude transport. However, the larger net flux at these altitudes was driven by smaller upstream transport and larger local cross-boundary output to peripheral areas. The outflow flux to Henan, Shandong, and Liaoning exceeded the inflow flux, with significant net outflow to Shandong (2132 t/d). The main transport path was identified as Inner Mongolia and Shanxi–BTH–Shandong and Henan. Inner Mongolia exhibited near-surface net inflow below 1261 m and high-altitude net outflow above 1481 m, while Shanxi showed near-surface net outflow below 459 m and high-altitude net inflow above 611 m. Surrounding regions such as Shandong, Liaoning, and Henan consistently exhibited net outflow at all altitudes, resulting in overall net outflow for the BTH region.
In January 2020, the directions of PM2.5 net inflow or outflow between Liaoning, Inner Mongolia, Shanxi, and Henan with respect to the BTH region remained largely consistent across altitudes. Below 252 m, Shandong exhibited net inflow into the BTH region, shifting to net outflow above 359 m due to stronger transport effects at higher altitudes. Under the influence of winter monsoons, northwesterly airflows carried particulate matter from the desert and Gobi areas in the northwest, primarily entering the BTH region via Shanxi and Inner Mongolia and being transported southeastward to Shandong and Henan or eastward to Liaoning. Liaoning and Henan consistently exhibited net inflow, while Inner Mongolia and Shanxi showed net outflow, reflecting the influence of pollution source emissions and wind directions. The BTH region experienced near-surface net inflow and high-altitude net outflow, resulting in an overall net outflow of PM2.5.
From 2013 to 2020, the net transport flux in the BTH region showed an overall decreasing trend, indicating improvements in air quality. The differences in pollutant sources and transport patterns across the years were notable. Across the three years, common characteristics included the consistent net flux directions for Liaoning, Shanxi, and Henan, while Shandong and Inner Mongolia exhibited altitude-dependent shifts in net flux directions. The BTH region consistently acted as a net exporter of PM2.5, with near-surface net inflow and high-altitude net outflow driven by regional transport dynamics and meteorological conditions. These findings highlight the complex interplay of altitude-dependent transport, regional emissions, and wind patterns in shaping PM2.5 flux in the BTH region, emphasizing the need for targeted pollution control strategies that account for vertical and horizontal transport mechanisms. The declining transport flux trends highlight the effectiveness of regional emission control strategies.
To investigate the transport characteristics of PM2.5 flux under unfavorable weather conditions, the January data from the three study years were categorized into clean days and polluted days based on a threshold of 75 μg/m3 for PM2.5 concentration, and the PM2.5 transport flux was evaluated accordingly (as shown in Figure 5). In January 2013, the net PM2.5 flux on polluted and clean days was 1985 t/d (outflow) and 4684 t/d (outflow), respectively. A comparison between high-altitude and low-altitude data revealed that the surface PM2.5 flux was relatively low on polluted days, primarily due to the influence of stagnant weather conditions, characterized by low wind speeds that hindered dispersion. In January 2017, the dispersion conditions at low altitudes were superior to those at high altitudes. On polluted days, the PM2.5 output flux (977 t/d) significantly exceeded the input flux (685 t/d), indicating that the pollution process was heavily influenced by local high emission loads within the BTH region, which is similar to the results of Zhang et al. [45]. Even under the prevailing winter monsoon, the region contributed to the transport of pollutants to surrounding areas. By January 2020, compared to 2013 and 2017, the PM2.5 transport flux had significantly decreased, reflecting the substantial achievements in pollutant reduction within the Beijing–Tianjin–Hebei region. Additionally, on polluted days, the surface PM2.5 net flux showed a net inflow, indicating that the region was the destination of pollutant transport from surrounding areas. Within the vertical height range of 611 m to 1001 m, the net outflow flux of PM2.5 reached 597 t/d.

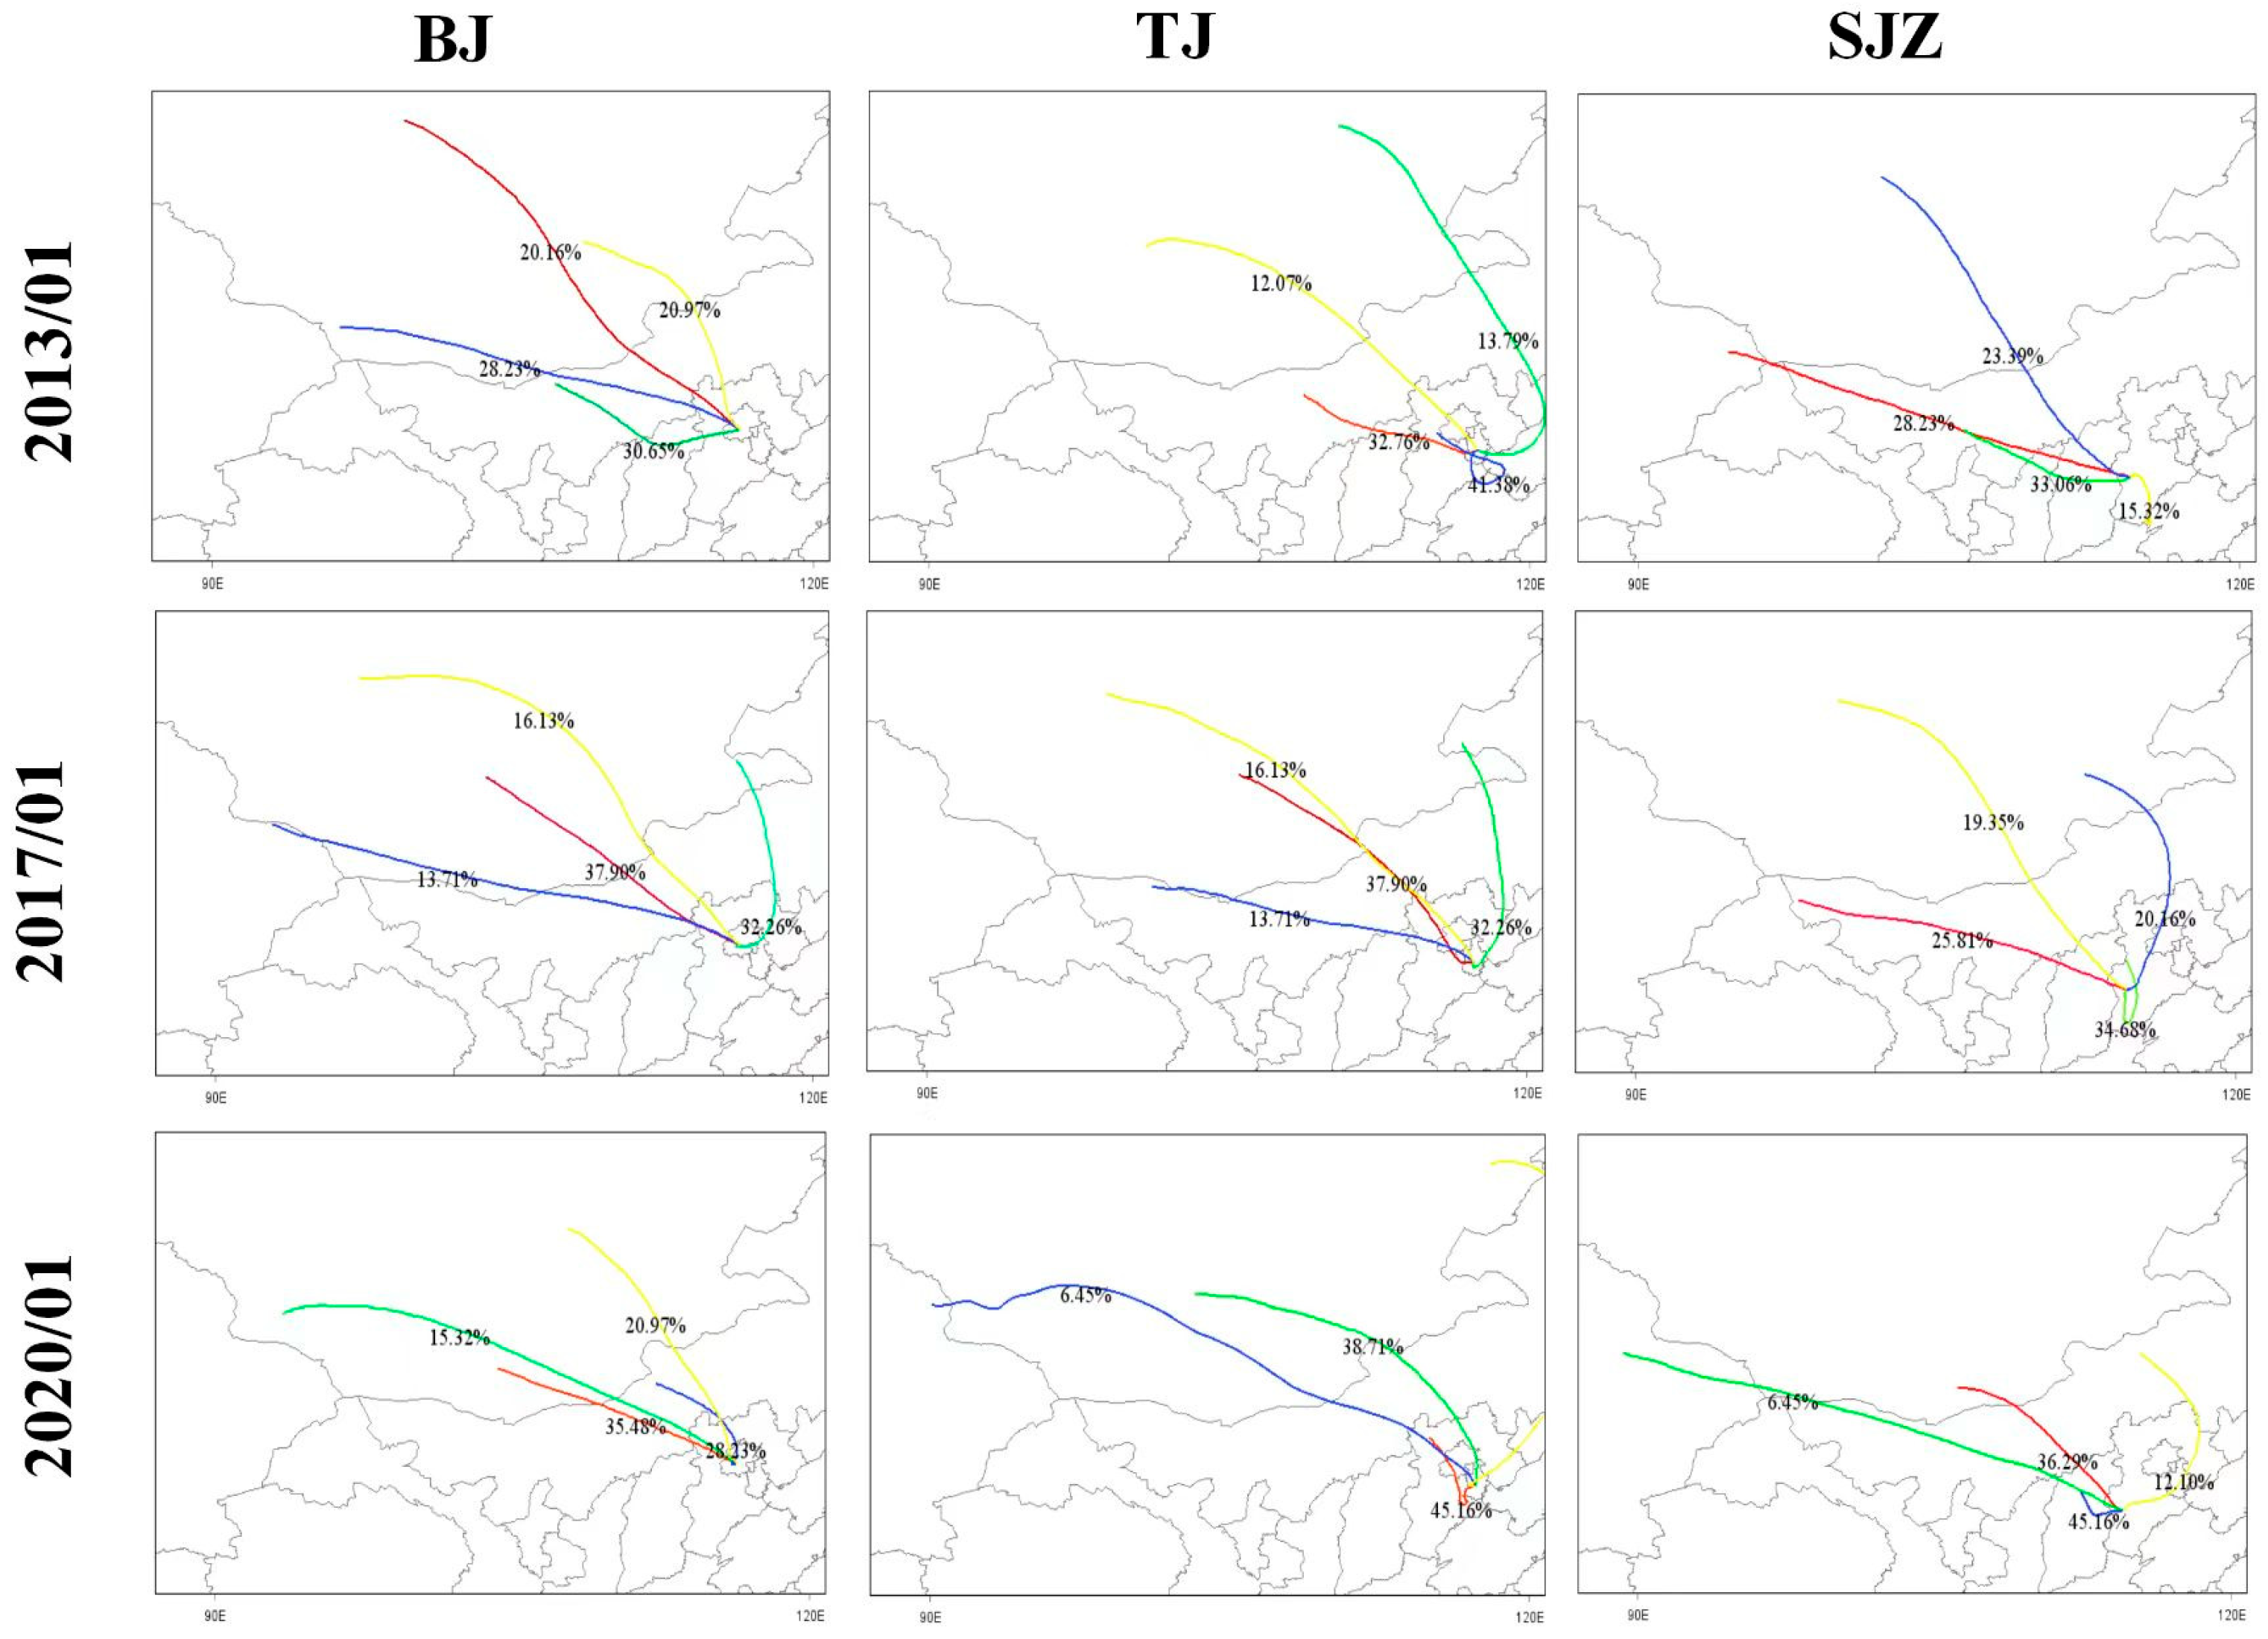
3.3. Regional Sources Apportionment of PM2.5 in the BTH Region

The PM2.5 concentrations in the BTH region in January 2013, 2017, and 2020 were significantly influenced by intercity pollutant transport, as illustrated in Figure 6. These findings highlight the interconnected nature of air pollution in the region, emphasizing the importance of regional collaborative efforts for effective air quality management.
In January 2013, the PM2.5 concentrations in BTH cities were shaped by varying levels of intercity transport. Beijing was primarily influenced by Langfang, Tianjin, and Baoding, with contribution rates of 4.9%, 2.8%, and 2.3%, respectively. Tianjin, on the other hand, was significantly impacted by Langfang, Tangshan, Cangzhou, and Beijing, with contribution rates ranging from 3.4% to 5.9%. Notably, Langfang received nearly one third of its PM2.5 concentration from Beijing, underscoring the strong influence of the capital on its neighboring cities. Tangshan’s primary contributor was Tianjin (4.7%), while Baoding was mainly influenced by Langfang and Shijiazhuang (2.3% and 2.0%, respectively). In southern Hebei, cities such as Shijiazhuang, Handan, and Xingtai exhibited strong mutual interactions, with contribution rates ranging from 2.1% to 14.3%. Cangzhou’s PM2.5 primarily originated from Tianjin, Langfang, Beijing, and Hengshui, while Hengshui itself was influenced by Cangzhou, Baoding, Xingtai, and Shijiazhuang, with contributions ranging from 2.0% to 8.8%. Overall, Beijing, Tianjin, and Baoding had the greatest impact on other cities in the BTH region, followed by Tangshan, Shijiazhuang, and Langfang. This analysis highlights the complex web of pollutant transmission within the region, emphasizing the need for coordinated air quality management strategies. These findings are consistent with those in [46], who also emphasized the influence of meteorological stagnation in the southern and eastern parts of the BTH region during high pollution episodes.
In 2017, local emissions remained the dominant source of PM2.5 in most BTH cities, with local annual average contributions ranging from 66.6% to 75.7%. However, regional transport still played a significant role, accounting for 24.3% to 33.4% of PM2.5 concentration. Beijing was primarily influenced by Tianjin and Langfang, while Tianjin was impacted by Tangshan and Langfang. Shijiazhuang received significant contributions from Baoding and Xingtai, and Tangshan was influenced by Tianjin. In southern Hebei, Handan and Xingtai exhibited strong mutual interactions, with Xingtai also influenced by Shijiazhuang. Baoding and Cangzhou were primarily impacted by Beijing and Tianjin, respectively, while Langfang received contributions from Tangshan and Baoding. Hengshui’s PM2.5 levels were influenced by Cangzhou and Xingtai. These transport relationships underscore the interconnected nature of PM2.5 pollution in the BTH region, with cities such as Langfang, Baoding, and Tianjin emerging as key contributors to multiple neighboring cities. This interdependence highlights the necessity of regional collaborative efforts to address both local emissions and cross-boundary transport.
In 2020, local contributions to PM2.5 concentrations varied widely across the BTH region, ranging from 34.8% in Langfang to 72.7% in Tangshan. Regional transport contributions ranged from 27.3% to 65.2%, reflecting the continued importance of intercity pollutant transport. Beijing remained primarily influenced by Langfang and Tianjin, while Tianjin was impacted by Tangshan and Langfang. Shijiazhuang’s PM2.5 levels were shaped by Baoding and Xingtai, and Tangshan received contributions from Tianjin and Langfang. In southern Hebei, Handan and Xingtai continued to exhibit strong mutual interactions, with Xingtai also influenced by Shijiazhuang. Baoding was primarily impacted by Beijing and Shijiazhuang, while Cangzhou received contributions from Tianjin and Tangshan. Langfang’s PM2.5 levels were influenced by Beijing and Tianjin, and Hengshui was impacted by Cangzhou and Baoding. Wind direction played a critical role in shaping pollution levels, with Beijing’s dominant northwesterly, northerly, and northeasterly winds influencing its pollution transport patterns. Tianjin, influenced by northerly and easterly winds, was more affected by transport from Beijing and Tangshan while also experiencing cross-sea transport from Shandong under southeasterly winds. The southwest transmission corridor, spanning southern Shanxi, southern Hebei, and cities such as Baoding and Hengshui, significantly impacted Beijing’s pollution levels. Backward trajectory analysis revealed that airflows originating from southern Mongolia, central Inner Mongolia, northern Shanxi, and western Hebei contributed to PM2.5 concentrations in the region. These areas, dominated by arid desert regions, are significant sources of natural particulate matter. However, local and nearby regional sources remained the dominant contributors to pollution levels in most cities.
Notably, from 2013 to 2020, the local contribution rates of PM2.5 in typical BTH cities showed a declining trend, while the contribution rates from other cities outside these typical cities increased. This shift highlights the growing importance of regional transport in shaping local PM2.5 levels, even as local emissions were reduced. In conclusion, the analysis of PM2.5 concentrations and transport patterns in the BTH region from 2013 to 2020 reveals the complex interplay between local emissions and regional transport. While local sources remained the dominant contributor to PM2.5 levels in most cities, regional transport played a significant and growing role, particularly in cities such as Langfang and Hengshui. Similar observations [47] were reported that identified the increasing impact of intercity transport on urban PM2.5 burdens despite stringent local emission control measures. The interconnected nature of air pollution in the region underscores the necessity of coordinated air quality management strategies that address both local emissions and cross-boundary transport. The success of recent pollution control measures, such as ultra-low-emission retrofits and regional joint prevention and control strategies, demonstrates the potential for significant air quality improvements through targeted and collaborative efforts. However, the continued influence of regional transport highlights the need for sustained and integrated approaches to air pollution control in the BTH region and beyond.

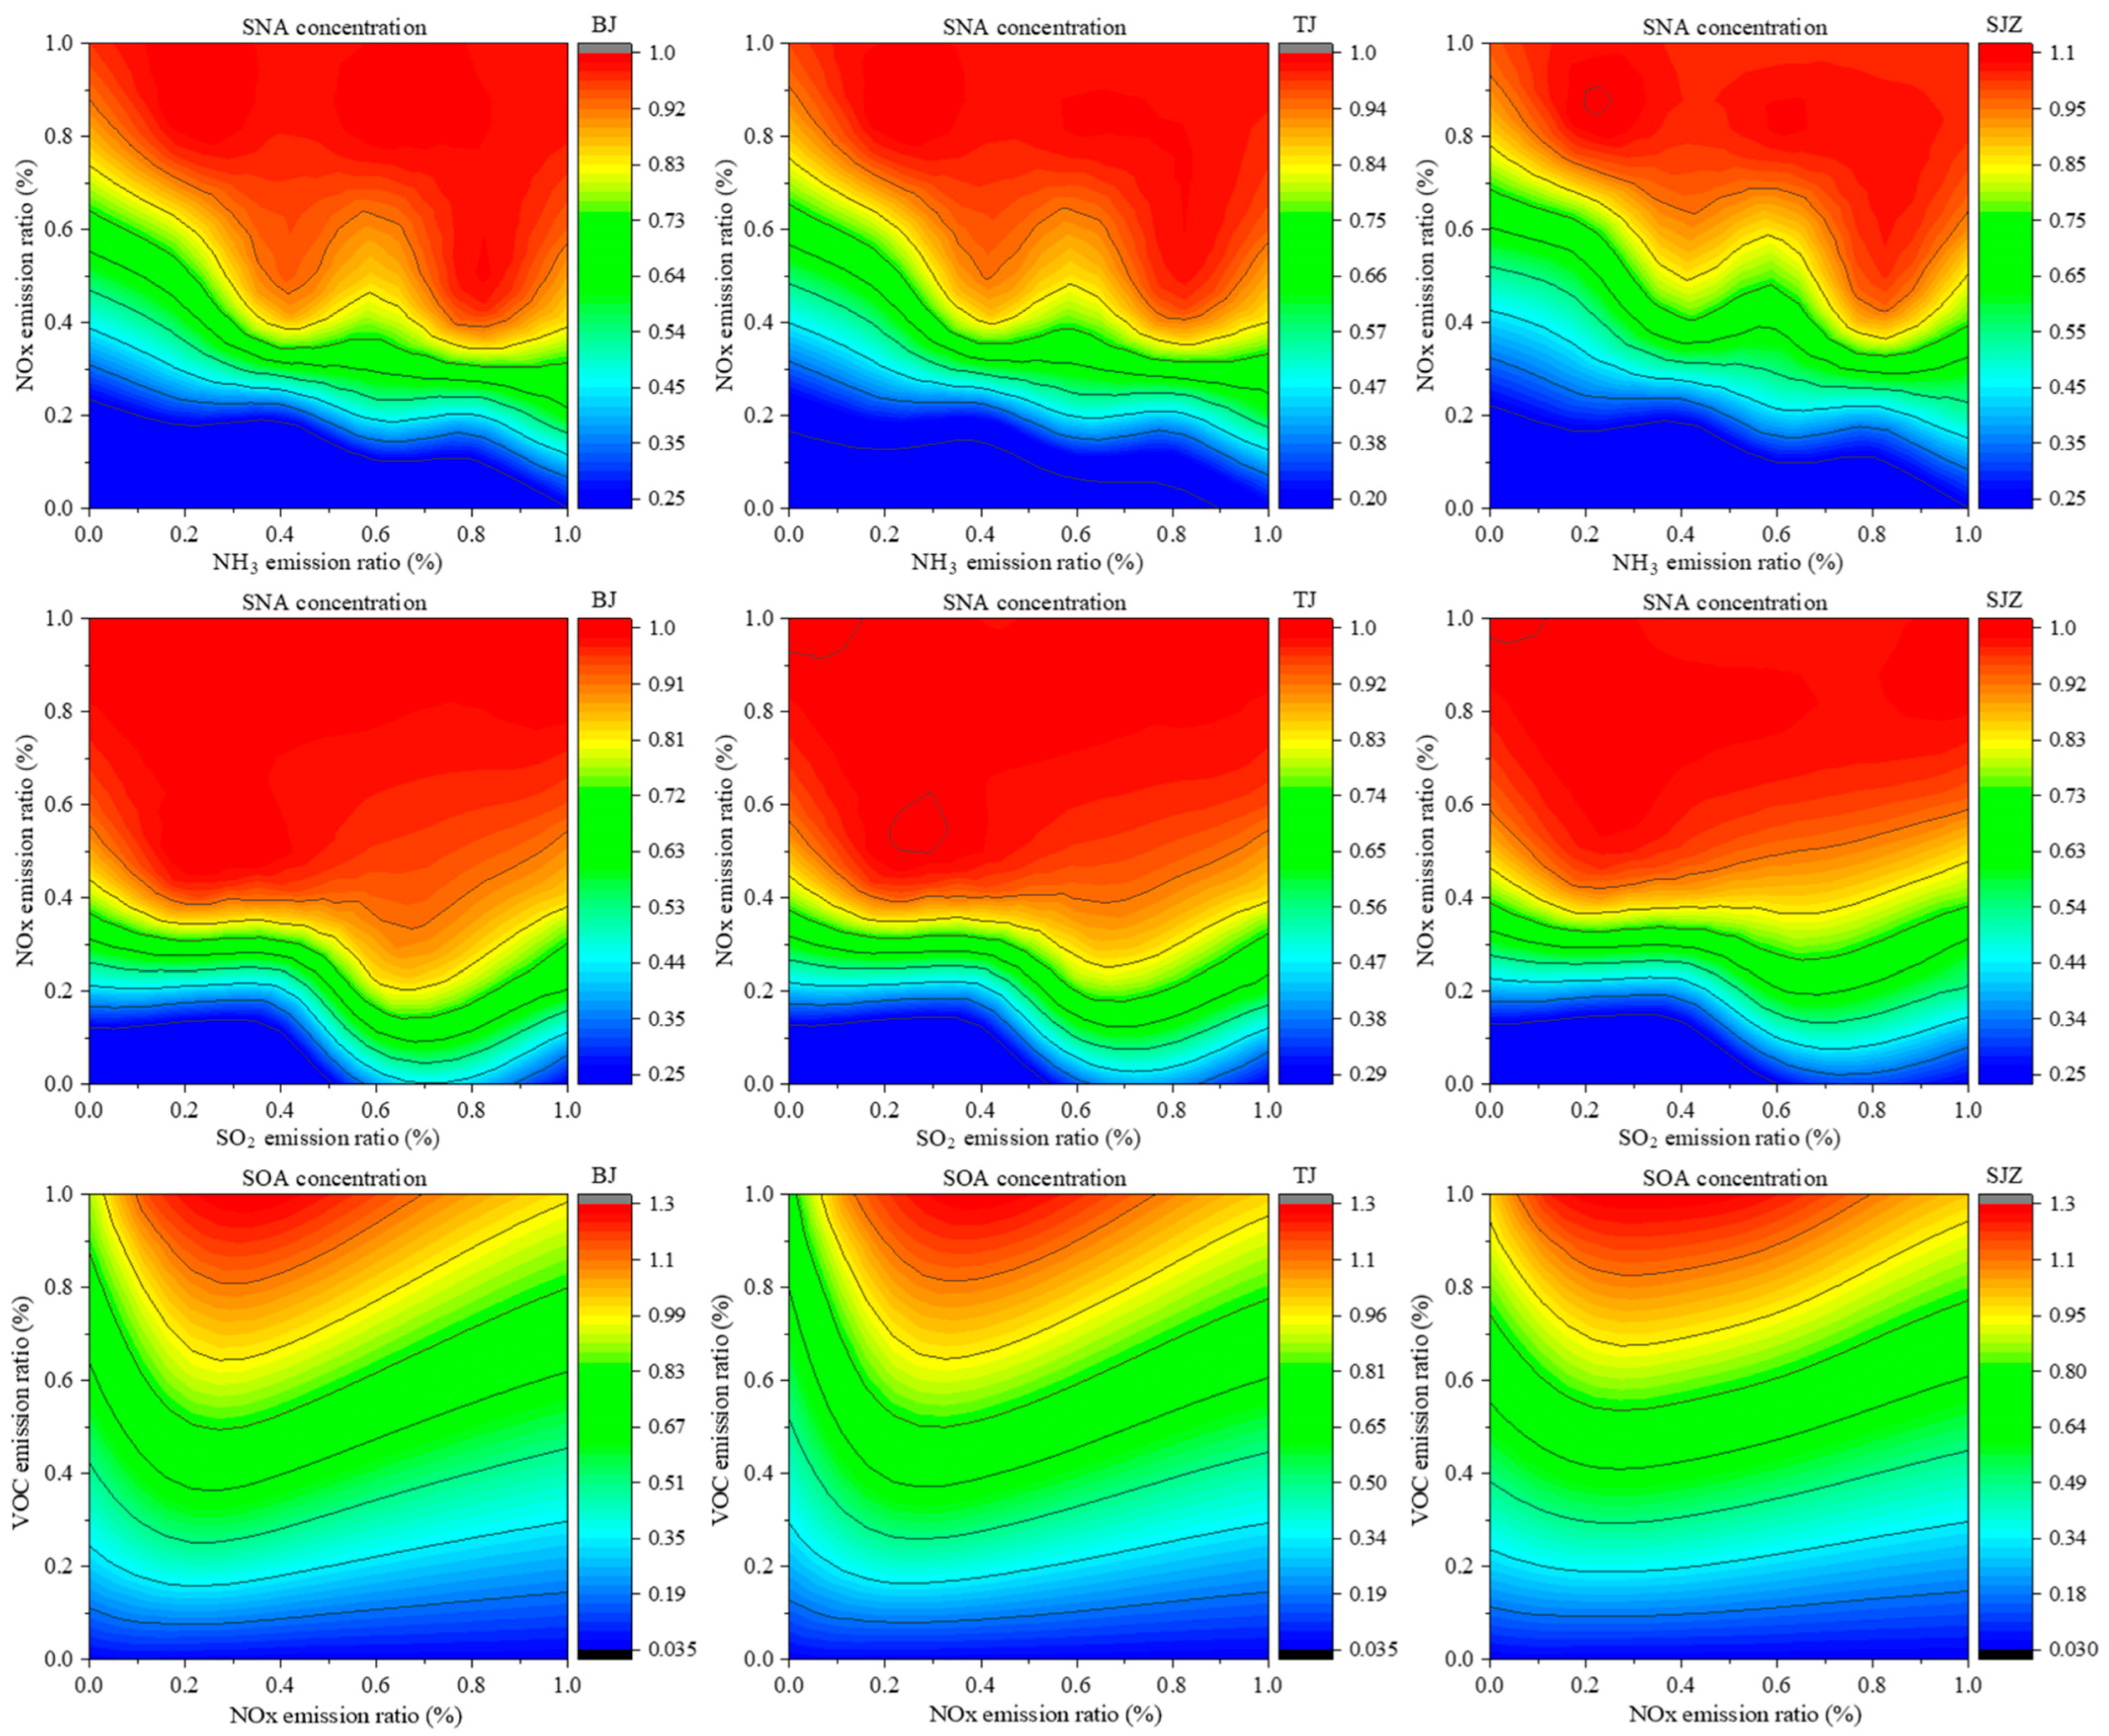
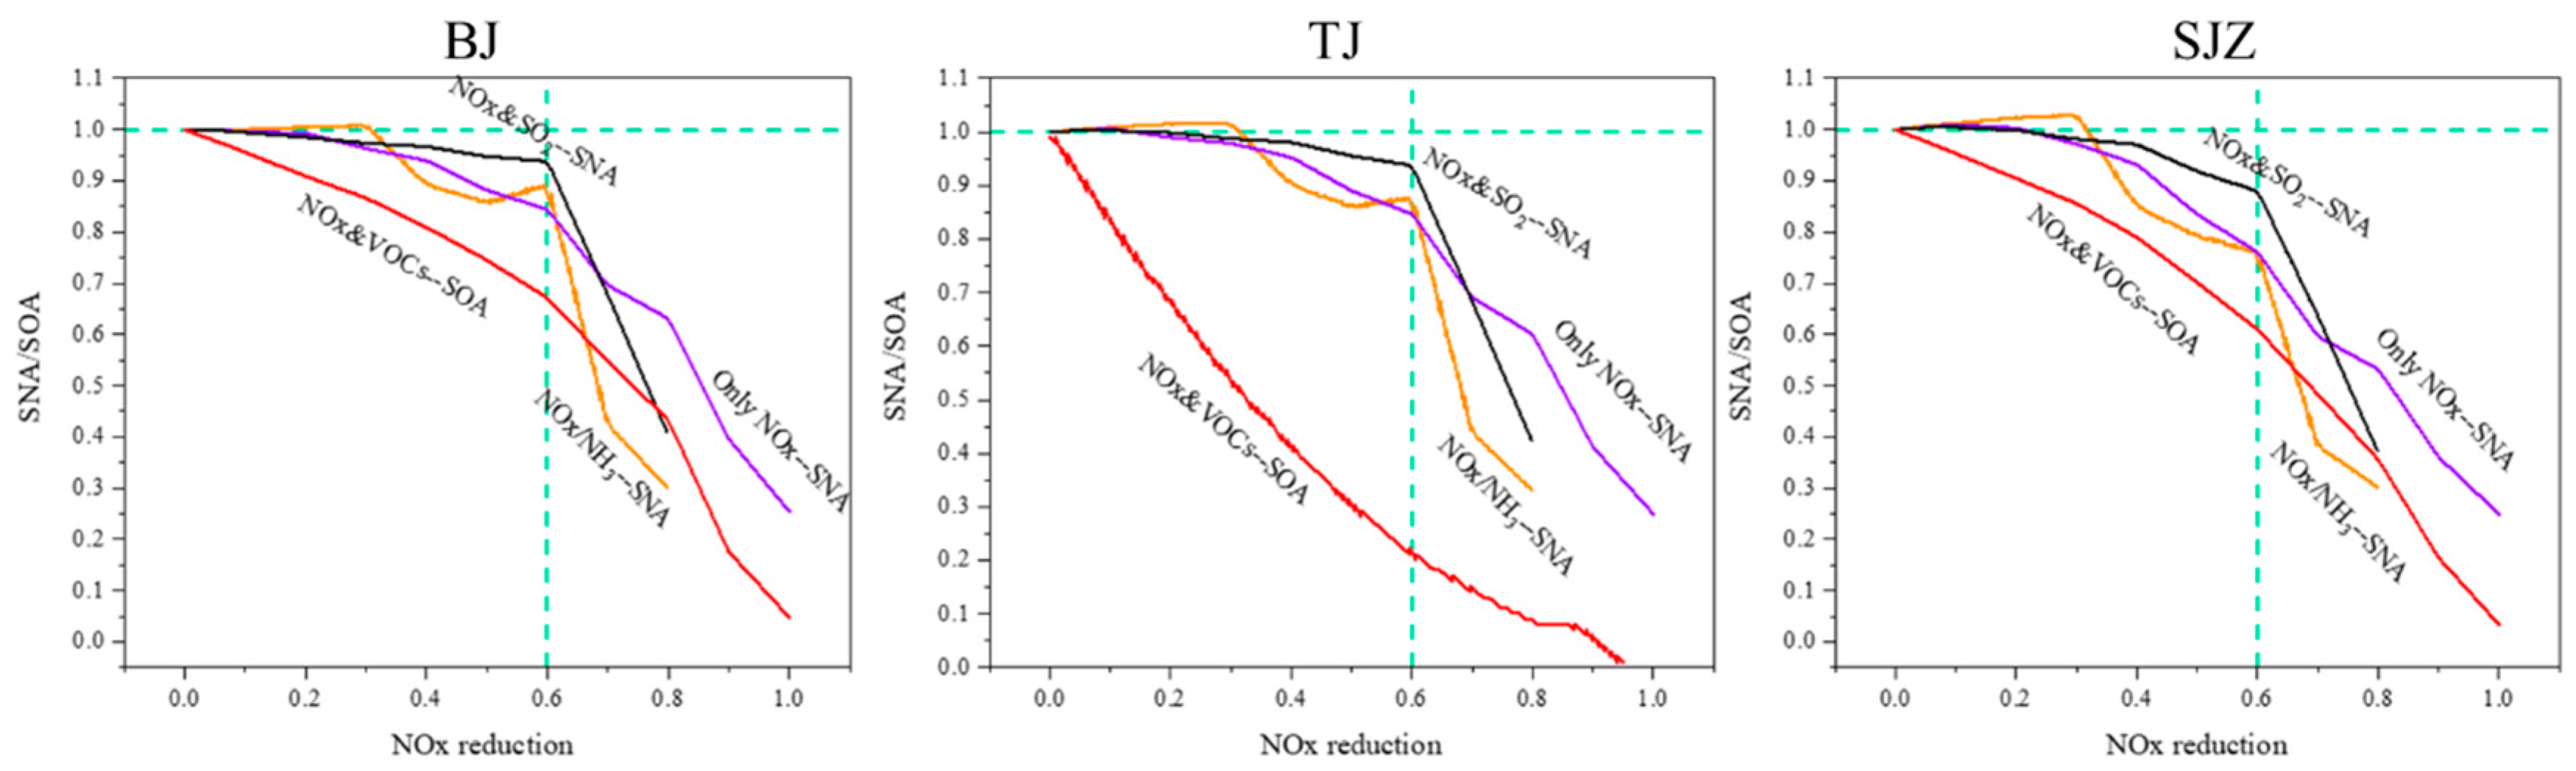
3.4. Scenario Simulation Response Surfaces

In PM2.5 composition, primary particulate matter (PPM) exhibits a significant linear relationship with emission reduction, whereas secondary inorganic aerosols (SNAs, including sulfate, nitrate, and ammonium) and secondary organic aerosols (SOAs) demonstrate complex non-linear responses to precursor emission reductions due to their secondary transformation processes in the atmosphere. Notably, during winter haze episodes, SNAs and SOAs can account for 19–41% and 20–33% [48] of PM2.5 concentration, respectively. Using January 2020 as the baseline emission scenario, a multi-scenario simulation approach was employed to quantify the response relationships between gradient reductions in NOx, SO2, and NH3 emissions and SNA concentration, as well as between NOx and VOCs reductions and SOA concentration (Figure 7, represented by contour plots). The results reveal that NOx emission reduction significantly decreases PM2.5 concentration, while SO2 and NH3 reductions show limited effects. This suggests that sustained NOx control becomes the dominant factor for PM2.5 mitigation when emission levels reach certain thresholds. Further analysis indicates a synergistic relationship between SOA concentration and NOx and VOC emissions. The characteristics of SOA concentration being affected by the synergistic emissions of NOx and VOCs are obvious. Compared with VOCs emission reduction as the main focus and NOx emission reduction as the main focus, NOx emission reduction will lead to significant fluctuations in SOA concentration. Specifically, when only reducing NOx to 50%, the SOA concentration in most cities in the Beijing–Tianjin–Hebei region will increase by 10% to 20%, and this adverse effect will continue to be around 80%; When only VOCs are reduced, within the range of 60% reduction, the concentration of SOA roughly decreases linearly to 50%, and the reduction of NOx has an inhibitory effect on the concentration decrease of this linear relationship. However, the sustained improvement of SOA concentration over a long period of time depends on the deep reduction of NOx emissions. From the perspective of the response relationship between atmospheric SOA concentration and industry wide NOx and VOCs emissions, the best control strategy should be to strengthen the coordinated control of VOCs and NOx in the near future to ensure a decrease in SOA concentration, and then strengthen NOx emission reduction in the long term to continuously improve the improvement effect. The research results of this sensitivity and enhanced NOx emission reduction are consistent with the previous research arguments [49], and also reflect the scientific nature of the dual pollutant treatment strategy. This study explored the response relationship between atmospheric PM2.5 and overall anthropogenic pollutant emissions, in order to find strategies for overall management. Different response relationship characteristics may appear in the control of specific industries, but from a macroscopic NOx and VOCs control path, the key roles of mobile and industrial sources as two precursors for joint control should be emphasized.
The NOx reduction–SNA/SOA response curves (Figure 8) suggest a two-phase mitigation pathway for sustained air quality improvement: (1) an initial phase emphasizing coordinated reductions in NOx-NH3 and NOx-VOCs, and (2) an advanced phase intensifying NOx control. At moderate NOx reduction levels (<60%), synergistic control of NOx with NH3 and VOCs ensures effective SNA and SOA reductions. When the synergistic reduction in multiple pollutants leads to a 60% reduction in NOx emissions, the SNA concentrations in Beijing, Tianjin, and Shijiazhuang can be reduced by 13%, 15%, and 26%, respectively, and SOAs can be reduced by 34%, 78%, and 40%, respectively. When NOx reductions exceed 60%, per-unit emission cuts demonstrate amplified PM2.5 improvement efficiency for both components. These findings highlight the critical need for the science-based evaluation of precursor–component interactions and the implementation of multi-pollutant control strategies. Future air quality management efforts must prioritize coordinated emission controls across sectors, recognizing air pollution prevention as a complex, long-term endeavor requiring continuous policy optimization guided by scientific research. This study provides a strategic framework for balancing mitigation priorities across different pollution stages while addressing the atmospheric chemistry complexities inherent in secondary aerosol formation.

3.5. Rationality and Uncertainty Analysis

By analyzing the relationship between wind direction frequency and PM2.5 transport flux, this study aims to validate the consistency between the calculated flux results and the prevailing meteorological wind field conditions. Figure 9 illustrates the wind direction frequency for three representative cities: Beijing (BJ), Tianjin (TJ), and Shijiazhuang (SJZ). In the winter month of January across the three study years, BJ exhibited a predominant southwest wind direction, while TJ and SJZ were primarily influenced by north and northwest winds. These observed wind patterns align well with the PM2.5 flux transport pathways, specifically the routes from Inner Mongolia through the BTH region to Shandong, as well as from BTH to Liaoning. The consistent wind direction trends over the years not only verify the rationality of the PM2.5 transport flux calculations but also provide a robust foundation for further research into the transport characteristics of PM2.5 based on meteorological elements. This alignment is particularly valuable for evaluating pollution response strategies under complex pollutant transport conditions, as it highlights the critical role of regional wind patterns in shaping PM2.5 distribution. Such insights are essential for developing targeted mitigation measures and understanding the interplay between meteorological factors and air quality dynamics in the BTH region and beyond.
For high-altitude validation, meteorological field data from the Global Data Assimilation System (GDAS) were utilized. Using the 800-m altitude as a case study, the HYSPLIT backward trajectory model, in conjunction with TrajStat (1.2.2.6R1) software, was employed to generate airflow trajectory maps. These maps were then compared with the PM2.5 flux transport direction at the same altitude to assess the accuracy of the high-altitude simulation. As illustrated in Figure 10, the backward trajectory at 800 m reveals a transport pathway extending from the west and northwest through the Beijing–Tianjin–Hebei (BTH) region to the southeast, specifically along the route “Shanxi, Inner Mongolia-BTH-Shandong, Henan.” The backward trajectories in January 2013, January 2017, and January 2020 were mainly the transport trajectories dominated by the northwest monsoon, which was relatively consistent with the transport direction of the 800m transport flux flowing from Shanxi and Inner Mongolia into the Beijing–Tianjin–Hebei region and flowing out to Shandong and Henan (Section 3.2). This comparison verified the reliability of the high-altitude wind field simulation and affirmed the credibility of the transport flux calculation. In addition, based on the observation results of LiDAR, it was found that the regional transport in Beijing in 2017 was concentrated on the surface and at heights of 500–1300 m, which is similar to the overall results of the net inflow flux of PM2.5 transport in the range of 252–817 m in this study, reflecting the rationality of model simulation and transport flux calculation.
While this study provides valuable insights into PM2.5 transport characteristics in the BTH region, several uncertainties and limitations should be acknowledged. The analysis focused primarily on January (winter) conditions, which may not fully represent seasonal variations in meteorology (e.g., monsoon shifts) or emission patterns (e.g., summer biogenic VOC contributions). Future studies should include multi-seasonal simulations to assess annual representativeness. The accuracy of transport flux and source apportionment results depends on the reliability of emission inventories (e.g., MEIC and local BTH inventories). Uncertainties arise from activity data, emission factors, and spatial-temporal allocation, particularly for fugitive dust, which are challenging to quantify. Although WRF-CAMx showed acceptable performance, biases in wind speed simulations could affect transport flux calculations. The overestimation of high-altitude winds may lead to inflated regional transport contributions. The CAMx model’s treatment of secondary aerosol formation (e.g., SOA yields, nitrate partitioning) may not fully capture non-linear responses to precursor changes. Interannual differences in winter meteorology could influence transport pathways, but this study did not isolate meteorological and emission-driven changes in PM2.5 trends. These limitations highlight the need for higher-resolution inventories, multi-model ensembles, and longer-term simulations to refine policy recommendations. Nevertheless, the consistent trends across 2013–2020 support the robustness of key conclusions regarding regional transport and control strategies.

4. Conclusions

The air quality in the BTH region has improved significantly since the Air Pollution Prevention and Control Action Plan period. The continuous reduction in multiple pollutants and the differences in urban environmental management have led to changes in pollution status and transport among cities. This poses new challenges, necessitating more effective regional pollution collaborative control for the BTH region. In order to elucidate the characteristics of and variations in PM2.5 intercity transport in the BTH region during 2013–2020, a modeling project was carried out to investigate the transport flux, regional source apportionment, and surface response of multiple precursors to PM2.5. The results indicate that the net PM2.5 transport flux in the BTH region steadily declined from 2013 to 2020, demonstrating the effectiveness of regional joint prevention and control measures in successfully reducing cross-regional pollutant movement. The transport matrix revealed significant intercity pollution interactions within the BTH region. The local contribution of PM2.5 in cities such as BJ continues to decline, reflecting the control of industrial emissions, reduction in coal consumption, and upgrading of vehicle emission standards and traffic restriction policies. The findings emphasize the critical need for enhanced regional collaboration to address shared pollution challenges. Intercity pollution transport must be a focal point in joint control strategies.
Over the study period, PM2.5 pollution transitioned from being dominated by SO2-driven coal smoke to NOx-driven nitrate haze. This shift underscores the success of coal combustion control measures, including stricter regulations and technological advancements. However, the increasing dominance of NOx emissions calls for urgent attention to vehicular emissions, industrial processes, and power generation as key sources of NOx. Scenario simulations highlighted the limitations of single-pollutant strategies, showing that coordinated control of multiple pollutants is essential for achieving optimal air quality. Effective management of PM2.5 requires simultaneous reductions in NOx, SO2, and VOCs to address their synergistic effects. Such integrated approaches can significantly enhance the efficiency of emission reduction measures and ensure sustainable improvements in air quality.

Author Contributions

Conceptualization, X.W.; Methodology, X.W.; Writing—original draft, Y.Q.; Writing—review & editing, C.W.; Supervision, X.W.; Project administration, X.W.; Funding acquisition, S.C. All authors have read and agreed to the published version of the manuscript.

Funding

This work was supported by the National Natural Science Foundation of China (Grant No. 52330002) and the R&D Program of Beijing Municipal Education Commission (KM202410005019).

Institutional Review Board Statement

Not applicable.

Informed Consent Statement

Not applicable.

Data Availability Statement

The raw data supporting the conclusions of this article will be made available by the authors on request.

Conflicts of Interest

The authors declare that they have no competing financial interests or personal relationships that may have influenced the work reported in this study.

References

  1. Chen, H.; Lin, Y.; Chiueh, P. Nexus of ecosystem service-human health-natural resources: The nature-based solutions for urban PM2.5 pollution. Sustain. Cities Soc. 2023, 91, 104441. [Google Scholar] [CrossRef]
  2. Wang, S.; Gao, J.; Guo, L.; Nie, X.; Xiao, X. Meteorological Influences on Spatiotemporal Variation of PM2.5 Concentrations in Atmospheric Pollution Transmission Channel Cities of the Beijing–Tianjin–Hebei Region, China. Int. J. Environ. Res. Public Health 2022, 19, 1607. [Google Scholar] [CrossRef] [PubMed]
  3. Qu, K.; Yan, Y.; Wang, X.; Jin, X.; Vrekoussis, M.; Kanakidou, M.; Brasseur, G.P.; Lin, T.; Xiao, T.; Cai, X.; et al. The effect of cross-regional transport on ozone and particulate matter pollution in China: A review of methodology and current knowledge. Sci. Total Environ. 2024, 947, 174196. [Google Scholar] [CrossRef] [PubMed]
  4. Chang, X.; Wang, S.; Zhao, B.; Cai, S.; Hao, J. Assessment of inter-city transport of particulate matter in the Beijing-Tianjin-Hebei region. Atmos. Chem. Phys. 2018, 18, 4843–4858. [Google Scholar] [CrossRef]
  5. Wang, G.; Zhu, Z.; Zhao, N.; Wei, P.; Li, G.; Zhang, H. Variations in characteristics and transport pathways of PM2.5 during heavy pollution episodes in 2013–2019 in Jinan, a central city in the north China Plain. Environ. Pollut. 2021, 284, 117450. [Google Scholar] [CrossRef]
  6. Chang, X.; Wang, S.; Zhao, B.; Xing, J.; Liu, X.; Wei, L.; Song, Y.; Wu, W.; Cai, S.; Zheng, H.; et al. Contributions of inter-city and regional transport to PM2.5 concentrations in the Beijing-Tianjin-Hebei region and its implications on regional joint air pollution control. Sci. Total Environ. 2019, 660, 1191–1200. [Google Scholar] [CrossRef]
  7. Zhang, X.; Yu, B. Analysis on the Evolution, Causes, and Countermeasures of Urban Haze Components in Beijing. E3S Web Conf. 2023, 369, 1011. [Google Scholar] [CrossRef]
  8. Xue, Y.; Zhang, S.; Nie, T.; Cao, X.; Shi, A. Environmental Effective Assessment of Control Measures Implemented by Clean Air Action Plan (2013–2017) in Beijing, China. Atmosphere 2020, 11, 189. [Google Scholar] [CrossRef]
  9. Shu, Y.; Li, H.; Wagner, F.; Zhang, S.; Yang, T.; Klimont, Z.; Kiesewetter, G.; Wang, H.; Sander, R.; Binh, N. Pathways toward PM2.5 air quality attainment and its CO2 mitigation co-benefits in China’s northern cities by 2030. Urban Clim. 2023, 50, 101584. [Google Scholar] [CrossRef]
  10. Diao, B.; Ding, L.; Cheng, J.; Fang, X. Impact of transboundary PM2.5 pollution on health risks and economic compensation in China. J. Clean. Prod. 2021, 326, 129312. [Google Scholar] [CrossRef]
  11. Zhao, X.; Zhang, Z.; Xu, J.; Gao, J.; Cheng, S.; Zhao, X.; Xia, X.; Hu, B. Impacts of aerosol direct effects on PM2.5 and O3 respond to the reductions of different primary emissions in Beijing-Tianjin-Hebei and surrounding area. Atmos. Environ. 2023, 309, 119948. [Google Scholar] [CrossRef]
  12. Jiang, L.; He, S.; Zhou, H. Spatio-temporal characteristics and convergence trends of PM2.5 pollution: A case study of cities of air pollution transmission channel in Beijing-Tianjin-Hebei region, China. J. Clean. Prod. 2020, 256, 120631. [Google Scholar] [CrossRef]
  13. Mao, K.; Yao, Y.; Wang, K.; Liu, C.; Tang, G.; Feng, S.; Shen, Y.; Ju, A.; Zhou, H.; Li, Z. Analysis of PM2.5 Pollution Transport Characteristics and Potential Sources in Four Chinese Megacities During 2022: Seasonal Variations. Atmosphere 2024, 15, 1482. [Google Scholar] [CrossRef]
  14. Fang, C.; Qiu, J.; Li, J.; Wang, J. Analysis of the meteorological impact on PM2.5 pollution in Changchun based on KZ filter and WRF-CMAQ. Atmos. Environ. 2022, 271, 118924. [Google Scholar] [CrossRef]
  15. Shu, L.; Wang, T.; Liu, J.; Chen, Z.; Wu, H.; Qu, Y.; Li, M.; Xie, M. Elucidating drivers of severe wintertime fine particulate matter pollution episodes in the Yangtze River Delta region of eastern China. Sci. Total Environ. 2024, 912, 169546. [Google Scholar] [CrossRef]
  16. De Angelis, E.; Carnevale, C.; Turrini, E.; Volta, M. Source Apportionment and Integrated Assessment Modelling for Air Quality Planning. Electronics 2020, 9, 1098. [Google Scholar] [CrossRef]
  17. Zhang, Y.; Chen, X.; Yu, S.; Wang, L.; Li, C.; Li, M.; Liu, W.; Li, P.; Rosenfeld, D.; Seinfeld, J.H. City-level air quality improvement in the Beijing-Tianjin-Hebei region from 2016/17 to 2017/18 heating seasons: Attributions and process analysis. Environ. Pollut. 2021, 274, 116523. [Google Scholar] [CrossRef]
  18. Zheng, G.J.; Duan, F.K.; Su, H.; Ma, Y.L.; Cheng, Y.; Zheng, B.; Zhang, Q.; Huang, T.; Kimoto, T.; Chang, D.; et al. Exploring the severe winter haze in Beijing: The impact of synoptic weather, regional transport and heterogeneous reactions. Atmos. Chem. Phys. 2015, 15, 2969–2983. [Google Scholar] [CrossRef]
  19. Miao, Y.; Guo, J.; Liu, S.; Wei, W.; Zhang, G.; Lin, Y.; Zhai, P. The Climatology of Low-Level Jet in Beijing and Guangzhou, China. J. Geophys. Res. Atmos. 2018, 123, 2816–2830. [Google Scholar] [CrossRef]
  20. Hua, Y.; Wang, S.; Wang, J.; Jiang, J.; Zhang, T.; Song, Y.; Kang, L.; Zhou, W.; Cai, R.; Wu, D.; et al. Investigating the impact of regional transport on PM2.5 formation using vertical observation during APEC 2014 Summit in Beijing. Atmos. Chem. Phys. 2016, 16, 15451–15460. [Google Scholar] [CrossRef]
  21. Zhen, J.; Guan, P.; Yang, R.; Zhai, M. Transport matrix of PM2.5 in Beijing-Tianjin-Hebei and Yangtze River Delta regions: Assessing the contributions from emission reduction and meteorological conditions. Atmos. Environ. 2023, 304, 119775. [Google Scholar] [CrossRef]
  22. Zhang, X.; Yuan, C.; Zhuang, Z. Exploring the change in PM2.5 and ozone concentrations caused by aerosol–radiation interactions and aerosol–cloud interactions and the relationship with meteorological factors. Atmosphere 2021, 12, 1585. [Google Scholar] [CrossRef]
  23. Tao, H.; Xing, J.; Zhou, H.; Pleim, J.; Ran, L.; Chang, X.; Wang, S.; Chen, F.; Zheng, H.; Li, J. Impacts of improved modeling resolution on the simulation of meteorology, air quality, and human exposure to PM2.5, O3 in Beijing, China. J. Clean. Prod. 2020, 243, 118574. [Google Scholar] [CrossRef]
  24. Zhang, W.; Hai, S.; Zhao, Y.; Sheng, L.; Zhou, Y.; Wang, W.; Li, W. Numerical modeling of regional transport of PM2.5 during a severe pollution event in the Beijing-Tianjin-Hebei region in November 2015. Atmos. Environ. 2021, 254, 118393. [Google Scholar] [CrossRef]
  25. Xu, H.; Chen, H. Impact of urban morphology on the spatial and temporal distribution of PM2.5 concentration: A numerical simulation with WRF/CMAQ model in Wuhan, China. J. Environ. Manage. 2021, 290, 112427. [Google Scholar] [CrossRef]
  26. Zaman, T.; Juliano, T.; Hawbecker, P.; Astitha, M. On predicting offshore hub height wind speed and wind power density in the northeast US coast using high-resolution WRF model configurations during anticyclones coinciding with wind drought. Energies 2024, 17, 2618. [Google Scholar] [CrossRef]
  27. Li, W.; Wang, Y.; Liu, X.; Soleimanian, E.; Griggs, T.; Flynn, J.; Walter, P. Understanding offshore high-ozone events during TRACER-AQ 2021 in Houston: Insights from WRF-CAMx photochemical modeling. Atmos. Chem. Phys. 2023, 23, 13685–13699. [Google Scholar] [CrossRef]
  28. Kadaverugu, R.; Matli, C.; Biniwale, R. Suitability of WRF model for simulating meteorological variables in rural, semi-urban and urban environments of Central India. Meteorol. Atmos. Phys. 2021, 133, 1379–1393. [Google Scholar] [CrossRef]
  29. Yao, S.; Zhang, H.; Wang, Q. Vertical Distribution of PM2.5 Transport Flux in Summer and Autumn in Beijing. Aerosol Air Qual. Res. 2022, 22, 220143. [Google Scholar] [CrossRef]
  30. Wang, R.; Wang, X.; Cheng, S.; Zhu, J.; Zhang, X.; Cheng, L.; Wang, K. Determining an optimal control strategy for anthropogenic VOC emissions in China based on source emissions and reactivity. J. Environ. Sci. 2024, 136, 248–260. [Google Scholar] [CrossRef]
  31. Zhang, J.; Duan, W.; Cheng, S.; Wang, C. A high-resolution (0.1° × 0.1°) emission inventory for the catering industry based on VOCs and PM2.5 emission characteristics of Chinese multi-cuisines. Atmos. Environ. 2024, 319, 120314. [Google Scholar] [CrossRef]
  32. Cheng, L.; Wei, W.; Zhang, C.; Xu, X.; Sha, K.; Meng, Q.; Jiang, Y.; Cheng, S. Quantitation study on VOC emissions and their reduction potential for coking industry in China: Based on in-situ measurements on treated and untreated plants. Sci. Total Environ. 2022, 836, 155466. [Google Scholar] [CrossRef] [PubMed]
  33. Lv, L.; Chen, Y.; Han, Y.; Cui, M.; Wei, P.; Zheng, M.; Hu, J. High-time-resolution PM2.5 source apportionment based on multi-model with organic tracers in Beijing during haze episodes. Sci. Total Environ. 2021, 772, 144766. [Google Scholar] [CrossRef] [PubMed]
  34. Chen, T.; Chang, K.; Tsai, C. Modeling approach for emissions reduction of primary PM2.5 and secondary PM2.5 precursors to achieve the air quality target. Atmos. Res. 2017, 192, 11–18. [Google Scholar] [CrossRef]
  35. Zhang, Q.; Xue, D.; Liu, X.; Gong, X.; Gao, H. Process analysis of PM2.5 pollution events in a coastal city of China using CMAQ. J. Environ. Sci. 2019, 79, 225–238. [Google Scholar] [CrossRef]
  36. Lv, L.; Wei, P.; Hu, J.; Chen, Y.; Shi, Y. Source apportionment and regional transport of PM2.5 during haze episodes in Beijing combined with multiple models. Atmos. Res. 2022, 266, 105957. [Google Scholar] [CrossRef]
  37. Wen, W.; Guo, C.; Ma, X.; Zhao, X.; Liu, L.; Chen, D.; Xu, J. Impact of emission reduction on aerosol-radiation interaction during heavy pollution periods over Beijing-Tianjin-Hebei region in China. J. Environ. Sci. 2020, 95, 2–13. [Google Scholar] [CrossRef]
  38. Zhai, H.; Huang, L.; Emery, C.; Zhang, X.; Wang, Y.; Yarwood, G.; Fu, J.S.; Li, L. Recommendations on benchmarks for photochemical air quality model applications in China—NO2, SO2, CO and PM10. Atmos. Environ. 2024, 319, 120290. [Google Scholar] [CrossRef]
  39. Emery, C.; Liu, Z.; Russell, A.G.; Odman, M.T.; Yarwood, G.; Kumar, N. Recommendations on statistics and benchmarks to assess photochemical model performance. J. Air Waste Manag. Assoc. 2017, 67, 582–598. [Google Scholar] [CrossRef]
  40. Boylan, J.W.; Russell, A.G. PM and light extinction model performance metrics, goals, and criteria for three-dimensional air quality models. Atmos. Environ. 2006, 40, 4946–4959. [Google Scholar] [CrossRef]
  41. Zhou, D.; Zhong, Z.; Chen, L.; Gao, W.; Wang, M. Can the Joint Regional Air Pollution Control Policy Achieve a Win-Win Outcome for the Environment and Economy? Evidence from China. Econ. Anal. Policy 2022, 74, 13–33. [Google Scholar] [CrossRef]
  42. Yang, X.; Yang, X.; Zhu, J.; Jiang, P.; Lin, H.; Cai, Z.; Huang, H.; Long, J. Synergic Emissions Reduction Effect of China’s “Air Pollution Prevention and Control Action Plan”: Benefits and Efficiency. Sci. Total Environ. 2022, 847, 157564. [Google Scholar] [CrossRef] [PubMed]
  43. Xu, M.; Qin, Z.; Zhang, S.; Xie, Y. Health and Economic Benefits of Clean Air Policies in China: A Case Study for Beijing-Tianjin-Hebei Region. Environ. Pollut. 2021, 285, 117525. [Google Scholar] [CrossRef] [PubMed]
  44. Wang, J.; Gao, A.; Li, S.; Liu, Y.; Zhao, W.; Wang, P.; Zhang, H. Regional joint PM2.5-O3 control policy benefits further air quality improvement and human health protection in Beijing-Tianjin-Hebei and its surrounding areas. J. Environ. Sci. 2023, 130, 75–84. [Google Scholar] [CrossRef]
  45. Zhang, H.; Lv, L.; Yao, Z.; Guo, W.; Wang, X.; Shan, W.; Li, X.; Shen, X. Vertical Variations of Ozone Transport Flux at Multiple Altitudes and Identification of Major Transport Direction in the North China Plain. J. Environ. Sci. 2025, 155, 488–500. [Google Scholar] [CrossRef]
  46. Huang, A.; Cheng, W.; Chu, M.; Wang, G.; Yang, H.; Zhang, L. A Comprehensive Attribution Analysis of PM2.5 in Typical Industrial Cities during the Winter of 2016–2018: Effect of Meteorology and Emission Reduction. Atmos. Res. 2024, 299, 107181. [Google Scholar] [CrossRef]
  47. Yin, D.; Song, Q.; Guo, Y.; Jiang, Y.; Dong, Z.; Zhao, B.; Wang, S.; Gao, D.; Chang, X.; Zheng, H.; et al. Regional Transport Characteristics of PM2.5 Pollution Events in Beijing during 2018–2021. J. Environ. Sci. 2025, 152, 503–515. [Google Scholar] [CrossRef]
  48. Azmi, S.; Sharma, M. Global PM2.5 and secondary organic aerosols (SOA) levels with sectorial contribution to anthropogenic and biogenic SOA formation. Chemosphere 2023, 336, 139195. [Google Scholar] [CrossRef]
  49. Ding, D.; Xing, J.; Wang, S.; Dong, Z.; Zhang, F.; Liu, S.; Hao, J. Optimization of a NOx and VOC cooperative control strategy based on clean air benefits. Environ. Sci. Technol. 2022, 56, 739–749. [Google Scholar] [CrossRef]
Figure 1. Range of model configuration (1) and source region division in PSAT (2).
Sustainability 17 06389 g001
Figure 2. The PM2.5 concentration variation in the BTH region in January 2013 (a), January 2017 (b), January 2020 (c).
Sustainability 17 06389 g002
Figure 3. The annual emission variation in PM2.5, NOx, and SO2 in the BTH region from 2013 to 2020.
Sustainability 17 06389 g003
Figure 4. PM2.5 transport flux of the BTH region and its neighboring regions.
Sustainability 17 06389 g004
Figure 5. PM2.5 transport flux on clean and polluted days in January 2013, 2017, and 2020.
Sustainability 17 06389 g005
Figure 6. The proportion (a,c,e) and concentration (b,d,f) of PM2.5 transport matrix in the BTH region in January 2013, 2017, and 2020.
Sustainability 17 06389 g006
Figure 7. Scenario simulation response surfaces.
Sustainability 17 06389 g007
Figure 8. Concentration variation curves of SOAs and SNAs with NOx emission reduction.
Sustainability 17 06389 g008
Figure 9. Wind vectors of BJ, TJ, and SJZ in January 2013, 2017, and 2020.
Sustainability 17 06389 g009
Figure 10. Airflow trajectories in BJ, TJ, and SJZ in January 2013, 2017, and 2020.
Sustainability 17 06389 g010
Table 1. Verification of air quality model accuracy (Obs: observation; Sim: simulation).
YearParametersCityObsSimCORNMBNME
2013PM2.5 (μg/m3)BJ1591520.83−0.210.34
TJ1551630.72−0.270.41
SJZ3333200.81−0.190.29
WS10 (m/s)BJ3.23.50.760.210.36
TJ2.83.30.720.260.41
SJZ2.32.60.690.320.43
2017PM2.5 (μg/m3)BJ69640.90−0.160.32
TJ72780.77−0.110.33
SJZ1301180.88−0.150.26
WS10 (m/s)BJ3.43.70.800.190.35
TJ3.64.00.720.220.31
SJZ2.02.30.690.410.52
2020PM2.5 (μg/m3)BJ61540.86−0.180.36
TJ1021090.75−0.130.38
SJZ1511380.82−0.210.27
WS10 (m/s)BJ3.13.40.780.230.32
TJ2.82.90.740.280.37
SJZ2.12.50.710.360.45
Disclaimer/Publisher’s Note: The statements, opinions and data contained in all publications are solely those of the individual author(s) and contributor(s) and not of MDPI and/or the editor(s). MDPI and/or the editor(s) disclaim responsibility for any injury to people or property resulting from any ideas, methods, instructions or products referred to in the content.

