Article

Development of a Sustainability-Oriented KPI Selection Model for Manufacturing Processes

Department of Mechanical and Industrial Engineering, Tallinn University of Technology, Ehitajate tee 5, 19086 Tallinn, Estonia
*
Author to whom correspondence should be addressed.
Sustainability 2025, 17(14), 6374; https://doi.org/10.3390/su17146374
Submission received: 26 May 2025 / Revised: 6 July 2025 / Accepted: 10 July 2025 / Published: 11 July 2025
(This article belongs to the Special Issue Logistics Optimization and Sustainable Operations Management)

Abstract

Modern manufacturing systems operate in a global and competitive environment, where sustainability has become a critical driver for performance. Performance measurement, as a method for monitoring enterprise processes, plays a central role in aligning operational efficiency with sustainable development goals. Recently, a number of different frameworks, systems, and methods have been proposed for small and medium enterprises. Key performance indicators (KPIs) are known to be powerful tools which provide accurate information regarding bottlenecks and weak spots in companies. The purpose of the current study is to develop an advanced KPI selection/prioritization model and apply it in practice. The initial set of KPIs are obtained based on a literature review. The expert’s knowledge, outlier methods, and optimization of the enterprise analysis model (EAM) are utilized for reducing the initial set of KPIs. A fuzzy analytical hierarchy process (AHP) is implemented for prioritization of the criteria. Five different MCDM (multi-criteria decision-making) algorithms are implemented for prioritization of the KPIs. The recently introduced RADAR method is extended to the fuzzy RADAR method, providing a flexible approach for handling uncertainties. An analysis and comparison of the rankings obtained by utilizing five MCDM algorithms is performed. The prioritized KPIs provide valuable input for improving KPIs with the highest impact in particular small and medium-sized enterprises (SMEs) when implementing sustainability-aligned performance metrics.

1. Introduction

For optimizing the manufacturing processes, it is essential to connect KPIs to the goals and production and maintenance activities of the company’s particular processes [1]. To avoid inappropriately selected technical performance indicators, it is important to focus on the implementation of the Enterprise Analysis Model and KPI Selection Model [2,3]. For prioritization of selected KPIs, the EAM integrated fuzzy AHP, TOPSIS approach, covering the vagueness and uncertainty, is developed. In [4], a methodology based on the theory of belief functions for evaluating the uncertainty of KPIs is proposed. Recently, the prioritization of KPIs for evaluating the greenness of products has been performed by utilizing the Pareto concept and the full consistency method [5]. The application of Lean principles and Q-methodology for evaluating KPIs in project-based organizations is studied in [6,7], respectively.
In the literature different types of methods are available for KPI prioritization, like MCDM, ML (machine learning), EC (evolutionary computing), etc. Herein is a focus on MCDM methods mostly due to their simplicity, low computational cost, and transparency. MDCM methods [8,9,10,11,12,13,14,15,16,17,18,19,20,21,22,23,24,25,26,27,28,29,30,31,32,33,34,35,36,37,38,39,40] include commonly simple matrix operations (matrix normalization and weighted summation). ML algorithms [41,42,43] and evolutionary algorithms (EAs) [5,44,45] involve iterative computing and parameter tuning. ML algorithms require training, while EAs are population-based, making them more complex and time-consuming.
The AHP is a powerful decision-making methodology developed by Saaty in the 1980s to simplify the decision-making process [8]. It includes qualitative and quantitative techniques and makes it possible to decompose complex problems into simpler sub-problems where each level shows a set of objectives or criteria relative to each sub-group [8,9]. A number of review papers on the AHP are available [10,11,12,13]. The AHP research field development using social network analysis and scientometrics is studied in [13], and the applications of the AHP are overviewed in [12]. The AHP method allows the decision-maker to include a subjective attitude, experience, knowledge, and intuition in decision-making. Each level of the hierarchy consists of several elements, where the elements from the same level are independent of each other but comparable [14].
The AHP has been utilized successfully for wide-class complex MCDM problems covering civil engineering, renewable energy, production planning, etc., areas [15,16]. The nine-point scale simplifies the choice of criteria and provides information regarding the dominance of each element over others concerning the importance of each criterion of the higher levels of the hierarchy. Individual points of view are made in groups, considering the pertinent decision-maker, and are handled as a foundation for the analysis of the reasons for specific judgments; there is a one-week period that occurs during the setup of comparison matrices [9]. When the number of characteristics is rising in a hierarchy, more matchings between attributes need to be applied. Furthermore, by raising criteria and sub-criteria, the experts are dealing with physical and mental fatigue. As a result, the judgments are becoming unreliable, subjective, and imprecise. Therefore, the triangular fuzzy numbers (TFNs) are a valuable solution for handling subjective and imprecise judgments.
The fuzzy sets introduced in [17] provide a methodology for handling imprecision. The fuzzy AHP has been introduced as a combination of fuzzy sets and AHP in [18]. Replacing the fixed value judgments in AHP with interval judgments in fuzzy AHP simplifies the evaluations of the decision-makers. Fuzzy AHP can be considered a fuzzy extension of Saaty’s priority theory, providing a flexible approach for handling imprecise and inaccurate data. During the last decade, fuzzy AHP has become a popular fuzzy MCDM method in various areas like risk assessment [19], renewable energy [20], engineering, environmental problems, etc. A recent review of fuzzy AHP methods can be found in [21].
The basic idea of the TOPSIS method (Technique for Order Preference by Similarity to Ideal Solution) is that the most preferred alternative should have the shortest distance from the positive ideal solution (PIS) and the farthest distance from the negative ideal solution (NIS) [22]. In classical TOPSIS, the ratings and the weights of the criteria are given as crisp numbers. Such an exact evaluation may appear complicated for the decision-maker in real-life conditions [23].
In recent studies, the fuzzy AHP and TOPSIS methods are combined to solve various MCDM problems including supplier selection [24], metal matrix composite selection [25], customer-driven product design process [26], best plastic recycling method selection [23], performance evaluation of municipal services [27], risks prioritizing in self-driving vehicles [28], optimizing additive manufacturing parameters [29], and risk assessment for airborne network security [30]. In [31], an approach is proposed for manufacturing scheduling by combining a predictive schedule with an MCDM method. This combines the intelligent data-based models of random forest (RF) and the human knowledge-based multi-criteria structure of AHP in accordance with the objective and the subjective factors. In [32], the textile manufacturing process is optimized by combining reinforced learning, RF, and human knowledge-based MCDM methods. In [33], a methodology based on a fuzzy analytic network process and incomplete preference relations is proposed for sustainable supplier selection. In [34], a randomized weighted fuzzy AHP is introduced for stock portfolio selection using modified normalization with fuzzy TOPSIS. In [35,36], the fuzzy AHP approach is adapted for risk evaluation in gold and phosphorite mining industries. In [36], fuzzy AHP is combined with fuzzy TOPSIS.
Recently, a principally new RADAR (Ranking based on Distances and Range) method has been introduced in [37]. According to the method name, the ranking is based on both distance and range. The RADAR method emphasizes stability, tending to prefer alternatives that demonstrate consistent performance across all criteria [37]. In [38], the RADAR2 method was introduced and implemented for the selection of industrial equipment. The main difference between the RADAR2 method and the RADAR method is the modified normalization rule. The mathematical foundation of the RADAR methods is given in [39], demonstrating the robustness of the methods. By combining the fuzzy set theory and RADAR method, the fuzzy RADAR method approach is proposed in [40].
The main objective of this study is to develop an enterprise analysis model and implement it in practice within small and medium-sized enterprises (SMEs). One of the subtasks focuses on the prioritization of key performance indicators (KPIs). Selecting the appropriate metrics is a critical challenge for ensuring the sustainability of production processes and, ultimately, the survival of SMEs as a whole.
These goals are achieved through the application of recent multi-criteria decision-making (MCDM) methods, such as RADAR and RADAR2, as well as the development of a new fuzzy RADAR method, also integrating KPI prioritization within the enterprise analysis model. Prioritized KPIs help SMEs focus on the most important indicators, the improvement of which has the greatest impact on production processes. The KPI selection model operates as a cyclical process. After implementing the selected metrics into production processes, the entire procedure should be repeated to assess how the situation has changed and to evaluate the resulting impact on overall effectiveness.
The paper is organized as follows: Section 1 presents the literature review, outlines the objectives, and main activities undertaken to achieve these goals. Section 2 describes the enterprise analysis model. Section 3 explains the methodology, including the optimization of the EAM, fuzzy set theory, criteria prioritization using fuzzy AHP, and KPI prioritization using the fuzzy TOPSIS, RADAR, RADAR2, and fuzzy RADAR methods. Section 4 presents the numerical results. Section 5 concludes the results.
In recent years, sustainability has emerged as a central concern in manufacturing, where economic performance must be balanced with environmental and social responsibility. Performance indicators that consider energy usage, waste reduction, resource efficiency, and employee well-being are essential for aligning manufacturing strategies with the principles of sustainable development. Therefore, the development of a KPI selection model that reflects sustainability-related dimensions is critical for modern SMEs aiming to enhance their competitiveness while contributing to broader sustainability goals. This study integrates sustainability perspectives into KPI prioritization through structured and data-driven multi-criteria decision-making approaches.

2. Development of the KPI Selection Model as Part of an EAM

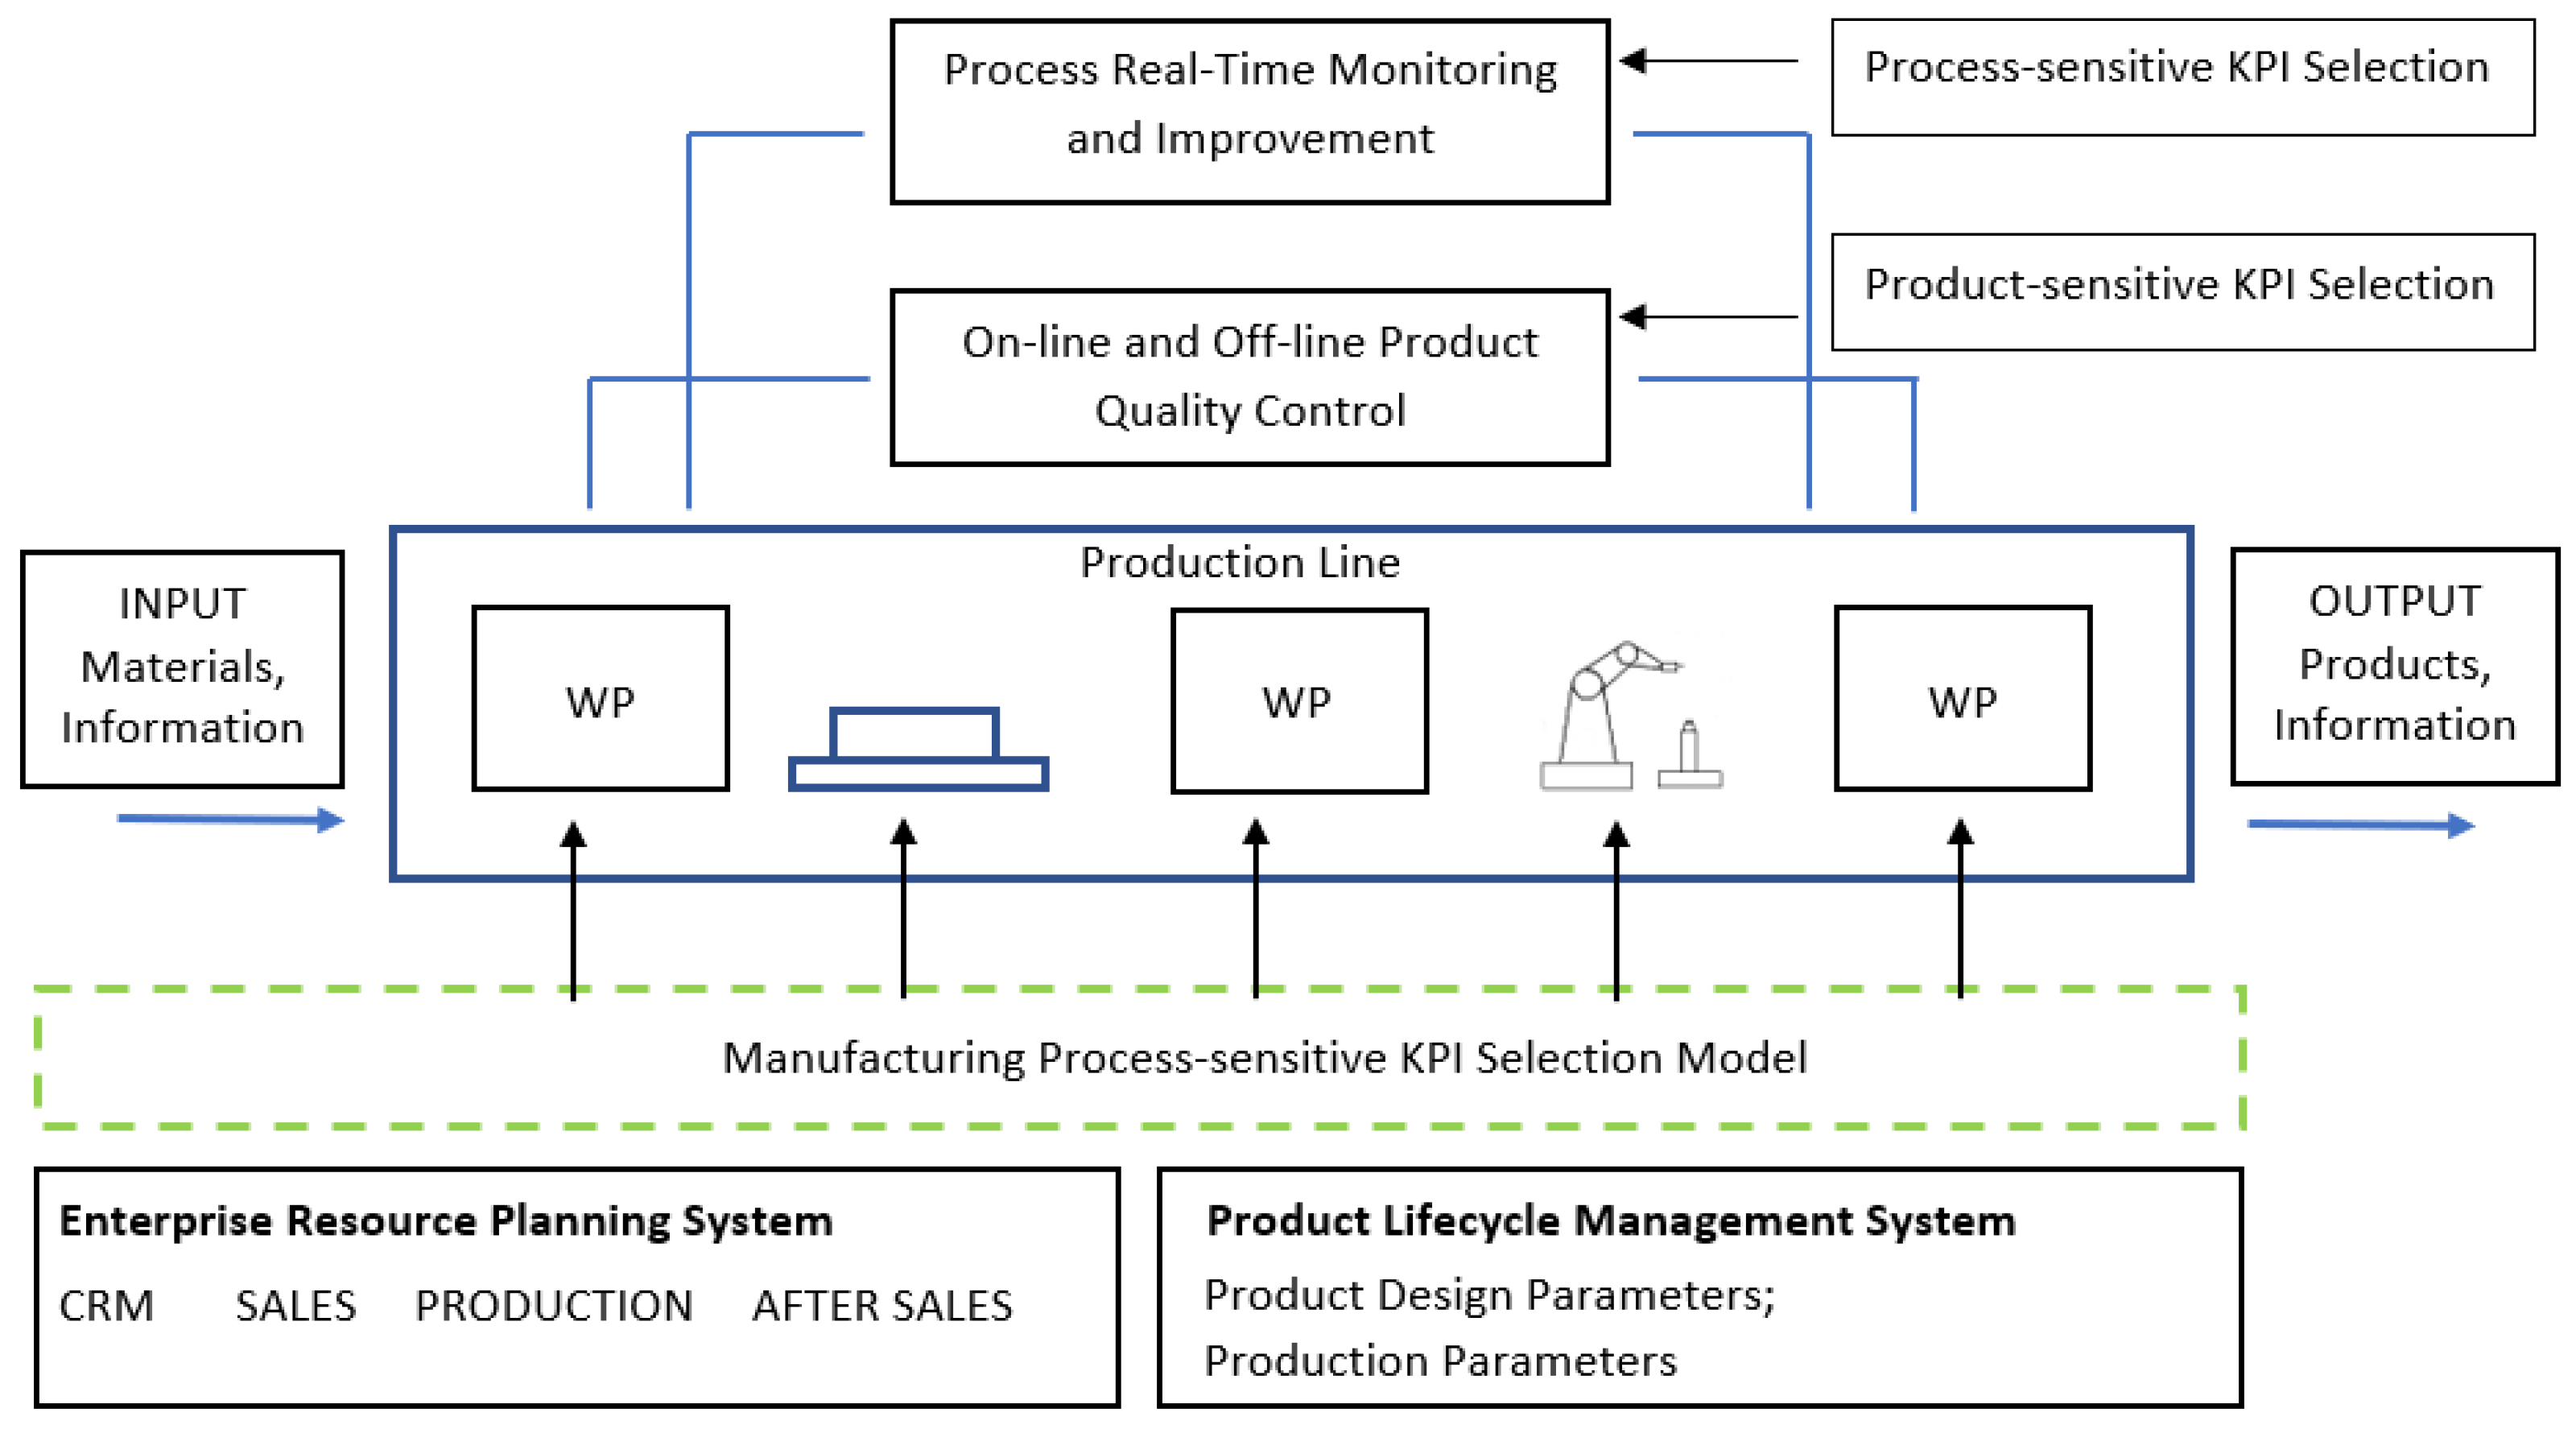
For optimizing different manufacturing processes it is important to monitor and collect real-time data from those processes to be able to make on-time management and optimization decisions. Collecting the economic and technical KPIs is the most time-consuming for analyzing different processes and determining the proper KPIs. To make the KPI selection process more effective, it is wise to integrate it with the company’s existing systems and production real-time monitoring tools [46,47], as presented in Figure 1.
The developed KPI selection model can be considered as a practical tool for identifying critical weaknesses and guiding improvement actions based on future development perspectives [3], aligning with Technology Readiness Levels [48]. The metric-acquiring process is iterative. Here are a number of internal and external impact factors like the qualification of the staff, the level of digitalization, software and hardware solutions utilized, and their implementation time, etc. The KPI selection/prioritization model is shown in Figure 2.
In order to identify the most critical problems in the company, in the first stage the data collection and analysis models are introduced. A cloud-based platform was developed to implement the survey. Over 70 research papers, covering management and design optimization of products and processes, are utilized for composing the initial survey. The questions are divided into 15 categories, shown in Table 1 [49].
The number of questions asked of the employees in the development process is based on the position that the specific employee occupies in the selected company. The interviewer gives each employee a separate package of questions, which covers the field where the employee has experience and competence. The 81 job positions were considered and divided into the following groups: Research and Development (R&D); Information Technology (IT); Business, Sales, and Marketing; Production; Quality; Human Resource (HR); Purchase and Logistics; and Chief executive officer (CEO) (high management). The questions were composed on the principle that they would describe different situations at a company. The questionnaire was divided into two groups: questions based on facts and questions based on situations or problems. Generally, more than 40 different scales in different answers were used [49].
The main goals of the EAM are to acquire information about the enterprise for further analysis and optimization tasks; to identify and define the weak spots in different production processes and company structure; and to indicate the important data that should be collected and the reason for collecting it (from the standpoint of identified critical points) [2]. In the first step all questions are connected to the KPIs, and because of that the right indicators that rely on the weight of the answer can be chosen in the responses. To eliminate misunderstandings and provide better effectiveness for the research, logical connections between the pairs of constructs and questions have been made: questions and KPIs were tested using a special web application [49]. The expert group of people (the expert group consists of 10 experts who have no connectivity to the study work but have enough knowledge and experience in this field) was required to do the matching of constructs with questions to be able to analyze whether different constructs can be described by the specific questions.
The pairs of the KPIs and the questions were tested in the same way, which means that each question was formulated in two different ways so that the main idea of both questions is the same. This process could help to eliminate the answers which were not understandable for employees. Parallel to the previous work, the KPIs were divided into the following three groups [49]: direct KPIs—obvious/direct relation to the responses; indirect KPIs—connection with more than one question; and suggested KPIs—the management based on the questions/situations.
The second step, data collection, is realized herein using a cloud server. This allows for the reduction in time for acquiring questions and simplifies the data processing. The database was integrated from one side with the Production Monitoring System (PMS) to be able to obtain real-time information about the production processes and from the other side with the Product Lifecycle Management (PLM) and Enterprise Resource Planning (ERP) systems to acquire the data of the whole lifecycle of the product [40]. Sensors are installed on the equipment to measure different data depending on the process, but in our case study the measured data are vibration, temperature, and voltage consumption, which in the turning process are used to predict the condition and lifetime of the working tool [50]. The main advantage of this process is to analyze the KPIs, e.g., the Overall Equipment Efficiency (OEE).
The third step is data analysis, where answers to duplicated questions are analyzed and grouped depending on the number of similar questions and their answers to simplify the Cronbach alpha analysis. The index of significance was applied with the 6-point scale to define the impact of the answer on the described situation [3,51]. Calculating the Cronbach alpha, the consistency test was performed.
Before entering the final step, the KPIs were selected for the study. The used approach was similar to that described in the optimization of the EAM process (the grouping process was performed based on the expert group decisions and on the following outlier methods: modified Z-score, Turkey’s method, and adjusted boxplot).
The selection of the evaluation criteria depends on different factors, like process-specific features of the company. Because of that, the following SMARTER criteria factors were selected based on the literature [52]:
  • Specific: Detailed, clear, and specific goal;
  • Measurable: Measurable target, process, or KPI;
  • Achievable: Right level objectives and achievable KPI value;
  • Relevant: Relevance to the role and main course of the team or individual person;
  • Time-specific: Time frames for work or tasks;
  • Explainable or Evaluated: The KPIs have been measured without understanding the reason for measuring. Everyone who is involved in the process should be aware of the proper goals and tasks;
  • Relative or Reviewed: Relative and implemented KPIs, even if the company and volumes are growing.

3. Methodology

The methodology proposed is based on data analysis and optimization, utilizing SMARTER criteria, the prioritization of criteria using fuzzy AHP, and the prioritization of KPIs using the fuzzy TOPSIS method. First, the SMARTER criteria and fuzzy AHP are applied in order to determine the weights of the criteria [53]. Next, the fuzzy TOPSIS is utilized to derive a fuzzy decision matrix and the distances from fuzzy PIS and NIS. Finally, the KPIs are ranked based on the values of the similarities to an ideal solution.
The procedure proposed herein is based on combining fuzzy AHP-TOPSIS approaches found in the literature [23,54] with EAM optimization.

3.1. EAM Optimization

An effective EAM has been developed, which helps to perform analysis in a reasonable time frame without a remarkable reduction in quality. In the first step a thorough set of questions and KPIs was composed, and in the next step this set was limited to bounds, allowing resource-effective analysis. The optimization problem considered can be formulated as follows [55]:
Min   R i subjected to K P I K P I ,   questions     questions   ,   P I > P I ,
where R i     stands for resources (total time for analysis, working hours for completing the questionnaire, etc.), and K P I * and questions * are estimated upper limits for the number of KPIs and questions, respectively. In order to keep the model adequate, the information related to performance P I should exceed the predefined value P I . The basic steps of the KPI selection/optimization procedure can be outlined as follows:
  • Composing initial questionnaire and KPIs;
  • Reducing questions and KPIs by utilizing expert groups;
  • Reducing questions and KPIs by utilizing outlier methods;
  • Estimating the final set of KPIs and questions.
The last three tasks can be implemented iteratively if the number of questions or KPIs is not small enough i.e., K P I > K P I or questions > questions *.
Note that contrary to the standard approach, in the case of the posed optimization problem the initial solution selected is consciously infeasible. The first two constraints of Equation (1) are not satisfied due to the thoroughgoing set of questions and KPIs considered as candidates for the final set.
To reduce the time for completing the survey by investigating companies and concentrating more on production and its efficiency, optimization of the EAM was required. The first stage is the raw phase, and the initial data were taken from the previous study [3,51]. The next step, raw phase 1.1, was established. A new expert group was formed, and only questions with KPIs connected to the production were selected. As a result, 87 questions and 40 KPIs were selected. In the ranking stage, a new expert group of 10 people was employed (at least 5 years of experience in this research field or in an enterprise), and the importance of the questions on the 1-to-10-point scale was evaluated. The following was 10 points—the question is very important from the standpoint of production—and the following was 1 point—the question cannot provide the necessary information for productivity and efficiency evaluation. The average rank was calculated for each question, and the same process was applied to the group of 40 KPIs. The results of optimized phase I are shown in Table 2.
During the ranking phase, the ranked questions received from the experts may contain outliers that have a different impact on the dataset when compared with others. The outliers may have a critical impact on the data analysis. The goal was to optimize the questions by eliminating “faulty” answers from the total range set.
Four different and simple outlier detection methods, standard deviation method, modified Z-score method, Tukey’s method, and adjusted boxplot, were applied to the questions and ranked by the experts (a detailed description of these methods is omitted herein for conciseness’ sake, see details in [3,51]). The next step was the correlation of the weight average. After the ranking phase and optimization, the total number of questions was reduced from 87 to 40 and KPIs from 40 to 14.
The standard deviation shows that the answers from Expert 3 cannot be considered. The modified Z-score also shows that the results from Expert 3 cannot be considered. Similarly, Tukey’s method and the adjusted boxplot show that Expert 3 is an outlier. In the final phase of data optimization, the questions selected as outliers in the ranking phase were introduced to the expert group to make sure that the questions eliminated were unnecessary. The weights were applied to the questions, and the average values of each were calculated. The questions that received more than 6 points out of 10 were considered final data. According to these results, the final amounts of 61 questions and 13 KPIs were established.

3.2. Fuzzy Numbers

The fuzzy set theory was developed by Zadeh and has become an important methodology in pair-wise comparisons. The fuzzy number can be defined as a triple M = l ,     m ,     u where its membership function is defined as follows [56]:
μ M x = x m l l m l ,     x   l ,     m x m u u m u ,     x m ,     u 0 ,                               o t h e r w i s e ,
where l     m     u , l and u are lower and upper values, and m is the middle value of M . When all three numbers are equal l = m = u then we are dealing with non-fuzzy numbers. The main operations for two triangular numbers were described in [54] as follows:
M 1     M 2 = l 1 +   l 2 ,     m 1 +   m 2 ,     u 1 +   u 2 , M 1       M 2   l 1 l 2 ,     m 1 m 2 ,     u 1 u 2 , M 1     1 u 1 ,   1 m 1 ,   1 l 1 .

3.3. Criteria Prioritization Using Fuzzy AHP

For the pair-wise comparison of the criteria, the linguistic, crisp AHP scale and triangular fuzzy scale variables are introduced (see Table 3).
For the evaluation of the criteria, a decision-making team should be formed. Herein, three academic and two industry experts were involved. The expert group has over 5 years of experience in the field of production and process optimization. The pair-wise comparison of the criteria is performed commonly in terms of the linguistic “grades” introduced in Table 3.
Next, the pair-wise comparison matrices of the individual decision-makers are aggregated by using the geometric mean as follows [54]:
r i j   = k = 1 K c i j k 1 K ,
where c i j k is the fuzzy comparison value of criteria i to criteria j in the form of triangular fuzzy numbers given by the k -th decision-maker. The number of decision-makers is denoted by K .
Based on the aggregated pair-wise comparison matrix, the aggregated fuzzy comparison values r i = l i ,   m i ,   u i of criteria i can be computed as follows:
r i = j = 1 N r i j 1 N ,
where N stands for the number of criteria (is equal to seven for SMARTER criteria). The fuzzy weight of the attribute i can be calculated as the normalized value of r i as follows:
w i = l i , m i , u i = r i r 1 r 2 r N 1 , i = 1 , , N .
The triangular fuzzy weights can be defuzzified to a crisp number by applying the center of area method (an alternate approach, like graded mean integration, etc., is available) [57]. As a result, the crisp weight w i C r i s p can be determined for each criterion i as follows:
w i C r i s p = l i + u i l i + m i l i 3 ,
The normalized crisp weights read as follows:
w i C r i s p N o r m a l i z e d = w i C r i s p i = 1 N w i C r i s p 1 ,
Finally, the criteria can be ranked based on the values of the normalized crisp weights. The consistency of experts as well as the consistency of the overall hierarchy should be checked. Herein, for this reason, Saaty’s classical consistency ratio process is applied as follows [54]:
C o n s i s t e n c y   R a t i o = C I C R = 0.025 1.32 = 0.019 .
where
C I = λ m a x N N 1 = 7.1512     7 6 = 0.025 .
where λ m a x is the largest eigenvalue of the aggregated decision matrix r i j . Obviously, the value of the consistency ratio obtained, 0.019, falls well below the permissible threshold of 0.1

3.4. KPI Prioritization Using Fuzzy TOPSIS, RADAR, RADAR2, and Fuzzy RADAR

In the following, five algorithms are implemented for KPI prioritization (for the fuzzy TOPSIS method, two algorithms with different normalization rules are applied). The fuzzy TOPSIS, RADAR, and RADAR2 methods are found in the literature; the fuzzy RADAR method approach is introduced herein as an extension of the RADAR method. In Table 4, the crisp scale variables (RADAR and RADAR2) and the linguistic scale variables (fuzzy TOPSIS and fuzzy RADAR) for the estimation of the KPIs are introduced.
The expert group used for the estimation of the criteria was also employed for the estimation of KPIs. Each expert performed the evaluation of the KPIs with respect to the criteria in terms of the linguistic variables given in Table 5.
The decision-maker’s results are converted into fuzzy triangular numbers and aggregated by using the arithmetic mean as follows:
x i j = 1 K k = 1 K x i j k ,
where K is the number of decision-makers and x i j k stands for the rating of KPI i to criterion j given by the k -th decision-maker.

3.4.1. KPI Prioritization Using Fuzzy TOPSIS

Let us start the KPI prioritization methods descriptions with one of the most popular methods, fuzzy TOPSIS. First, the normalization of the fuzzy decision matrix was performed. Herein, all SMARTER criteria are considered to be benefit type (higher value is better). The following approaches are available in the literature for normalization rules [23,54]:
Y i j = l i j u m a x , m i j u m a x u i j u m a x ,   with   u m a x = max ij u i j ,
Y i j = l i j u j m a x , m i j u j m a x u i j u j m a x ,   with   u j m a x = max i u i j ,
Y i j   = l i j i = 1 M l i j 2 , m i j i = 1 M m i j 2 , u i j i = 1 M u i j 2 .
where M is the number of KPIs and u j m a x and u m a x stand for the maximum values through criteria j and the entire decision matrix, respectively. The first two normalization rules represent linear transformations, and the third rule corresponds to the vector norm. Use of Equation (10) is not justified in cases where the values corresponding to different criteria differ substantially. Herein the fuzzy TOPSIS algorithm is implemented corresponding to normalization rules (13) (fuzzy TOPSIS_Linear) and (14) (fuzzy TOPSIS_Vector), respectively. Note that in the normalization rule (14) formulas corresponding to the benefit criteria are considered (herein, all criteria are assumed to be benefit type).
The weights of the criteria w j , obtained by applying fuzzy AHP, are utilized to compute the weighted normalized decision matrix v i j as follows:
v i j = y i j     w j ,   i = 1 , , M ,   j = 1 , , N .
where v i j stands for elements of the weighted normalized fuzzy decision matrix, and M and N denote the number of KPIs and criteria, respectively.
In order to evaluate KPIs, the fuzzy PIS and NIS are determined, and the distances of each alternative to these points are computed. Herein, the following definitions of the PIS and NIS are employed [54]:
P I S = v 1 + , v 2 + , , v N + ,   N I S = v 1 , v 2 , , v N ,
where v j + = 1 ,   1 ,   1 and v j = 0 ,   0 ,   0 for j = 1 ,   2 , , N . The distances of each KPI from PIS and NIS are computed as follows:
d i + = j = 1 N d v i j , v j + ,   i = 1 , , M ,   d i = j = 1 N d v i j , v j ,   i = 1 , , M .
where d x , y denotes the distance between two fuzzy numbers and is given as follows:
d x , y = 1 3 l x l y 2 + m x m y 2 + u x u y 2
The similarities to an ideal solution can be computed as follows:
C C i = d i d i + + d i ,   i = 1 , , M .
Final rankings of KPIs can be assigned based on the values of the similarity coefficients determined from Equation (19).

3.4.2. KPI Prioritization Using RADAR and RADAR2

The RADAR and RADAR2 methods are one of the newest MCDM methods introduced in 2024 in [37]. According to this new approach, the ranking of alternatives is based on distance and range [37,38,39].
Let us assume that pair-wise analysis of the alternatives and criteria is performed and the decision matrix x i j is composed of decision-makers. It is also assumed that the aggregation of the individual decision matrices is performed. Most of the MCDM methods, including fuzzy TOPSIS, considered above continue with the treatment of the aggregated decision matrix by applying normalization, weighting, etc. The RADAR and RADAR2 methods used a principally different approach. Based on the aggregated decision matrix, two new matrices are introduced: the maximum proportion matrix and the minimum proportion matrix. According to the RADAR method, the maximum proportion matrix is defined as follows:
α i j = max i x i j x i j max i x i j x i j   +   x i j min i x i j ,   i = 1 , , M ,   j = 1 , , N ,
and the minimum proportion matrix as follows [37]:
β i j = x i j min i x i j max i x i j x i j   +   x i j min i x i j ,   i = 1 , , M ,   j = 1 , , N .
Note that the formulas corresponding to the cost criteria are omitted for the sake of conciseness (all criteria used are assumed to be benefit type).
According to the RADAR2 method, the maximum proportion matrix is defined as follows [38]:
α i j = max i x i j x i j max i x i j x i j   +   x i j min i x i j ,   i = 1 , , M ,   j = 1 , , N ,
and the minimum proportion matrix as follows [37]:
β i j = x ij min i x i j max i x i j x i j   +   x i j min i x i j ,   i = 1 , , M ,   j = 1 , , N .
The relative relationship can be computed for both methods (RADAR, RADAR2) as follows:
R R i j = α i j β i j   +   α i j β i j ,   i = 1 , , M ,   j = 1 , , N ,
and the weighted relative relationship matrix as follows [39]:
W R R i j   = R R i j ω j ,   i = 1 , , M ,   j = 1 , , N .
For the final ranking, the aggregated ranking index is computed as follows:
R I i = min i j = 1 N W R R i j = 1 N W R R i ,   i = 1 , , M .
The last equations, Equations (24) and (25), hold good for RADAR and RADAR2 methods.

3.4.3. KPI Prioritization Using Fuzzy RADAR

In the current study, the RADAR method for KPI prioritization is extended to the fuzzy RADAR method (an approach similar to [37] with different rules for computing relative relationship and weighted relative relationship). The incorporation of fuzzy set theory and linguistic variables facilitates the use of interval estimates, thereby simplifying the judgment process for decision-makers. The decision matrix x i j is obtained by converting the linguistic grades to triangular fuzzy numbers according to Table 4, as follows:
x i j = l i j , m i j , u i j ,   i = 1 , , M ,   j = 1 , , N .
For the fuzzy RADAR method, the maximum proportion matrix can be introduced as follows:
α i j = max i l i j u i j max i u i j l i j   +   u i j min i l i j , max i m i j m i j max i m i j m i j   + m i j   min i m i j , max i u i j l i j max i l i j u i j   +   l i j min i u i j ,   i = 1 , , M ,   j = 1 , , N ,
and the minimum proportion matrix as follows:
β i j = l i j min i u i j max i u i j l i j   +   u i j min i l i j , m i j min i m i j max i m i j m i j   +   m i j min i m i j , u i j min i l i j max i l i j u i j   +   l i j min i u i j ,   i = 1 , , M ,   j = 1 , , N .
The remaining characteristics of the fuzzy RADAR method, R R i j , W R R i j and R I I , can be computed based on Equations (24)–(26), taking account that j = 1 , , 3 N . Also, the values of the aggregated ranking index R I I should be defuzzified to implement it in the final ranking.

4. Results

The results concerning EAM optimization are introduced in Section 2; herein, the focus is on the results of fuzzy AHP, fuzzy TOPSIS, RADAR, and RADAR2, and fuzzy RADAR methods.

4.1. Criteria Prioritization Results Using Fuzzy AHP

Table 5 shows the pair-wise comparison between SMARTER criteria as a sample.
After the consistency check, the linguistic values in the pair-wise comparison matrix are transformed to the corresponding TFN according to Table 3. The values of the r i j = l i j ,   m i j ,     u i j , computed according to Equation (4), are presented in Table 6.
The fuzzy weights, crisp weights, and normalized crisp weights computed using Equations (6) and (7) are given in Table 7.
In the last column of Table 7, the rank of the criteria is given based on the value of the normalized crisp weight. The results obtained allow us to conclude that the most valuable metrics for the considered problem are relevant, measurable, and explainable.

4.2. KPI Prioritization Using the Fuzzy TOPSIS Method

The sample of the evaluation results of one decision-maker is given in Table 8, where KPIs are evaluated against criteria.
The aggregated fuzzy triangular numbers x i j = l i j ,     m i j ,   u i j , representing the pair-wise comparison matrix criteria versus KPIs, are computed using Equation (11). Employing linear, criteria-wise normalization rule (13) and Equation (15), the weighted normalized fuzzy decision matrix can be evaluated as presented in Table 9.
The distances from PIS and NIS, the similarity coefficients, and the rankings of the KPIs obtained by utilizing the linear, criteria-wise normalization rule (13) are presented in Table 10.
As can be observed from Table 10, in the case of the considered problem, the fuzzy AHP and fuzzy TOPSIS method-based solution leads to the results where the most important impact factors can be outlined as OEM (overall equipment effectiveness), product price/quality ratio, and inventory turnover.
The final ranking of KPIs obtained by utilizing the vector norm-based nonlinear normalization rule (14) is given in Table 11.
It can be observed from Table 10 and Table 11 that in the case of both normalization rules (linear criteria-wise (13) and nonlinear vector norm-based (14)), the same final ranking is obtained.

4.3. KPI Prioritization Using the RADAR, RADA2, and Fuzzy RADAR Method

Based on theoretical formulas, given in Section 3.4.2. for the RADAR and RADAR2 methods, and in Section 3.4.3. for the fuzzy RADAR method, the aggregated ranking indexes RI and final rankings are presented in Table 12 as follows.
It can be observed from Table 10, Table 11 and Table 12 that the rankings of the KPIs obtained by applying the TOPSIS and RADAR methods are similar. Detailed analysis of the rankings is given in the next section.

4.4. Comparison and Analysis of the KPI Rankings

The rankings of the KPIs obtained by applying the five algorithms considered are summarized in Table 13.
It can be observed from Table 13 that in the case of all five algorithms the most important impact factors can be outlined as OEM (overall equipment effectiveness) and product price/quality ratio (in the case of four methods, inventory turnover is third). Also, the Employees’ efficiency has the least impact in the case of all five algorithms. In order to obtain a more precise picture of the similarities of the KPI rankings obtained, the WS coefficient is computed as follows [37]:
W S = 1 i = 1 N 2 R x i R x i R y i max 1 R x i , N R x i ,  
where R x i and R y i stand for the average rank position for alternative i and N is the total number of alternatives. In Table 14 the WS coefficient values are given for all available pairs of the five algorithms.
It should be mentioned that only the upper part of Table 14 is filled since the WS coefficient matrix is symmetric. As mentioned above, the KPI rankings corresponding to the two fuzzy TOPSIS algorithms coincide. In the case where WS coefficient values exceed 0.808, the similarity in rankings is considered excellent [37]. Obviously, all computed WS values exceed 0.808, and similarity can be considered very strong between all rankings obtained with the five algorithms considered. Thus, all results obtained are in good agreement.
In Table 15, the current TOPSIS (normalization rule 13) ranking is compared with rankings corresponding to maximal and minimal values of the expert estimates for the most influential KPI9.
It can be observed from Table 15 that even using maximal values of the expert estimates for the most influential KPI, KPI9, leads to marginal changes in the rankings, but using minimal values for the expert estimates received for KPI9 has remarkable changes. However, the similarity index value corresponding to actual and minimal ranking values is equal to 0.894, still exceeding the limit value of 0.808, meaning that the similarity between these rankings is strong [37].

5. Conclusions

An integrated EAM and fuzzy AHP-TOPSIS/RADAR methods-based approach for the prioritization of key performance indicators is developed.
An approach introduced for the selection and ranking of KPIs is implemented on a sample of EU private companies (SMEs) conducting business in the EU market. Thus, the most direct practical result is a list of ranked KPIs for a particular company.
A cloud-based platform was developed to implement the survey. This platform can be utilized for data collection and analysis for companies of various sizes, fields of activity, etc. The procedure, developed for KPI selection, is applicable to similar SMEs without remarkable changes.
The research contribution is as follows:
  • Development of an integrated model for KPI prioritization (EAM and MCDM).
  • Development of a fuzzy RADAR method approach for KPI prioritization.
  • Implementation of two TOPSIS and three RADAR algorithms for KPI prioritization, performing similarity analysis.
The societal contribution is as follows:
  • The cloud-based platform developed enables the democratization of access to sophisticated performance management tools for resource-constrained SMEs, representing a significant achievement that deserves explicit discussion.
  • The experience gained from this research suggests that it is beneficial to make joint consensual decisions in collaboration between academia and industry.
Limitations of the study algorithms and models may need certain tuning/adaptation to consider the features of a particular company.
In future studies, refinement of the fuzzy RADAR method and development of the fuzzy RADAR method are foreseen, as well as the application and validation of these methods.
In addition, to improve operational efficiency the developed KPI selection methodology contributes to sustainability by enabling companies to identify and prioritize indicators that align with long-term environmental and socio-economic goals. The inclusion of SMARTER criteria, combined with fuzzy AHP and TOPSIS, allows SMEs to systematically assess which performance metrics best support sustainable production, resource optimization, and continuous improvement. This approach reinforces the role of KPI-based decision-making in the broader context of sustainable industrial development.

Author Contributions

Conceptualization, K.K. and S.K.; methodology, S.K., M.M. and K.K.; software, S.K. and T.R.; validation, K.K., M.M. and S.K.; formal analysis, S.K.; investigation, S.K. and T.R.; resources, S.K.; data curation, S.K.; writing—original draft preparation, K.K. and M.M.; writing—review and editing, S.K.; visualization, S.K. and T.R.; supervision, K.K.; project administration, K.K.; funding acquisition, K.K. All authors have read and agreed to the published version of the manuscript.

Funding

This research was funded by AI & Robotics Estonia—EDIH, project number 101083677; Master of Science in Smart, Secure and Interconnected Systems (MERIT)—Development of a new pan European educational ecosystem for training of digital specialists (Co-funded by the European Union under grant agreement No. 101083531); the Estonian Research Core Infrastructures Roadmap project TT2 Smart Industry Centre (SmartIC); and the project nr ÕÜF8 “increasing the knowledge intensity of Ida-Viru entrepreneurship”, co-funded by the European Union.

Institutional Review Board Statement

Not applicable.

Informed Consent Statement

Not applicable.

Data Availability Statement

Acknowledgments

The authors have reviewed and edited the output and take full responsibility for the content of this publication.

Conflicts of Interest

The authors declare no conflicts of interest.

Abbreviations

The following abbreviations are used in this manuscript:
KPIKey performance indicator
EAMEnterprise analysis model
AHPAnalytical hierarchy process
TOPSISTechnique for order preference by similarity to ideal solution
SMESmall and medium-sized enterprise
MLMachine learning
ECEvolutionary computing
EAEvolutionary algorithm
TFNTriangular fuzzy numbers
PISPositive ideal solution
NISNegative ideal solution
MCDMMulti-criteria decision-making
RFRandom forest
SMARTERSimple multi-attribute rating technique exploiting ranks
WPWork package
CRMCustomer relationship management
OEEOverall equipment efficiency
PMSProduction monitoring system
PLMProduct lifecycle management
NPINew product introduction
R&DResearch and development
ITInformation technology
HRHuman resource
CEOChief executive officer
EPREnterprise resource planning
OEM Overall equipment effectiveness

References

  1. Moktadir, M.A.; Dwivedi, A.; Rahman, A.; Sultana, R.; Madaan, J. An investigation of key performance indicators for operational excellence towards sustainability in the leather products industry. Bus. Strategy Environ. 2020, 29, 3331–3351. [Google Scholar] [CrossRef]
  2. Kaganski, S.; Majak, J.; Karjust, K. Fuzzy AHP as a tool for prioritization of key performance indicators. Procedia CIRP 2018, 72, 1227–1232. [Google Scholar] [CrossRef]
  3. Kaganski, S.; Majak, J.; Karjust, K.; Toompalu, S. Implementation of key performance indicators selection model as part of the Enterprise Analysis Model. Procedia CIRP 2017, 63, 283–288. [Google Scholar] [CrossRef]
  4. Souifia, A.; Boulangerc, Z.C.; Zolghadria, M.; Barkallahb, M.; Haddar, M. Uncertainty of key performance indicators for Industry 4.0: A methodology based on the theory of belief functions. Comput. Ind. 2022, 140, 103666. [Google Scholar] [CrossRef]
  5. Gautam, A.; Khan, Z.A.; Gani, A.; Asjad, M. Identification, ranking and prioritization of Key Performance Indicators for evaluating greenness of manufactured products. Green Technol. Sustain. 2025, 3, 100114. [Google Scholar] [CrossRef]
  6. Villazón, C.C.; Pinilla, L.S.; Olaso, J.R.O.; Gandarias, N.T. Identification of key performance indicators in project-based organisations through the lean approach. Sustainability 2020, 12, 5977. [Google Scholar] [CrossRef]
  7. Sastoque-Pinilla, L.; Artelt, S.; Burimova, A.; Lopez de Lacalle, N.; Toledo-Gandarias, N. Project success criteria evaluation for a project-based organization and its stakeholders—A q-methodology approach. Appl. Sci. 2022, 12, 11090. [Google Scholar] [CrossRef]
  8. Saaty, T. The Analytical Hierarchy Process: Planning, Priority Setting, Resource Allocation; McGraw-Hill: New York, NY, USA, 1980. [Google Scholar]
  9. Saaty, T. Rank generation, preservation and reversal in the analytic hierarchy process. Decis. Sci. 1987, 18, 157–177. [Google Scholar] [CrossRef]
  10. Chai, J.; Liu, J.N.K.; Ngai, E.W.T. Application of Decision-making Techniques in Supplier Selection: A Systematic Review of Literature. Expert Syst. Appl. 2013, 40, 3872–3885. [Google Scholar] [CrossRef]
  11. Ishizaka, A.; Labib, A. Review of the Main Developments in the Analytic Hierarchy Process. Expert Syst. Appl. 2011, 38, 14336–14345. [Google Scholar] [CrossRef]
  12. Sipahi, S.; Timor, M. The Analytic Hierarchy Process and Analytic Network Process: An Overview of Applications. Manag. Decis. 2010, 48, 775–808. [Google Scholar] [CrossRef]
  13. Emrouznejad, A.; Marra, M. The state of the art development of AHP (1979–2017): A literature review with a social network analysis. Int. J. Prod. Res. 2017, 55, 6653–6675. [Google Scholar] [CrossRef]
  14. Desnica, E.; Miroslav, V.; Nikolić, M. AHP method in the function of adequate equipment choice for ELV detoxification in Serbia and EU. Appl. Eng. Lett. 2016, 1, 114–121. [Google Scholar]
  15. Andreolli, F.; Bragolusi, P.; D’Alpaos, C.; Faleschini, F.; Zanini, M.A. An AHP model for multiple-criteria prioritization of seismic retrofit solutions in gravity-designed industrial buildings. J. Build. Eng. 2022, 45, 103493. [Google Scholar] [CrossRef]
  16. Rajput, V.; Sahu, K.N.; Agrawal, A. Optimization of waste kota stone dust filled epoxy composite by analytical hierarchy process (AHP) approach. Mater. Today 2021, 50, 1708–1712. [Google Scholar] [CrossRef]
  17. Zadeh, L.A. Fuzzy sets. Inf. Control 1965, 8, 338–353. [Google Scholar] [CrossRef]
  18. Laarhoven, P.J.M.; Pedrycz, W. A fuzzy extension of Saaty’s priority theory. Fuzzy Sets Syst. 1983, 11, 229–241. [Google Scholar] [CrossRef]
  19. Ilbahar, E.; Kahraman, C.; Cebi, S. Risk assessment of renewable energy investments: A modified failure mode and effect analysis based on prospect theory and intuitionistic fuzzy AHP. Energy 2022, 239, 121907. [Google Scholar] [CrossRef]
  20. Wang, Y.; Xu, L.; Solangi, Y.A. Strategic renewable energy resources selection for Pakistan: Based on SWOT-fuzzy AHP approach. Sustain. Cities Soc. 2020, 52, 101861. [Google Scholar] [CrossRef]
  21. Liu, Y.; Eckert, C.M.; Earl, C. A review of fuzzy AHP methods for decision-making with subjective judgements. Expert Syst. Appl. 2020, 161, 113738. [Google Scholar] [CrossRef]
  22. Hwang, C.L.; Yoon, K. Methods for multiple attribute decision making. In Multiple Attribute Decision Making, Lecture Notes in Economics and Mathematical Systems; SAGE Publications, Inc.: Los Angeles, CA, USA, 1981; Volume 186, pp. 58–191. [Google Scholar]
  23. Vinodh, S.; Prasanna, M.; Hari Prakash, N. Integrated Fuzzy AHP-TOPSIS for selecting the best plastic recycling method: A case study. Appl. Math. Model. 2014, 38, 4662–4672. [Google Scholar] [CrossRef]
  24. Alkahtani, M.; Al-Ahmari, A.; Kaid, H.; Sonboa, M. Comparison and evaluation of multi-criteria supplier selection approaches: A case study. Adv. Mech. Eng. 2019, 11, 1–19. [Google Scholar] [CrossRef]
  25. Avikal, S.; Singh, A.K.; Kumar, K.C.N.; Badhotiya, G.K. A fuzzy-AHP and TOPSIS based approach for selection of metal matrix composite used in design and structural applications. Mater. Today 2021, 4, 11050–11053. [Google Scholar] [CrossRef]
  26. Lin, M.-C.; Wang, C.-C.; Chen, M.-S.; Chang, C.A. Using AHP and TOPSIS approaches in customer-driven product design process. Comput. Ind. 2008, 59, 17–31. [Google Scholar] [CrossRef]
  27. Ozdogan, S.; Yildizbasi, A.; Rouyendegh, B.D. Performance evaluation of municipal services with fuzzy multi-criteria decision making approaches: A case study from Turkey. SN Appl. Sci. 2020, 2, 1056. [Google Scholar] [CrossRef]
  28. Bakioglu, G.; Atahan, A.O. AHP integrated TOPSIS and VIKOR methods with Pythagorean fuzzy sets to prioritize risks in self-driving vehicles. Appl. Soft Comput. J. 2021, 99, 106948. [Google Scholar] [CrossRef]
  29. Raja, S.; Rusho, A.; Praveenkumar, V.; Rusho, M.A.; Yishak, S. Optimizing additive manufacturing parameters for graphene-reinforced PETG impeller production: A fuzzy AHP-TOPSIS approach. Results Eng. 2024, 24, 103018. [Google Scholar] [CrossRef]
  30. Wang, K.; Hong, Y.; Li, C. Fuzzy Risk Assessment Method for Airborne Network Security Based on AHP-TOPSIS, Computers. Mater. Contin. 2024, 80, 1123–1142. [Google Scholar] [CrossRef]
  31. Zimmermann, E.; Mezgebe, T.T.; Bril el Haouzi, H.; Thomas, P.; Pannequin, R.; Noyel, M. Multicriteria decision-making method for scheduling problem based on smart batches and their quality prediction capability. Comput. Ind. 2021, 133, 103549. [Google Scholar] [CrossRef]
  32. He, Z.; Tran, K.P.; Thomassey, S.; Zeng, X.; Xu, J.; Yi, C. A deep reinforcement learning based multi-criteria decision support system for optimizing textile chemical process. Comput. Ind. 2021, 125, 103373. [Google Scholar] [CrossRef]
  33. Büyüközkan, G.; Çifçi, G. A novel fuzzy multi-criteria decision framework for sustainable supplier selection with incomplete information. Comput. Ind. 2011, 62, 164–174. [Google Scholar] [CrossRef]
  34. Vasanta Lakshmi, K.; Udaya Kumara, K.N. A novel randomized weighted fuzzy AHP by using modified normalization with the TOPSIS for optimal stock portfolio selection model integrated with an effective sensitive analysis. Expert Syst. Appl. 2024, 243, 122770. [Google Scholar] [CrossRef]
  35. Alhassan, H.; Peleato, N.; Sadiq, R. Mercury risk reduction in artisanal and small-scale gold mining: A fuzzy AHP-Fuzzy TOPSIS hybrid analysis. Resour. Policy 2023, 83, 103744. [Google Scholar] [CrossRef]
  36. Paat, A.; Majak, J.; Karu, V.; Hitch, M. Fuzzy analytical hierarchy process based environmental, social and governance risks assessment for the future phosphorite mining in Estonia. Extr. Ind. Soc. 2024, 17, 101438. [Google Scholar] [CrossRef]
  37. Komatina, N. A compromise-based MADM approach for prioritizing failures: Integrating the RADAR method within the FMEA framework. J. Sist. Dan Manaj. Ind. 2024, 8, 72–88. [Google Scholar] [CrossRef]
  38. Komatina, N. A Novel BWM-RADAR Approach for Multi-Attribute Selection of Equipment in the Automotive Industry. Spectr. Mech. Eng. Oper. Res. 2025, 2, 104–120. [Google Scholar] [CrossRef]
  39. Komatina, N.; Marinkovic, D.; Babič, M. Fundamental Characteristics and Applicability of the RADAR Method: Proof of Ranking Consistency. Spectr. Oper. Res. 2026, 3, 63–80. [Google Scholar] [CrossRef]
  40. Komatina, N.; Marinkovic, D.; Tadic, D.; Pamucar, D. Advancing PFMEA Decision-Making: FRADAR Based Prioritization of Failure Modes Using AP, RPN, and Multi-Attribute Assessment in the Automotive Industry. Teh. Glas./Tech. J. 2025, 19, 442–451. [Google Scholar] [CrossRef]
  41. Fioretto, S.; Masciari, E.; Napolitano, E.V. Machine Learning for KPI Development in Public Administration, Proceedings of the 13th International Conference on Data Science. In Proceedings of the 13th International Conference on Data Science, Technology and Applications (DATA 2024), Dijon, France, 9–11 July 2024; pp. 522–527. [Google Scholar]
  42. Skiöld, D.; Arora, S. Investigating the Use of Machine Learning in Key Performance Indicator Prediction for User Experience of Connectivity. Master’s Thesis, Malmö University, Malmö, Sweden, 2022; pp. 1–44. [Google Scholar]
  43. Ammouriova, M.; Tsertsvadze, V.; Juan, A.A.; Fernandez, T.; Kapetas, L. On the Use of Machine Learning and Key Performance Indicators for Urban Planning and Design. Appl. Sci. 2024, 14, 9501. [Google Scholar] [CrossRef]
  44. Stefanovic, M.Z.; Nestic, S.; Djordjevic, A.; Djurovic, D.; Macuzic, I.; Tadić, D.; Gacic, M. An assessment of maintenance performance indicators using the fuzzy sets approach and genetic algorithms. Proc. Inst. Mech. Eng. Part B 2017, 231, 15–27. [Google Scholar] [CrossRef]
  45. Plandor, D.; Landryová, L. Generating KPI sets using genetic algorithms. In Proceedings of the 13th International Carpathian Control Conference (ICCC), High Tatras, Slovakia, 28–31 May 2012; IEEE: New York, NY, USA, 2012. [Google Scholar] [CrossRef]
  46. D’Antonio, G.; Bedolla, J.S.; Genta, G.; Chiabert, P.; Pasquettaz, G. PLM-MES integration: A case-study in automotive manufacturing. IFIP Adv. Inf. Commun. Technol. 2016, 467, 780–789. [Google Scholar]
  47. Tapia, E.; Lopez-Novoa, U.; Sastoque-Pinilla, L.; López-de-Lacalle, L.N. Implementation of a scalable platform for real-time monitoring of machine tools. Comput. Ind. 2024, 155, 104065. [Google Scholar] [CrossRef]
  48. Pinilla, L.S.; Rodríguez, R.L.; Gandarias, N.T.; Lacalle, L.N.L.; Farokhad, M.R. TRLs 5–7 advanced manufacturing centres, practical model to boost technology transfer in manufacturing. Sustainability 2019, 11, 4890. [Google Scholar] [CrossRef]
  49. Paavel, M.; Kaganski, S.; Karjust, K.; Lemmik, R.; Eiskop, T. Analysis model development to simplify PLM implementation. In Proceedings of the 10th International DAAAM Baltic Conference, Tallinn, Estonia, 12–13 May 2015; Tallinn University of Technology: Tallinn, Estonia, 2015; pp. 69–74. [Google Scholar]
  50. Eiskop, T.; Snatkin, A.; Karjust, K. Production monitoring system with predictive functionality. J. Eng. Sci. Technol. 2017, 12, 2410–2425. [Google Scholar]
  51. Kaganski, S. Development and Implementation of the Key Performance Indicator Selection Model for SMEs. Ph.D. Thesis, Tallinn University of Technology, Tallinn, Estonia, 2018; pp. 1–99. [Google Scholar]
  52. Graham, Y. FT Essential Guide to Leading Your Team: How to Set Goals, Measure Performance and Reward Talent; FT Press: Upper Saddle River, NJ, USA, 2012. [Google Scholar]
  53. Shahin, A.; Ali Mahmod, M. Prioritization of key performance indicators. An integration of analytical hierarchy process and goal setting. Int. J. Product. Perform. Manag. 2007, 56, 226–240. [Google Scholar] [CrossRef]
  54. Polat, G.; Eray, E.; Bi ngol, B.N. An Integrated Fuzzy MCGDM for Supplier Selection Problem. J. Civ. Eng. Manag. 2017, 23, 926–942. [Google Scholar] [CrossRef]
  55. Kaganski, S.; Eerme, M.; Tungel, E. Optimization of enterprise analysis model for KPI selection. Proc. Est. Acad. Sci. 2019, 68, 371–375. [Google Scholar] [CrossRef]
  56. Chang, D. Applications of the extent analysis method on fuzzy AHP. Eur. J. Oper. Res. 1996, 95, 649–655. [Google Scholar] [CrossRef]
  57. Kwong, C.K.; Bai, H. Determining the importance weights for the customer requirements in QFD using a fuzzy AHP with an extent analysis approach. IIE Trans. 2003, 35, 619–626. [Google Scholar] [CrossRef]
Figure 1. Information movement in manufacturing systems and integration with the KPI selection model.
Sustainability 17 06374 g001
Figure 2. KPI selection/prioritization model.
Sustainability 17 06374 g002
Table 1. Construct a deviation over the questions.
CategoryConstructsQuestions
Customer and supplier participation59
Electronic data interchange3843
Enterprise name11
Financial12
General information55
Human resource3142
Logistics814
Mission and goals712
NPI2128
Performance management511
PLM implementation1314
Production2852
Quality management815
Respondent information66
Sales management25
Total179259
Table 2. Result of the optimization after phase I.
Raw Phase 1.0Optimized Raw Phase 1.1
Questions25987
KPIs9240
Table 3. Linguistic variables for the importance of the criteria, based on [8].
The Relative Importance in Terms of Linguistic VariablesCrisp AHP ScaleFuzzy TriangularReciprocal Fuzzy
Equally preferred (EqP)11, 1, 11, 1, 1
Equally to moderately preferred (Eq-MP)21, 2, 31/3, 1/2, 1
Moderately preferred (MP)32, 3, 41/4, 1/3, 1/2
Moderately to strongly preferred (M-SP)43, 4, 51/5, 1/4, 1/3
Strongly preferred (SP)54, 5, 61/6, 1/5, 1/4
Strongly to very strongly preferred (S-VSP)65, 6, 71/7, 1/6, 1/5
Very strongly preferred (VSP)76, 7, 81/8, 1/7, 1/6
Very strongly to extremely preferred (VS-ExP)87, 8, 91/9, 1/8, 1/7
Extremely preferred (ExP)98, 9, 91/9, 1/9, 1/8
Table 4. Linguistic variables for the importance of the KPIs with respect to the criteria.
The Relative Importance of the KPIs with Respect to the Criteria in Terms of Linguistic VariablesCrisp AHP ScaleFuzzy TriangularReciprocal Fuzzy
Very weak (VW)11, 1, 11, 1, 1
Very weak to weak (VW-W)21, 2, 31/3, 1/2, 1
Weak (W)32, 3, 41/4, 1/3, 1/2
Weak to average (W-A)43, 4, 51/5, 1/4, 1/3
Average (A)54, 5, 61/6, 1/5, 1/4
Average to strong (A-S)65, 6, 71/7, 1/6, 1/5
Strong (S)76, 7, 81/8, 1/7, 1/6
Strong to very strong (S-VS)87, 8, 91/9, 1/8, 1/7
Very strong (VS)98, 9, 91/9, 1/9, 1/8
Table 5. Example of a pair-wise comparison matrix for criteria.
SpecificMeasurableAvailableRelevantTimelyExplainableRelative
SpecificEqP1/MPMP1/MPEqPEqPSP
MeasurableMPEqPEqPEqPMPEqPM-SP
Available1/MPEqPEqPEqPEqP1/Eq-MPMP
RelevantMPEqPEqPEqPEq-MPEqPEqP
TimelyEqP1/MPEqP1/Eq-MPEqPMPEqP
ExplainableEqPEqPEq-MPEqP1/MPEqPSP
Relative1/SP1/M-SP1/MPEqPEqP1/SPEqP
Table 6. Aggregated pair-wise comparison matrix.
SpecificMeasurableAvailableRelevantTimelyExplainableRelative
Specific(1.00; 1.00; 1.00)(0.34; 0.46; 0.66)(0.64; 0.87; 1.25)(0.26; 0.35; 0.57)(0.70; 0.96; 1.30)(0.61; 0.80; 1.08)(1.43; 1.63; 1.89)
Measurable(1.52; 2.19; 2.93)(1.00; 1.00; 1.00)(0.92; 1.29; 1.64)(0.67; 0.94; 1.32)(1.52; 2.22; 2.86)(0.57; 0.71; 0.94)(2.86; 3.98; 5.04)
Available(0.80; 1.15; 1.55)(0.61; 0.77; 1.08)(1.00; 1.00; 1.00)(0.68; 0.80; 0.90)(0.80; 0.96; 1.25)(0.32; 0.41; 0.57)(2.00; 3.00; 4.00)
Relevant(1.74; 2.83; 3.87)(0.76; 1.06; 1.49)(1.11; 1.25; 1.48)(1.00; 1.00; 1.00)(1.74; 2.46; 3.10)(1.52; 1.93; 2.30)(2.35; 3.02; 3.64)
Timely(0.77; 1.05; 1.43)(0.35; 0.45; 0.66)(0.80; 1.04; 1.25)(0.26; 0.35; 0.57)(1.00; 1.00; 1.00)(0.34; 0.46; 0.66)(1.64; 2.05; 2.40)
Explainable(0.92; 1.25; 1.64)(0.74; 0.98; 1.32)(0.92; 1.29; 1.64)(0.44; 0.52; 0.66)(1.52; 2.19; 2.93)(1.00; 1.00; 1.00)(2.30; 2.95; 3.57)
Relative(0.53; 0.61; 0.70)(0.20; 0.25; 0.35)(0.25; 0.33; 0.50)(0.27; 0.33; 0.43)(0.42; 0.49; 0.61)(0.28; 0.34; 0.44)(1.00; 1.00; 1.00)
Table 8. Performance evaluations of the KPIs.
SpecificMeasurableAvailableRelevantTimelyExplainableRelative
KPI1S to VSVSVSSA to SSA to S
KPI2S to VSS to VSS to VSSA to SA to SA to S
KPI3VSSSA to SA to SA to SA
KPI4WSSA to SSAA
KPI5WS to VSSSA to SAA
KPI6V-W to WSS to VSSA to SWS
KPI7W to ASS to VSAS to VSW to AS
KPI8A to SVSVSS to VSVSAVS
KPI9AS to VSA to SA to SS to VSSS to VS
KPI10AS to VSA to SA to SS to VSSS to VS
KPI11VSVSVSSVSA to SS to VS
KPI12W to AS to VSA to SSSAA to S
KPI13WSA to SA to SSW to AA to S
Table 9. Weighted normalized fuzzy decision matrix using normalization rule (13).
SpecificMeasurableAvailableRelevantTimelyExplainableRelative
KPI1(0.05; 0.08; 0.15)(0.11; 0.19; 0.31)(0.08; 0.13; 0.21)(0.13; 0.22; 0.36)(0.04; 0.07; 0.12)(0.08; 0.13; 0.22)(0.04; 0.05; 0.09)
KPI2(0.04; 0.07; 0.14)(0.07; 0.13; 0.24)(0.06; 0.10; 0.18)(0.10; 0.17; 0.29)(0.04; 0.07; 0.12)(0.08; 0.13; 0.21)(0.04; 0.05; 0.09)
KPI3(0.07; 0.10; 0.18)(0.10; 0.18; 0.30)(0.08; 0.12; 0.21)(0.13; 0.21; 0.35)(0.04; 0.07; 0.12)(0.11; 0.17; 0.27)(0.02; 0.04; 0.07)
KPI4(0.03; 0.05; 0.10)(0.08; 0.14; 0.26)(0.07; 0.11; 0.20)(0.13; 0.21; 0.35)(0.05; 0.09; 0.16)(0.07; 0.12; 0.21)(0.02; 0.04; 0.07)
KPI5(0.05; 0.08; 0.15)(0.12; 0.20; 0.32)(0.07; 0.11; 0.20)(0.10; 0.17; 0.29)(0.02; 0.05; 0.09)(0.10; 0.16; 0.26)(0.02; 0.04; 0.07)
KPI6(0.03; 0.06; 0.11)(0.06; 0.10; 0.20)(0.05; 0.09; 0.16)(0.11; 0.19; 0.32)(0.04; 0.07; 0.12)(0.07; 0.11; 0.19)(0.03; 0.04; 0.07)
KPI7(0.04; 0.07; 0.14)(0.08; 0.14; 0.26)(0.05; 0.09; 0.16)(0.09; 0.16; 0.27)(0.06; 0.09; 0.16)(0.07; 0.12; 0.20)(0.03; 0.04; 0.07)
KPI8(0.05; 0.09; 0.16)(0.10; 0.17; 0.29)(0.05; 0.09; 0.16)(0.10; 0.17; 0.30)(0.06; 0.09; 0.16)(0.09; 0.15; 0.25)(0.04; 0.06; 0.09)
KPI9(0.05; 0.08; 0.16)(0.11; 0.18; 0.31)(0.07; 0.11; 0.19)(0.14; 0.24; 0.37)(0.06; 0.09; 0.16)(0.09; 0.15; 0.25)(0.04; 0.06; 0.09)
KPI10(0.05; 0.08; 0.16)(0.09; 0.16; 0.29)(0.07; 0.11; 0.19)(0.13; 0.21; 0.35)(0.06; 0.09; 0.16)(0.08; 0.13; 0.22)(0.04; 0.06; 0.09)
KPI11(0.04; 0.07; 0.14)(0.03; 0.07; 0.15)(0.05; 0.09; 0.16)(0.13; 0.22; 0.36)(0.06; 0.10; 0.17)(0.11; 0.17; 0.27)(0.04; 0.06; 0.09)
KPI12(0.05; 0.08; 0.15)(0.08; 0.15; 0.27)(0.05; 0.08; 0.15)(0.13; 0.22; 0.36)(0.06; 0.10; 0.17)(0.07; 0.12; 0.21)(0.03; 0.04; 0.07)
KPI13(0.05; 0.08; 0.16)(0.06; 0.10; 0.20)(0.05; 0.08; 0.15)(0.13; 0.21; 0.35)(0.04; 0.07; 0.13)(0.07; 0.12; 0.20)(0.03; 0.04; 0.07)
Table 10. Final ranking of KPIs using normalization rule (13).
KPI d i + d i C C i Rank
Inventory turnover (KPI1)6.0671.0240.1443
Percentage of additional freight costs (KPI2)6.2100.8750.12410
Product price/quality ratio (KPI3)6.0401.0530.1482
First pass yield/throughput yield (KPI4)6.1620.9280.1319
Defects per unit (KPI5)6.1260.9630.1366
Employees’ efficiency (KPI6)6.2660.8160.11513
Changes in implementation time (KPI7)6.2170.8690.12311
Actual production time (KPI8)6.1030.9870.1395
Overall equipment effectiveness (KPI9)6.0171.0780.1521
Net equipment effectiveness (KPI10)6.0721.0240.1444
On-time delivery (KPI11)6.1520.9340.1328
Tact time (KPI12)6.1360.9550.1357
Unit/line reliability (KPI13)6.2170.8690.12312
Table 11. Final ranking of KPIs using normalization rule (14).
KPI d i + d i C C i Rank
Inventory turnover (KPI1)6.6970.3250.04623
Percentage of additional freight costs (KPI2)6.7460.2750.039210
Product price/quality ratio (KPI3)6.6890.3320.04732
First pass yield/throughput yield (KPI4)6.7300.2910.04159
Defects per unit (KPI5)6.7170.3040.04336
Employees’ efficiency (KPI6)6.7650.2560.036413
Changes in implementation time (KPI7)6.7470.2740.039011
Actual production time (KPI8)6.7100.3120.04445
Overall equipment effectiveness (KPI9)6.6820.3400.04841
Net equipment effectiveness (KPI10)6.7000.3230.04594
On-time delivery (KPI11)6.7280.2930.04178
Tact time (KPI12)6.7210.3000.04287
Unit/line reliability (KPI13)6.7490.2720.038812
Table 12. Final ranking of KPIs obtained using RADAR methods.
KPIRI RADARRANK RADARRI RADAR2RANK RADAR2RI Fuzzy RADARRANK Fuzzy RADAR
KPI10.92330.843310.5834
KPI20.615110.255137.83112
KPI30.94020.907211.5912
KPI40.70990.38499.6987
KPI50.73680.40489.5758
KPI60.567130.269127.11113
KPI70.639100.290118.34510
KPI80.81750.49869.1509
KPI91.00011.000112.3381
KPI100.84440.592410.7833
KPI110.80660.58959.9215
KPI120.76770.42079.8486
KPI130.614120.312108.08011
Table 13. Final ranking of KPIs for five methods considered.
KPIFuzzy TOPSIS Rule (13)Fuzzy TOPSIS Rule (14)RADARRADAR2Fuzzy RADAR
KPI133334
KPI21010111312
KPI322222
KPI499997
KPI566888
KPI61313131213
KPI71111101110
KPI855569
KPI911111
KPI1044443
KPI1188655
KPI1277776
KPI131212121011
Table 14. WS coefficient matrix.
Fuzzy TOPSIS (13)Fuzzy TOPSIS (14)RADARRADAR2Fuzzy RADAR
Fuzzy TOPSIS (13)X1.0000.99430.98960.9567
Fuzzy TOPSIS (14) X0.99430.98960.9567
RADAR X0.99360.9708
RADAR2 X0.9748
Fuzzy RADAR X
Table 7. Fuzzy and crisp weights of the criteria.
CriteriaFuzzy WeightsNormalized Crisp WeightsRank
Specific(0.07; 0.10; 0.18)0.1075
Measurable(0.12; 0.20; 0.32)0.1992
Available(0.08; 0.13; 0.21)0.1314
Relevant(0.14; 0.24; 0.37)0.2321
Timely(0.06; 0.10; 0.17)0.1056
Explainable(0.11; 0.17; 0.27)0.1683
Relative(0.04; 0.06; 0.09)0.0587
Table 15. Fuzzy TOPSIS comparison.
KPIActualMaxLower
KPI1333
KPI2101012
KPI3225
KPI4988
KPI5662
KPI6131313
KPI7111111
KPI8556
KPI9111
KPI10444
KPI11899
KPI12777
KPI13121210
Disclaimer/Publisher’s Note: The statements, opinions and data contained in all publications are solely those of the individual author(s) and contributor(s) and not of MDPI and/or the editor(s). MDPI and/or the editor(s) disclaim responsibility for any injury to people or property resulting from any ideas, methods, instructions or products referred to in the content.

