1. Introduction
Rapid development in the population and energy demand often comes with significant environmental impacts, including resource depletion and ecological stresses such as water scarcity [
1,
2]. Wang et al. [
3] investigated the potential economic consequences of water scarcity in the construction sector, identifying countries and sectors particularly vulnerable to supply disruptions. In response to these challenges, green buildings have emerged as sustainable solutions that minimize environmental damage, conserve resources, and promote renewable energy [
4,
5,
6,
7]. Recent research has demonstrated their benefits in reducing energy consumption, improving indoor environmental quality, and lowering carbon emissions [
8,
9]. Al-Sakkaf et al. [
10] showed that compressed earth blocks in Saudi Arabia could cut cooling loads by 35% and achieve 80–85% occupant satisfaction, while Almusaed et al. [
11] highlighted how recycled construction materials substantially reduce greenhouse gas emissions and support a circular economy. Net-zero-energy buildings, as a subset of green construction, generate as much energy as they consume annually, further contributing to sustainability [
12]. Almusaed et al. [
11] assessed recycled construction materials within a circular economy framework and found that their use significantly reduces greenhouse gas emissions and energy consumption across the building lifecycle. The study highlighted the need for supportive policies and innovation to advance climate-neutral construction, aligning with EU and UN sustainability goals. China, with its rapid urbanization and growing environmental concerns, has shown a strong commitment to green building initiatives. However, the implementation of these projects presents unique challenges that must be addressed to achieve the desired outcomes [
13].
Despite the potential advantages, the green building sector has received insufficient attention, particularly concerning risk management, which is crucial for ensuring the success and sustainability of such projects [
14]. Risk management in construction is critical for project success, as common risks—including financial constraints, legal issues, and safety concerns—are compounded in green building projects by technological uncertainties and market acceptance challenges [
15,
16,
17,
18]. In this regard, Nguyen and Macchion [
19] reviewed the literature and identified major gaps, including inconsistent risk factor identification, limited exploration of risk–performance relationships, and a lack of cross-country studies.
Recent studies show a wide range of risks in green construction projects. Hwang et al. [
20] aimed to identify and assess the critical risks inherent in green retrofit projects in Singapore, compare their severity to that of conventional retrofits, and propose mitigation strategies. Through a combination of literature review, a questionnaire survey involving 30 experienced professionals, and follow-up interviews, 20 key risks and 37 mitigation measures were documented. The findings revealed that “post-retrofit tenants’ cooperation risk” ranked highest in criticality, and that nineteen risks were more significant in green retrofits compared to traditional projects. While this research provided valuable insights into the types and perceived severity of risks, it primarily relied on qualitative expert judgment and descriptive analysis, without incorporating quantitative prediction or optimization techniques. Moreover, no machine learning (ML) or soft computing models were applied to forecast the risks’ impacts on project performance dimensions such as cost, time, or quality. Qin et al. [
21] assessed risk factors—including political, social, certification, financial, technological, and managerial risks—across the lifecycle of green buildings in China, prioritizing them based on probability of occurrence and degree of influence. Data were gathered via a structured questionnaire administered to construction industry experts, and Kendall’s concordance and Spearman’s rank correlation tests were used to evaluate the consistency of the rankings among different stakeholder groups. The analysis identified 36 key risks among 56 factors, highlighting notable divergences in risk perceptions between owners, contractors, engineers, and designers. While these findings offered a valuable foundation for tailoring risk management strategies to stakeholder perspectives, their study did not develop predictive models to quantify how prioritized risks impact core project performance dimensions such as cost, time, quality, or scope. Additionally, no optimization algorithms were applied to refine or improve the accuracy of the risk assessments. Zhao et al. [
22] proposed a fuzzy synthetic evaluation approach to assess risks in Singapore’s green construction projects. Their study aimed to address the limitations of conventional risk assessment by introducing fuzzy set theory to better capture subjectivity and uncertainty in expert judgments. Drawing on a comprehensive set of 28 risk factors categorized into regulatory, technological, financial, and management domains, the researchers constructed a fuzzy risk evaluation model and applied it to real-world projects. Their results demonstrated that fuzzy synthetic evaluation could improve the clarity and consistency of risk prioritization compared to traditional deterministic methods. While this approach advanced the handling of ambiguous inputs and provided a structured means for aggregating expert opinions, it remained primarily descriptive in nature. Specifically, the method did not incorporate predictive modeling to estimate the quantitative impact of risks on project performance criteria—such as cost overruns, schedule delays, or quality outcomes—nor did it explore the use of optimization techniques to enhance model precision. Sajjad et al. [
23] investigated strategies to achieve net-zero energy consumption in tall buildings by utilizing building information modeling (BIM) with advanced energy analysis tools in the Malaysian construction industry. Their study sought to bridge a critical knowledge gap regarding the holistic application of BIM to drive sustainable design and performance optimization. Employing a three-phase methodology—including qualitative interviews, a pilot survey, and a comprehensive questionnaire—the researchers validated their conceptual framework using exploratory factor analysis and assessed its predictive relationships via partial least squares structural equation modeling. The findings confirmed statistically significant associations between BIM deployment and factors such as early design integration, energy efficiency improvements, optimized system integration, and predictive performance analysis. This work offered valuable insights for practitioners and policymakers aiming to adopt BIM for sustainable tall building projects. However, while the study advanced the understanding of BIM-based strategies, it primarily emphasized qualitative validation and the perceptions of stakeholders rather than quantitatively modeling the probabilistic impact of specific risks on key project performance dimensions. Furthermore, no ML or metaheuristic optimization methods were applied to forecast or optimize these impacts.
Soft computing methods, such as the fuzzy analytic hierarchy process (FAHP) and ML models, offer advanced tools for managing complex and uncertain risks [
24]. Beckley [
25] investigated the combination of artificial intelligence (AI), ML, and statistical modeling in modern risk assessment frameworks across sectors such as finance, healthcare, and engineering. The study highlighted the limitations of traditional deterministic models in dealing with nonlinear and rapidly evolving risk environments, and it found that data-driven techniques significantly improve predictive accuracy and reduce human biases. Beckley [
25] emphasized that while AI can uncover hidden patterns and enhance quantitative risk evaluation, expert judgment remains essential for contextualizing results and ensuring interpretability. The research further suggested that hybrid approaches—merging soft computing algorithms with domain expertise—offer a resilient and adaptive framework for navigating uncertainty.
Technological risks include the combination of new and untested technologies, which can lead to performance issues or increased costs. Market risks involve the uncertainty of demand for green buildings and the willingness of consumers to pay a premium for sustainable features. In this context, Okoye et al. [
26] examined the implementation risks of sustainable construction practices in Nigeria through a large-scale survey of 256 building professionals. The study identified 47 distinct risk factors, among which high initial sustainable construction costs and the unavailability of materials were found to significantly impact both the likelihood of occurrence and the magnitude of effects. Notably, risks associated with market acceptance—such as high costs and limited awareness—were highlighted as critical obstacles, indicating hesitation from clients to invest in green features without clear short-term economic benefits. The research further revealed that knowledge gaps, regulatory weaknesses, and socioeconomic limitations contribute to the uncertainty surrounding market demand for sustainable buildings. Using statistical tools like the Wilcoxon signed-rank test, the study confirmed a moderate effect size in the difference between the perceived likelihood and impact of various risks. These findings underscore the importance of market education, policy incentives, and cost reduction strategies to mitigate market risk in sustainable construction. The authors recommended multi-risk management training and investment in affordable green technologies to enhance consumer confidence and drive adoption.
Machine learning methods have been widely used in all areas of contemporary advancement in technology [
27]. Alghassab [
28] proposed a hybrid soft computing framework combining the FAHP and the fuzzy technique for order of preference by similarity to ideal solution (FTOPSIS) for evaluating sustainable renewable energy control systems. The study aimed to enhance system resilience—particularly against cyber-attacks—while optimizing decision-making in renewable energy deployment. The FAHP was employed to hierarchically structure and weight various primary and secondary factors influencing sustainable energy choices. This structured approach enabled the effective prioritization of decision criteria under uncertainty. Subsequently, FTOPSIS was applied to rank alternative energy sources, leading to the conclusion that wind energy represented the most sustainable and favorable option. Although the study focused on the energy domain, its methodology demonstrates the power of integrating the FAHP for structured decision-making and fuzzy-based inference tools for outcome ranking, illustrating a practical path for modeling complex systems [
28].
In recent years, the FAHP has been widely used for risk assessment in construction projects, because it effectively captures subjective expert judgments and models uncertainty in decision-making [
29,
30,
31]. However, the FAHP on its own is limited to producing relative weights or rankings of risk factors and lacks predictive capability regarding how these risks impact project performance outcomes [
32]. Meanwhile, ML models have demonstrated strong performance in learning nonlinear relationships between risk indicators and outcomes [
33]. Despite this strength, ML models typically require structured, high-quality input features and are prone to overfitting when trained on small, expert-derived datasets [
34]. Metaheuristic optimization techniques, such as particle swarm optimization (PSO), have been successfully applied to optimize the hyperparameters of predictive models and improve their convergence [
35]. However, optimization algorithms alone cannot generate interpretable risk prioritization frameworks or independently learn risk–outcome mappings without an underlying predictive model. Therefore, as a novel strategy, the combination of the FAHP, ML, and PSO in this study is designed to overcome the limitations inherent in each method when used in isolation. The FAHP provides structured and interpretable inputs, ML enables data-driven prediction of risk impacts, and PSO enhances the model accuracy and generalization by fine-tuning the learning process.
To address the limitations of static, fragmented, or exclusively qualitative risk assessment methods in prior research, a novel hybrid framework has been developed in this study that combines the FAHP, ML, and metaheuristic optimization. This integrated approach is intended to enable both systematic prioritization of risk factors and predictive modeling of their impacts under uncertainty. Specifically, expert-derived synthetic data were generated through structured questionnaires to compensate for the scarcity of real-world project records. The FAHP was employed to quantify and rank the relative importance of ten key risk categories. These quantified risk weights were subsequently used as inputs to train a multilayer perceptron (MLP) NN, with the objective of forecasting the effects of the most critical risks on four principal project performance metrics: cost, time, quality, and scope. To enhance predictive accuracy and avoid overfitting, three different optimization techniques, including the PSO, genetic algorithm (GA), and artificial bee colony (ABC), were selected. Then, the best optimization algorithm was selected and incorporated to optimize the MLP’s weights and hyperparameters during training.
2. Materials and Methods
2.1. Research Design
To achieve the aforementioned objectives, it was necessary to study scientific sources and authentic research records, which was accomplished in this research. Additionally, since risk management often involves ambiguities and complexities in definitions and meanings, analysis models based on expert knowledge and experience should be used to resolve these ambiguities [
36,
37,
38]. Consequently, the FAHP and ML are particularly suitable because they formalize and parametrize ambiguities in expert judgments and use linguistic variables to structure and facilitate decision-making in uncertain environments [
39]. Hence, the need to present and apply an analysis model based on statistical data and the FAHP-ML method in building risk management was adopted as the most appropriate and efficient method [
40,
41].
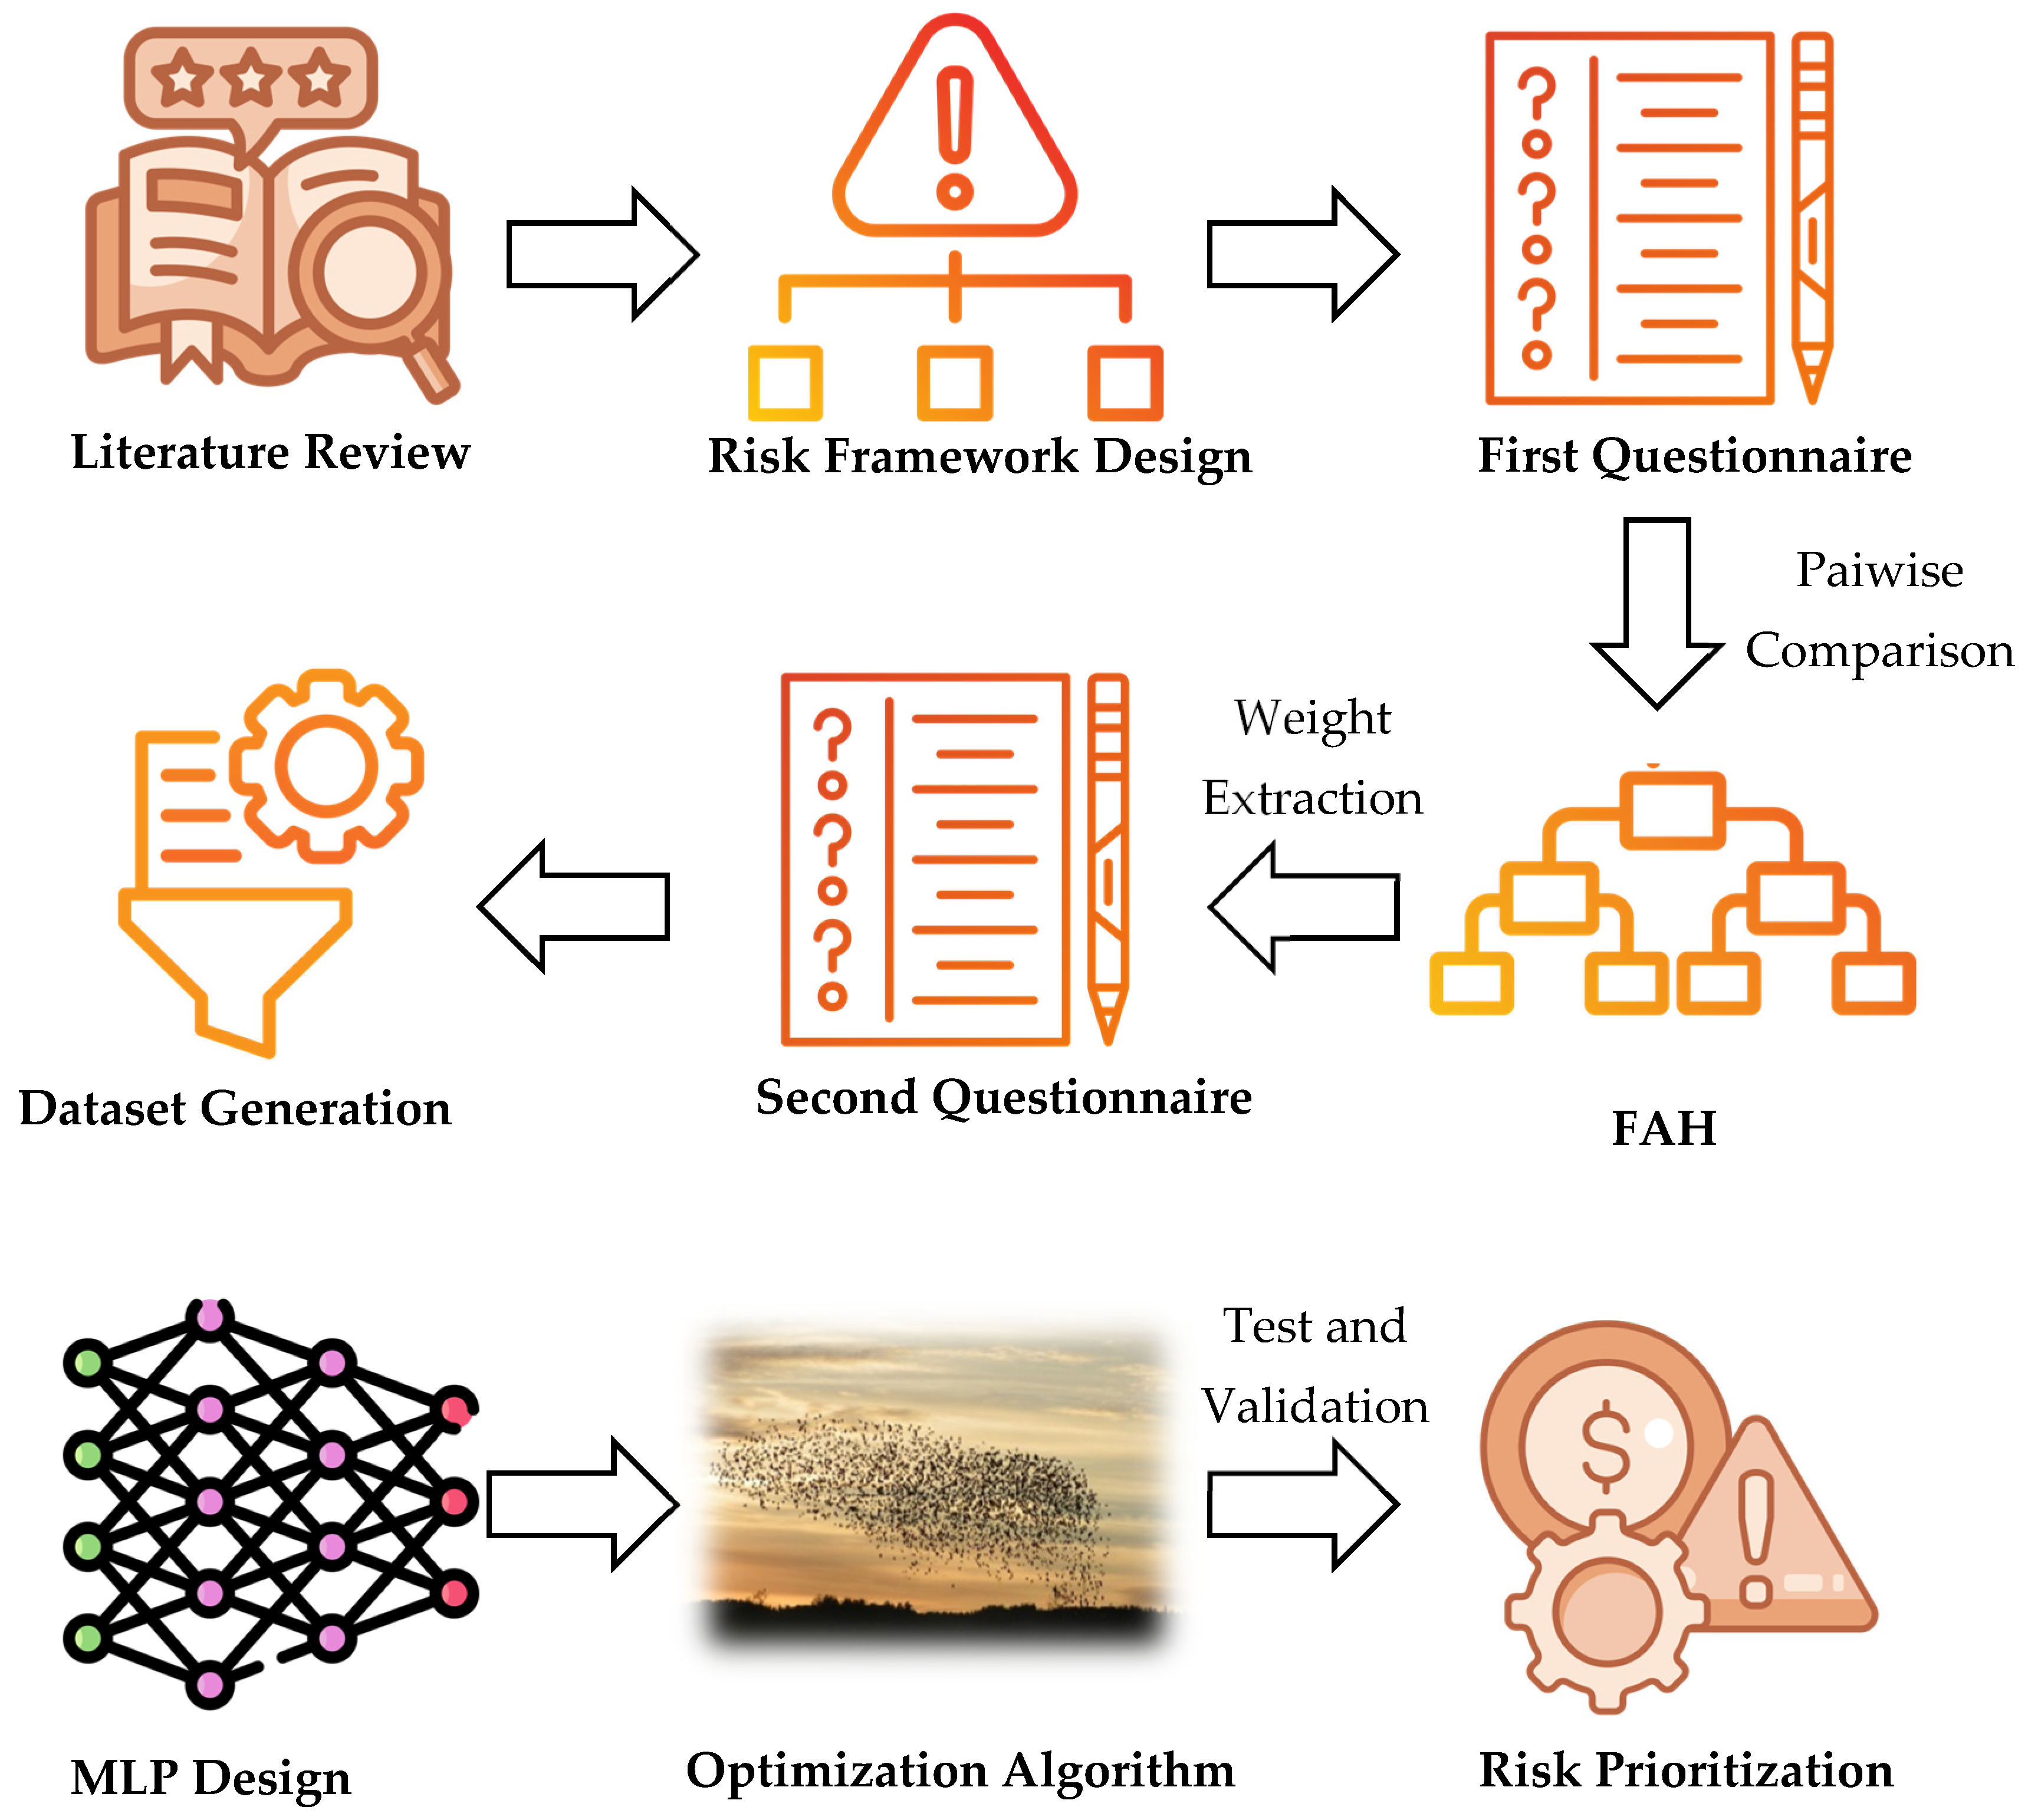
Figure 1 shows the study overview.
To address the inherent uncertainty and complexity of risks in green building projects—especially in data-scarce environments—a simulation-based, hybrid modeling framework was adopted. The research design was structured into a multi-stage process involving risk prioritization, data simulation, ML modeling, and metaheuristic optimization. Each stage was designed to build upon the results of the previous one, ensuring an integrated and replicable approach to risk management.
In the first stage, a structured risk framework consisting of ten major categories—economic, contractual, managerial, educational, legal, industrial, functional, market, environmental, and safety—was developed. These categories were identified based on a comprehensive literature review of prior studies and international standards related to green construction. To prioritize these risk categories, an initial questionnaire was designed and distributed among 30 domain experts with substantial experience in green building development in Shenzhen, China. The questionnaire was constructed using pairwise comparisons following the FAHP methodology. The collected judgments were aggregated, fuzzified, and analyzed to generate final defuzzified weights for each risk category. The FAHP achieves this by converting linguistic evaluations into fuzzy numbers that represent the degree of membership in different categories. This allows the model to operate on quantified uncertainty rather than unstructured subjective statements [
42]. These numerical weights represented the relative significance of each risk in the context of green building development.
In the second stage, the results from the FAHP analysis served as the basis for constructing the second data collection instrument. A second structured questionnaire was developed to capture expert assessments regarding the impact of each identified risk on four critical project performance metrics: cost, time, quality, and scope. Experts were asked to rate the magnitude of impact for each risk category on these four dimensions using a standardized Likert scale. The responses were compiled into a structured dataset, effectively simulating how different risk profiles could influence project outcomes. This synthetic dataset, although not based on real project records, was designed to emulate realistic decision-making conditions through expert simulation.
In the third stage, the synthetic dataset generated from the second questionnaire was used as the input to train a supervised ML model. A multilayer perceptron (MLP), a type of feedforward ANN, was selected due to its ability to learn complex, nonlinear relationships between input features and output targets. Similarly, ML models can learn probabilistic or nonlinear relationships among these fuzzy-weighted inputs and outcome variables, making the prediction process more consistent and data-driven [
43,
44]. The input features consisted of the ten risk weights derived from the FAHP phase, and the output variables were the estimated impact scores on cost, time, quality, and scope. The dataset was randomly split into training and validation subsets. To reduce the risk of overfitting and improve the model’s generalization ability, early stopping and dropout techniques were also employed during training.
In the fourth stage, three optimization algorithms, including a PSO algorithm, GA, and ABC algorithm, were applied to optimize the training process of the MLP model. Optimization algorithm was used to fine-tune key hyperparameters, including the number of neurons in the hidden layers, the learning rate, and momentum coefficients. The optimization objective was to minimize the root-mean-square error (RMSE) between the predicted and simulated project impact values across all four metrics. This combination of optimization algorithms within the MLP training phase significantly improved the model convergence and predictive accuracy, particularly in light of the limited data volume and the high dimensionality of the input space.
In the final stage, the outputs of the optimized MLP model were analyzed to identify which risk categories exerted the most significant influence on overall project performance. Sensitivity analysis and importance ranking were conducted to determine the relative impact of each risk factor on the four output variables.
2.2. Expert Selection and Data Collection for the FAHP and Simulation
To support the development of a robust and data-driven risk modeling framework, thirty domain experts in green building and sustainable construction were purposively selected to provide structured input. The participants were chosen based on their professional standing, academic background, and extensive involvement in green building initiatives within China. The sample included a balanced distribution of roles, such as project managers, civil engineers, architects, environmental engineers, economists, legal advisors, and sustainability consultants. All of the experts had at least ten years of professional experience, and their educational qualifications ranged from bachelor’s to doctoral degrees. The gender composition included 21 males and 9 females.
Table 1 summarizes the demographic and professional breakdown of the participant group.
Data collection was conducted in two structured phases, using questionnaires tailored for distinct analytical objectives. The first questionnaire was designed based on pairwise comparisons to capture expert judgments on the relative importance of ten predefined risk categories—economic, contractual, managerial, educational, legal, industrial, functional, market, environmental, and safety. The inputs were used to construct fuzzy comparison matrices, which were then processed through the FAHP methodology to extract defuzzified priority weights for each risk dimension.
In the second phase, a follow-up questionnaire was administered to the same expert group. This instrument aimed to assess the perceived impact of each prioritized risk category on four fundamental project performance dimensions: cost, time, quality, and scope. The experts were asked to score the magnitude of impact for each risk on a Likert scale. The resulting matrix represented a simulated decision dataset—synthetic in nature but grounded in expert knowledge—suitable for use in machine learning modeling.
2.3. Likert Scale
To evaluate the perceived impact of each risk category on key project performance dimensions, the second phase of data collection employed a five-point Likert scale within the expert questionnaire. This scale enabled the respondents to systematically rate the magnitude of the influence that each identified risk exerts on cost, time, quality, and scope. In the context of this study, the Likert scale served two key functions: First, it allowed for the generation of semi-quantitative data from expert opinion, thereby bridging the gap between qualitative insight and machine-readable input. Second, it enabled the creation of a synthetic yet statistically consistent dataset in the absence of historical project records. These synthetic data were later used as inputs to train an MLPNN, with the risk weights derived from the FAHP serving as predictors, and with Likert-based impact scores serving as target values. The use of an ordinal, interval-like scale also ensured compatibility with fuzzy logic theory and optimization algorithms used in the modeling phase.
Table 2 presents the structure of the Likert scale employed in the second questionnaire, detailing the scoring system and verbal anchors used to guide the expert responses.
This scale was intentionally designed to maintain both linguistic clarity and numerical interpretability, making it compatible with both fuzzy-based multi-criteria decision-making (FAHP) and subsequent ML modeling [
45].
2.4. Instrument Reliability and Cronbach’s Alpha Validation
To evaluate the internal consistency and reliability of the second expert questionnaire, which employed a five-point Likert scale to assess risks’ impact on project dimensions, Cronbach’s alpha coefficient was calculated, as shown in Equation (1). Cronbach’s alpha is a widely accepted statistical measure that is used to assess the internal consistency of multi-item scales, particularly in behavioral, social, and engineering research. It reflects the extent to which items in a survey instrument are correlated and produce stable, replicable results under similar conditions.
where α = Cronbach’s alpha coefficient, K = the number of items (questions) in the scale, σ
i2 = the variance of each individual item i, and σ
T2 = the variance of the total score across all items (i.e., the composite score).
The reliability test was conducted using SPSS (version 22), based on the responses collected from all 30 participants. The resulting Cronbach’s alpha coefficient was 0.83, which exceeds the commonly accepted threshold of 0.70 for exploratory research. This indicates a high level of internal consistency among the questionnaire items and supports the validity of the simulated dataset constructed from expert input. The use of this reliability check was especially critical given the synthetic nature of the data, as it ensured that the simulation process retained methodological robustness.
2.5. Analytical Methods
Two advanced soft computing methods, FAHP and MLP models, were utilized to analyze the collected data. The simultaneous utilization of these methods allowed for the handling of complex and uncertain information, providing a robust risk assessment framework.
2.5.1. Fuzzy Analytic Hierarchy Process (FAHP)
To prioritize the identified risk categories under uncertainty and expert subjectivity, the FAHP was employed using the extent analysis method developed by Unlike the traditional AHP, the FAHP incorporates fuzzy set theory to better represent human cognitive ambiguity during pairwise comparisons. This was particularly relevant for this expert-driven study, where qualitative judgments required transformation into structured, quantitative outputs.
The process began by constructing a three-level hierarchical structure: the overall objective at the top (i.e., effective risk management in green building development), ten risk categories in the middle (economic, contractual, legal, etc.), and specific sub-risks at the bottom. The experts were asked to make pairwise comparisons among risk categories using a 1–9 scale. These linguistic preferences were converted into triangular fuzzy numbers
, where l, m, and u denote the lower, modal, and upper bounds of expert judgment, respectively. The membership function for these fuzzy numbers is defined as shown in Equation (2):
For each criterion, the fuzzy synthetic extent S
i was calculated as shown in Equation (3):
The degree of possibility that one fuzzy number S
i is greater than another S
j is given by Equation (4):
A minimum value among all pairwise comparisons was calculated to obtain a non-fuzzy priority vector W′, as shown in Equation (5):
The final normalized weight vector was constructed as shown in Equation (6):
To verify the consistency of the expert judgments, the consistency ratio (CR) of the fuzzy pairwise matrices was also computed using Equations (7a)–(7c):
where λ
max is the maximum eigenvalue of the pairwise matrix, n is the number of criteria, and RI is the random consistency index for size n. A CR of less than 0.10 was considered acceptable, and matrices exceeding this threshold were reviewed and revised. The output of the FAHP was a set of normalized, crisp weights for each risk category, serving as input features to the subsequent machine learning modeling phase.
2.5.2. Multilayer Perceptron (MLP) Neural Network (NN) Modeling
To simulate the impact of prioritized risk categories on green building project performance, an MLP-NN was constructed and trained using synthetic expert-based data. An MLP is a feedforward ANN composed of an input layer, one or more hidden layers, and an output layer. It is particularly effective in learning complex, nonlinear relationships between independent and dependent variables. The input vector X ∈ R
n consisted of 10 normalized risk weights derived from the FAHP phase, as shown in Equation (8):
Each component xi represents the relative importance of a risk category. The output vector Y ∈ R
4 captured the predicted influence of risks on four project performance metrics, as shown in Equation (9):
The output of a hidden neuron h
j with a sigmoid activation function is calculated as shown in Equation (10):
where w
ij is the weight between input x
i and hidden neuron h
j, b
j is the bias term, and
is the sigmoid activation function. The final output layer (linear or sigmoid) produces Equation (11):
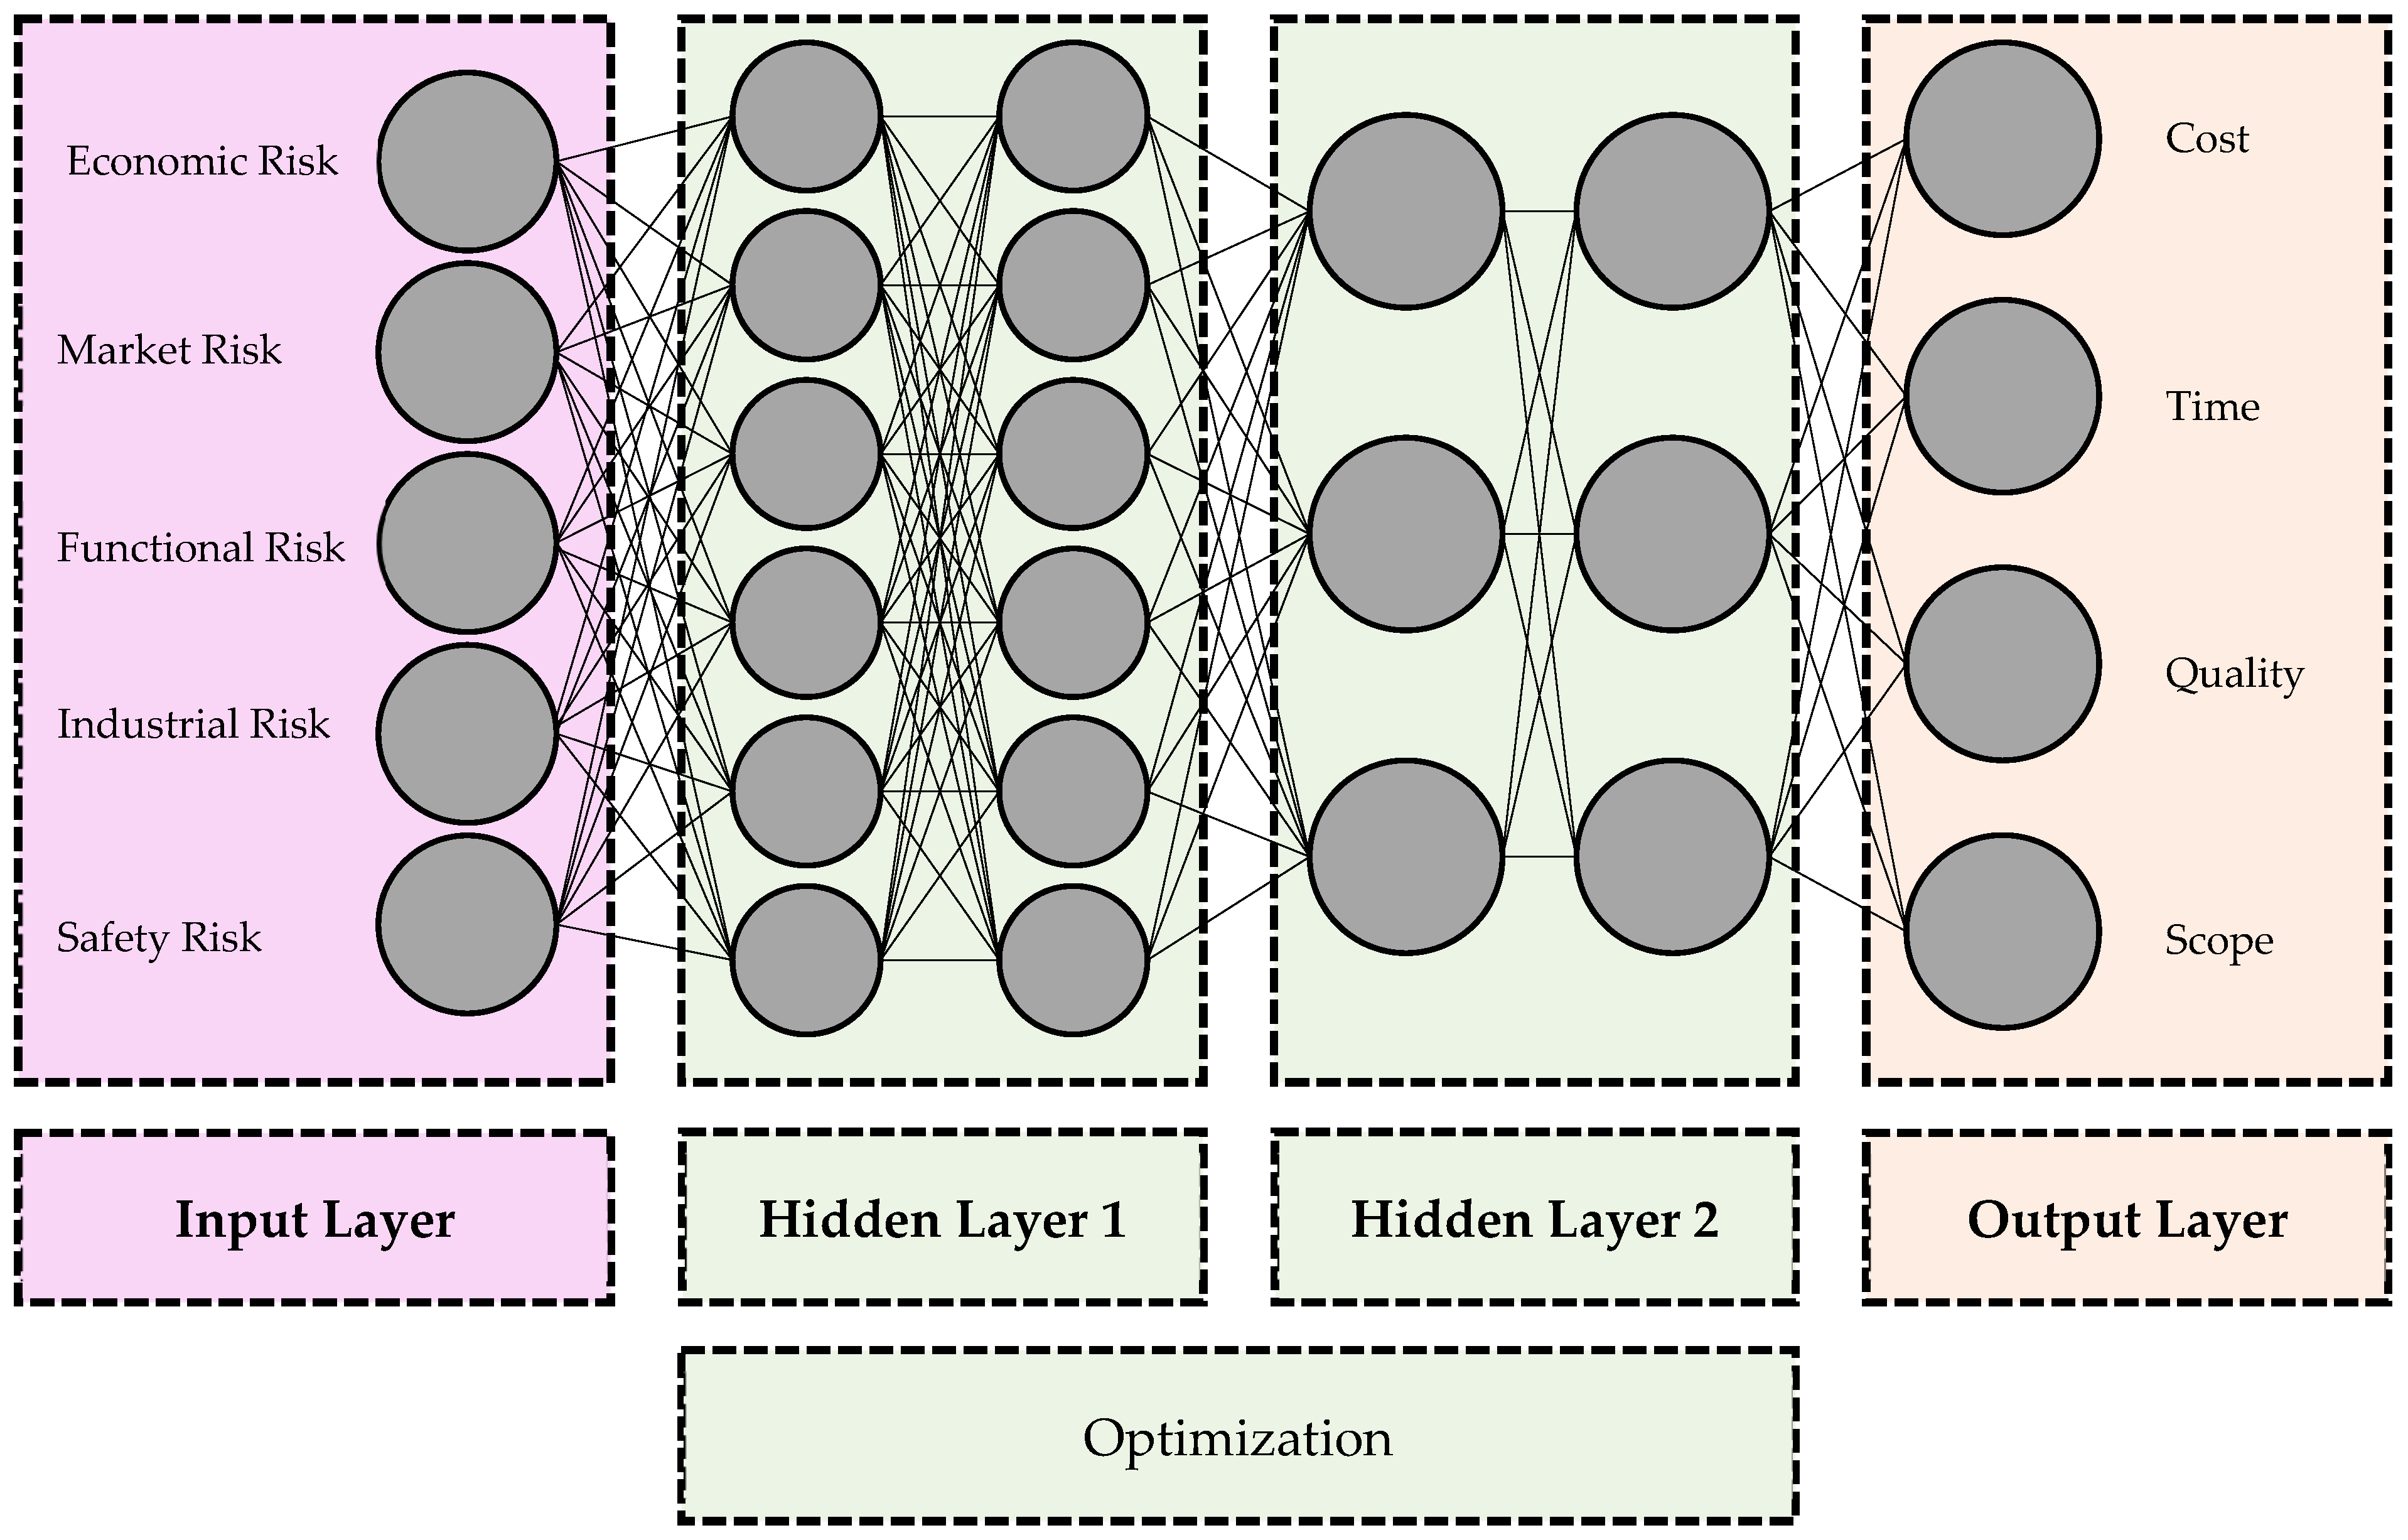
The schematic diagram of the NN architecture used in this study is shown below (
Figure 2).
Figure 2 presents the architecture of the MLP-NN developed in this study to predict the performance impacts of critical risks in green building projects. The network began with an input layer comprising five neurons, each representing one of the top five risk categories identified through the FAHP method: economic risk, market risk, functional risk, industrial risk, and safety risk (as mentioned before, all 10 risk categories were evaluated and ranked using the FAHP to determine their importance; the top 5 most influential risks (based on FAHP weights) were selected as input features to the MLP model; these were the most impactful risks affecting project outcomes; the MLP then took these 5 high-priority risks as inputs to predict 4 outputs: cost, time, quality, and scope). These input features served as the most influential factors affecting project outcomes. The signals from the input layer were processed through two hidden layers, each consisting of a set of neurons whose exact number had been optimized using PSO to ensure model efficiency and accuracy. These hidden layers were responsible for capturing the nonlinear and complex relationships between the input risks and output project dimensions. The output layer contained four neurons, corresponding to the primary performance criteria in green construction projects: cost, time, quality, and scope. These were the dependent variables predicted by the model. The entire network architecture was optimized using PSO, which tunes key hyperparameters such as the number of hidden neurons, learning rate, and momentum, thereby enhancing the predictive capability of the MLP.
To ensure the robustness and superiority of the proposed optimization framework, a comparative analysis was conducted between PSO, GA, and ABC. These three nature-inspired metaheuristic algorithms were selected due to their widespread application and proven effectiveness in NN optimization tasks. PSO was chosen for its fast convergence and low computational overhead, GA for its strong global search capabilities through crossover and mutation, and ABC for its exploitation–exploration balance mimicking the foraging behavior of bees. All three algorithms were applied to optimize the same set of MLP hyperparameters, including the learning rate, number of hidden neurons, and momentum coefficient, using the same synthetic risk dataset. The performance of each algorithm was evaluated using RMSE across four project performance dimensions (cost, time, scope, and quality). In the following subsections, the basis of each optimization technique is explained.
2.5.3. Particle Swarm Optimization (PSO)-Based Hyperparameter Optimization
PSO was selected due to its capability to efficiently handle high-dimensional, nonlinear optimization problems with fewer control parameters compared to other evolutionary algorithms. PSO has been widely used for NN training because of its fast convergence, minimal tuning requirements, and robustness in avoiding local minima. These characteristics make PSO particularly suitable for optimizing the hyperparameters of the MLP in this study, where the dataset was limited and the input space was complex and fuzzy-weighted [
46].
To improve prediction accuracy and prevent overfitting, a PSO algorithm was applied to fine-tune the MLP model. The PSO algorithm optimized the following:
Each particle in the swarm encoded a candidate set of these hyperparameters. The fitness function used for PSO was defined as shown in Equation (12):
The particles iteratively updated their position and velocity according to Equation (13):
where v
i is the velocity of particle i, x
i is the position (set of hyperparameters), and ω is the inertia weight
c1 and c2 are acceleration coefficients, r1 and r2 are random numbers ∈ [0, 1], and pibest and gbest are the personal and global bests, respectively. The optimized MLP model yielded a mapping from the set of risk weights to project performance indicators. The model’s performance was validated using RMSE and mean absolute error (MAE), and the sensitivity of the output variables to the input risks was analyzed in the final step.
It should be noted that PSO does not utilize a kernel function in the traditional sense, as in kernel-based learning methods. Instead, each particle’s movement is governed by velocity and position update equations based on cognitive and social components. In this study, the standard PSO formulation was used, where the fitness function was defined by the RMSE between the predicted and target project outcomes. The velocity update followed the canonical form in Equation (14).
2.5.4. Genetic Algorithm (GA)-Based Hyperparameter Optimization
In this study, the GA was employed as a metaheuristic optimization technique to fine-tune the hyperparameters of the MLP model used for predicting project performance impacts under risk conditions in green building development. The GA is an evolutionary algorithm inspired by Darwinian natural selection, which simulates the process of survival of the fittest to discover optimal solutions in complex search spaces [
47]. The GA operates through biologically inspired operations: selection, crossover, mutation, and fitness evaluation. The objective was to minimize the RMSE between the MLP-predicted performance indicators (cost, time, quality, and scope) and the expert-elicited simulated values. Each chromosome in the GA population represents a candidate solution encoding the following MLP hyperparameters:
Learning rate (lr) ∈ [0.001, 0.1];
Number of neurons in hidden layer (h) ∈ [10, 100];
Momentum coefficient (m) ∈ [0.1, 0.9].
Thus, a chromosome is structured as shown in Equation (14):
In the following, the stepwise execution of the GA that was applied in this study is illustrated:
Population Initialization: A population of N chromosomes was randomly generated, each encoding a unique combination of MLP hyperparameters.
Fitness Evaluation: For each chromosome Ci, the MLP model was trained using the selected hyperparameters, and the fitness value was evaluated using Equation (15):
where the RMSE was computed over all four output dimensions.
Selection: Parents were selected based on their fitness values using a roulette wheel or tournament selection method.
Crossover: Selected parents underwent single-point crossover with a probability Pc, generating offspring by exchanging genetic material, as shown in Equation (16):
Replacement and Elitism: The best individuals were retained in the next generation (elitism), while the remaining population was updated using the newly generated offspring.
Stopping Conditions: The GA terminated if either of the following conditions was satisfied: (i) the maximum number of generations Gmax was reached, or (ii) the change in the best fitness over consecutive generations was less than a threshold ϵ.
The optimal hyperparameter combination [lr ∗, h ∗, m ∗] minimizing the RMSE was selected as the final output. These hyperparameters were then used to train the final MLP model used in the hybrid FAHP–ML–GA framework.
2.5.5. Artificial Bee Colony (ABC)-Based Hyperparameter Optimization
The ABC algorithm is a swarm-based optimization technique inspired by the foraging behavior of honey bees [
48]. In this study, ABC was employed to optimize the hyperparameters of the MLP model, including the learning rate, number of hidden neurons, and momentum coefficient. The population in ABC is divided into three bee groups:
Employed Bees: Exploit current food sources (solutions).
Onlooker Bees: Select food sources based on a probability model.
Scout Bees: Explore new food sources randomly.
Each food source xi represents a candidate solution, i.e., a vector of MLP hyperparameters.
The food sources were initialized as shown in Equation (18):
where
xij is the
jth dimension (hyperparameter) of the
ith food source, and
xmin j and
xmax j define the lower and upper bounds of the
jth hyperparameter, respectively.
Each employed bee modifies the current solution, as shown in Equation (19):
where
ϕij ∈ [−1, 1] is a randomly generated coefficient, and
t ≠
i is a randomly chosen food source.
Onlooker bees select a food source based on its fitness probability, as shown in Equation (20):
where
fiti is the fitness (inverse of RMSE) of the
ith food source.
If a food source is not improved over a certain number of cycles (limit), it is abandoned, and a new solution is randomly generated using Equation (18).
In the present study, the fitness of each solution was evaluated using the function , with lower RMSE values indicating better solutions.
For the implementation, the ABC parameters were set as follows:
The search ranges for the hyperparameters were defined as [0.01–1] for the learning rate, [10–100] for the number of neurons, and [0–1] for the momentum coefficient.
2.6. Evaluation Metrics
To assess the predictive performance of the NN model in this study, three commonly used regression evaluation metrics were employed: (i) the coefficient of determination (R
2), (ii) RMSE, and (iii) mean absolute error (MAE) (Equations (21)–(23)).
where
are the actual values,
are the predicted values, and
is the mean of the actual values.
2.7. Case Study: Shenzhen, China
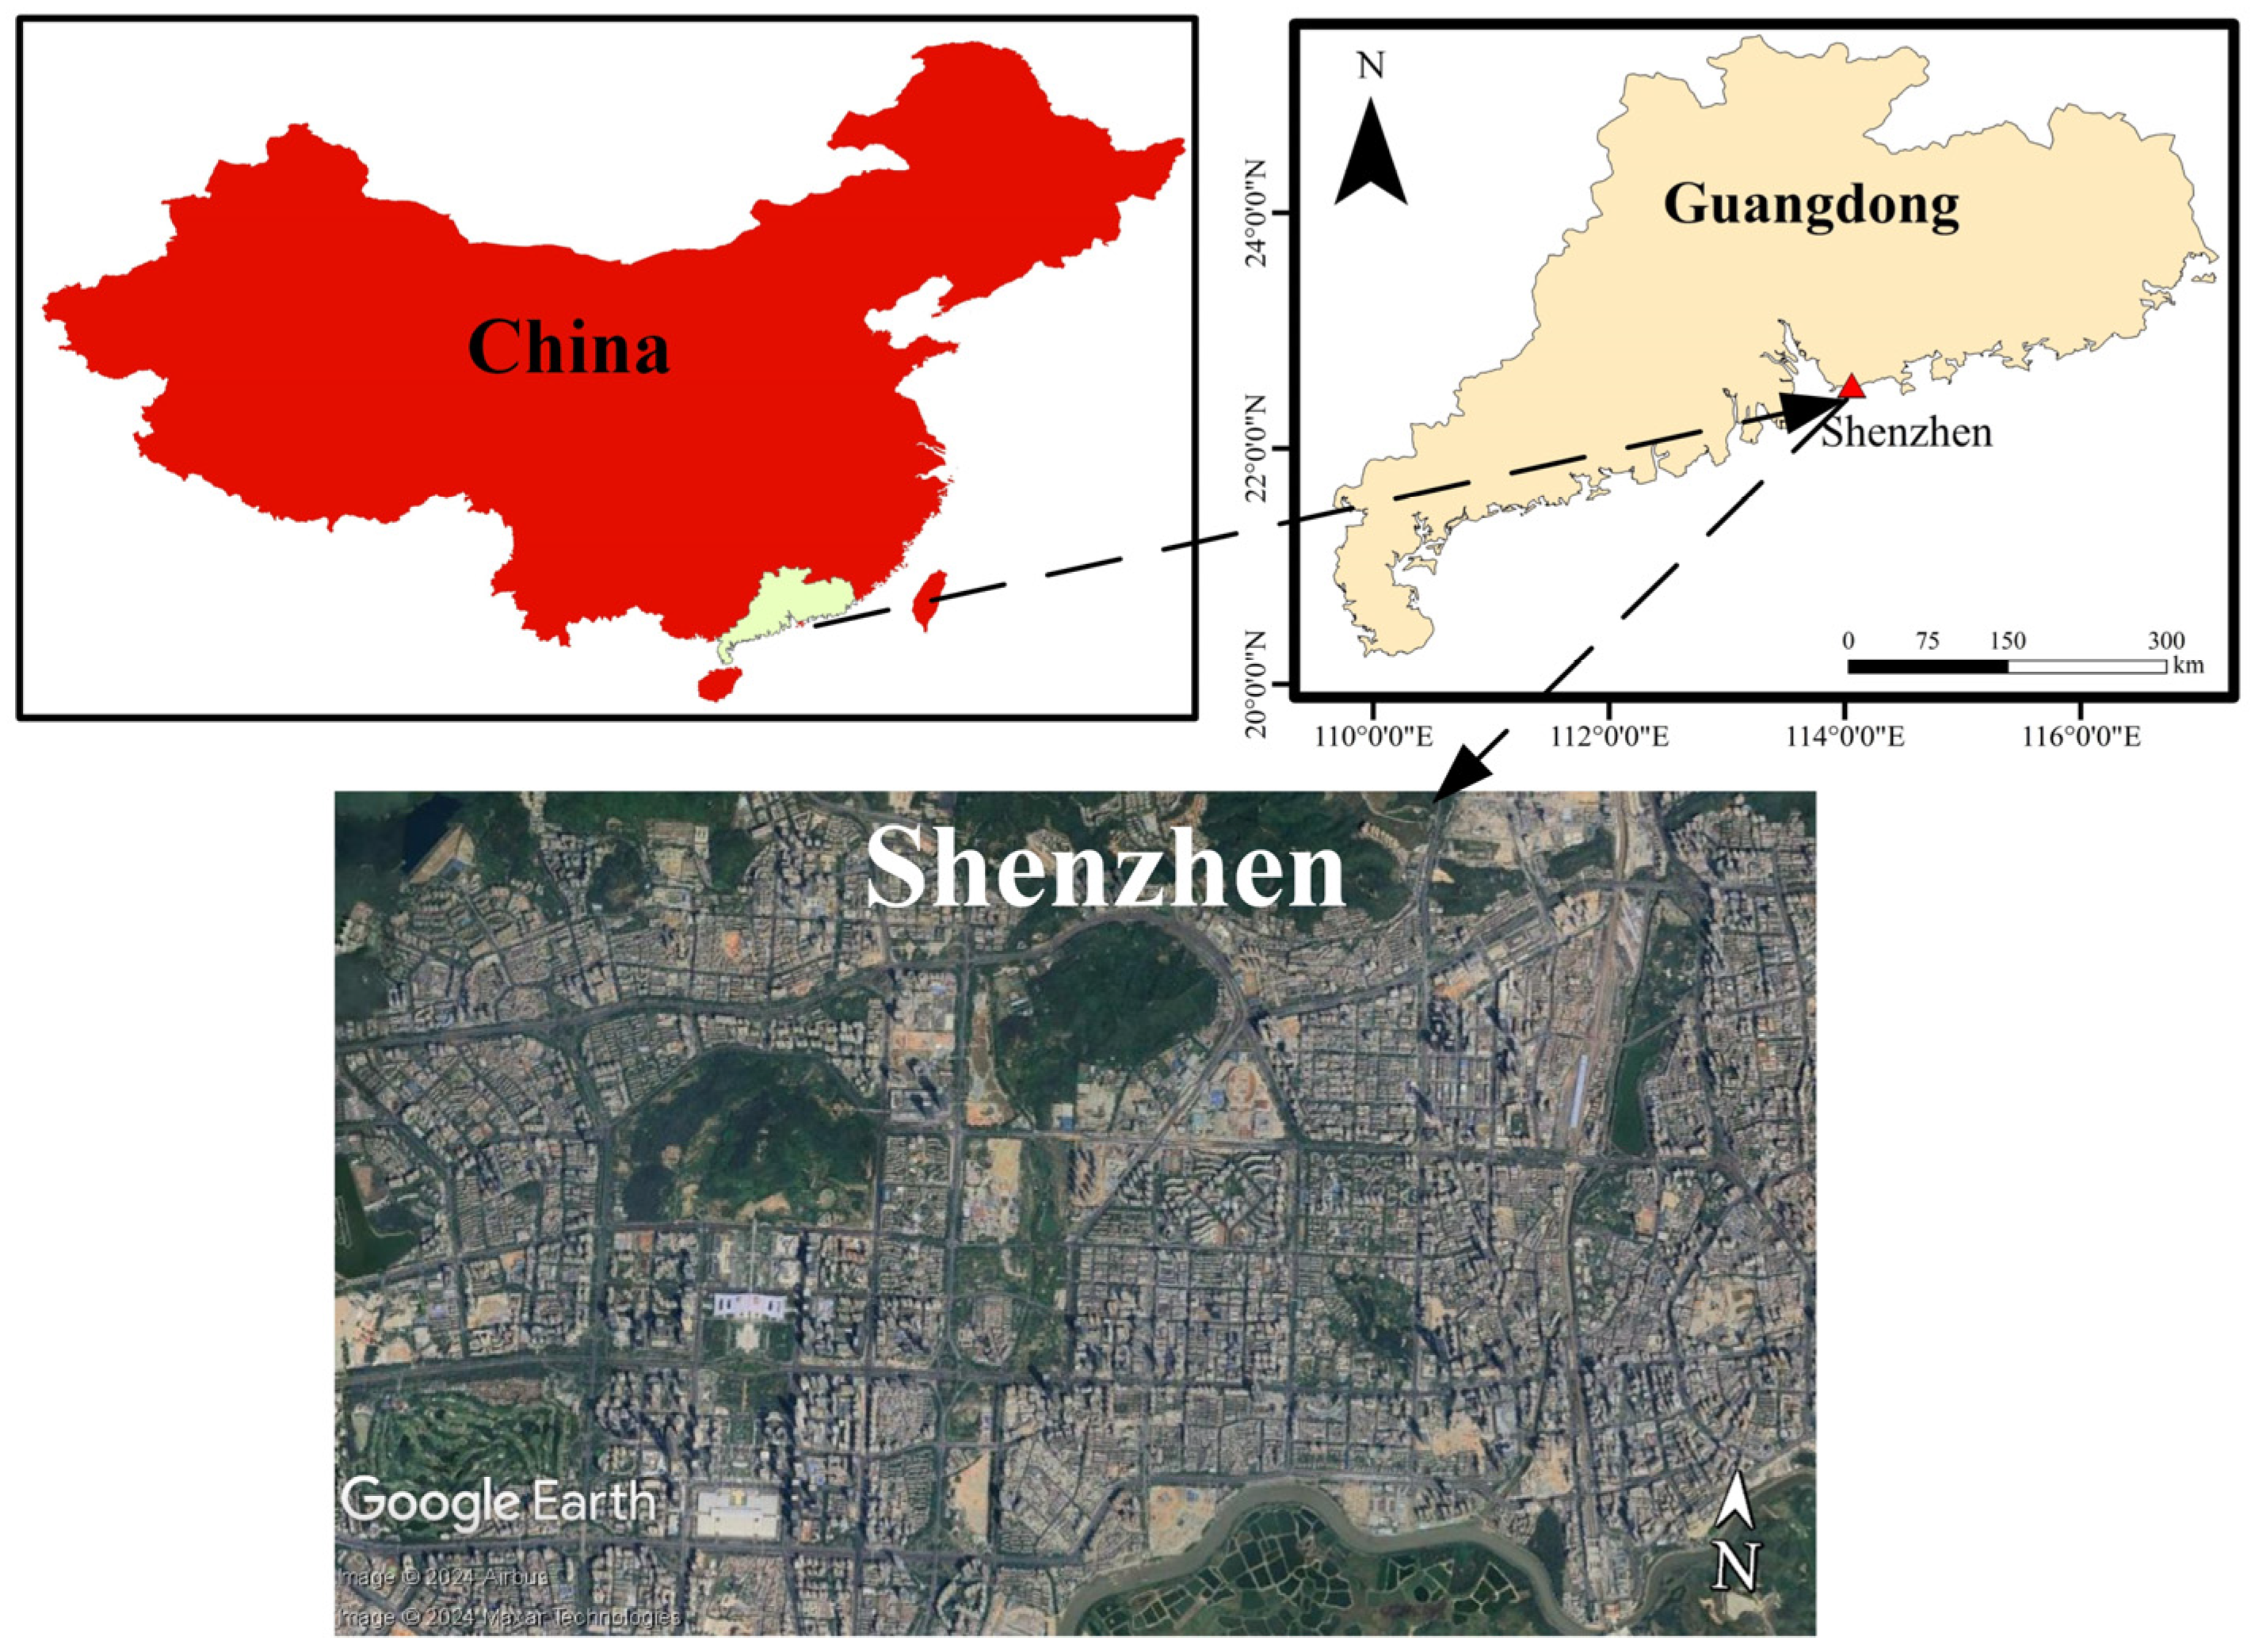
Shenzhen, a prominent city in Guangdong Province and one of China’s leading Special Economic Zones, was selected as the simulation-based case study for this research on risk management in green building development (
Figure 3).
Shenzhen has transformed from a small fishing village into a high-density metropolis within just a few decades, driven by rapid economic reforms and urban expansion [
49,
50]. This unprecedented growth has generated a range of environmental challenges, including increased energy consumption, pollution, and pressure on natural resources. As a result, Shenzhen has adopted aggressive green building policies to enhance its sustainability and mitigate its ecological footprint [
51,
52,
53].
The rationale for selecting Shenzhen lies in its strategic importance and ambitious green targets. In addition, Shenzhen was considered to be an especially suitable case study because it embodies the convergence of several critical factors: a large-scale policy commitment to sustainability, intensive construction activity, and heightened risk complexity stemming from rapid socioeconomic change. This unique combination of policy innovation and operational challenges aligns closely with the objectives of this research, which aims to validate a hybrid risk assessment framework under conditions characterized by uncertainty, data scarcity, and high interdependency among risk categories. Compared to other cities, Shenzhen’s role as a pioneer in adopting national green building standards and piloting renewable energy initiatives offers a particularly rigorous environment to test the model’s adaptability and predictive performance. However, rather than focusing on a specific building project, this study adopted a simulation-based case study approach using synthetic data generated through structured expert input. A total of 30 domain professionals—including project managers, engineers, planners, and environmental specialists—provided pairwise risk evaluations and impact assessments relevant to Shenzhen’s urban context. Their insights enabled the construction of a risk simulation model applicable to green building initiatives in data-scarce but high-risk urban environments.
Therefore, the case study of Shenzhen serves not as a project-specific analysis but as a representative urban model for evaluating complex and interdependent risks in sustainable construction. The hybrid FAHP–MLP–PSO framework was applied to assess how various risk categories influence four fundamental project dimensions: cost, time, quality, and scope. This allowed for a generalized, adaptable, and analytically robust approach to green building risk management that aligns with the dynamic conditions of rapidly urbanizing cities.
3. Results and Discussions
3.1. FAHP-Based Risk Weighting
To prioritize risk categories in the context of green building development, a pairwise comparison matrix was developed based on expert judgments using the FAHP. Ten major risk categories were assessed: economic, safety, functional, market, industrial, contractual, managerial, environmental, legal, and educational. Each expert compared the relative importance of risks using Saaty’s 1–9 scale, and the aggregated responses were used to build the initial crisp pairwise matrix (
Table 3).
As shown in
Table 3, the “Economic” risk was consistently rated higher than other categories. For instance, it received comparative values of 3.99 over “Safety”, 2.25 over “Functional”, and 3.00 over “Environmental” risk, reflecting its perceived criticality in green building implementation. Similarly, “Managerial” risk was considered to be more influential than “Contractual”, “Legal”, and “Educational” risks.
The pairwise matrix was normalized, and the priority vector (weights) was extracted using the extent analysis method and defuzzification through the centroid technique. The resulting weights indicate the relative importance of each risk category in the overall structure.
From the final weight vector, “Economic” risk had the highest priority, followed by “Managerial”, “Industrial”, and “Environmental” risks. These categories collectively accounted for the majority of decision weight and suggest the areas where project stakeholders should focus risk mitigation efforts.
On the other hand, “Educational”, “Legal”, and “Contractual” risks received relatively lower weights. This does not imply that they are unimportant but, rather, that within the context of Shenzhen’s green building sector and the synthetic expert-based dataset, they are less immediately influential in determining project success.
The consistency ratio (CR) for the matrix was calculated and found to be below 0.1, confirming that the expert judgments were logically consistent.
3.2. Risk Priority Ranking
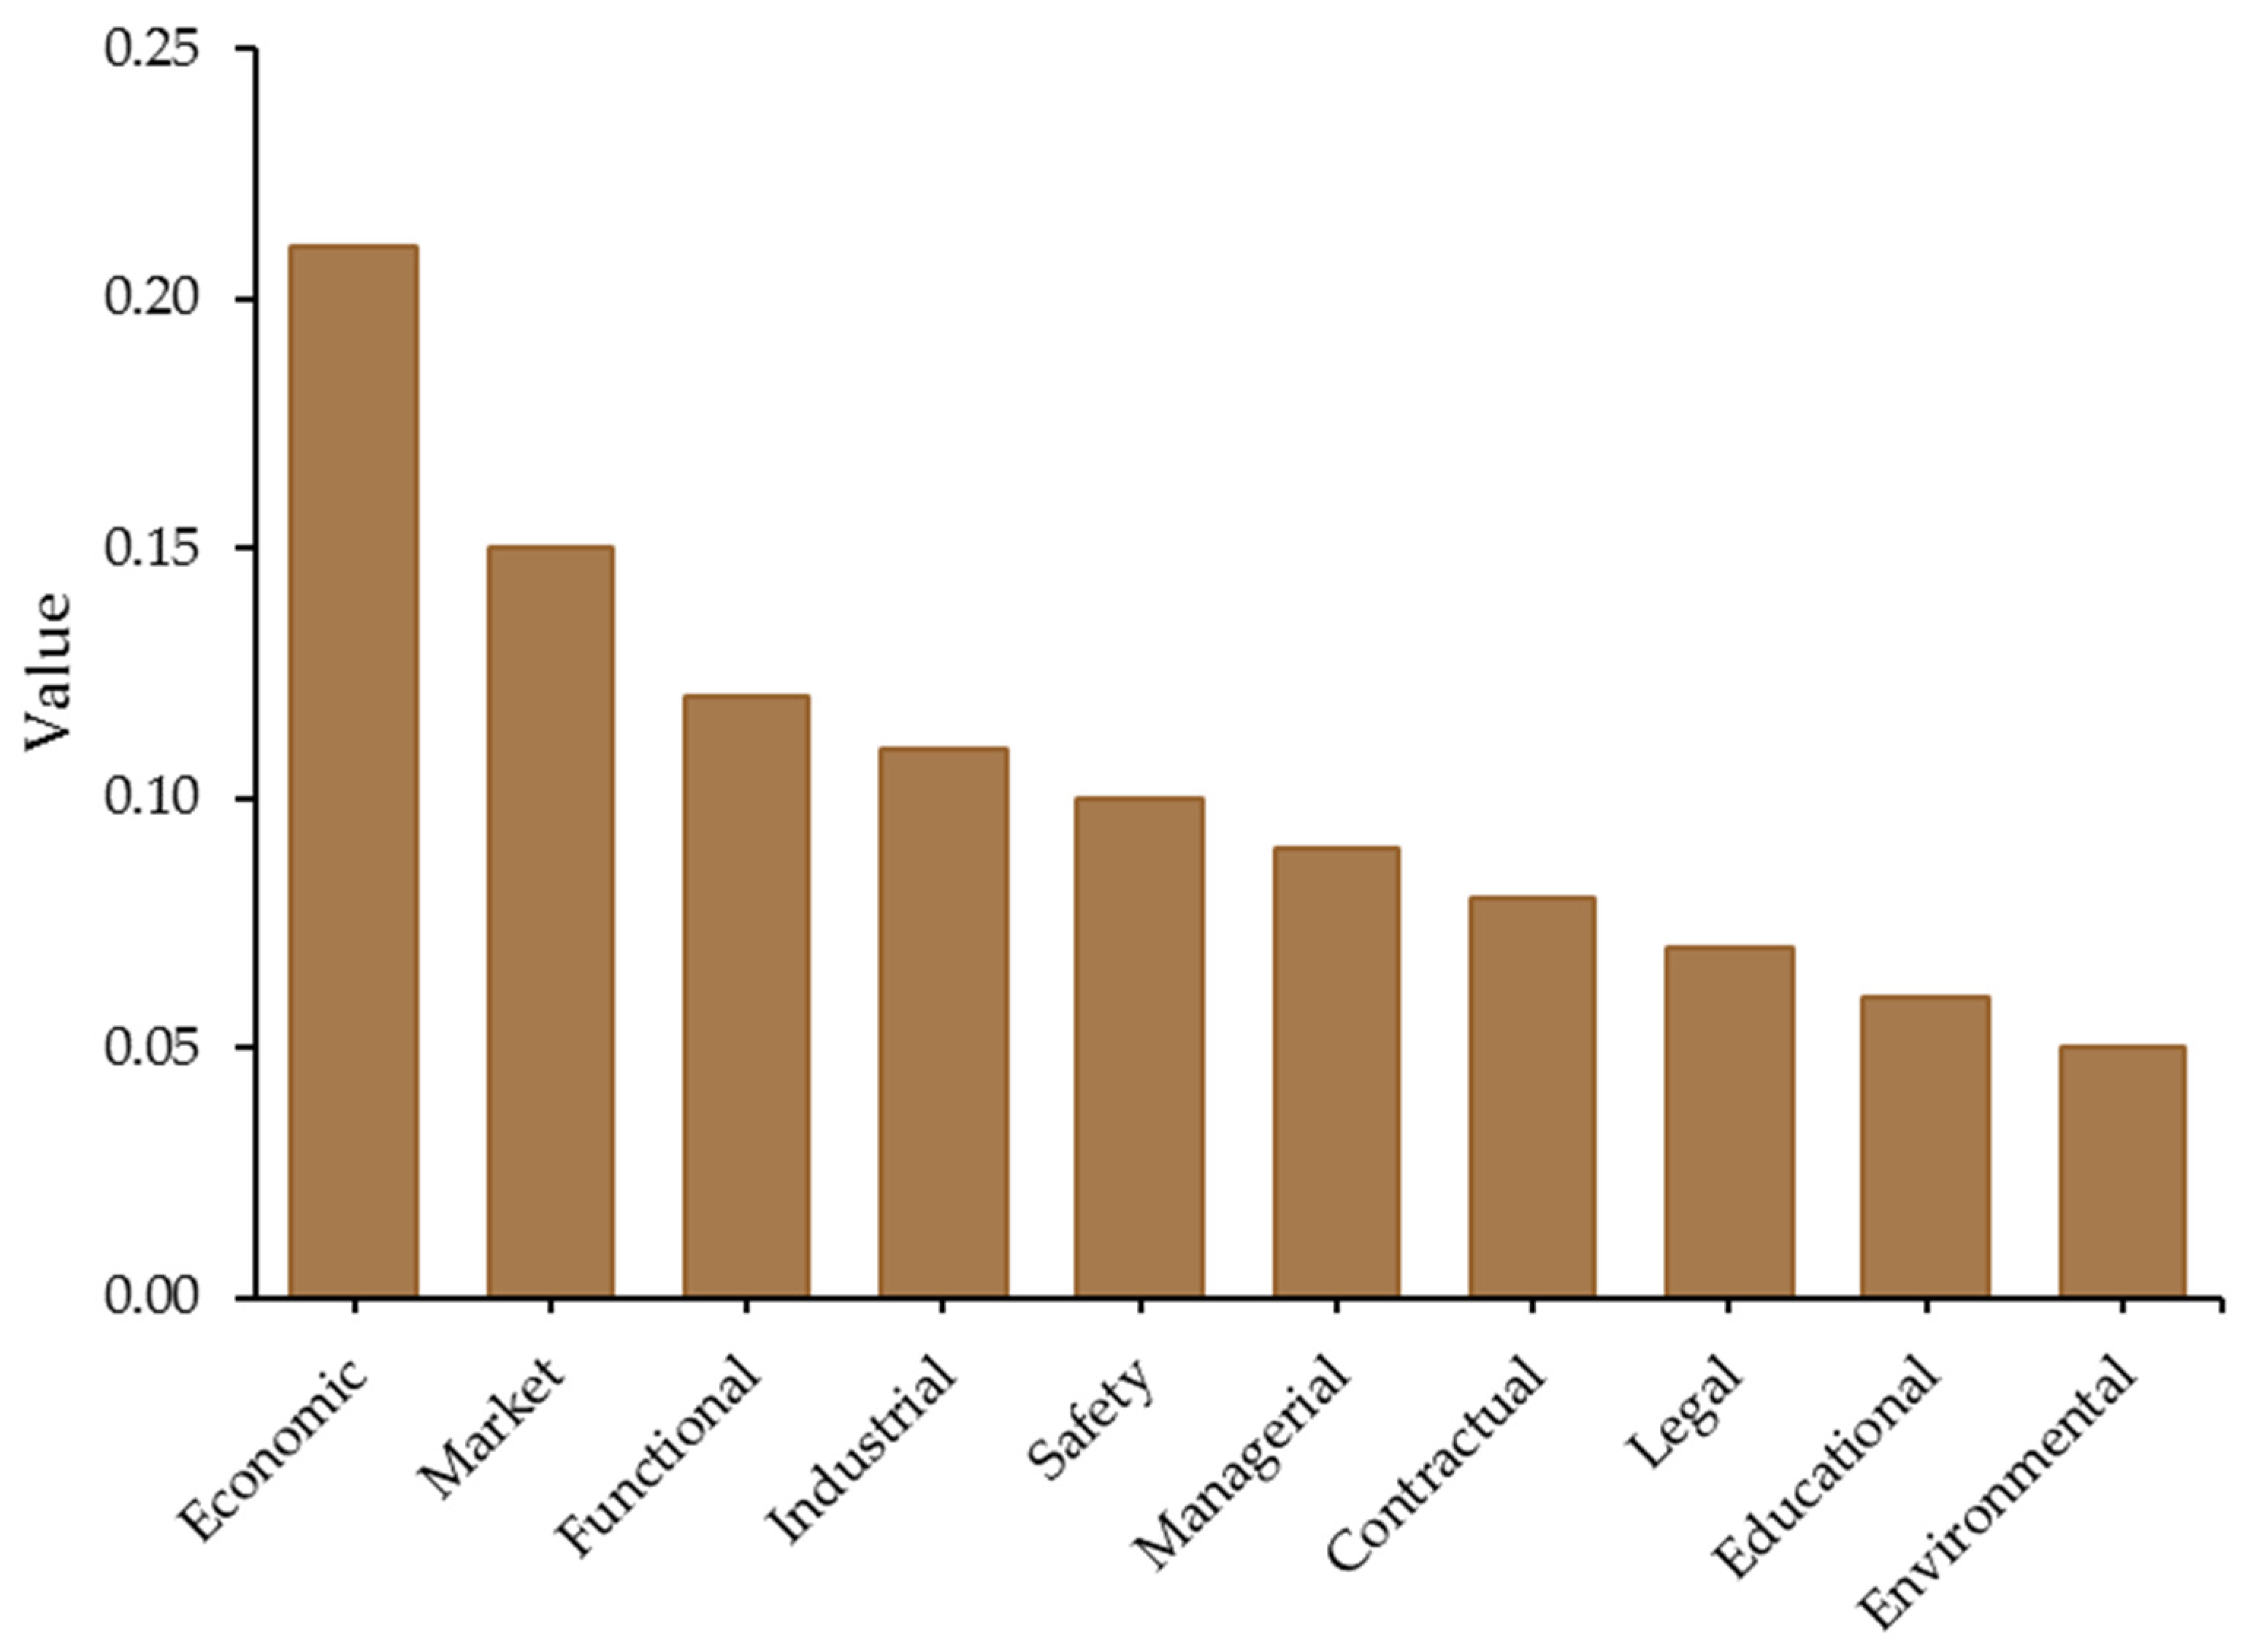
Following the derivation of fuzzy weights using the FAHP methodology, the defuzzified and normalized values were calculated to obtain the final priority ranking of the ten identified risk categories. These priorities reflect the relative importance of each risk factor in the context of green building development, as evaluated by domain experts through structured pairwise comparisons (
Figure 4).
As shown in the table, economic risk was ranked the highest, with a priority weight of 0.20. This result indicates that cost-related uncertainties, such as inflation, financing issues, and fluctuating material prices, are perceived as the most critical obstacles in sustainable construction projects—particularly in data-scarce and fast-developing environments like Shenzhen. The prominence of economic risk aligns with the existing literature, where financial instability is repeatedly cited as a major barrier to green building implementation. The market risk, ranked second with a weight of 0.15, suggests that market-related factors—including demand uncertainty, customer acceptance, and market incentives—play a vital role in determining the success or failure of green initiatives. The elevated position of both economic and market risks highlights the strong interdependence between financial feasibility and market viability in the green building sector. Functional and industrial risks followed closely, ranked third and fourth, respectively. These categories relate to the operational capabilities and technical challenges of implementing green technologies in existing or new infrastructures. Their relatively high positions emphasize the need for risk mitigation strategies that address system performance, technology compatibility, and design adaptability. Safety and managerial risks were ranked mid-range, suggesting moderate but non-negligible influence. While safety remains a foundational concern in all construction projects, its slightly lower ranking may reflect the assumption that conventional safety protocols are already in place and are less volatile in green-specific scenarios. Interestingly, environmental risk was ranked the lowest, with a weight of 0.05. This may appear counterintuitive, given that green buildings are fundamentally about environmental sustainability. However, the environmental concerns are well integrated and less uncertain compared to financial or operational risks, or the experts perceive them as secondary outcomes rather than direct risk drivers in the project lifecycle.
While this study focuses on Shenzhen, the findings align closely with results reported in other geographic contexts. Zhao et al. [
22] investigated green building projects in Singapore using fuzzy synthetic evaluation and found that economic, time-related, and technological uncertainties were among the most critical risks affecting project success. These observations are consistent with the present study, where economic, market, and functional risks emerged as the highest-priority factors influencing cost, time, quality, and scope. Such convergence suggests that the identified risk patterns are not unique to Shenzhen and may reflect common challenges in sustainable construction across different urban environments.
3.3. Risk Impact Simulation Dataset
Due to the limited availability of real-world risk data in the context of green building projects—particularly in emerging urban environments such as Shenzhen—a synthetic dataset was constructed to support predictive modeling. This simulation-based dataset was derived from expert evaluations, designed to reflect how prioritized risks influence key project performance indicators. A second-round structured questionnaire was developed following the completion of the FAHP analysis. In this phase, the ten previously identified and weighted risk categories (e.g., economic, safety, market, etc.) were used as the basis for eliciting expert judgments on their impact across four critical project dimensions: cost, time, quality, and scope. The experts were asked to evaluate the magnitude of each risk’s potential effect on these dimensions using a standardized 5-point Likert scale, ranging from 1 (very low impact) to 5 (very high impact).
This resulted in a structured matrix, where each row represents a risk category, and each column represents one of the four project impact variables. The values in the matrix represent the aggregated average impact scores provided by the expert panel for each risk–dimension pairing. A sample of this matrix is presented in
Table 4.
Each cell in the matrix reflects expert-derived fuzzy comparisons between project objectives using a triangular fuzzy scale, capturing linguistic assessments such as “moderately more important” or “strongly more important”. The structure of the matrix adheres to the fuzzy AHP principles, representing each judgment with a triplet (l, m, u), where, l = lower bound (pessimistic view), m = most likely judgment (modal value), u = upper bound (optimistic view).
The matrix was then defuzzified using the centroid method and normalized to extract priority weights of the four dimensions. The results of this analysis reveal insightful trends. Based on the aggregated fuzzy scores, quality and scope emerged as the most critical project objectives, with strong perceived interdependence. For instance, quality was rated higher than cost across all comparison sets, with fuzzy values reaching up to (1.20, 1.50, 1.90). Cost, while essential, was generally perceived as slightly less dominant in comparison with scope and quality. This suggests a shift in stakeholder priorities in green building projects—away from purely economic optimization, and toward quality-driven performance. Time received moderate importance but showed high correlation with both scope and quality. The values indicate that timely delivery is important but is often considered to be more flexible in trade-off decisions when compared with quality assurance.
These findings confirm the qualitative insight that green building projects prioritize long-term sustainability, functionality, and stakeholder value over short-term cost savings or rigid scheduling. The output from this matrix directly supports the weighting strategy used in training the MLP model, aligning the objective priorities with impact predictions. Moreover, the results reinforce the validity of using the FAHP in multi-objective decision contexts where priorities are nuanced, interdependent, and uncertain.
To ensure the reliability of the expert input, Cronbach’s alpha was computed to assess internal consistency among the Likert-scale responses. The resulting value of 0.83 confirmed strong coherence in the expert evaluations, thereby validating the use of the aggregated ratings for subsequent analysis. This simulation dataset served as the output training target in the ML model. While the FAHP weights were used as the model’s input features, the four performance impact scores were treated as target outputs in a learning setup.
3.4. MLP Model for Risk Prediction
To model and predict the influence of critical risk categories on green building project performance, an MLP-NN was developed. The model was trained using a simulation-based dataset derived from expert evaluations. The ten initial risk categories identified through the FAHP were narrowed down to the top five highest-priority risks—economic, functional, market, industrial, and safety—based on their normalized weight scores. Each of the four main project objectives—cost, time, quality, and scope—was treated as a separate output variable. For each objective, the MLP was trained using expert-derived Likert-scale scores that represented the relative impact of each risk on that specific dimension. The goal was to capture and generalize the complex, nonlinear relationships between risk profiles and project outcomes. The MLP architecture consisted of an input layer with five neurons, two hidden layers using ReLU activation, and an output layer with four neurons representing each performance dimension. The model was trained using a supervised learning approach, with MSE as the loss function and the Adam optimizer for convergence. A dropout layer was added to prevent overfitting, due to the small synthetic dataset.
Table 5 displays the normalized predictive results of the MLP for each performance dimension. Each block within the table corresponds to the relative influence of the five selected risks on one project objective. The structure follows a fuzzy-based pairwise comparison format, which enables a clearer understanding of how much each risk outweighs others in contributing to potential delays, budget overruns, quality issues, or scope changes.
Economic risk exerts the strongest influence on cost, as expected. Its dominance is apparent in all comparisons (e.g., economic > functional at 1.50–1.90–2.35). However, market and safety risks also show relatively high influence, particularly market risks (e.g., market > functional: 1.15–1.60–2.20). The highest influence is again from economic risk, followed by market and functional risks. Interestingly, industrial risk plays a strong role in this dimension too, with scores like 1.25–1.70–2.15 when compared with functional risk. The effect of functional and market risks is significant in driving project quality, often surpassing that of economic risk. Functional > economic is observed in some cases (1.10–1.50–1.90), suggesting that managerial and technical aspects contribute heavily to perceived quality. The scope performance appears more sensitive to functional and market risks. Functional > market comparisons suggest that functional adaptability and team experience are more likely to disrupt or extend projects’ scope. These MLP-derived patterns align well with the FAHP-based priority results, validating both the feature selection process and the model’s generalization capability.
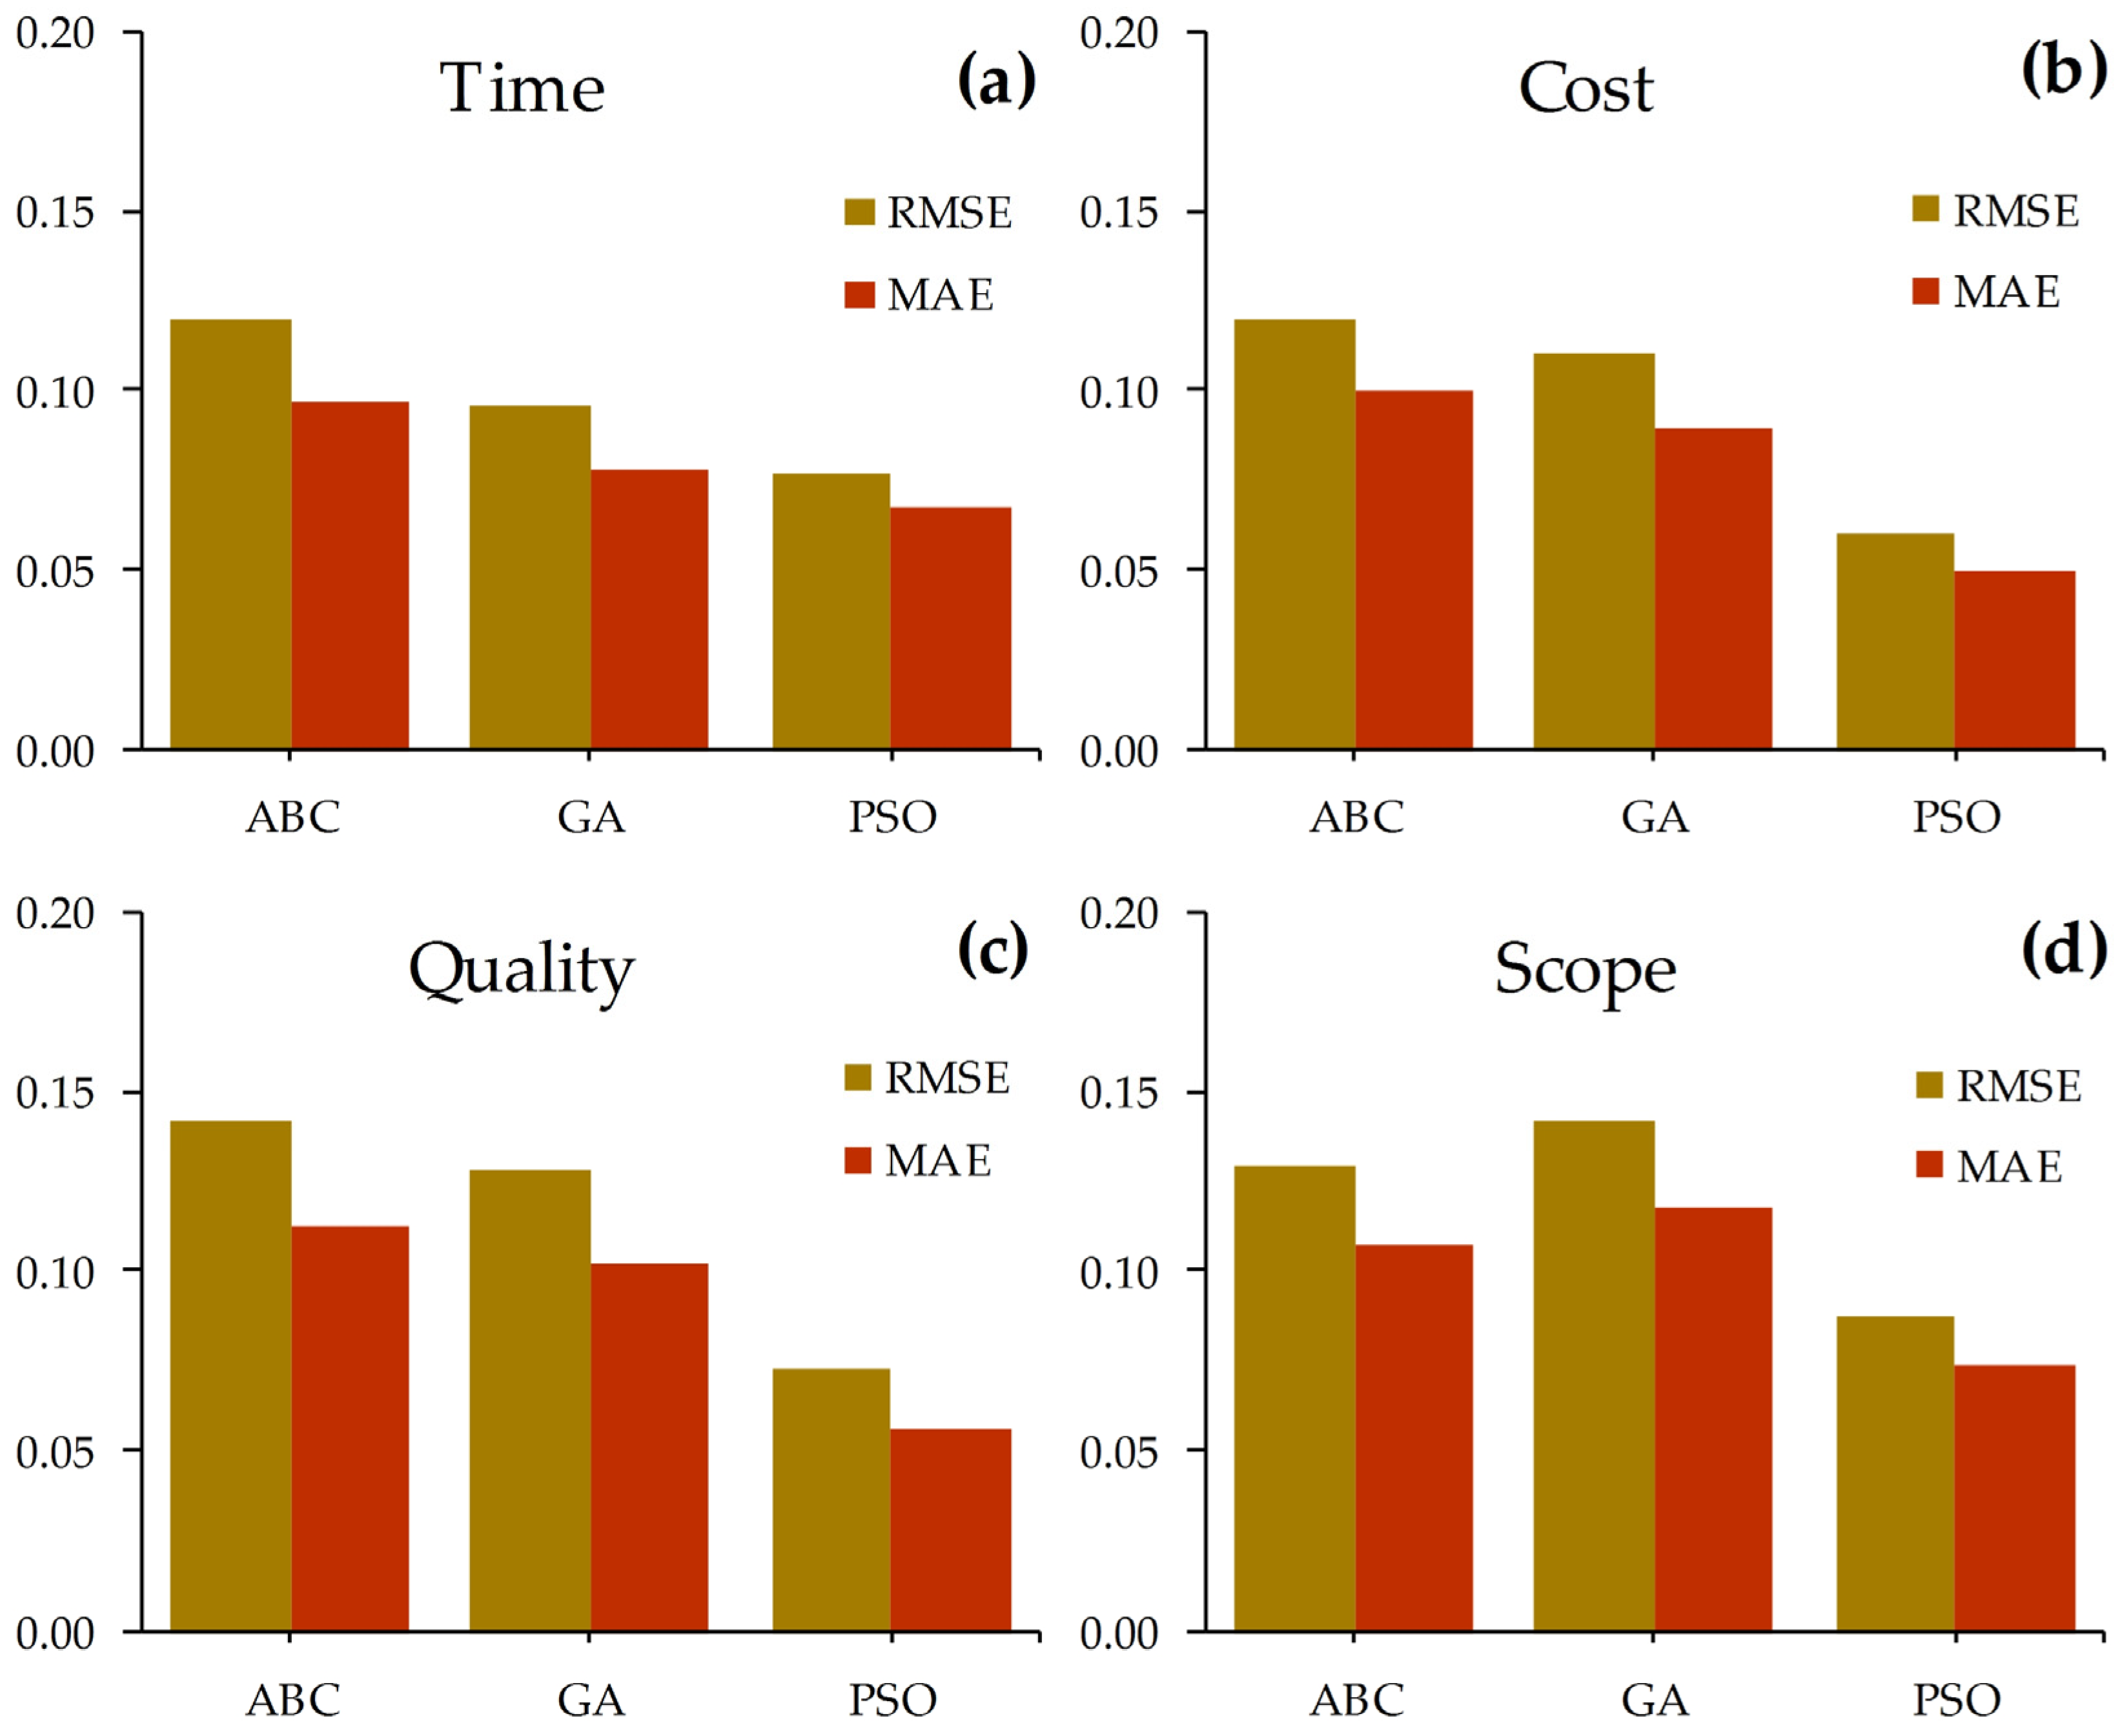
3.5. Comparison of Optimization Algorithms
This section presents the comparative analysis of different optimization techniques—PSO, GA, and ABC—integrated with the MLP to predict the impact of risk categories on green building project performance criteria. The objective is to determine which hybrid model delivers the most accurate and generalizable predictions based on key evaluation metrics.
To derive these metrics, expert-driven data were initially collected using structured questionnaires focusing on risk prioritization in green building projects. The responses were then processed using the FAHP to determine the relative weights of ten risk categories. Subsequently, these qualitative outputs were quantified using a Likert scale and averaged across respondents. To ensure consistency and comparability across dimensions, all inputs were normalized via min–max normalization before being used in MLP training. Each hybrid model (MLP–PSO, MLP–GA, and MLP–ABC) was evaluated based on its performance in predicting four key project dimensions: cost, time, quality, and scope (
Table 6).
Compared to previous studies, such as the work of Zhao et al. [
22], which applied fuzzy synthetic evaluation to rank risks qualitatively, the present study extends the methodology by the combination of ML and metaheuristic optimization. While Zhao et al.’s framework improved the clarity of risk prioritization, it did not provide predictive modeling of impacts on project performance criteria such as cost, time, quality, and scope. In contrast, the hybrid FAHP–MLP–PSO approach generated quantitative forecasts with high predictive accuracy, achieving RMSE as low as 0.06–0.09 and R
2 values of up to 0.95 across the four performance dimensions. This demonstrates a substantial methodological advancement, as our model structures expert input and translates it into actionable predictions.
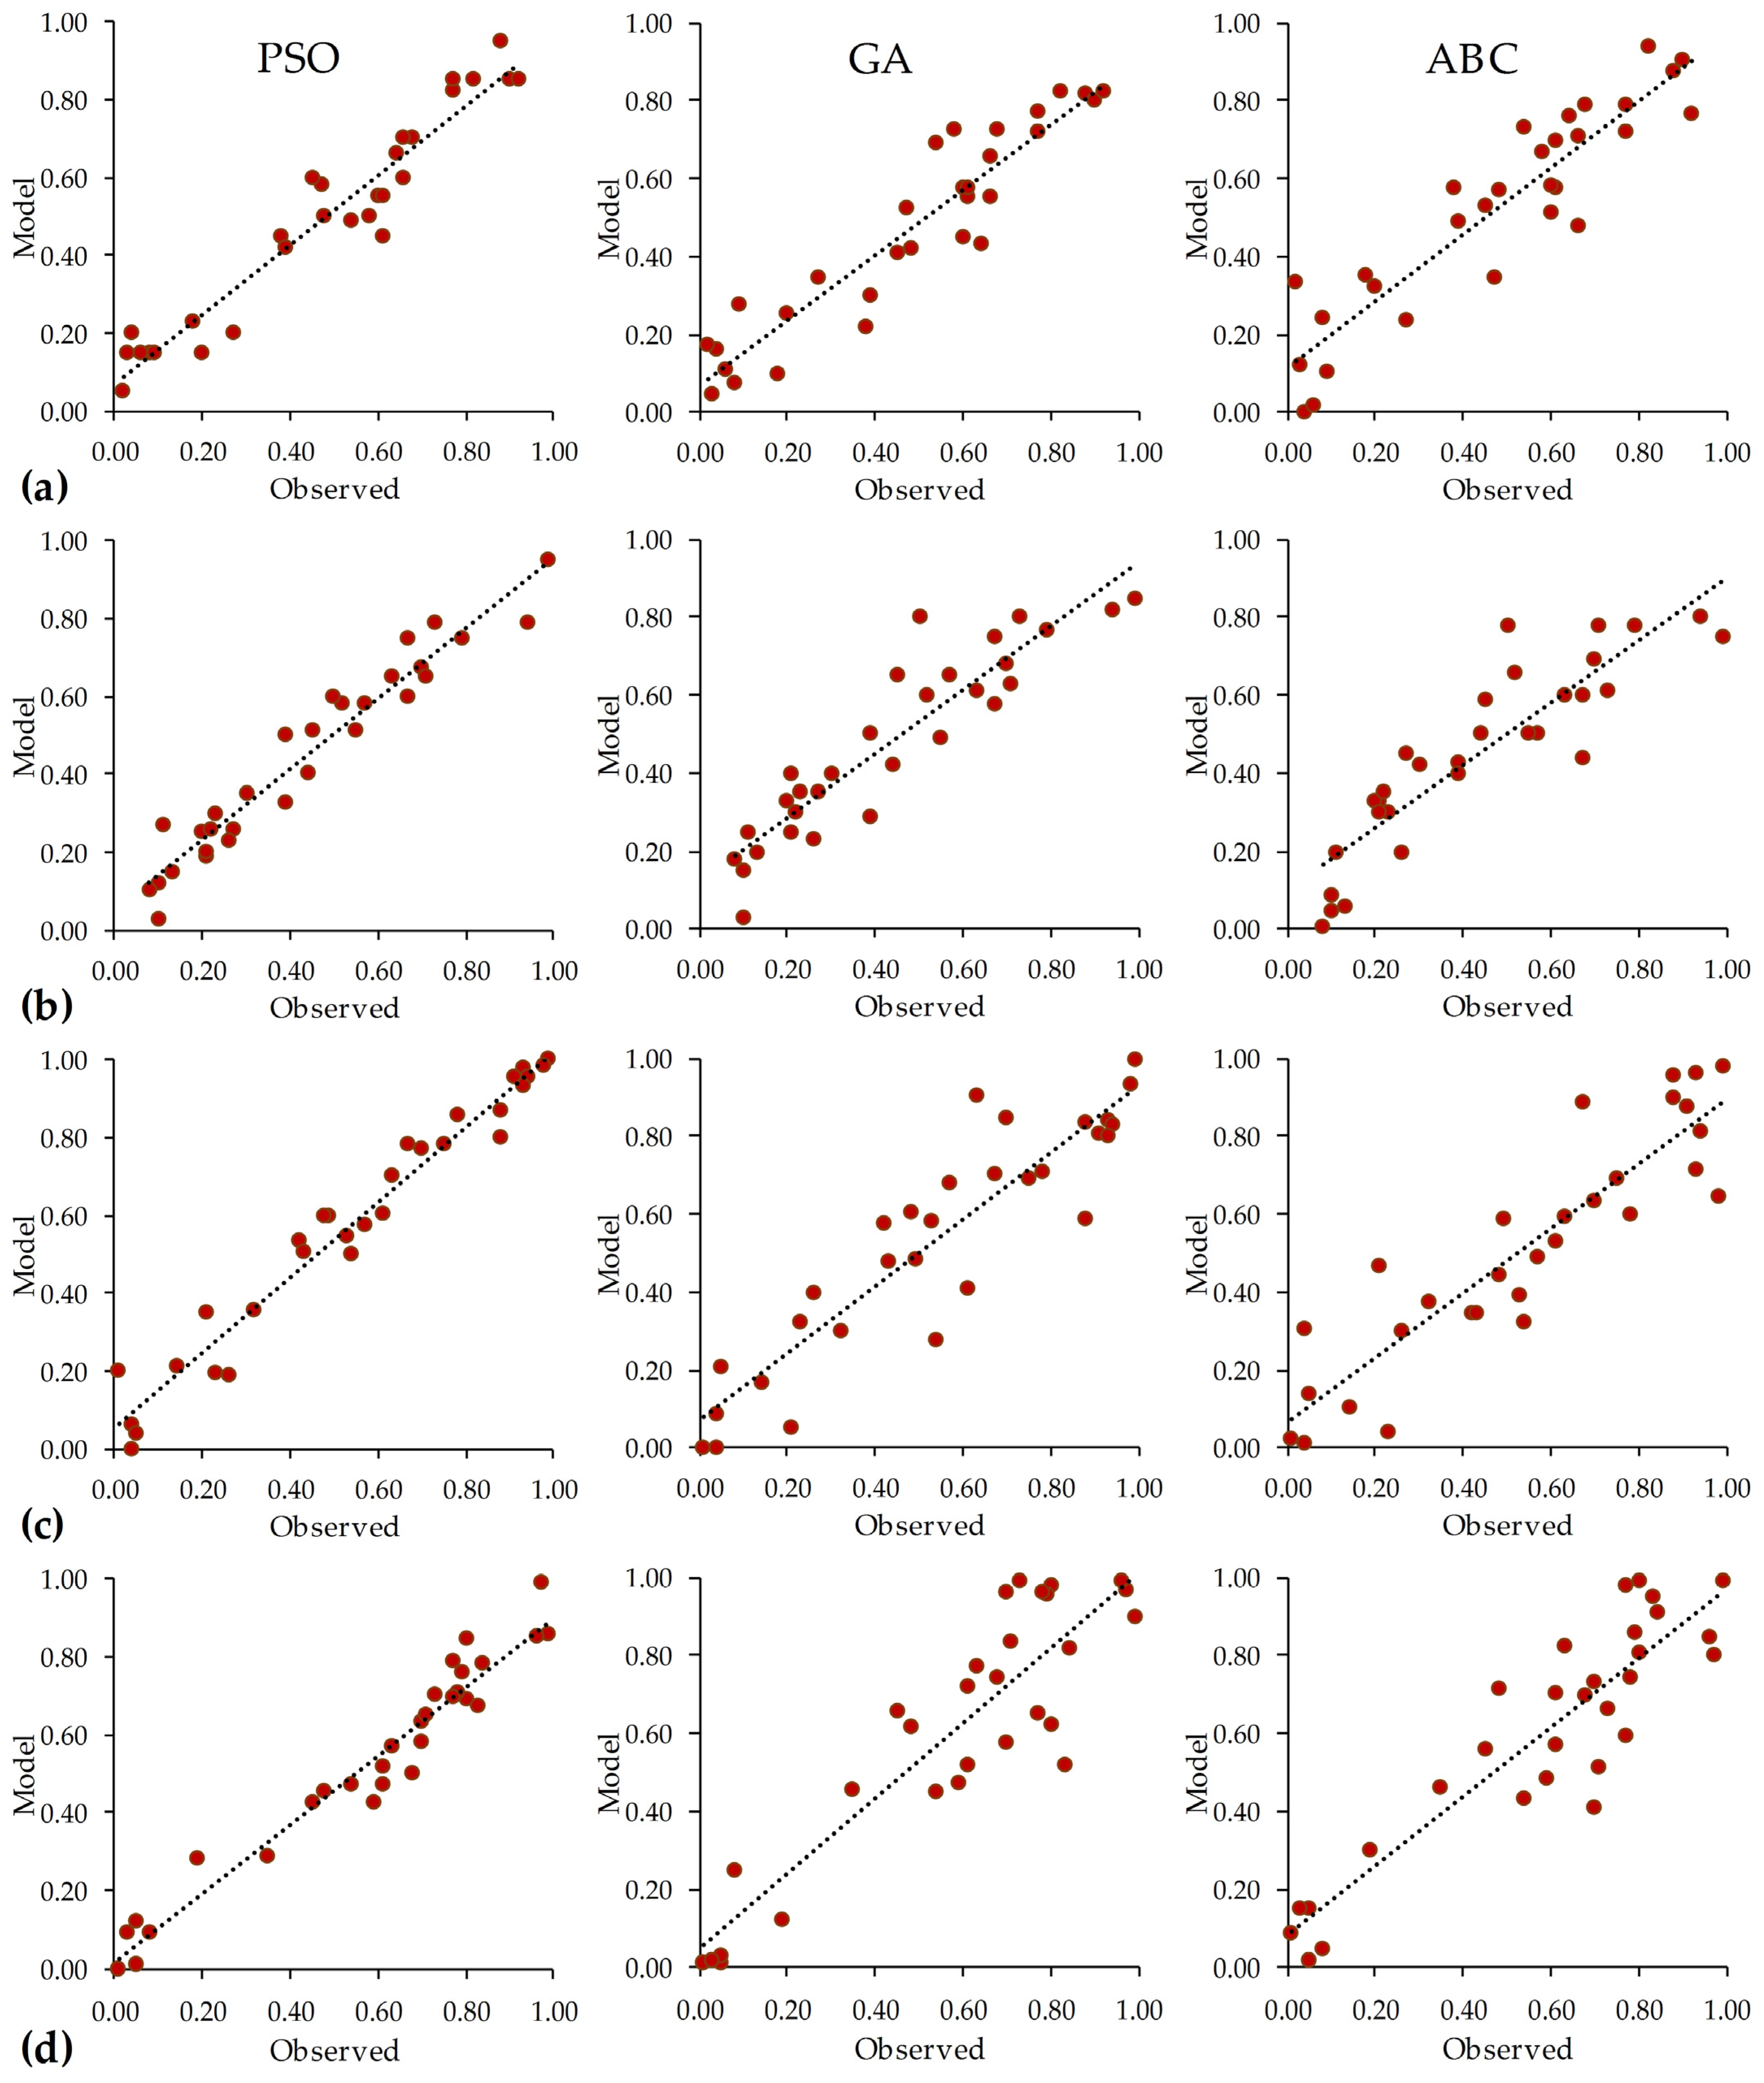
As observed from
Table 6, the MLP–PSO model consistently outperformed the other two hybrid models across all four performance dimensions. Specifically, it achieved the lowest RMSE and MAE values, reflecting minimal prediction error (
Figure 5), and the highest R
2 scores, indicating a strong correlation between the predicted and observed values (
Figure 6).
In comparison with traditional fuzzy synthetic evaluation methods and purely descriptive approaches previously used in green building risk assessment, this hybrid framework demonstrates significantly enhanced predictive accuracy and systematic optimization capability. Specifically, the combination of PSO and MLP modeling allows for dynamic learning of risk–performance relationships, which was not addressed in prior studies relying only on static scoring or ranking techniques. In this regard, Liu et al. [
54] developed a PSO–SVM hybrid model to predict safety risks in metro station construction, achieving over 90% prediction accuracy despite a limited dataset derived from expert judgment. This aligns with the present study’s findings, demonstrating that combining ML with metaheuristic optimization effectively captures complex nonlinear relationships in small-sample construction contexts. While Liu et al. [
54] focused on metro design safety risks, the current research extends this paradigm to broader sustainability performance dimensions (cost, time, quality, scope) in green building projects.
The superiority of PSO can be attributed to its efficient exploration–exploitation balance, which allows for the fine-tuning of hyperparameters without premature convergence. This is especially important in risk modeling, where uncertainty and interdependency between variables demand robust optimization strategies. These results confirm that PSO is the most suitable algorithm for optimizing MLP in the context of green building risk impact prediction.
The MLP–GA model ranked second, performing reasonably well but with slightly higher error margins and lower R2 values than PSO. Lastly, the MLP–ABC model showed the weakest performance among the three, particularly in predicting quality and cost, suggesting that its optimization capability was less suited to the nonlinear complexity of the dataset.
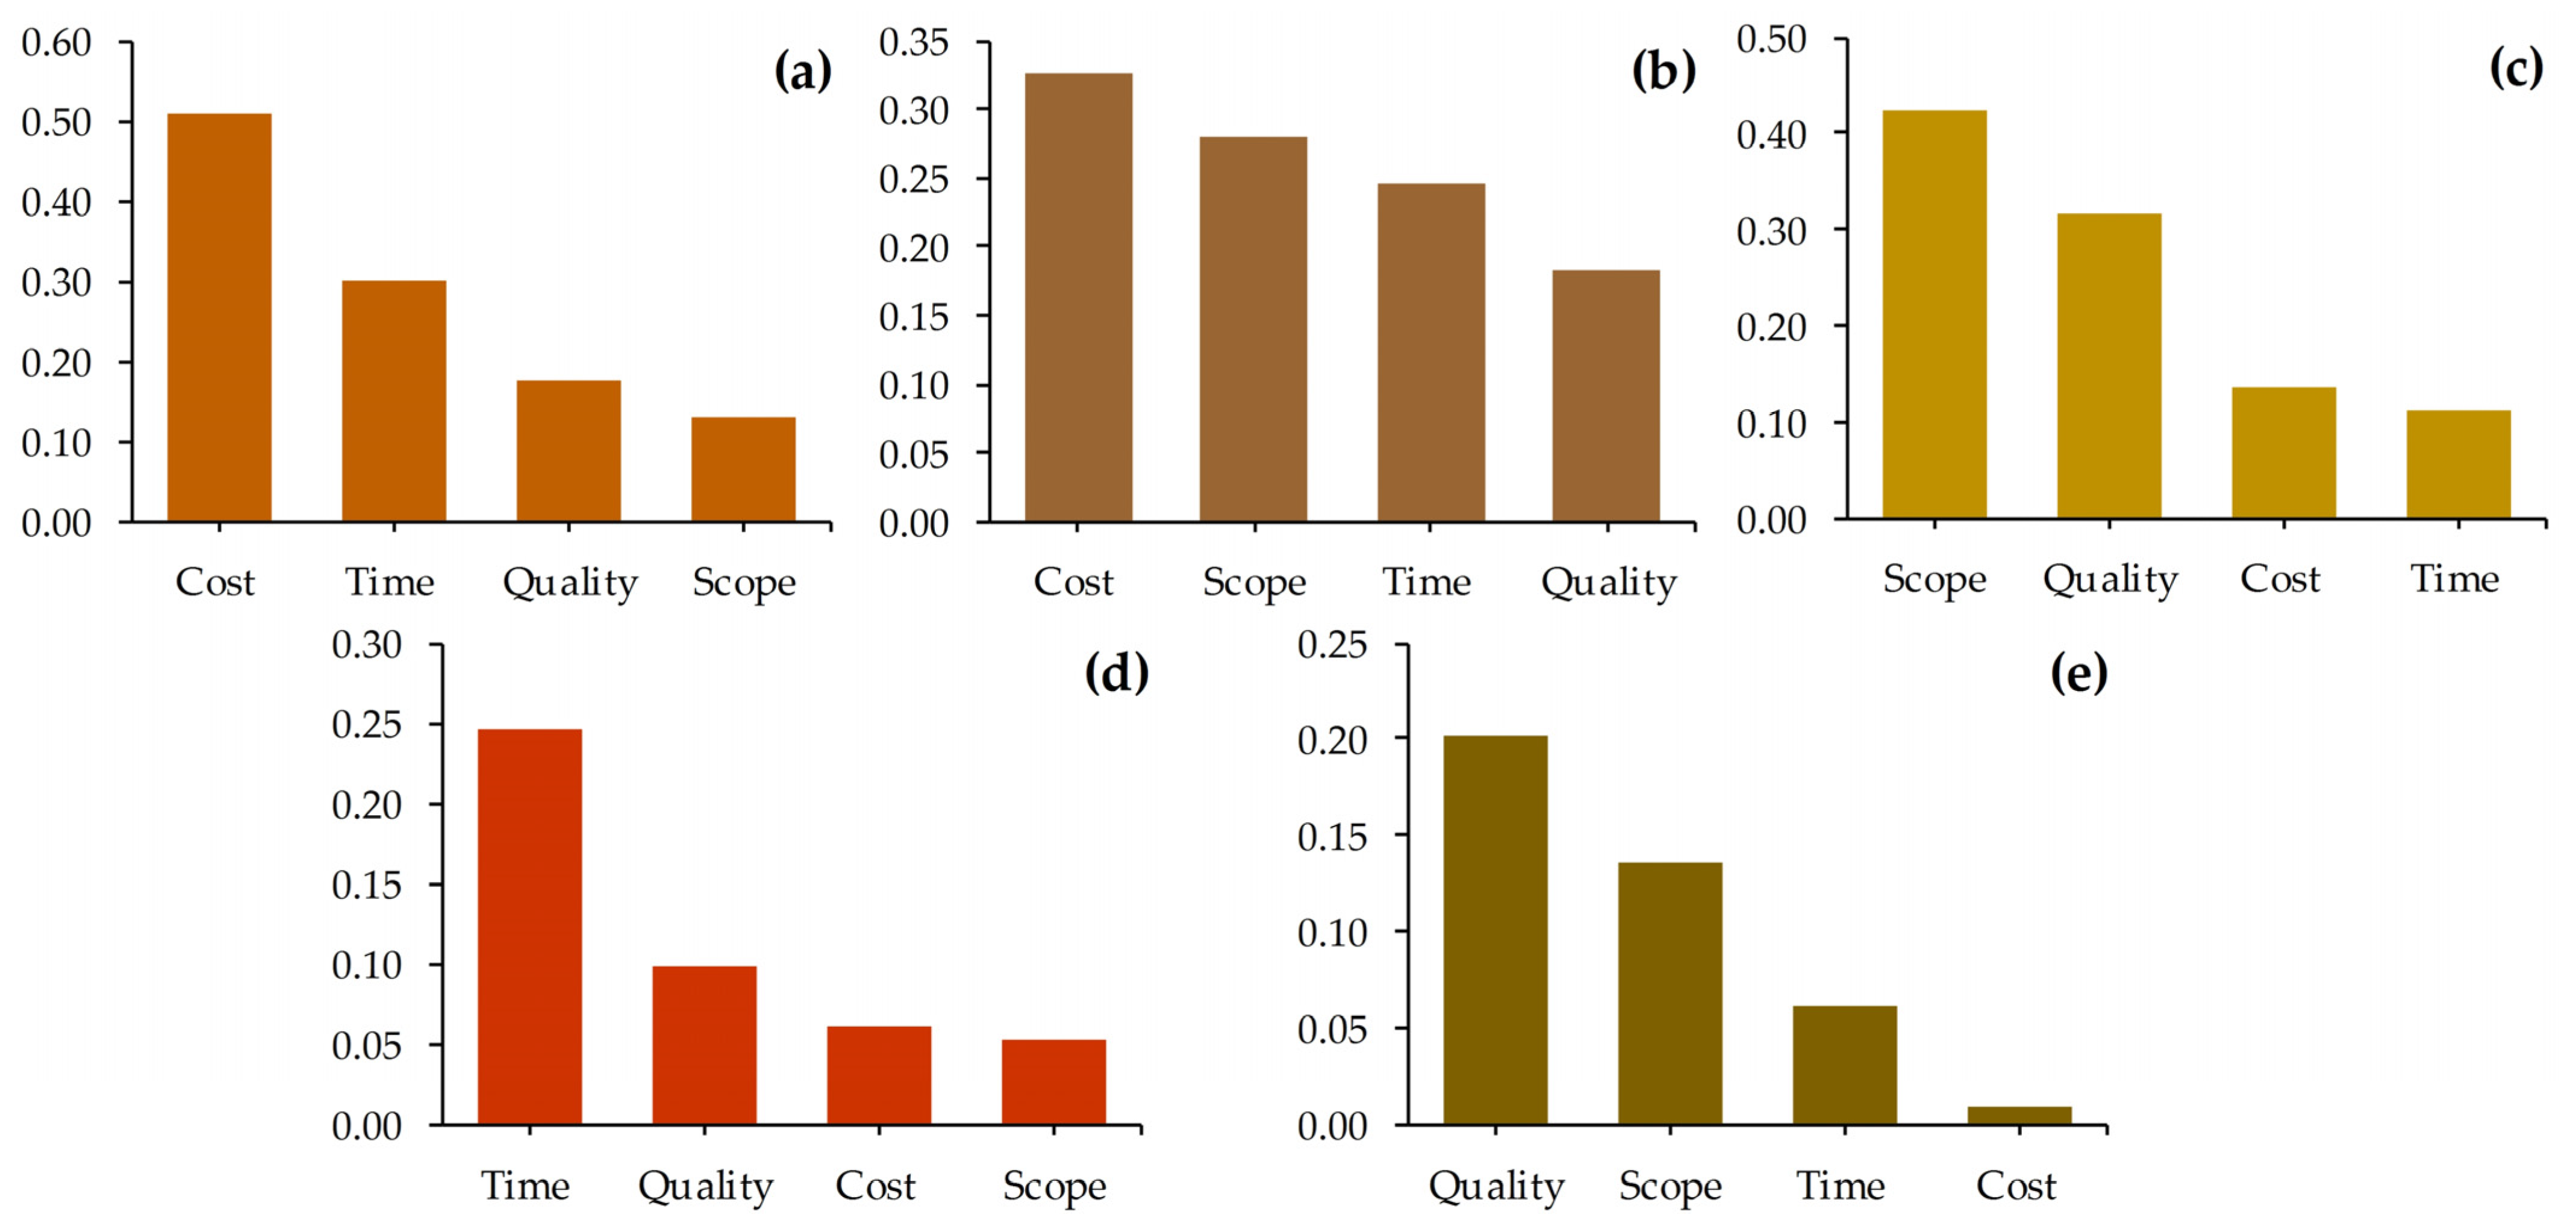
3.6. Optimization with PSO
After PSO, the model showed a notable reduction in average RMSE and improved generalization ability, particularly in the scope and quality dimensions.
Figure 7a–e reflect the optimized output values generated by the final hybrid model (FAHP–MLP–PSO) for the top five high-priority risks (economic, market, functional, industrial, and safety, respectively). Each panel illustrates the relative impact score of the risk on the four project constraints.
Economic risk showed a dominant impact on cost (0.508) and time (0.302), with lower effects on quality and scope. This confirms prior expert opinions and aligns with the FAHP prioritization. PSO fine-tuned the model to reflect this clear dominance by adjusting the weight propagation within the network. Market risk produced a more balanced impact across cost (0.327), scope (0.281), and time (0.246), reflecting the market’s multidimensional influence. Without PSO, earlier iterations of the model had overestimated cost and underestimated scope; this imbalance was corrected post-optimization. This risk category had its strongest effects on scope (0.423) and quality (0.318), highlighting that performance risk primarily affects deliverables and standards. The MLP model initially failed to capture this, but PSO enabled the correction by updating the weight decay and structures. The impact scores for industrial risk were concentrated on time (0.247) and marginally on quality, with minimal influence on cost and scope. PSO allowed the model to identify that industrial delays tend to influence scheduling more than financials. As expected, safety risks heavily influenced quality (0.201) and scope (0.136), with negligible impact on cost (0.01). Interestingly, the model successfully isolated the null cost effect after PSO intervention—an improvement from the pre-optimized model, which had mistakenly attributed cost sensitivity to safety risks.
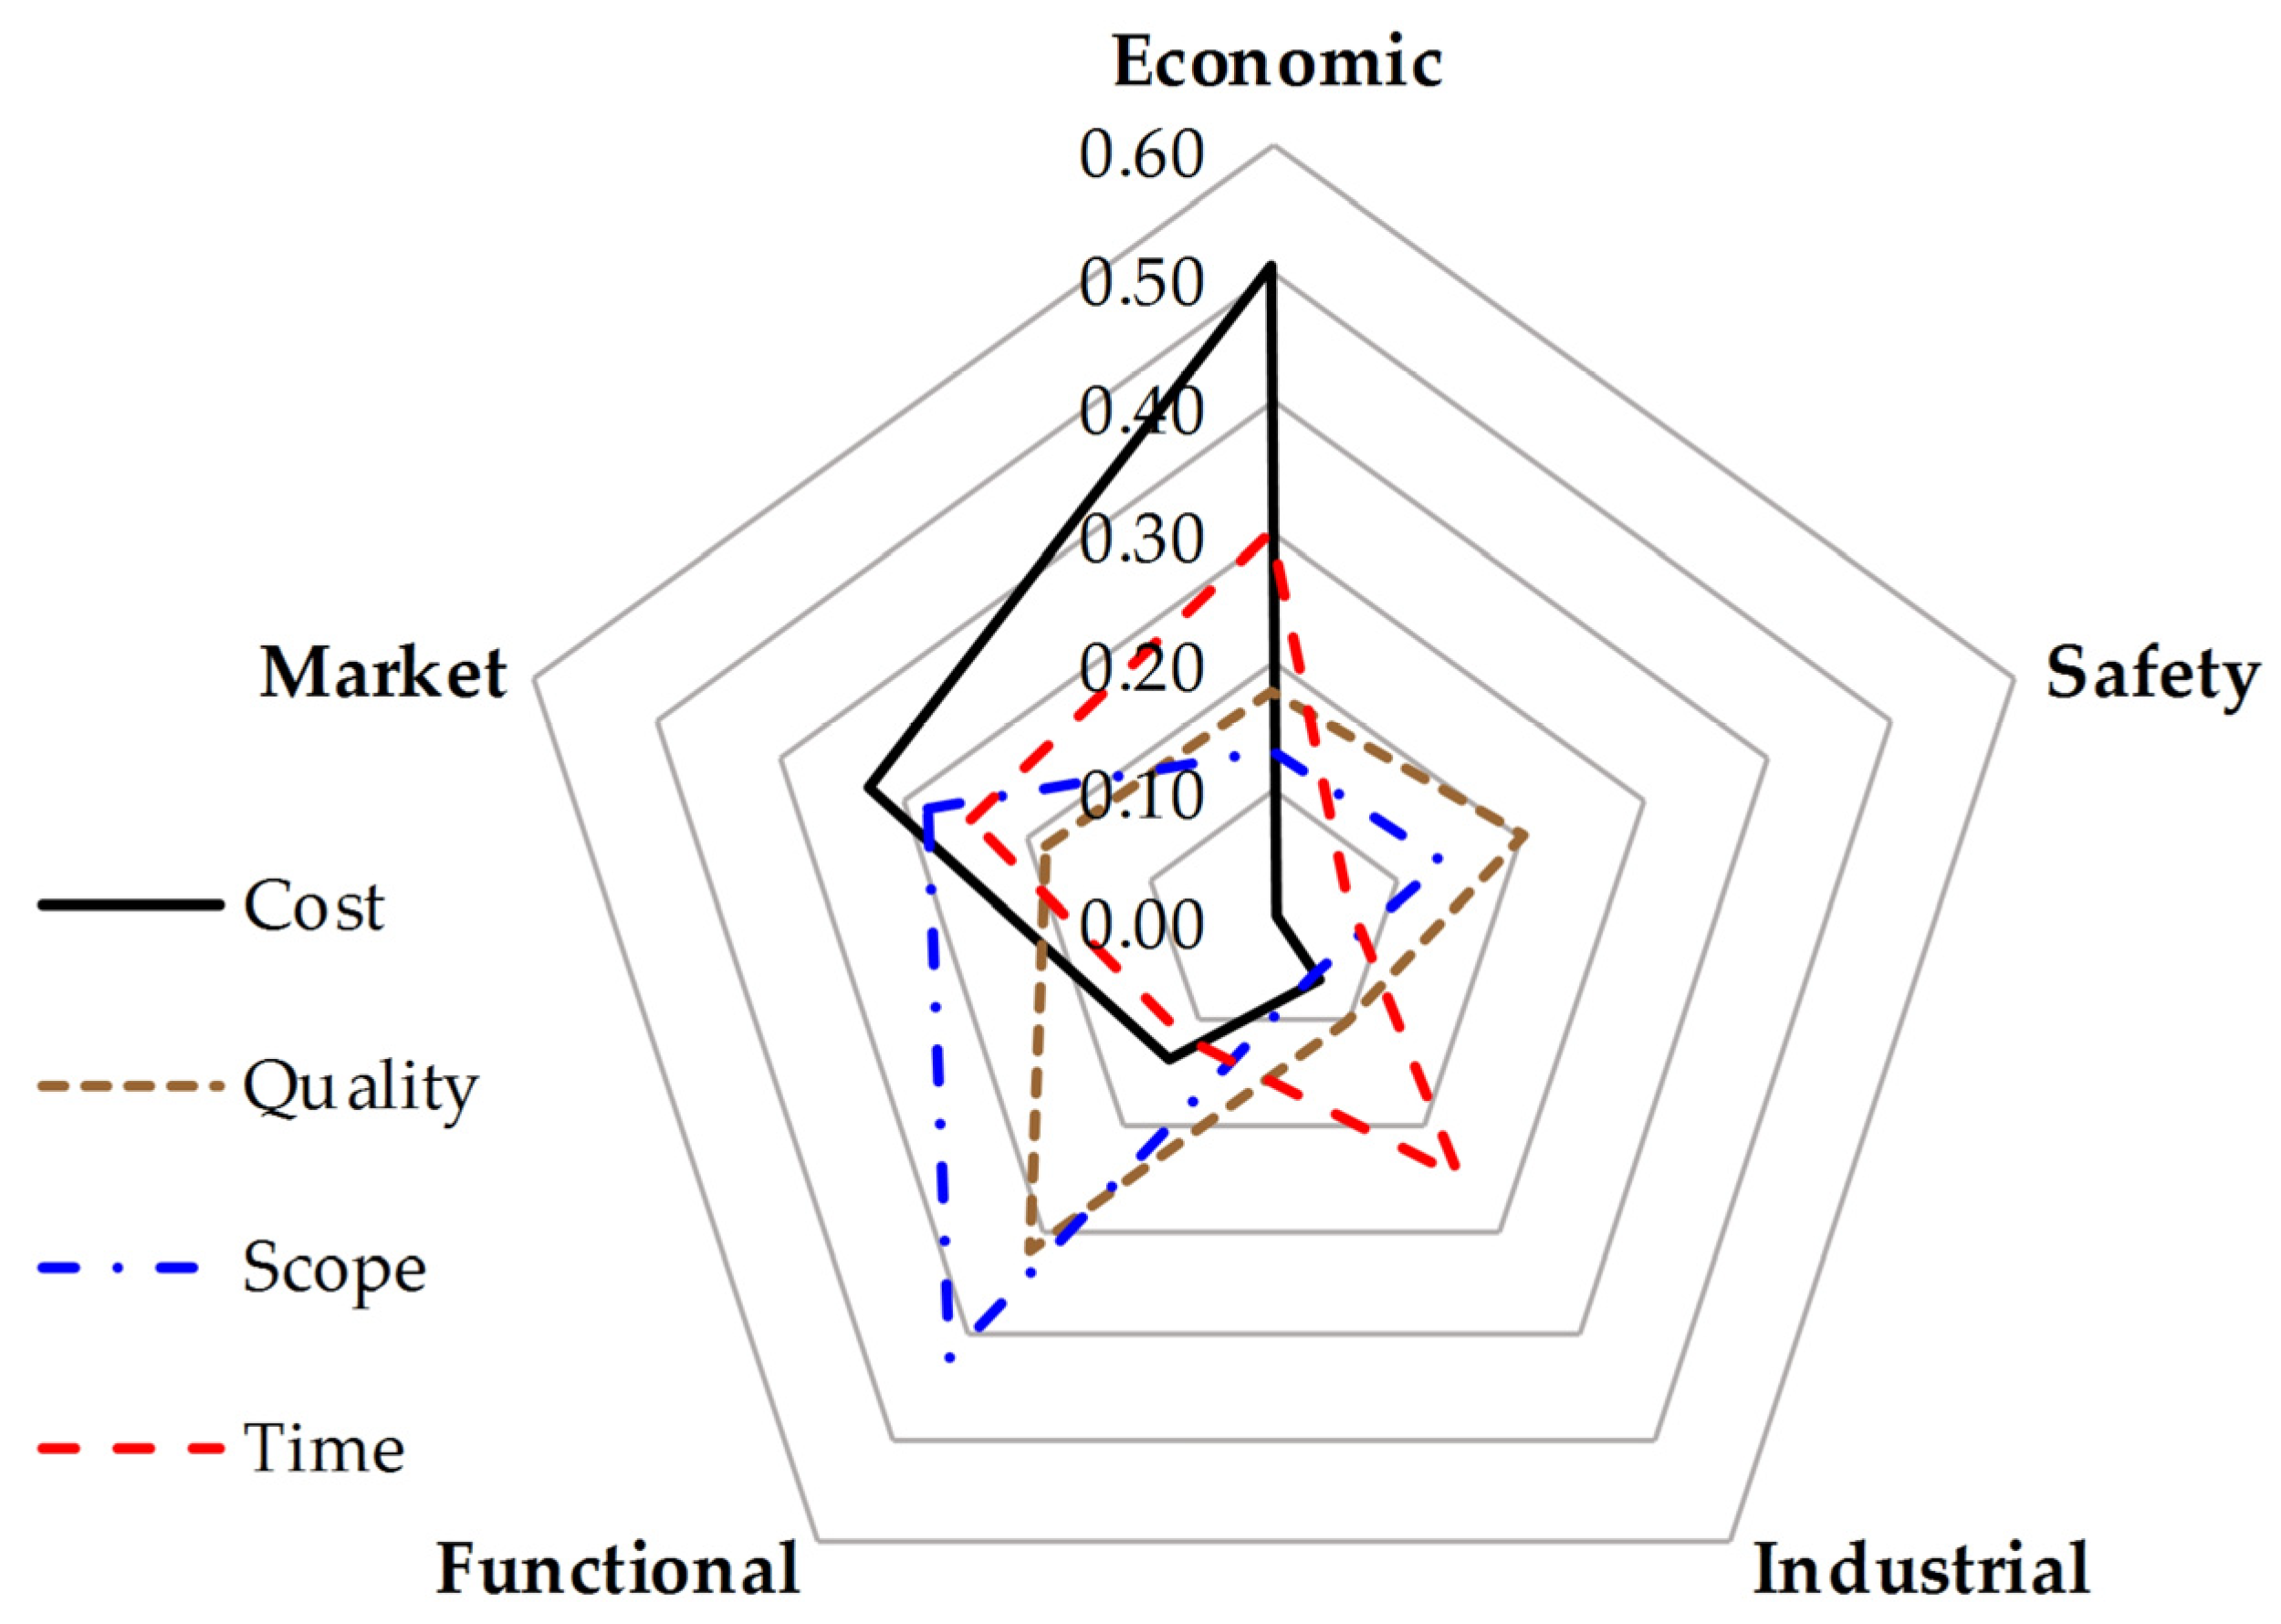
3.7. Cross-Risk Performance Impact Comparison
To provide a multidimensional perspective on how each key project constraint is influenced by the five most critical risks, a series of radar charts were generated (
Figure 8). Each radar plot illustrates the relative sensitivity of one constraint (cost, time, quality, scope) across the prioritized risk categories: economic, market, functional, industrial, and safety.
Economic risk exerts the highest impact on cost, reinforcing its dominant financial influence. Market risk indicates that economic volatility and market instability significantly affect budget performance. Performance and safety risks show modest effects, while industrial risk contributes minimally. Cost mitigation strategies should focus primarily on economic and market conditions. Time constraints are most sensitive to economic risk and market risk, followed by functional and industrial risks.
Functional risk shows the highest impact on quality, followed by safety and market risks. The economic and industrial dimensions show lower influence, suggesting that process control and team competency outweigh financial input in quality assurance. Enhancing quality requires attention to operational performance and safety protocols, rather than budget alone.
Scope performance is mainly affected by performance risk, followed by safety- and market-related risks. Economic and industrial risks are relatively less relevant. Scope changes are highly influenced by design efficiency, stakeholder alignment, and adaptability, and less so by cost factors.
3.8. Limitations, Applicability to Other Contexts, and Future Directions
While this study introduces a robust hybrid risk management framework integrating the FAHP, MLP, and PSO techniques for green building projects, several limitations must be acknowledged. First, the dataset used in training the model was based on expert judgment and simulation, and it comprised a relatively small number of samples (n = 30). While small datasets are sometimes inevitable in risk-sensitive domains like green construction—especially when real-world data are unavailable—this limitation may affect the model’s generalizability and robustness. Although expert-based synthetic data provide valuable insight under data-scarce conditions, they may not fully reflect the stochastic nature and variability present in actual project environments. Second, the study focused on a single geographic region—Shenzhen, China—which, despite being a leading green development hub, may not represent the broader global variability in risk profiles. Consequently, the generalizability of the model’s results to other regions or regulatory environments is somewhat limited. Third, only ten risk categories were considered in this study, and five of them were used for training the ML model. Although these categories were derived from the literature and validated by experts, the inclusion of a broader set of risk dimensions (e.g., political risks, social acceptance, or technological obsolescence) could provide a more comprehensive risk assessment framework. Fourth, the MLP model, while powerful in capturing nonlinearities, is still a black-box approach. Interpretability of the output remains a challenge, and the lack of transparent reasoning behind its predictions may hinder its acceptance among practitioners. Finally, the hybrid FAHP–MLP–PSO framework requires significant technical knowledge and computational resources, which may limit its practical application for small–medium-scale construction firms without data science capabilities. Nevertheless, the modular design of the proposed methodology allows it to be adapted to diverse applications beyond the studied context. Although this study focuses on risk assessment for green building projects in Shenzhen, the proposed FAHP–ML–PSO framework is fundamentally designed as a modular, adaptable approach that can be applied to other contexts. The FAHP can be used to capture and formalize expert judgment in any domain where risks are assessed under uncertainty. Similarly, the MLP model and metaheuristic optimization are domain-agnostic tools capable of learning nonlinear relationships between risk factors and outcomes, provided that relevant training data are available. However, to transfer the methodology to different geographic regions, industries, or project types, it is necessary to reconfigure the input risk categories, collect new expert evaluations reflecting local conditions, and retrain the predictive model accordingly. The external validity and predictive performance of the framework in other contexts will depend on the quality and representativeness of the new input data. The absence of comparative performance evaluation limits the ability to determine whether the hybrid MLP–PSO model provides superior predictive accuracy relative to alternative machine learning approaches. Future research should address this gap by conducting systematic benchmarking studies to assess the advantages and trade-offs of different algorithms in similar risk assessment contexts. Moreover, external validation using real-world project datasets from diverse regions is recommended to further confirm the robustness and generalizability of the findings. Despite these considerations, the general structure of the methodology enables its extension to a wide range of decision-making scenarios involving complex and uncertain risks.
To address these limitations, we make the following recommendations for future studies:
Real-world project data should be collected and incorporated in order to validate and refine the predictive accuracy of the proposed model.
The scope of the study should be expanded to include multi-region or cross-country analyses to enhance generalizability.
Additional risk categories and sub-factors should be integrated to reflect the evolving challenges in green building.
Interpretable ML models or hybrid explainability methods (e.g., SHAP or LIME) should be employed to improve the transparency of the results.
User-friendly decision-support systems based on the proposed framework should be developed to improve accessibility for non-technical stakeholders.


