Article

Reframing Smart Campus Assessment for the Global South: Insights from Papua New Guinea

1
School of Architecture and Built Environment, Queensland University of Technology, 2 George Street, Brisbane, QLD 4000, Australia
2
School of Civil and Environmental Engineering, Queensland University of Technology, 2 George Street, Brisbane, QLD 4000, Australia
*
Author to whom correspondence should be addressed.
Sustainability 2025, 17(14), 6369; https://doi.org/10.3390/su17146369
Submission received: 31 May 2025 / Revised: 4 July 2025 / Accepted: 9 July 2025 / Published: 11 July 2025

Abstract

Higher-education institutions are increasingly embracing digital transformation to meet the evolving expectations of students, academics, and administrators. The smart campus paradigm offers a strategic framework for this shift, yet most existing assessment models originate from high-income contexts and remain largely untested in the Global South, where infrastructural and technological conditions differ substantially. This study addresses this gap by evaluating the contextual relevance of a comprehensive smart campus assessment framework at the Papua New Guinea University of Technology (PNGUoT). A questionnaire survey of 278 participants—students and staff—was conducted using a 5-point Likert scale to assess the perceived importance of performance indicators across four key dimensions: Smart Economy, Smart Society, Smart Environment, and Smart Governance. A hybrid methodology combining the Best–Worst Method (BWM) and Public Opinion (PO) data was used to prioritise framework components. The research hypothesises that contextual factors predominantly influence the framework’s relevance in developing countries and asks: To what extent is the smart campus assessment framework relevant and adaptable in the Global South? The study aims to measure the framework’s relevance and identify contextual influences shaping its application. The findings confirm its overall applicability while revealing significant variations in stakeholder priorities, emphasising the need for context-sensitive and adaptable assessment tools. This research contributes to the refinement of smart campus frameworks and supports more inclusive and responsive digital transformation strategies in developing country higher education institutions.

1. Introduction and Background

In recent years, the concept of the smart campus has gained increasing traction as higher-education institutions seek to respond to the demands of digital transformation. With the proliferation of emerging technologies such as artificial intelligence, the Internet of Things (IoT), and big data analytics, universities are under growing pressure to modernise their infrastructure, teaching models, and governance systems. While numerous frameworks have been developed to guide this transformation, most originate in high-income countries and are rarely tested in resource-constrained contexts. This imbalance raises critical questions about the transferability and contextual relevance of existing models when applied to institutions in the Global South. There is a pressing need to evaluate whether such frameworks are fit for purpose in diverse institutional settings characterised by infrastructural limitations, financial constraints, and varied sociocultural conditions. This study contributes to addressing this gap by examining the applicability of a comprehensive smart campus assessment framework in a developing country context.

1.1. Rise of Smart Campuses in Higher Education

The accelerated advancement of digital technologies such as AI and IoT has significantly influenced diverse sectors, including higher education [1,2,3]. Universities are increasingly adopting these technologies to create smart campuses—digitally connected environments that facilitate efficient operations, personalised learning experiences, and data-informed decision-making. Emerging from smart city discourse, the smart campus concept has evolved as a compact, university-scale application of intelligent urban systems [4,5]. Within academic institutions, IoT technologies have enabled improved infrastructure management, while AI has transformed pedagogical practices and administrative processes [6,7]. This paradigm shift is further reinforced by efforts in educational informatization, where institutions seek to enhance competitiveness, institutional branding, and governance capabilities [8]. The progression from traditional digital campuses to smart campuses is underpinned by big data analytics, integrated information systems, and automated services [9].

1.2. Defining the Smart Campus

At the core of smart campus initiatives is smart education, which transforms digital teaching and learning through the integration of mobile technologies, interactive platforms, AI-enabled systems, gamified learning tools, and augmented reality [10,11]. These innovations have the potential to improve teaching quality and student outcomes while enhancing knowledge management through IoT-based systems [12,13]. A smart campus also contributes to broader institutional goals by promoting liveability, workability, sustainability, and inclusive learning environments [14]. Advances in digital twin technologies allow campuses to visualise and simulate operations in real time, improving security, stakeholder experience, and system optimisation [15,16,17]. Complementary developments, such as intelligent maintenance systems combining computer-based data processing with geographic information systems (GIS), further support operational efficiency [18]. As the higher education sector aligns with Industry 4.0, smart campuses are increasingly viewed as essential for sustainable innovation, data-driven governance, and resilient infrastructure [19,20,21].

1.3. Evolution of Smart Campus Frameworks

Over the past decade, a range of frameworks have emerged to conceptualise and guide the development of smart campuses. Early examples, such as the iCampus and SC2 models, introduced broad, multidimensional structures encompassing governance, environment, mobility, and energy [22,23]. These foundational models were soon followed by approaches such as the Technically Driven Model and the Socio-technical 4DStock framework, which incorporated stakeholder involvement, infrastructure, and user engagement into assessments of energy and system performance [24,25]. The Smart Education Hub further expanded these concepts, integrating elements such as smart learning environments, mobility systems, hybrid instruction, and digital security [26].
More recent innovations introduced modular and ontology-based frameworks that offer structured and scalable components. These include the Smart Campus Modular Ontology framework—which classifies entities such as buildings, tools, and actors—and augmented reality frameworks that blend virtual and physical environments through key dimensions like Smart Governance and Smart Society [27,28,29]. In response to the disruptions caused by COVID-19, the field shifted toward resilience planning. Notable frameworks such as the Resilience Project Team and Smart Campus 4.0 were developed to guide universities in navigating post-pandemic recovery, ensuring continuity, and strengthening digital infrastructure [30,31,32].
Subsequent models have focused on integrating advanced technologies such as digital twins, cloud platforms, and Industry 4.0 and 5.0 systems to improve service quality, strategic alignment, and campus adaptability [33,34]. Among these, the smart campus assessment framework [35] presents a comprehensive structure composed of four primary dimensions—Smart Economy, Smart Society, Smart Environment, and Smart Governance—comprising a total of 48 operational indicators (Table 1).

1.4. Knowledge and Research Gaps

Current smart campus research can be broadly grouped into three thematic categories: conceptual, technical, and sustainability-focused studies. Conceptual research investigates stakeholder perceptions and the definitional evolution of smart campuses, emphasising the varied interpretations across institutional roles [36,37]. Technical research explores specific digital innovations such as IoT-based knowledge systems, energy optimisation, digital twin platforms, and immersive learning laboratories [38,39]. Sustainability-focused research addresses the integration of smart campus principles with the United Nations’ Sustainable Development Goals (SDGs), including commitments to environmental stewardship and social responsibility [40,41].
Despite an expanding body of literature, few studies have developed comprehensive smart campus assessment frameworks that include clearly defined performance indicators [35]. Moreover, most existing frameworks are tailored to high-income settings, where advanced digital infrastructure and strong institutional capacity are typically present. As a result, their applicability in lower-resource environments—characterised by constrained funding, infrastructural limitations, and distinct stakeholder needs—remains uncertain, particularly for performance assessment in developing country universities—or universities within the context of the Global South. To date, no study has systematically evaluated the applicability of smart campus frameworks in these contexts, representing a critical gap in both knowledge and research.

1.5. Research Aim and Question
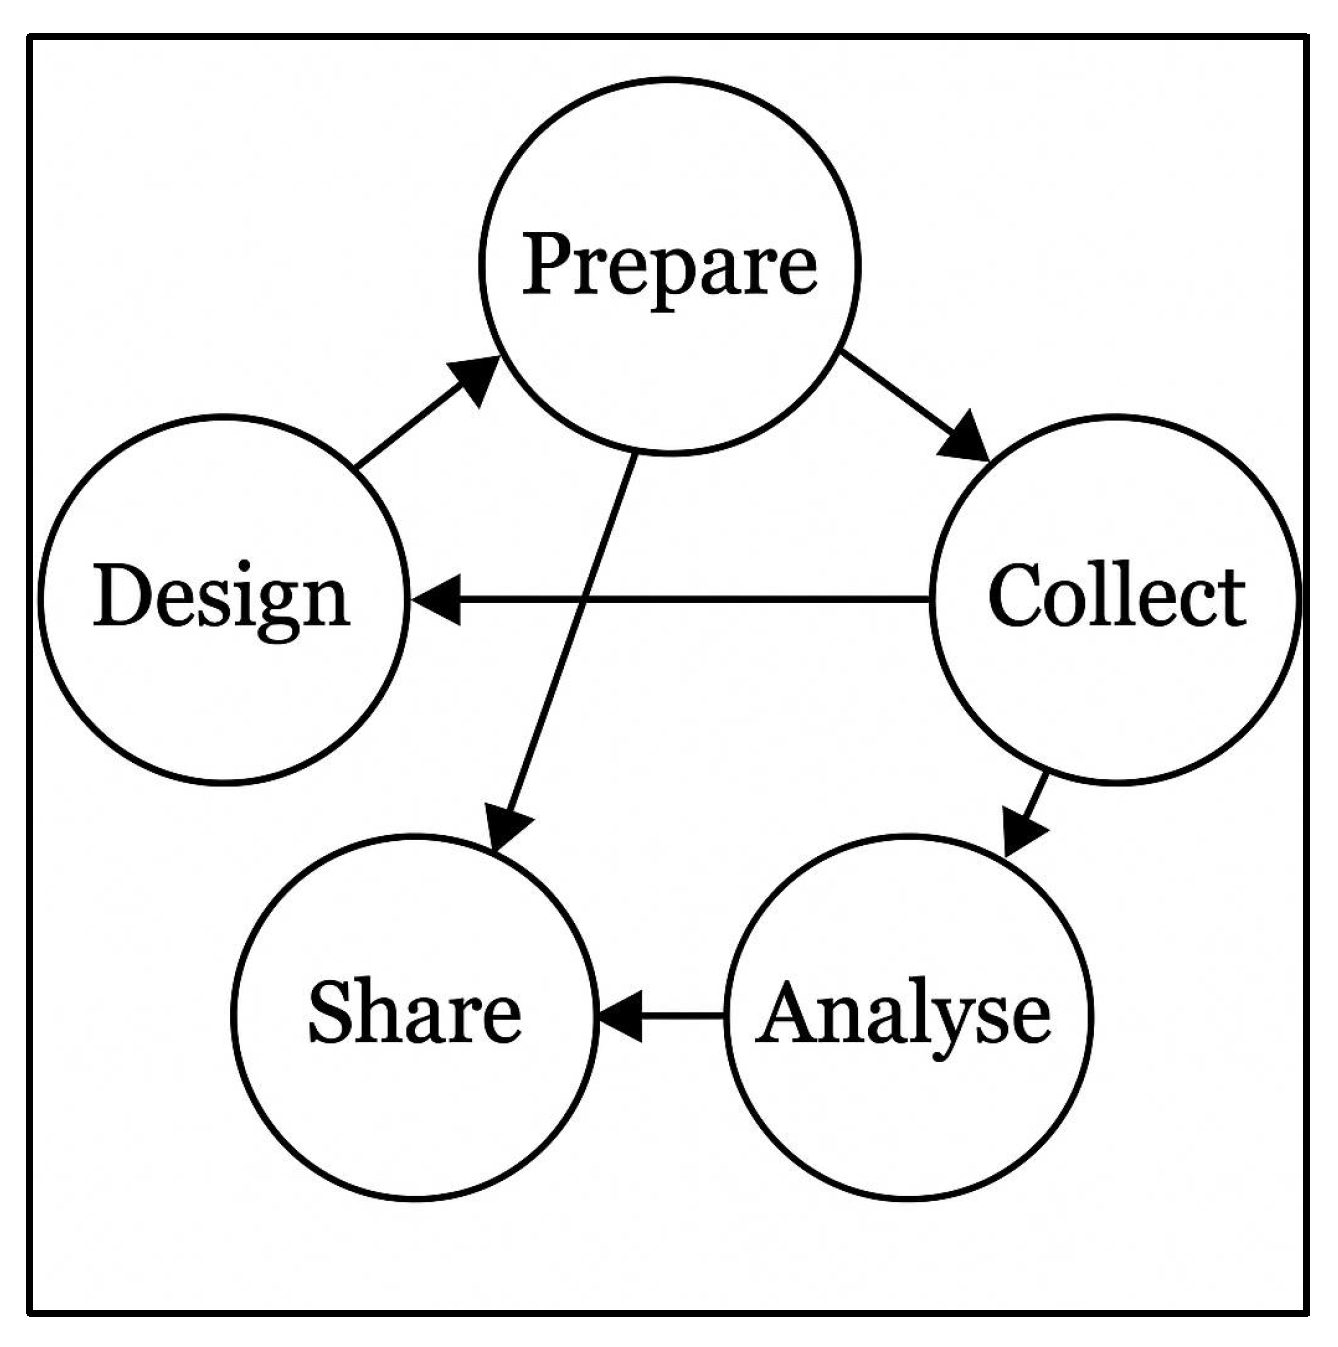
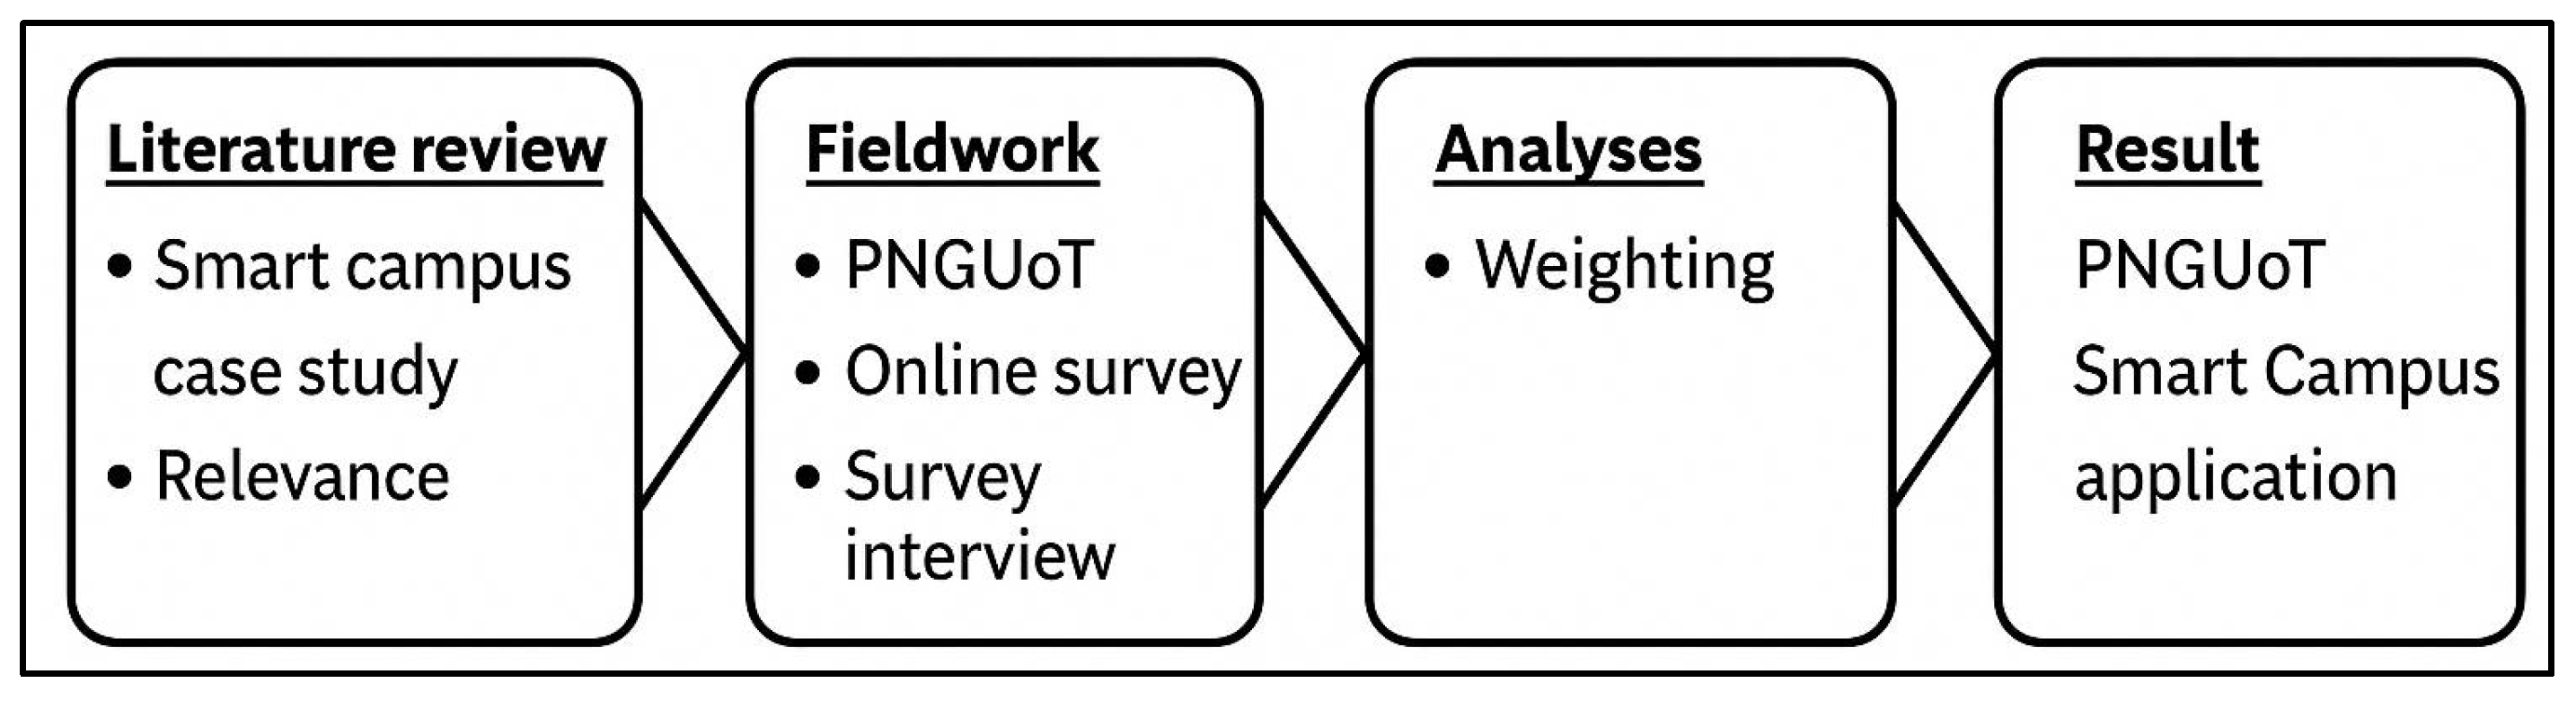
This study addresses a critical and underexplored gap in the smart campus literature by evaluating the relevance and adaptability of the Smart Campus Assessment Framework within the context of the Global South. While smart campus frameworks are increasingly used to guide digital transformation in higher education, they are typically developed for high-income settings, where strong digital infrastructure, institutional capacity, and resource availability are taken for granted. These frameworks often assume conditions that do not reflect the realities faced by universities in developing countries.
Institutions in the Global South contend with a distinct set of challenges, including limited technological infrastructure, financial constraints, and diverse socio-cultural contexts. These factors can shape both the implementation and perceived value of smart campus initiatives. Despite this, few studies have examined whether existing assessment frameworks are fit for purpose in such environments. The lack of contextual validation reduces the relevance and effectiveness of these tools when applied beyond their original design contexts.
This study investigates the central question: To what extent is the smart campus assessment framework relevant and adaptable for evaluating smart campus development in the Global South? In addressing this, the research contributes to reframing smart campus assessment by promoting the development of more inclusive, flexible, and context-sensitive frameworks tailored to universities in developing countries. Its novelty lies in testing a comprehensive framework previously validated by global experts through a Delphi study, offering a unique opportunity to assess its applicability through a real-world case study.

2. Research Design

The research is a descriptive single-case study focussing on both single and multiple units of analysis comprising the university campus and its sections, following Yin’s [42] “linear but reiterative” plan (Figure 1).
The research follows four key stages as shown in Figure 2 below.

2.1. Theoretical Framework: Relevance Theory and Perception

Relevance theory involves a person’s cognitive interaction with the surrounding world of contextual settings [43] expressed in perceptions [44]. Perception is argued to be a unit of relevance defined as, ‘to have knowledge through the mind’ or ‘become conscious of or understand’ something (Longman Dictionary of Contemporary English). In addition, Gilbert [45] described it as a characteristic of an agent-based model within environments undergoing a cognitive (knowledge) process by which an individual gives meaning to the environment. It is the acquisition of specific knowledge about objects or events at any moment, including the interpretation of objects, symbols, and people in light of pertinent experiences [46]. A person is motivated to improve his or her state within a context [47] and express their thoughts for their benefit [48], pursuing meanings that meet their expectations [49].
Recent studies on relevance were conducted to measure peoples’ perceptions of ideas and innovations in the education and business sector pertaining to the context of the study. Relevance studies in the education sector measured the level of perception in the ethics of university graduates [50], user satisfaction and the adoption of AI models of a smart campus framework [51], science camps’ school learning environments [52], the content relevance of online professional-development courses [53], and reforms in the teaching and learning of science [52], In the business sector, relevance studies investigated consumer reactions to business policies and practices [54], consumers’ attitudes toward marketing and marketing-related practices of business system [55], the perceived quality of consumers [56,57], industrial customer expectations and performance [58], and promotional material for tourism [59].
The Likert scale is an effective tool for measuring attitudes, including perceptions. The Likert scale was developed by Rensis Likert [60], designed to measure attitudes using a typical 5- or 7-point ordinal scale, allowing respondents to indicate their level of agreement or disagreement with the presented statement. The scale can intuitively measure people’s attitudes in various contexts, with responses ranging from strongly agree to strongly disagree. However, it has limitations, such as the inability to determine individual scores on an attitude continuum. Response reliability is addressed through assigning weighting [61], In addition, it only provides ordinal scales which are limited only to rating and ranking and lacks the ability to measure the distance between the scales.
Data that is normally distributed can allow for descriptive statistics such as means, standard deviations, and parametric statistics to be calculated with the median measuring the central tendency for the Likert scale [62]. Ordinal responses on Likert-type scales require a non-parametric test for analysis. Parametric tests are more robust for testing the reliability of the data [63]; however, they are usually used for continuous data, whereas the study’s data are ordinal and discrete. Continuous data gives a changing variance between each reading, whereas ordinal data is limited in variance between each level where nonparametric tests are used [64].

2.2. Case-Study Context

Papua New Guinea University of Technology (PNGUoT) is selected as the case study from the Global South. This is due to its representative characteristics as a public higher-education institution operating within the context of a developing country, where infrastructural, financial, and digital limitations pose significant barriers to the implementation of smart campus initiatives. PNGUoT offers a relevant and insightful site to examine the contextual applicability of global smart campus assessment frameworks, particularly in settings that lack the robust technological infrastructure typically assumed by such models. Its campus comprises diverse academic, administrative, and support units, making it suitable for evaluating the multi-dimensional indicators of smart campus performance.
Additionally, PNGUoT has expressed institutional interest in digital transformation and sustainability, providing a timely context for stakeholder engagement on the relevance of smart campus indicators. The university’s mix of students, academic staff, and professional personnel allows for triangulated insights across different roles and responsibilities. This diversity enhances the study’s capacity to assess perception-driven relevance of performance indicators, supporting the need for contextual adaptation. By focusing on PNGUoT, this study addresses a critical empirical gap and provides a grounded contribution to the refinement of inclusive and responsive smart campus strategies in the Global South.

2.3. Data Collection Instruments and Participant Sampling

The study aimed to gather insights from key stakeholders regarding the relevance of 48 smart campus indicators. A purposive sampling strategy was employed to ensure both convenience [65] and alignment with the data sources required for the research [66]. For the targeted staff survey, participants were selected based on mid-level rank and institutional tenure, ensuring informed perspectives from various schools and administrative sections of the university. The study focused on three distinct stakeholder groups—students, academic staff, and professional staff—whose diverse viewpoints collectively contribute to a more comprehensive understanding of smart campus adoption.
No demographic requirements—such as sex, age, or discipline—were imposed, as the study’s primary objective was to capture stakeholder perceptions on the relevance of the smart campus indicators, independent of such factors. For the anonymous student survey, no restrictions were placed on discipline or course of study, as these were not deemed influential in assessing the perceived relevance of the smart campus assessment framework. The goal was to obtain a broad, campus-wide perspective from the student body.
In contrast, the staff-targeted survey interviews followed a selective process, engaging participants who met specific inclusion criteria—namely, individuals in mid-level positions with significant tenure at the university. This approach aimed to ensure informed and institutionally grounded insights. A summary of staff participants’ profiles, including position, qualifications, and average length of employment, is presented in Table 2.
The single-case, descriptive study aims to assess the 48 indicators of the smart campus framework. A structured questionnaire based on the indicators was administered to students and staff at the selected case-study university. To ensure participant comprehension and facilitate effective participation, a 5-point Likert scale question was chosen with scales ranging from 1 (very low), 2 (low), 3 (neither high nor low), 4 (high), to 5 (very high). The questionnaire’s primary objective was to obtain the level of participants’ perceptions of the relevance of the 48 indicators. A single guiding question was asked: “How relevant do you feel the (indicator) is to the university?”. Participants then responded by indicating their perceived level of relevance. The questionnaire was designed to be completed within a 20 min time frame.
The questionnaire was developed and distributed using Qualtrics as the online survey tool, through the university’s email system, to reach all students. Anonymity was encouraged to attract a wide range of responses from students across the university. For staff participants, a targeted survey was conducted with two groups: academic and professional. A total of 24 staff members were selected from the university’s human resource database based on the criteria of position (including qualifications), responsibility, and length of service. Of these participants, 13 were from the schools, while 11 were from service sections. The three criteria were established to ensure a suitable representation of both school and sections while minimizing potential bias. The focus on middle-ranking positions with a wider responsibility allowed for a better understanding of the university’s operations and structure. Prioritizing individuals with longer employment periods ensured that participants had sufficient experience and a comprehensive understanding of the university’s context.
The online survey attracted over 500 student participants, with 254 providing complete responses, which were included in the data analysis. The survey interviews with the 24 staff members were executed with a few instances of confusion regarding the comprehension of the specificity of the dimensions. The issues were promptly addressed, by the interviewer, allowing the interviews to progress uninterrupted. The face-to-face interview format permitted the interviewees to extensively discuss the pros and cons of the indicators, leading to well-informed responses which benefited the study.
Data was sought from targeted staff [67] using survey interviews [68]. The survey approach was adopted using a structured questionnaire on the forty-eight indicators of the smart campus framework due to the large number of the indicators. A 5-point Likert-scale questionnaire was designed for participants to indicate their perception of the level of relevance on each of the indicators: (shown in Table 3 below). Two methods were adopted for the survey: an open online survey involving students (anonymous) campus-wide, and a targeted survey interview on selected staff in both the academic and non-academic (administration and service).
The online campus-wide questionnaire survey was produced in Qualtrics and launched through the university’s email to all stakeholders. A link and QR code on the survey was attached on the campus-wide email launched by the Director of ICT. It provided an open, anonymous, and voluntary approach, removing any biases towards a group or person to generalize the survey for the case study. It ran for a period of two months, where a total of 254 participants responded.
A face-to-face survey using a semi-structured interview was conducted, targeting academic and non-academic staff representing the functions of the university, comprising 13 schools and 11 sections, a total of 24 staff (Table 4).

3. Analysis and Results

3.1. Weighting Framework

The study uses the Best–Worst Method (BWM) to assign weights to the framework’s broad dimensions and categories, and Public Opinion (PO) data to estimate the relative relevance of specific indicators. The hybrid approach guarantees strategic top-down weighting while utilizing expert judgment at the indicator level, resulting in a comprehensive set of weights for each of the 48 indicators. Figure 3 displays the hierarchy of main dimensions, categories, and indicators included in the smart campus framework. The framework consists of four dimensions, 16 categories, and 48 indicators. It should be noted that for the indicator level, 278 participants scored the indicators based on a 5-point Likert scale. For the dimension and category levels, pairwise BWM questionnaires were distributed among five decision-makers (DMs), and all categories and dimensions were scored using a 9-point Likert scale from a previous Delphi study [35] for relative comparison. The detailed procedure of the Hybrid BWM + PO method is as follows.

3.2. Group Best-Worst Method

The Best-Worst Method (BWM) is a widely used weighting approach that derives criteria weights through pairwise comparison. The BWM determines weights based on DMs’ preferences similar to the Analytic Hierarchy Process (AHP). BWM, however, has significant benefits: it needs less comparison—only 2n − 3 for n criteria as opposed to AHP’s more comprehensive requirements—and it provides more consistent results [68]. The complete BWM methodology is presented as a single-objective programming model (1) to simultaneously incorporate all DMs’ preferences, with detailed implementation steps available in [69]:
m i n   δ 1 + δ 2 + + δ k st : | W i   -   a iw   W W | k     δ r ,   i = 1 , , n   k = 1 , .   K | W B   -   a B i   W i | k     δ r ,   i = 1 , , n   k = 1 , .   K i = 1 n W i = 1 W i 0  
For the r-th DM, a B i represents the preference of the best criterion over the i-th criterion, while a i w denotes the preference of the i-th criterion over the worst criterion. { } k   indicates the constraints that pertain specifically to the k-th DM. The output of Model (1) consists of indicator weights determined by the DMs’ judgments based on BWM questionnaires. In this model, W i is the weight of the i-th criterion, W w is the weight of the worst (least important) criterion, and W B is the weight of the best (most important) criterion.

3.3. Public Opinion Method

The PO method is a participatory approach used to gather and analyse expert or stakeholder judgments for weighting, ranking, or decision-making [70]. PO relies on subjective inputs from experts to assess the importance of criterion/indicators. In general, PO-based weights can be obtained by opinion polling, which is both simple and cost-effective [71]. Weights can be derived from expert surveys, Likert-scale ratings, or direct scoring rather than mathematical optimization. Based on the PO method, the normalized weight   ( w i ) for i-th criterion/indicator can be calculated using Equation (2):
w i   = Mean   Score   of   Criterion   i j = 1 n Mean   Score   of   Criterion   j

3.4. Results

The hybrid BWM + PO method is applied to calculate the importance weights of dimensions, categories, and indicators within the smart campus framework. As previously stated, the group BWM approach is used for determining weights at the dimension and category levels, whereas the PO method is used for indicator-level weighting. We distribute two types of questionnaires for pairwise comparisons—a BWM questionnaire based on a 9-point Likert scale system (with responses from five DMs) and PO rating questionnaires based on a 5-point Likert scale system (with responses from 278 experts). The weighting results for each level will be discussed individually in the following sections.

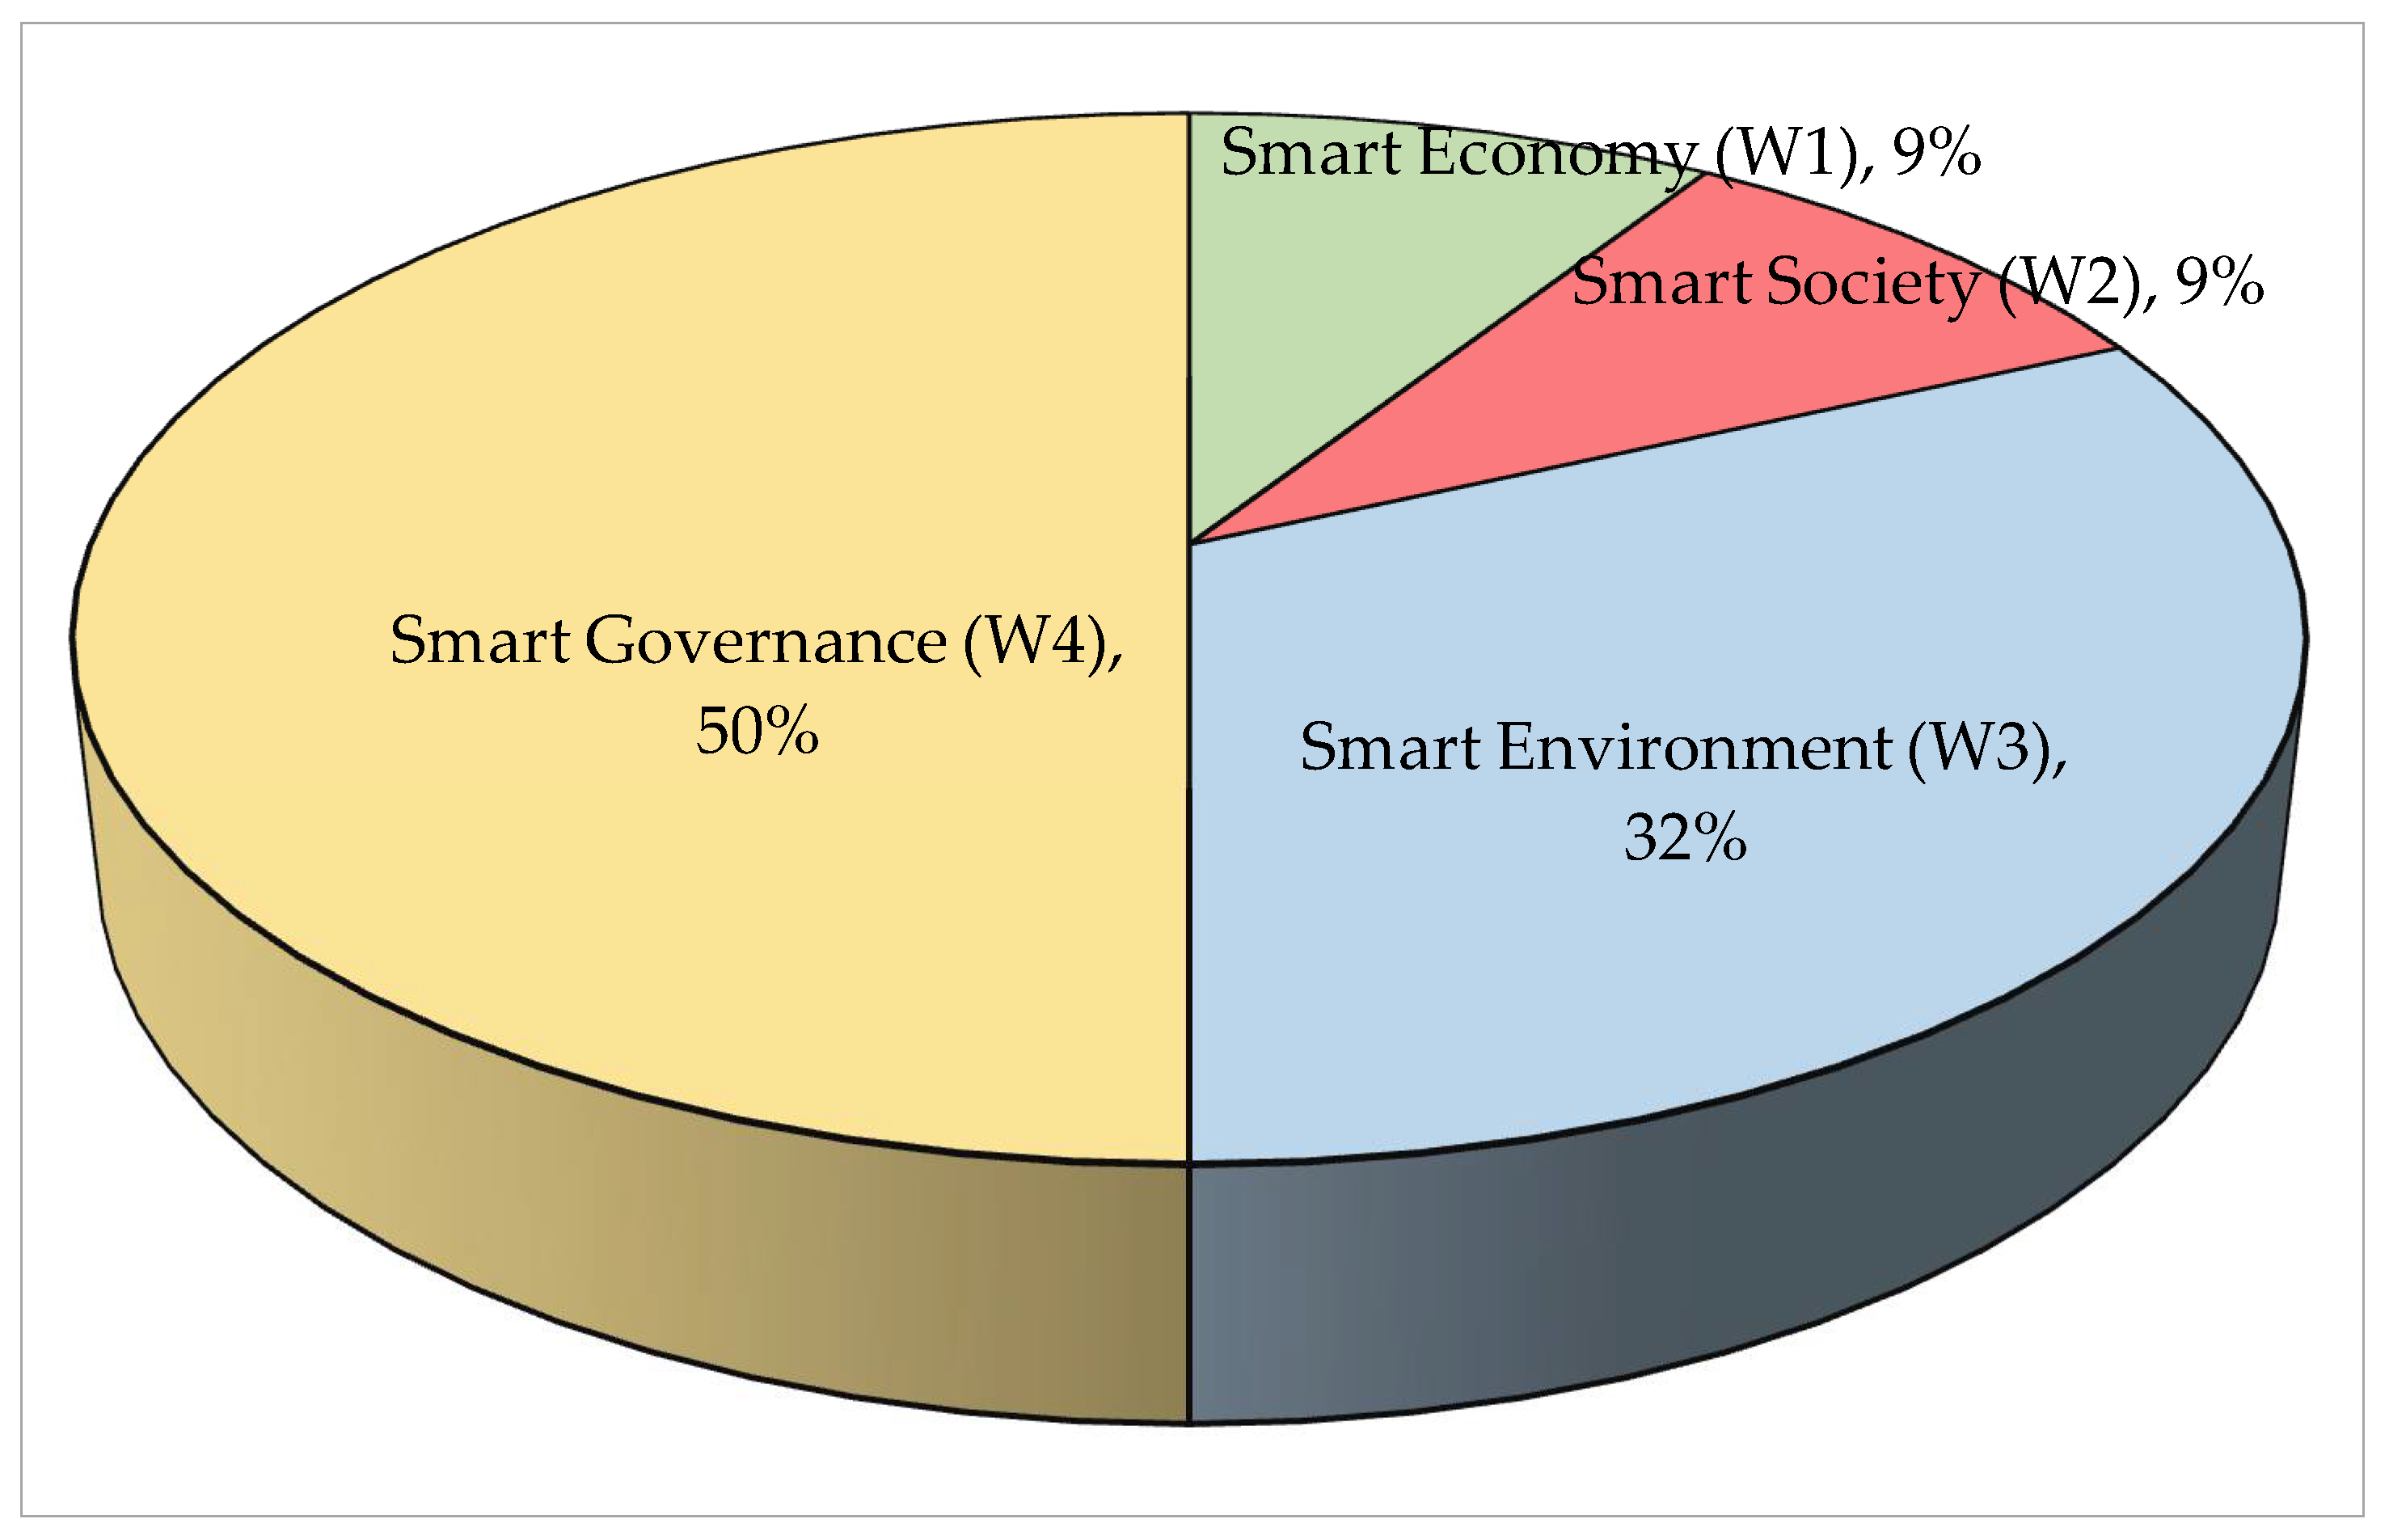
3.4.1. Dimension-Level Weighting

In general, at this level, the five DMs compared “Smart Economy” (Criterion 1), “Smart Society” (Criterion 2), “Smart Environment” (Criterion 3), and “Smart Governance” (Criterion 4) with each other using the 9-point Likert scale system. According to Model 1, we have the following problem, Problem (3):
min   TI =   δ 1 + δ 2 + δ 3 + δ 4 + δ 5   st :   W 1 ,   W 2 , W 3 , W 4 0 W 1 + W 2 + W 3 + W 4 = 1   DM   1   ( Best :   Smart   Environment   ( W 3 ) ,   Worst :   Smart   Society   ( W 2 ) )   W 3 3   W 1   δ 1 , | W 3 5   W 2 |   δ 1 , | W 3 3   W 4 |   δ 1 W 1 4   W 2   δ 1 , | W 4 5   W 2 |   δ 1   DM   2   ( Best :   Smart   Governance   ( W 4 ) ,   Worst :   Smart   Society   ( W 2 ) )   W 4 4   W 1   δ 2 , | W 4   5   W 2 |   δ 2 , | W 4   3   W 3 |   δ 2 W 1 3   W 2   δ 2 , | W 3   4   W 2 |   δ 2   DM   3   ( Best :   Smart   Governance   ( W 4 ) ,   Worst :   Smart   Environment   ( W 3 ) )   W 4 5   W 1   δ 3 , | W 4   4   W 2 |   δ 3 , | W 4   5   W 3 |   δ 3 W 1 2   W 3   δ 3 , | W 2   2   W 3 |   δ 3   DM   4   ( Best :   Smart   Governance   ( W 4 ) ,   Worst :   Smart   Economy   ( W 1 ) )   W 4 4   W 1   δ 4 , | W 4   7   W 2 |   δ 4 , | W 4   3   W 3 |   δ 4 W 2 6   W 1   δ 4 , | W 3   4   W 1 |   δ 4   DM   5   ( Best :   Smart   Governance   ( W 4 ) ,   Worst :   Smart   Economy   ( W 1 ) )   W 4 7   W 1   δ 5 , | W 4   3   W 2 |   δ 5 , | W 4   3   W 3 |   δ 5 W 2 2   W 1   δ 5 , | W 3   5   W 1 |   δ 5
We implemented the above problem in a Python environment using the Pyomo v.6.9.2 library. The importance weights of each dimension in the smart campus framework were obtained by minimizing the Total Inconsistency (TI) via Problem (3). Table 5 and Figure 4 show the importance weights of each dimension in the smart campus framework. Accordingly, “Smart Governance” has the highest weight and importance, followed by “Smart Environment”. For “Smart Economy” and “Smart Society”, equal weight importance was achieved.
Similar to the previous section, all categories within each dimension of the smart campus framework were separately compared based on the questionnaires from five decision-makers (DMs). The weights for each group were derived using the BWM model. Note that all weights obtained in these groups are calculated within their respective dimensions. To determine the overall weight of a specific category relative to all categories across all dimensions, we must also consider the dimension weights calculated in the previous section. The overall weights will be computed for obtaining subgroup weights within each dimension is as follows:

3.4.2. Smart Economy Weighting

At this level, the five DMs compared “Business services” (Criterion 1), “Business efficiency” (Criterion 2), “Utility cost savings” (Criterion 3), and “Innovation ecosystem” (Criterion 4) with each other using the 9-point Likert scale system. According to Model 1, we have the following problem, Problem (4):
min   TI =   δ 1 + δ 2 + δ 3 + δ 4 + δ 5   s t :   W 1 ,   W 2 , W 3 , W 4 0 W 1 + W 2 + W 3 + W 4 = 1   DM   1   ( Best :   Innovation   ecosystem   ( W 4 ) ,   Worst :   Business   services   ( W 1 ) )   W 4 5   W 1   δ 1 , | W 4 3   W 2 |   δ 1 , | W 4 4   W 3 |   δ 1 W 2 4   W 1   δ 1 , | W 3 3   W 1 |   δ 1   DM   2   ( Best :   Business   efficiency   ( W 2 ) ,   Worst :   Business   services   ( W 1 ) )   W 2 5   W 1   δ 2 , | W 2   3   W 3 |   δ 2 , | W 2   2   W 4 |   δ 2 W 3 3   W 1   δ 2 , | W 4   4   W 1 |   δ 2   DM   3   ( Best :   Innovation   ecosystem   ( W 4 ) ,   Worst :   Business   services   ( W 1 ) )   W 4 6   W 1   δ 3 , | W 4   2   W 2 |   δ 3 , | W 4   4   W 3 |   δ 3 W 2 5   W 1   δ 3 , | W 3   3   W 1 |   δ 3   DM   4   ( Best :   Business   efficiency   ( W 2 ) ,   Worst :   Utility   cost   savings ( W 3 ) )   W 2 6   W 1   δ 4 , | W 2   6   W 3 |   δ 4 , | W 2   3   W 4 |   δ 4 W 1 2   W 3   δ 4 , | W 4   3   W 3 |   δ 4   DM   5   ( Best :   Business   efficiency   ( W 2 ) ,   Worst :   Business   services   ( W 1 ) )   W 2 5   W 1   δ 5 , | W 2   3   W 3 |   δ 5 , | W 2   2   W 4 |   δ 5 W 3 2   W 1   δ 5 , | W 3   4   W 1 |   δ 5
Table 6 and Figure 5 display the relative importance weights of the categories in the Smart Economy dimension. “Business efficiency” ranks highest with a weight of 0.4417, followed by “Innovation ecosystem” at 0.3655. Conversely, “Business services” has the lowest weight at just 0.0763, indicating its minimal impact in this category.

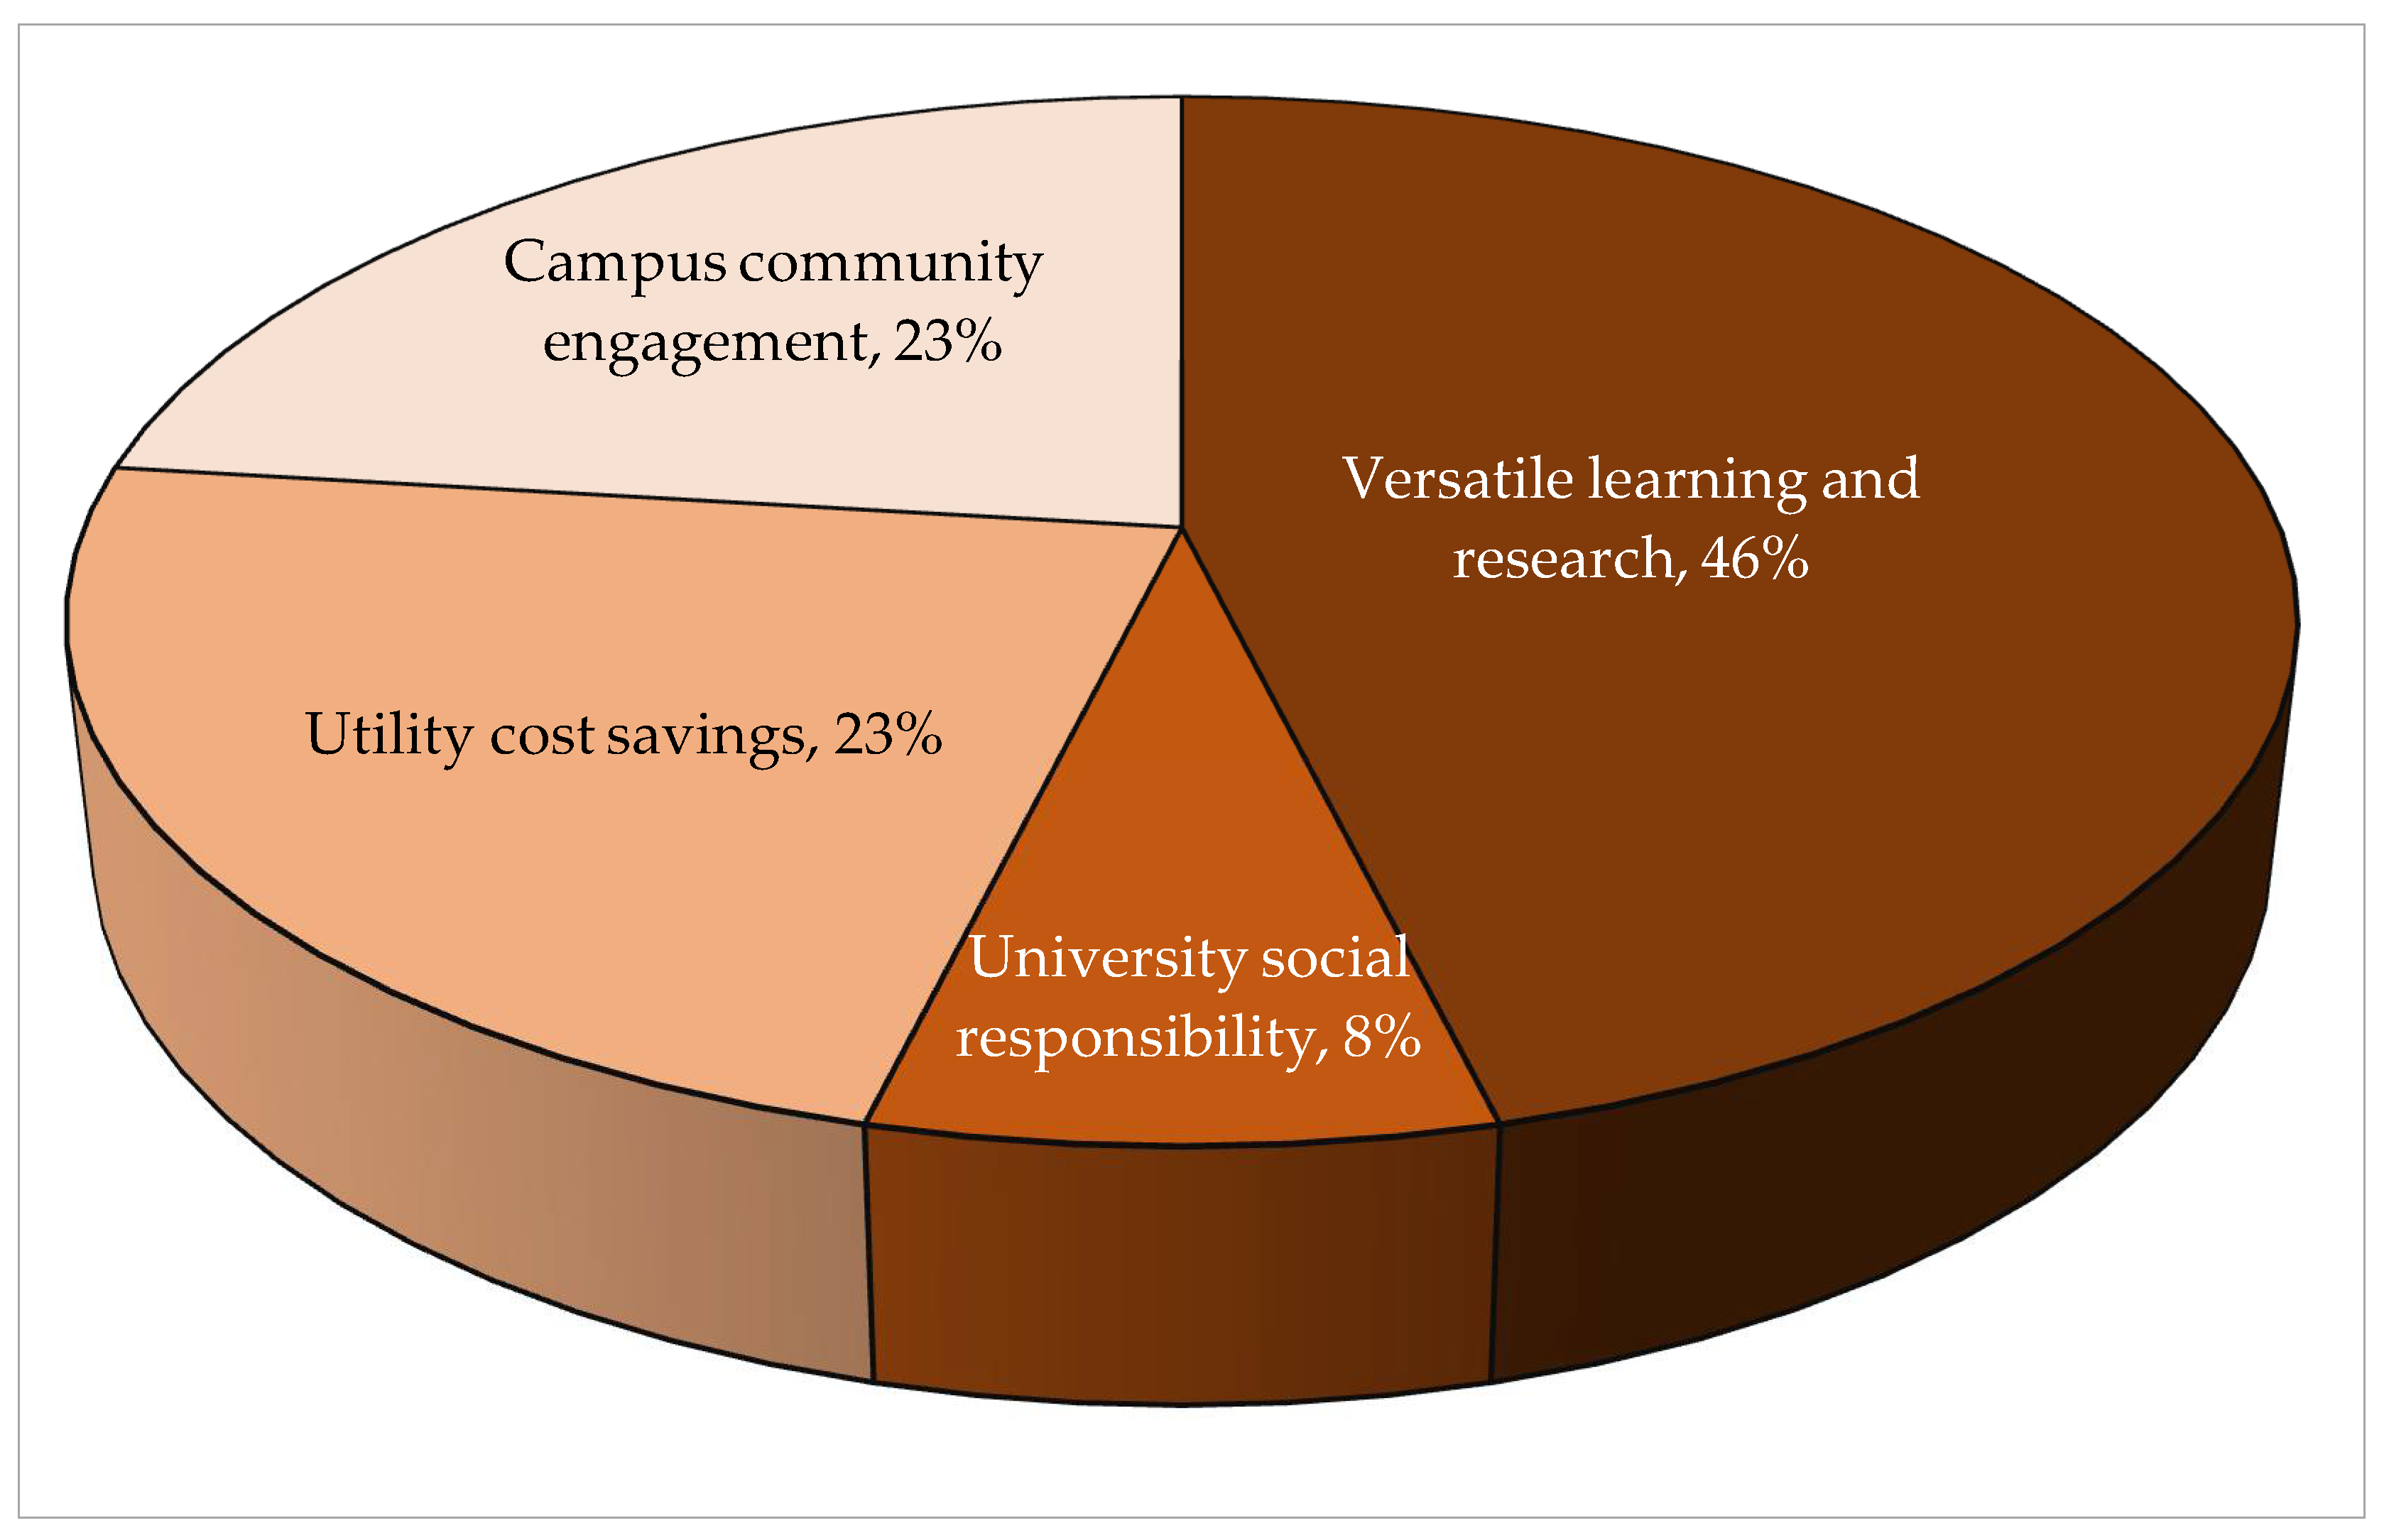
3.4.3. Smart Society Weighting

At this stage, the five DMs evaluated and compared four key criteria: “Versatile learning and research” (Criterion 1), “University social responsibility” (Criterion 2), “Utility cost savings” (Criterion 3), and “Campus community engagement” (Criterion 4). The comparison was conducted using a 9-point Likert scale system. Based on Model 1, we derive the following optimization problem (Problem (5)):
Table 7 and Figure 6 present the importance weights of categories within the Smart Society dimension. Among these, “Versatile learning and research” holds the highest weight (0.4615), indicating its dominant role. “Utility cost savings” and “Campus community engagement” share equal weights, suggesting comparable significance. In contrast, “University social responsibility” has the lowest weight (0.0769), reflecting its relatively minor influence in this dimension.
min   TI =   δ 1 + δ 2 + δ 3 + δ 4 + δ 5   st :   W 1 ,   W 2 , W 3 , W 4 0 W 1 + W 2 + W 3 + W 4 = 1   DM   1   ( Best :   Campus   community   engagement ( W 4 ) ,   Worst :   University   social   responsibility ( W 2 ) )   W 4 5   W 1   δ 1 , | W 4 3   W 2 |   δ 1 , | W 4 4   W 3 |   δ 1 W 2 4   W 1   δ 1 , | W 3 3   W 1 |   δ 1   DM   2   ( Best :   Campus   community   engagement ( W 4 ) ,   Worst :   University   social   responsibility ( W 2 ) )   W 2 5   W 1   δ 2 , | W 2   3   W 3 |   δ 2 , | W 2   2   W 4 |   δ 2 W 3 3   W 1   δ 2 , | W 4   4   W 1 |   δ 2   DM   3   ( Best :   Versatile   learning   and   research ( W 1 ) ,   Worst :   University   social   responsibility ( W 2 ) )   W 4 6   W 1   δ 3 , | W 4   2   W 2 |   δ 3 , | W 4   4   W 3 |   δ 3 W 2 5   W 1   δ 3 , | W 3   3   W 1 |   δ 3   DM   4   ( Best :   Versatile   learning   and   research ( W 1 ) ,   Worst :   University   social   responsibility ( W 2 ) )   W 2 6   W 1   δ 4 , | W 2   6   W 3 |   δ 4 , | W 2   3   W 4 |   δ 4 W 1 2   W 3   δ 4 , | W 4   3   W 3 |   δ 4   DM   5   ( Best :   Versatile   learning   and   research ( W 1 ) ,   Worst :   University   social   responsibility ( W 2 ) )   W 1 5   W 2   δ 5 , | W 1   3   W 3 |   δ 5 , | W 1   3   W 4 |   δ 5 W 3 3   W 2   δ 5 , | W 4   4   W 2 |   δ 5

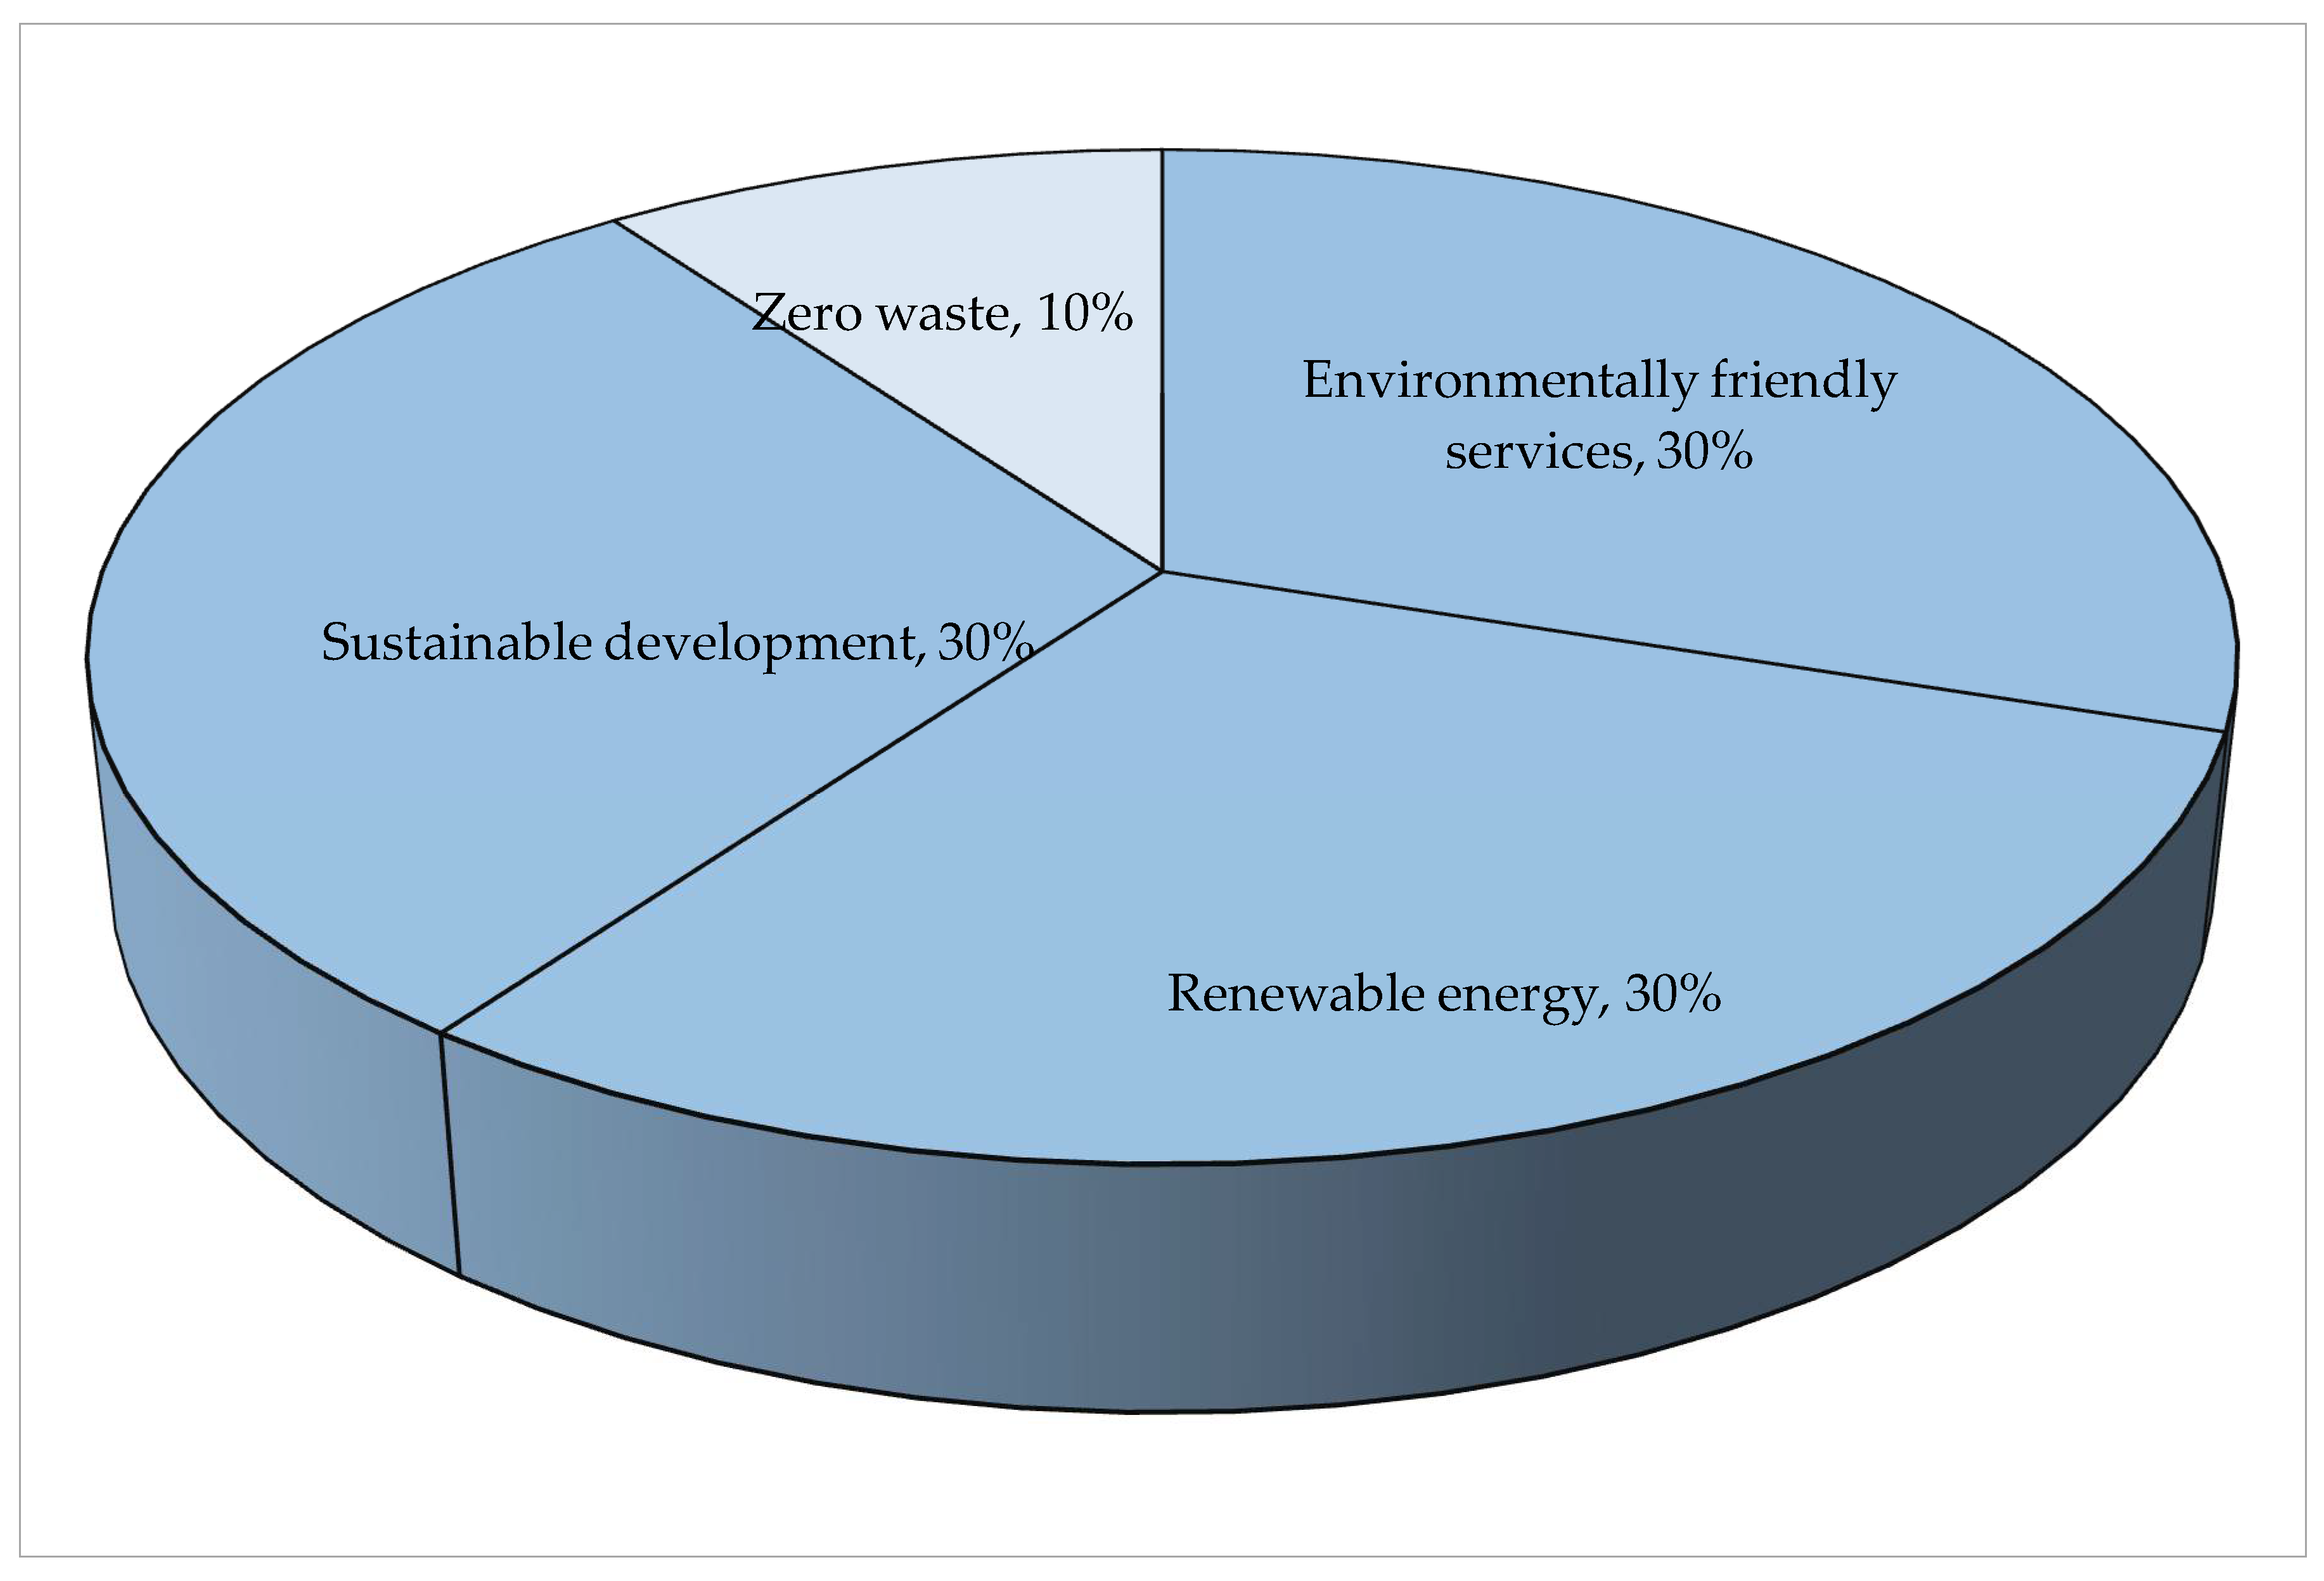
3.4.4. Smart Environment Weighting

At this level, the five DMs evaluated and compared four key categories: “Environmentally friendly services” (Criterion 1), “Renewable energy” (Criterion 2), “Sustainable development” (Criterion 3), and “Zero waste” (Criterion 4). The comparison was conducted using a 9-point Likert scale system. Based on Model 1, we derive the following optimization problem (Problem (6)):
min   TI =   δ 1 + δ 2 + δ 3 + δ 4 + δ 5   s t :   W 1 ,   W 2 , W 3 , W 4 0 W 1 + W 2 + W 3 + W 4 = 1   DM   1   ( Best :   Sustainable   development   ( W 3 ) ,   Worst :   Zero   waste   ( W 4 ) )   W 3 2   W 1   δ 1 , | W 3 3   W 2 |   δ 1 , | W 3 5   W 4 |   δ 1 W 1 3   W 4   δ 1 , | W 2 3   W 4 |   δ 1   DM   2   ( Best :   Environmentally   friendly   services ( W 1 ) ,   Worst :   Zero   waste   ( W 4 ) )   W 1 2   W 2   δ 2 , | W 1   3   W 3 |   δ 2 , | W 1   6   W 4 |   δ 2 W 2 4   W 4   δ 2 , | W 3   5   W 4 |   δ 2   DM   3   ( Best :   Sustainable   development   ( W 3 ) ,   Worst :   Zero   waste   ( W 4 ) )   W 3 2   W 1   δ 3 , | W 3   2   W 2 |   δ 3 , | W 3   6   W 4 |   δ 3 W 1 5   W 4   δ 3 , | W 2   3   W 4 |   δ 3   DM   4   ( Best :   Environmentally   friendly   services ( W 1 ) ,   Worst :   Zero   waste ( W 4 ) )   W 1 3   W 2   δ 4 , | W 1   3   W 3 |   δ 4 , | W 1   9   W 4 |   δ 4 W 2 6   W 4   δ 4 , | W 3   6   W 4 |   δ 4   DM   5   ( Best :   Renewable   energy   ( W 2 ) ,   Worst :   Zero   waste   ( W 4 ) )   W 2 3   W 1   δ 5 , | W 2   3   W 3 |   δ 5 , | W 2   6   W 4 |   δ 5 W 1 4   W 4   δ 5 , | W 3   3   W 4 |   δ 5
The relative importance of each category in the Smart Environment dimension is shown in Table 8 and Figure 7. The top-weighted factors are “Environmentally friendly services,” “Renewable energy,” and “Sustainable development,” each scoring 0.3. On the other hand, “Zero waste” has the lowest weighting (0.1), indicating its limited impact within this dimension.

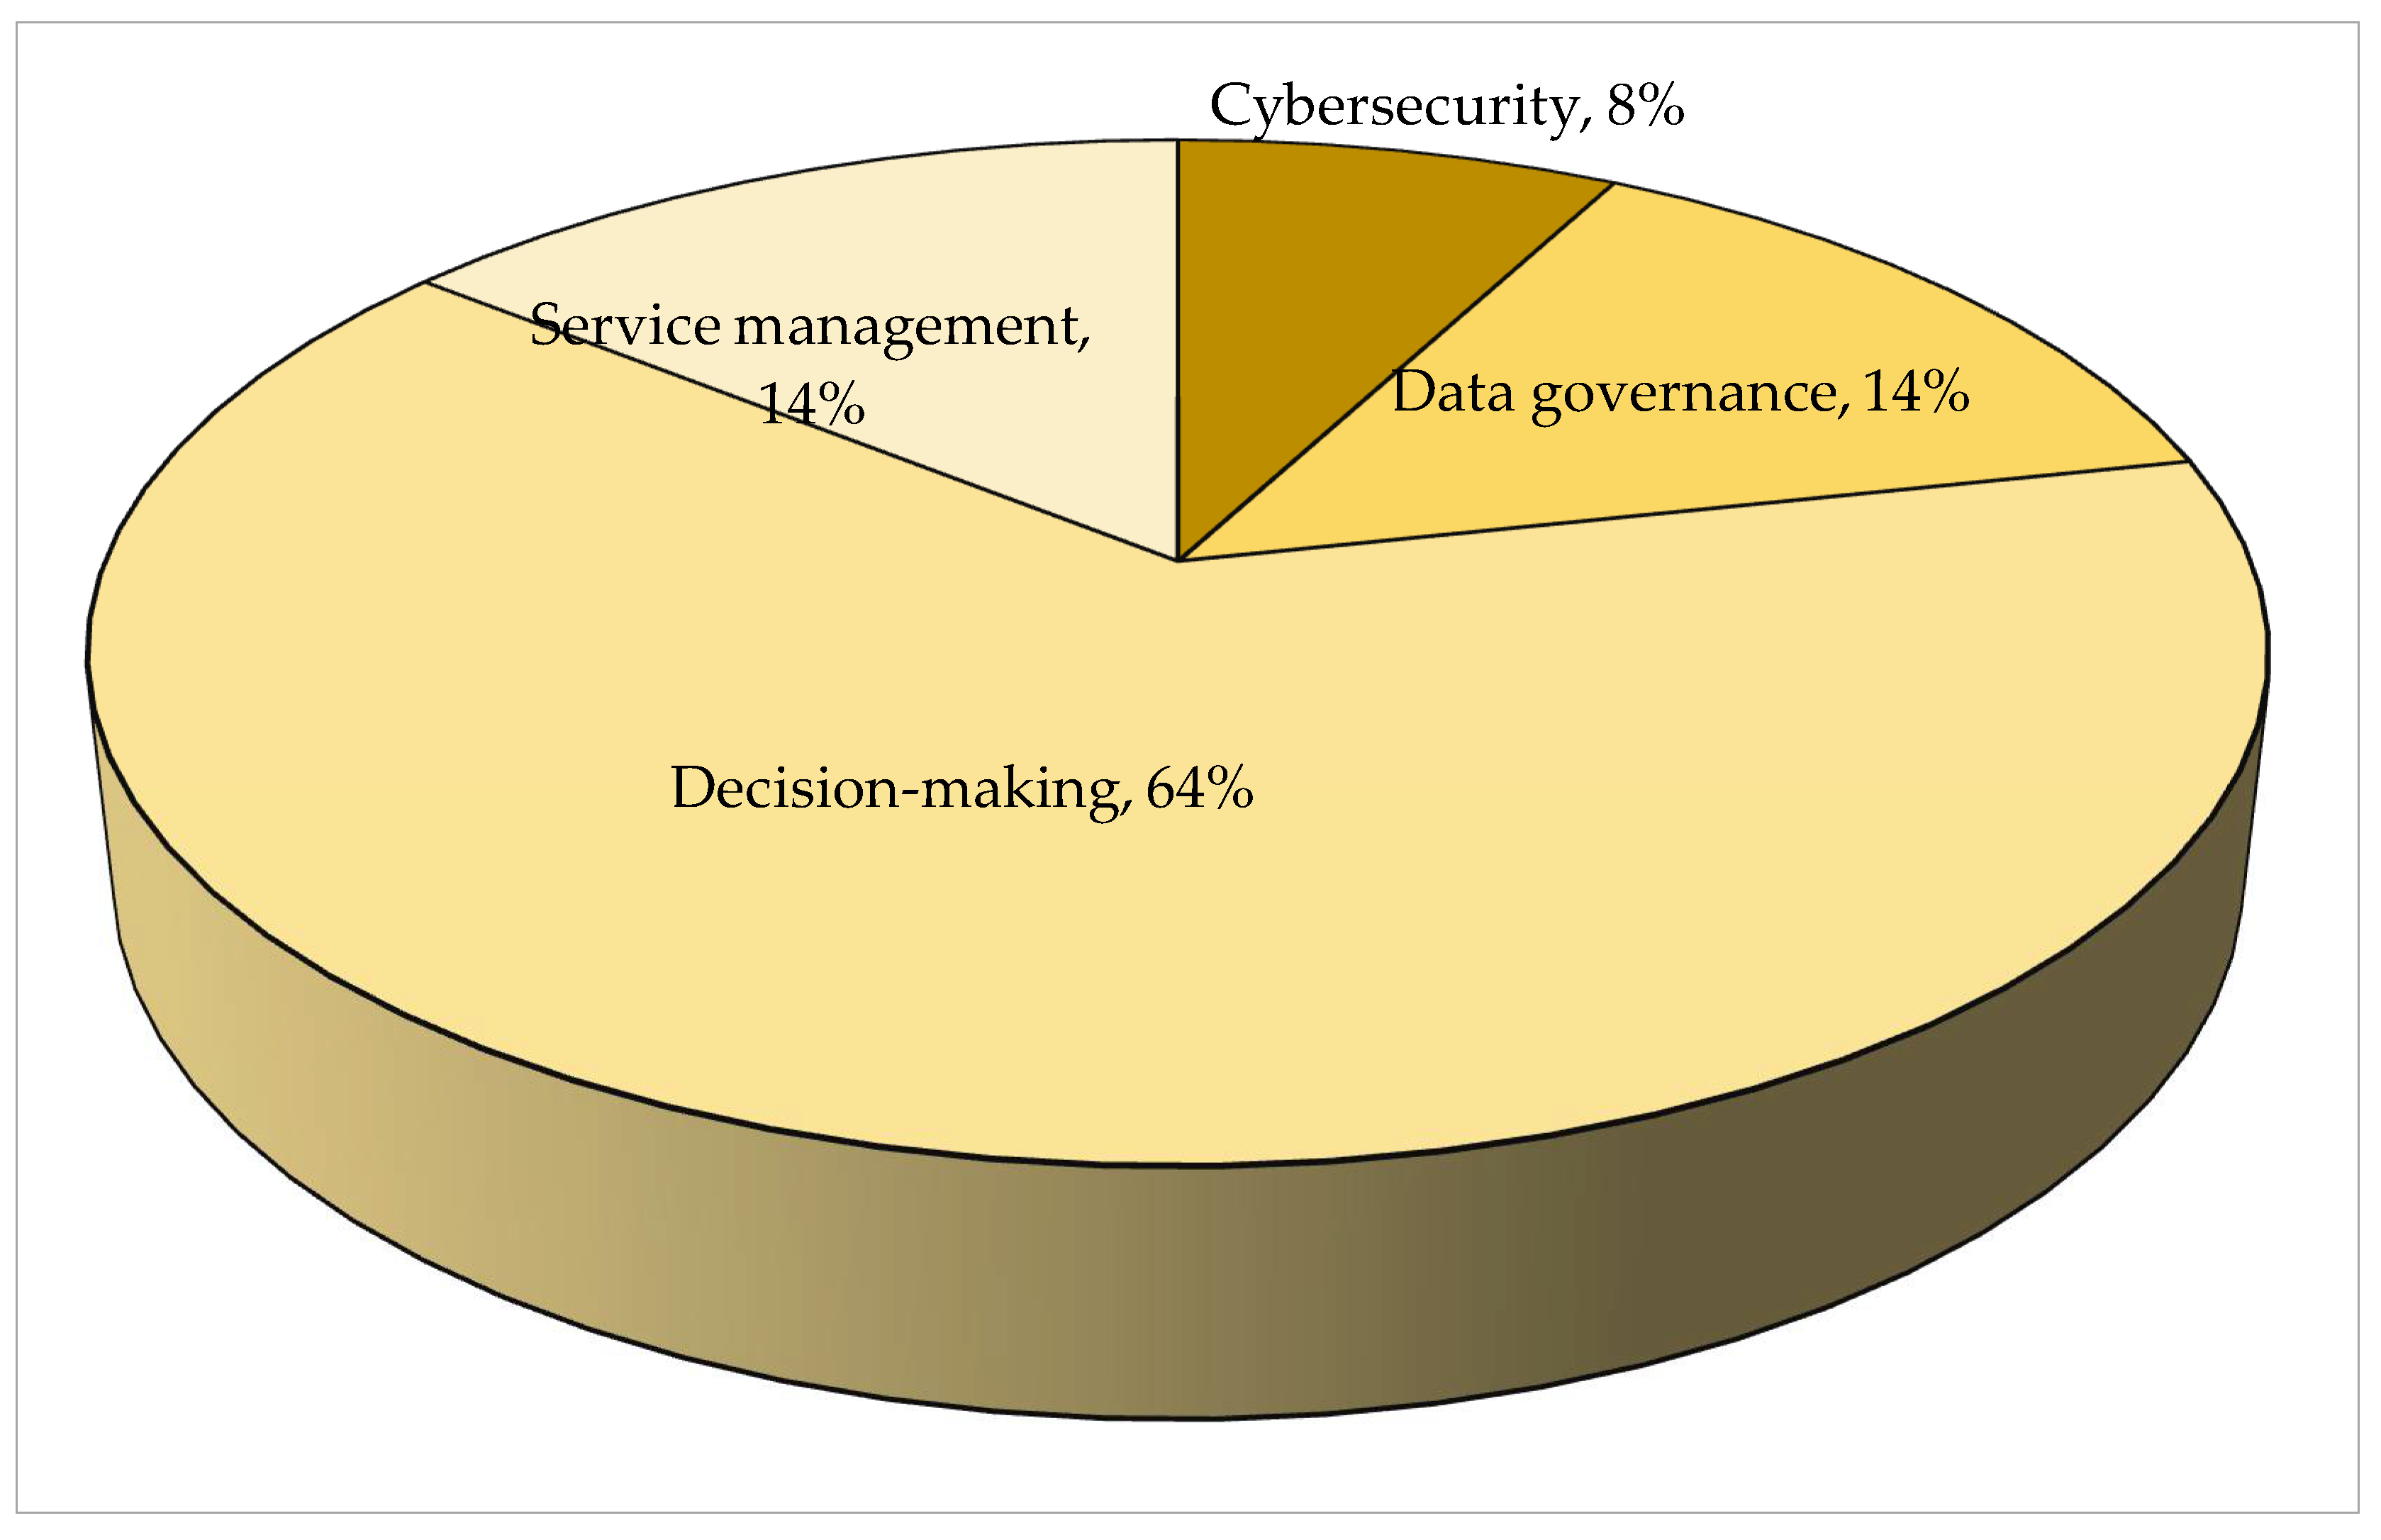
3.4.5. Smart Governance Weighting

At this stage, the five DMs assessed and ranked four critical categories: (1) “Cybersecurity”, (2) “Data governance”, (3) “Decision-making”, and (4) “Service management”. Following the framework of Model 1, we formulate the optimization challenge presented in Problem (7).
min   TI =   δ 1 + δ 2 + δ 3 + δ 4 + δ 5   st :   W 1 ,   W 2 , W 3 , W 4 0 W 1 + W 2 + W 3 + W 4 = 1   DM   1   ( Best :   Data   governance   ( W 2 ) ,   Worst :   Service   management   ( W 4 ) )   W 2 3   W 1   δ 1 , | W 2 2   W 3 |   δ 1 , | W 2 9   W 4 |   δ 1 W 1 8   W 4   δ 1 , | W 3 5   W 4 |   δ 1   DM   2   ( Best :   Decision-making ( W 3 ) ,   Worst :   Cybersecurity ( W 1 ) )   W 3 8   W 1   δ 2 , | W 3   7   W 2 |   δ 2 , | W 3   6   W 4 |   δ 2 W 2 6   W 1   δ 2 , | W 4   5   W 1 |   δ 2   DM   3   ( Best :   Decision-making ( W 3 ) ,   Worst :   Data   governance   ( W 2 ) )   W 3 4   W 1   δ 3 , | W 3   6   W 2 |   δ 3 , | W 3   2   W 4 |   δ 3 W 1 2   W 2   δ 3 , | W 4   4   W 2 |   δ 3   DM   4   ( Best :   Decision-making ( W 3 ) ,   Worst :   Data   governance ( W 2 ) )   W 3 3   W 1   δ 4 , | W 3   7   W 2 |   δ 4 , | W 3   4   W 4 |   δ 4 W 2 7   W 1   δ 4 , | W 4   4   W 1 |   δ 4   DM   5   ( Best :   Decision-making ( W 3 ) ,   Worst :   Service   management   ( W 4 ) )   W 3 4   W 1   δ 5 , | W 3   2   W 2 |   δ 5 , | W 3   5   W 4 |   δ 5 W 1 2   W 4   δ 5 , | W 2   3   W 4 |   δ 5
The relative importance of categories in the Smart Governance dimension is illustrated in Table 9 and Figure 8. “Decision-making” emerges as the most influential factor with a weight of 0.6410, demonstrating its predominant role. The secondary categories, “Service management” and “Data governance,” show nearly identical weights (ranking second and third, respectively), indicating similar levels of importance. Conversely, “Cybersecurity” carries the lowest weight (0.07796), suggesting it plays a substantially smaller role within this governance framework.

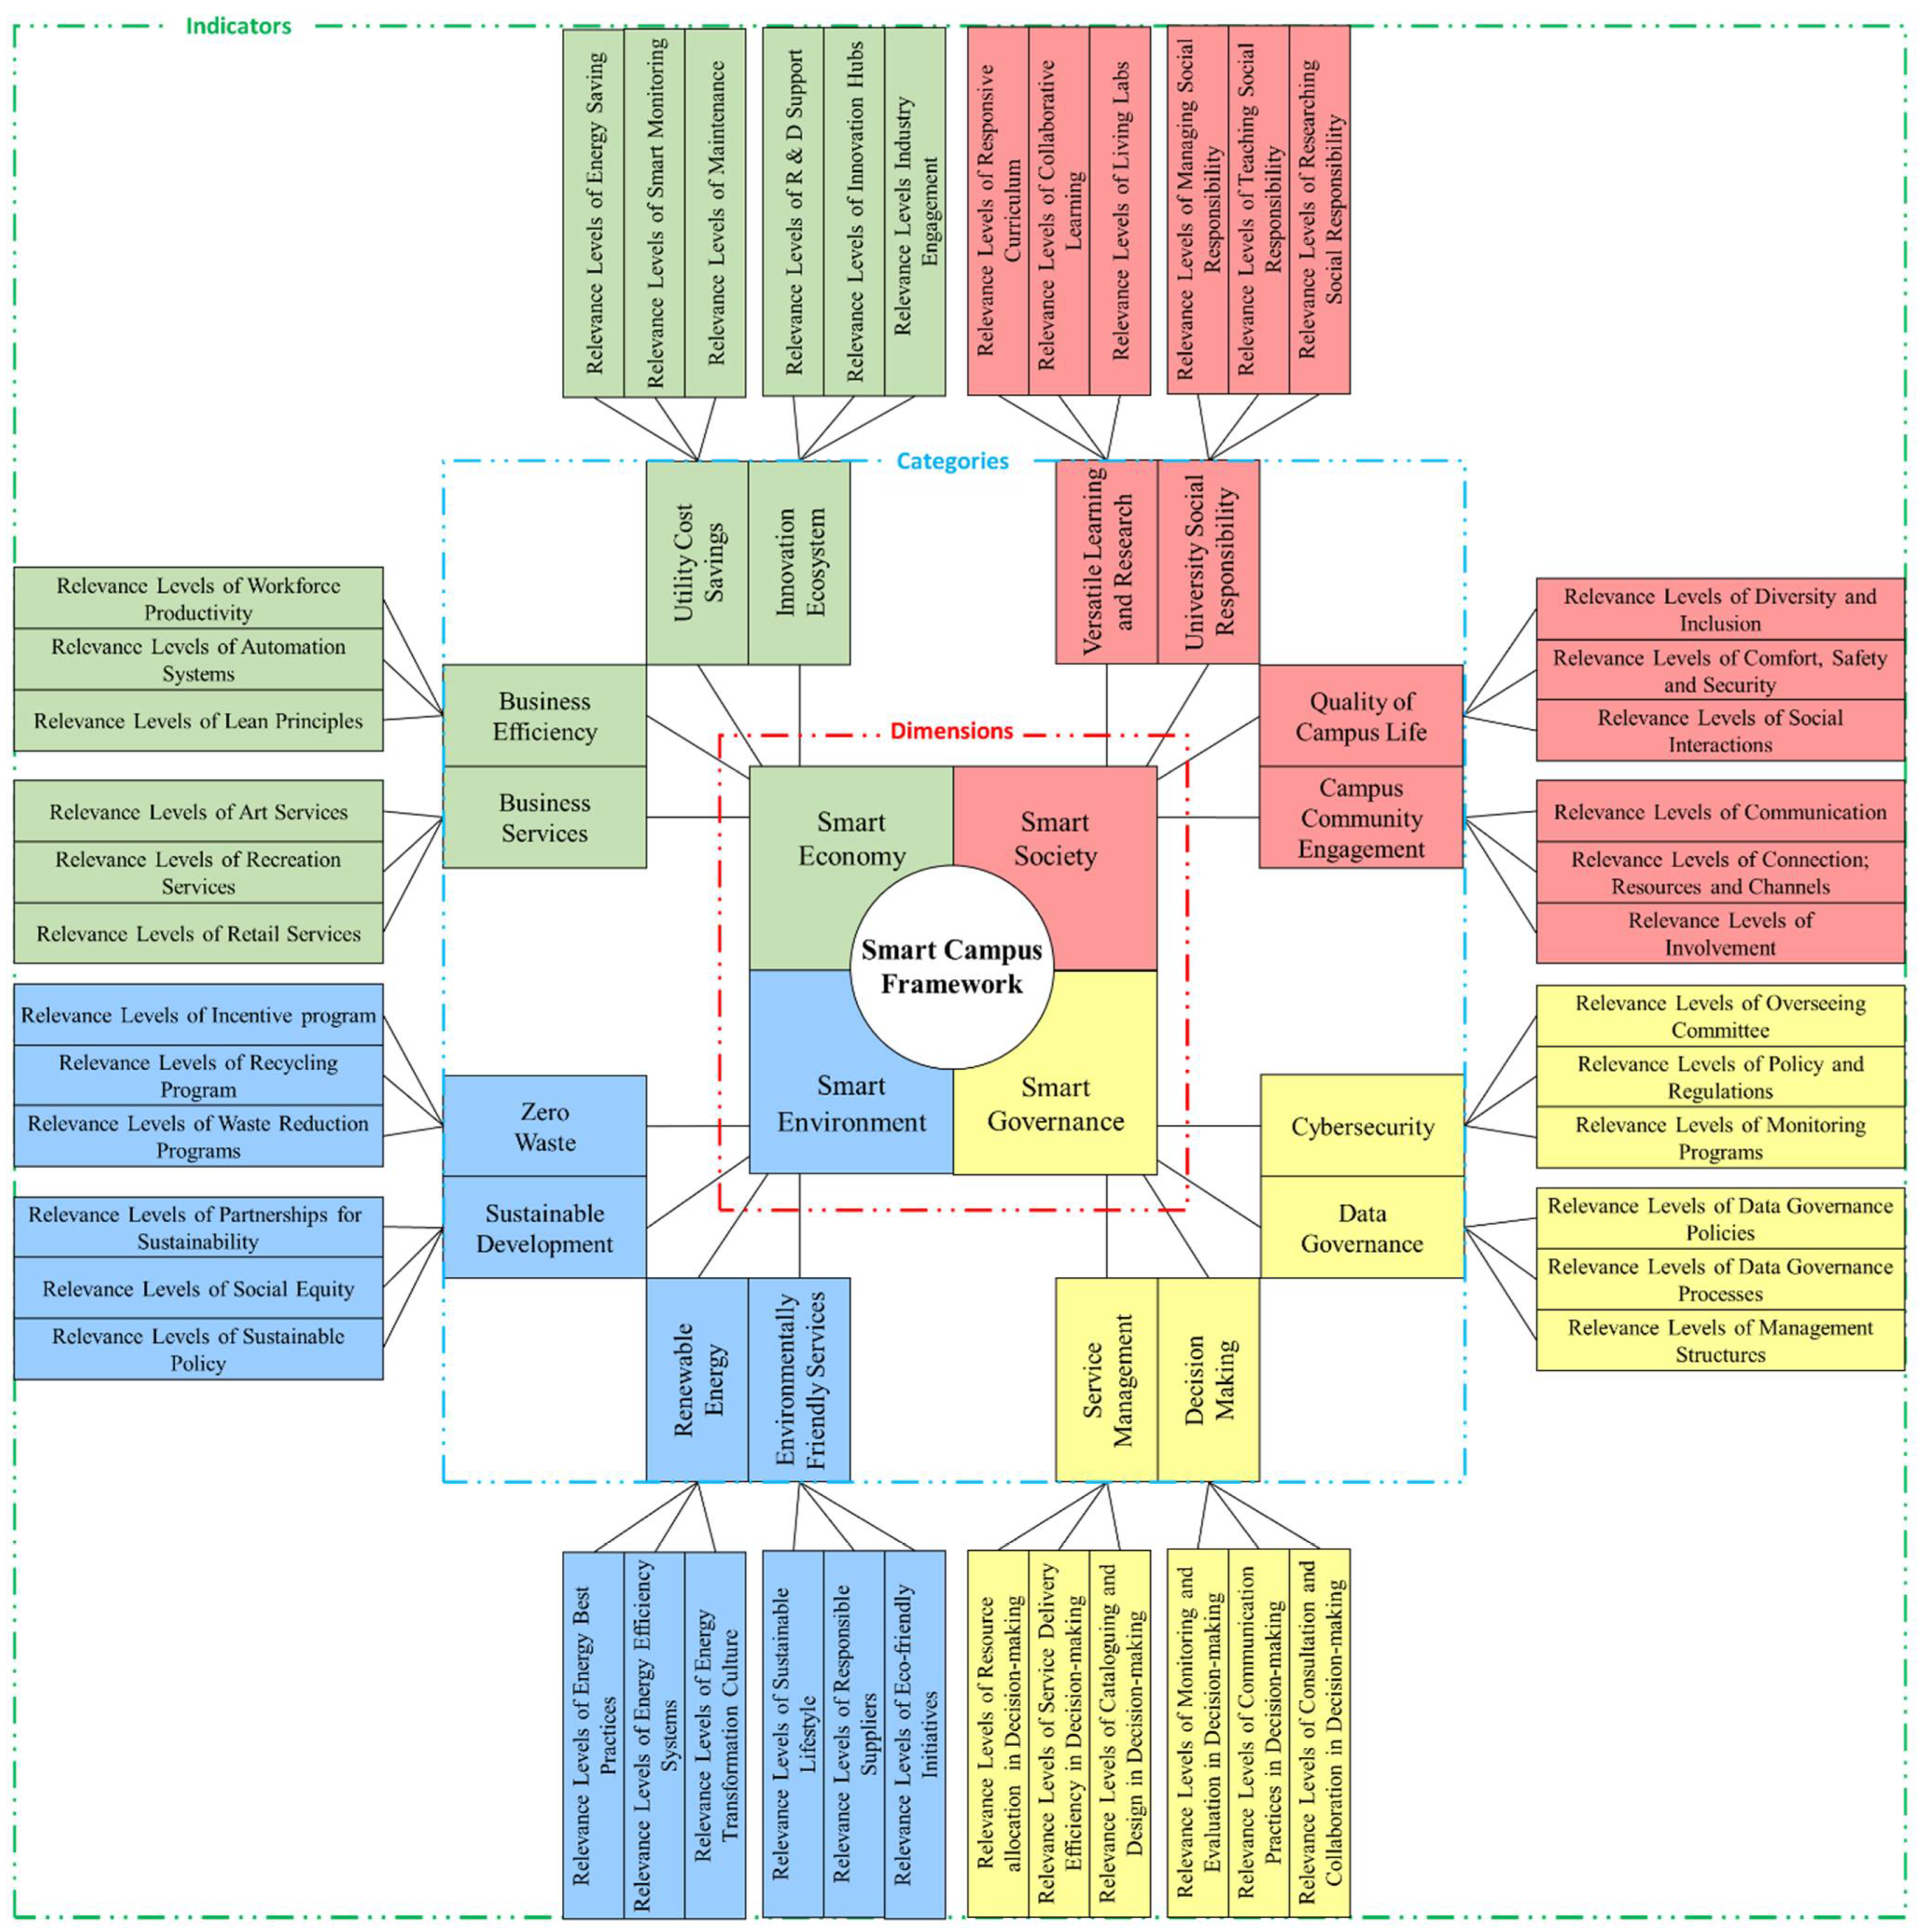
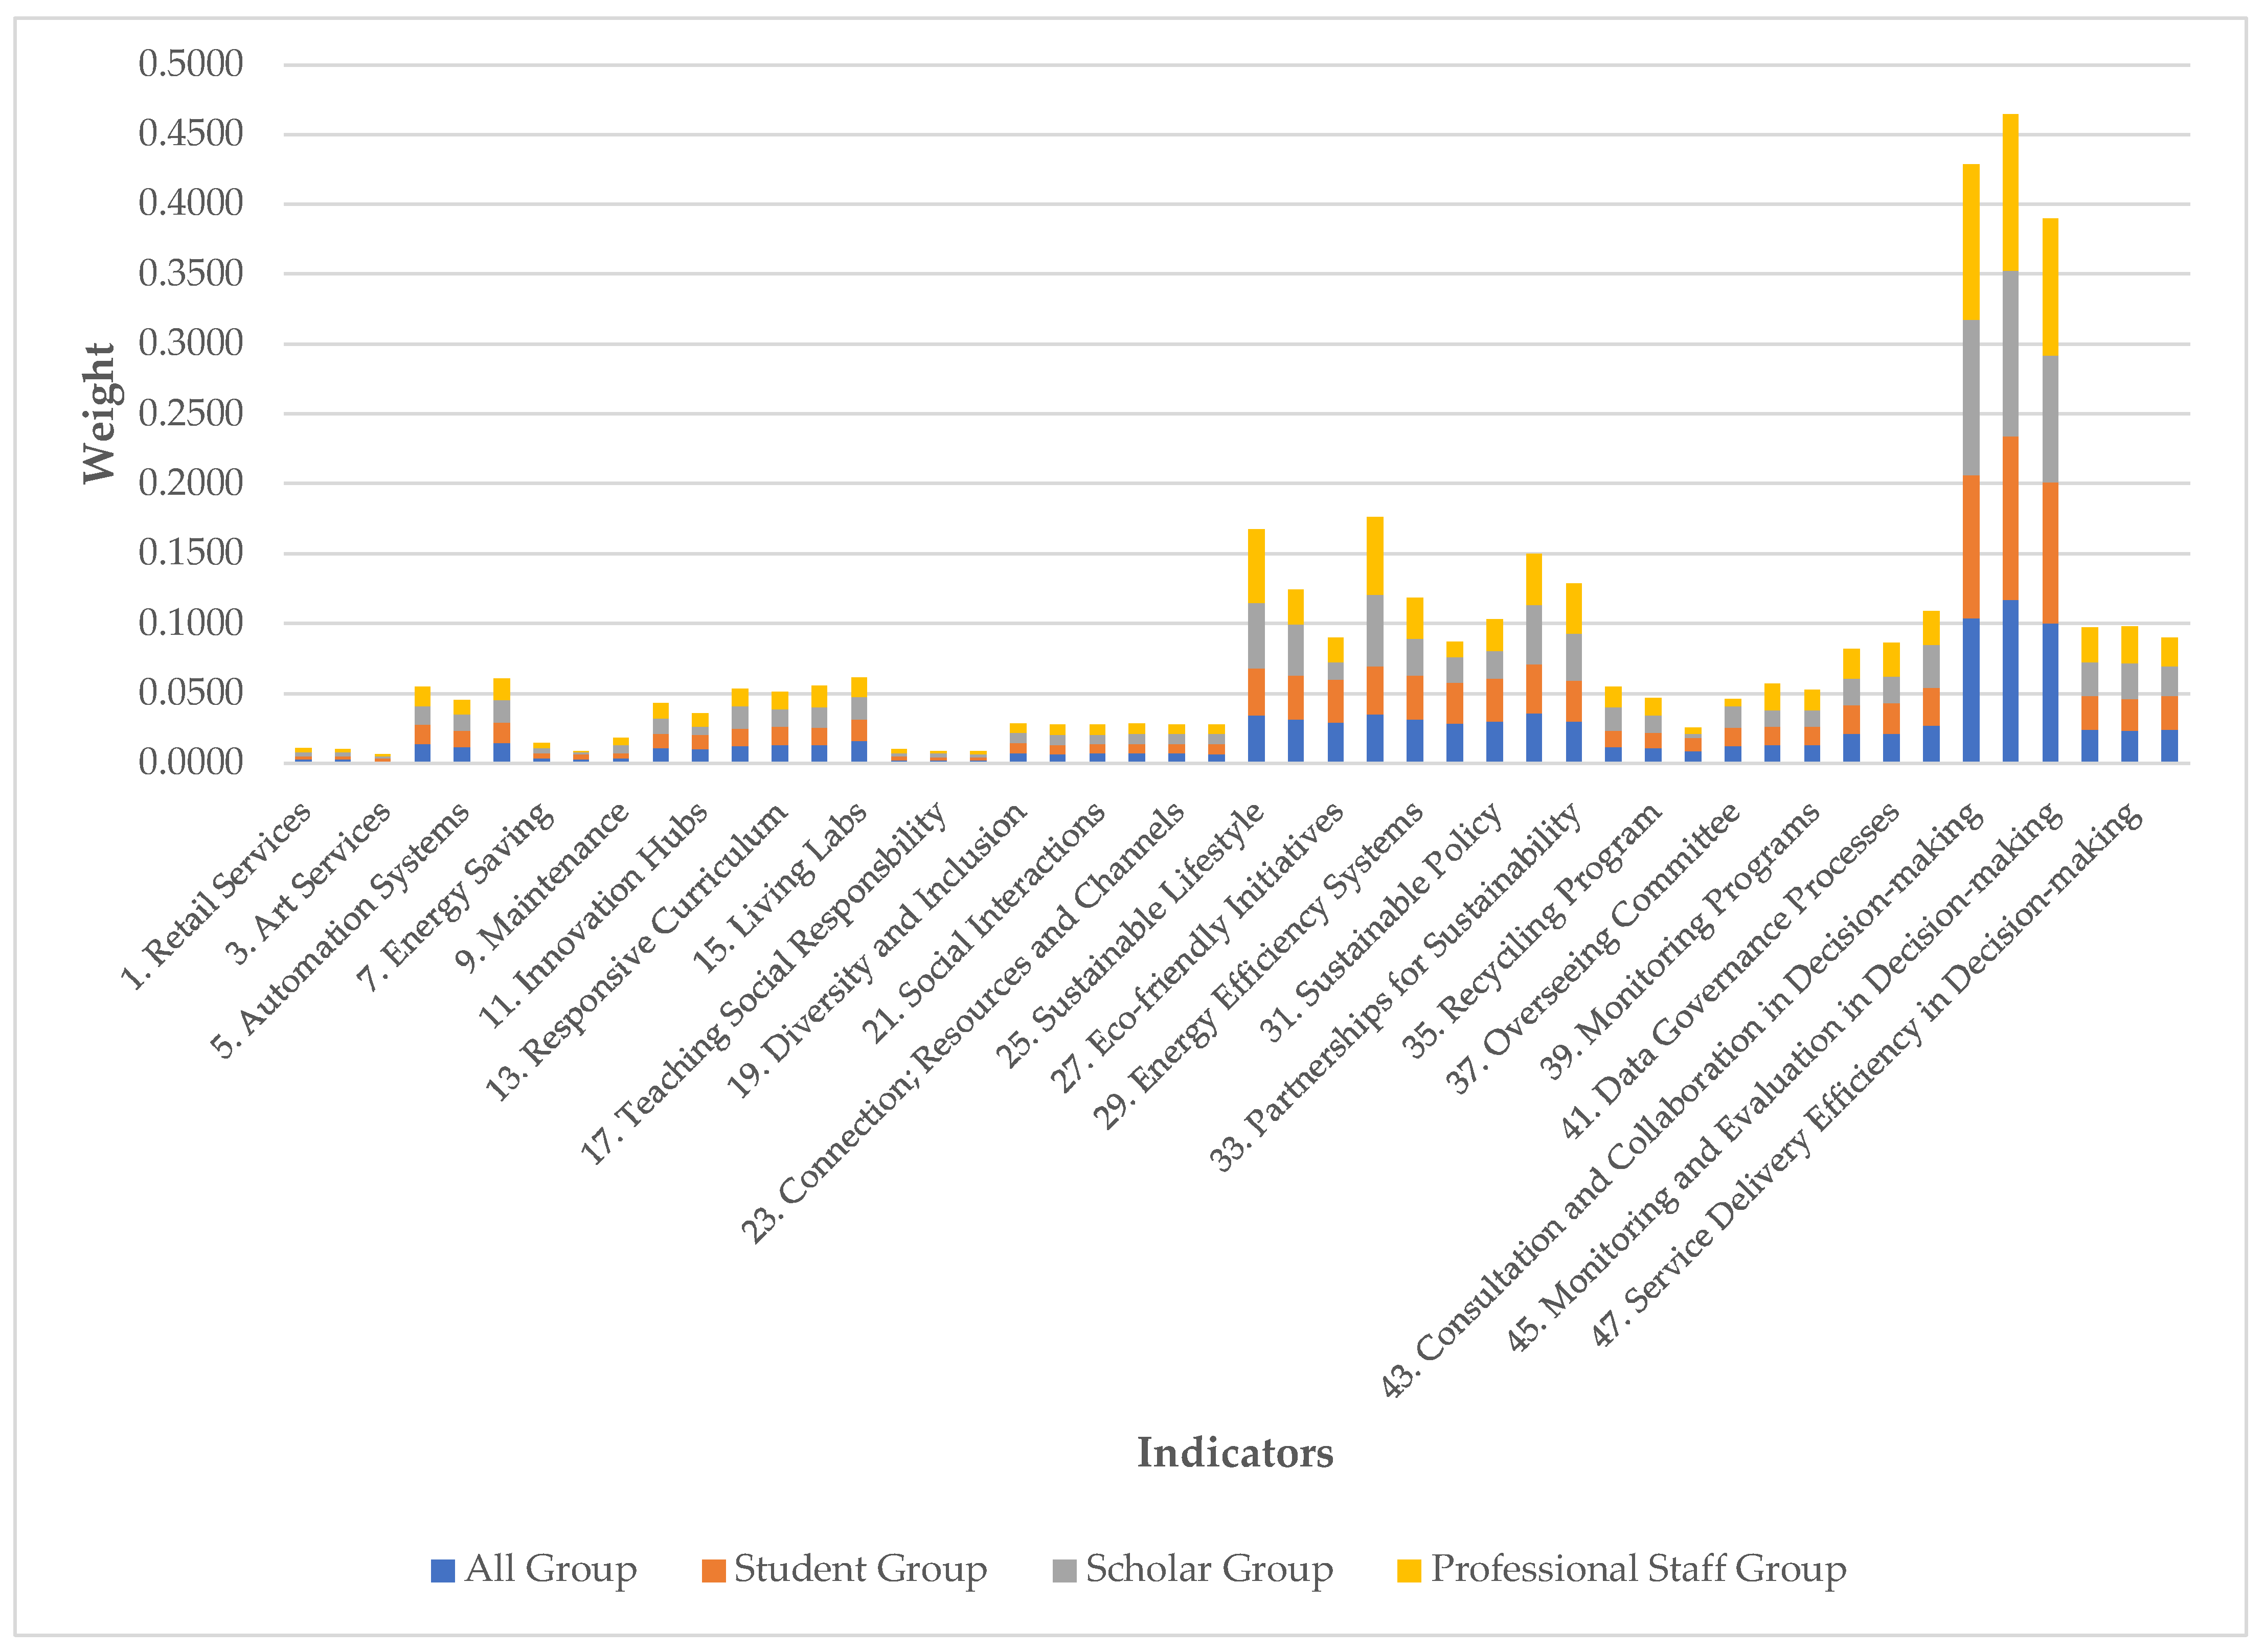
3.4.6. Indicator-Level Weighting

In this stage, we calculate the importance weights of all 48 indicators within their respective categories. As previously mentioned, the study employs the PO (Prioritization and Optimization) method for these calculations. A total of 278 respondents scored each indicator using a 5-point Likert scale system. Note that all weights are calculated relative to their specific categories. To determine the overall weights of indicators across all categories (accounting for both category and dimension weights), additional calculations are required. Table 10 shows the mean scores and the corresponding calculated weights for all indicators, derived using the PO method. The weight for each individual indicator was determined by dividing its mean score by the total mean score of its respective category. For example, the weight for the “Relevance Levels of Art Services” indicator is calculated by dividing its score of 1.6942 by the total mean category score of 7.0935, resulting in a weight of 0.2388.

3.4.7. Overall Category and Indicator Weights

The overall weights are now calculated for both categories and indicators, making it possible to compare the relative importance of all indicators and categories with respect to each other. Table 11 presents the overall weights of all criteria at each level. For the calculations, the overall weights of categories are obtained using Equation (8): we multiply each category’s weight by the weight of its respective dimension. For example, to calculate the overall weight of the business services category, we multiply its category weight (0.0763) by the weight of the dimension it belongs to—Smart Economy (0.0909)—which results in 0.0069. To calculate the overall weight of an indicator, based on Equation (9), we multiply the indicator’s weight by the weights of its respective category and dimension. For example, to calculate the overall weight of the Relevance Levels of Retail Services indicator, we multiply its weight (0.3722) by the weights of the business services category (0.0763) and the Smart Economy dimension (0.0909), which results in 0.0026.
Table 12 ranks the categories and indicators by overall weight. Based on this, the results for all participants across the three levels of the smart campus framework are summarised below.
Category overall weight = Weight Dimension × Weight Category
Indicator overall weight = Weight Dimension × Weight Category × Weight Indicator
Dimension Level
In the smart campus framework, at the dimension level, it can be observed that Smart Governance is the most important dimension, followed by Smart Environment. Both the Smart Economy and Smart Society dimensions are equally important but rank lower in significance compared to the other dimensions.
Category Level
Within the Smart Campus framework’s category-level analysis, Decision-making (from the Smart Governance dimension) emerges as the most significant category. This is followed in importance by environmentally friendly services, renewable energy, and sustainable development from the Smart Environment category. In contrast, business services (under Smart Economy) demonstrates relatively lower importance compared to other categories.
Indicator Level
At the indicator level of the smart campus framework, “Relevance Levels of Communication Practices in Decision-making” (decision-making category) ranks as the most significant indicator. The subsequent highest-ranking indicators are “Relevance Levels of Consultation and Collaboration in Decision-making” and “Relevance Levels of Monitoring and Evaluation in Decision-making”. Conversely, “Relevance Levels of Art Services” (business services category) shows comparatively lower importance among all indicators.

4. Findings and Discussion

The results of the study highlight the potential of applying a comprehensive smart campus framework that addresses a broader range of campus features, in contrast to prior studies that have focused primarily on specific algorithms or limited aspects of campus infrastructure. Using a smart campus assessment framework comprising 48 indicators, the study demonstrated consistent relevance across the indicators, with weights ranging from 0.001 to 0.011. Notably, the combined results from the three sample groups revealed that the highest aggregated weight—approximately 0.42—was attributed to Communication Practices under the Smart Governance dimension. In contrast, the lowest weightings, around 0.01, were shared by Art Services in the Smart Economy dimension and Researching Social Responsibility in the Smart Society dimension. A general consensus among the groups indicated alignment in the perceived relevance of smart campus indicators. Figure 9 presents the aggregated relevance weights for each group, offering insights into shared and differing institutional priorities.

4.1. Smart Governance: Highest Priority Dimension

Among all four dimensions, Smart Governance emerged as the most relevant. The highest-ranking indicators—Communication Practices, Consultation and Collaboration, and Monitoring and Evaluation—belong to the “Decision-Making” category and were consistently rated the most important across all stakeholder groups. As illustrated in Figure 9, these three indicators substantially outweighed the remaining 45 in perceived importance.
This finding reflects the centrality of formal governance processes in a state-owned, bureaucratic institution like PNGUoT, where transparency, compliance, and accountability are critical [72,73,74,75]. Communication and collaborative mechanisms serve as the operational backbone, enabling routine functions such as task delegation, reporting, and institutional oversight. The strong stakeholder consensus on these indicators underscores their relevance in ensuring organisational continuity and institutional legitimacy. These results align with previous studies emphasising the foundational role of governance capabilities in digital transformation strategies within public-sector institutions [30,35,73].

4.2. Smart Environment: Sustainability as a Pragmatic Priority

Smart Environment was the second-highest rated dimension. Key indicators—Energy Transformation Culture, Sustainable Lifestyle, and Social Equity—received high relevance scores from all stakeholder groups. These indicators reflect an awareness of sustainability, energy management, and inclusive development in the face of infrastructural and financial constraints.
In the PNGUoT context, energy-saving practices and renewable energy adoption are not just environmental choices but a necessary response to limited resources [76,77,78]. Participants acknowledged the economic imperative of conserving energy and maintaining a sustainable campus lifestyle, particularly given the growing availability of off-grid systems and small-scale renewable solutions [77]. The high relevance of Social Equity also highlights concerns about inclusion and fairness in institutional development. This suggests that sustainability, when framed through the lenses of affordability and access, holds significant appeal—even in developing country settings [45,46].

4.3. Smart Economy: Emerging Relevance, Limited Capacity

Smart Economy was rated lowest among the four dimensions overall, but select indicators showed moderate relevance. These included Workforce Productivity, Lean Principles, and Industry Engagement from the “Business Efficiency” and “Innovation Ecosystem” categories. These findings suggest that while economic innovation is not yet a primary institutional focus, there is growing recognition of its potential.
The relatively low relevance of indicators such as Retail Services and Art Services points to the limited commercial infrastructure and entrepreneurial culture on campus. However, the moderate scores for business efficiency indicators imply a desire to improve institutional performance through streamlined processes and partnerships [79,80,81]. These results support the literature highlighting the challenges and opportunities of innovation systems in the Global South, where institutional readiness often lags behind ambition [34,35,47].

4.4. Smart Society: Educational Relevance, Social Disconnect

Smart Society also scored relatively low overall, but with a few notable exceptions. The “Versatile Learning and Research” category received higher relevance scores, especially for Living Labs, Collaborative Learning, and Responsive Curriculum. These indicators reflect the institution’s core function as a centre for teaching and research, and stakeholder responses affirmed their value.
Despite this, indicators under the “University Social Responsibility” and “Campus Community Engagement” categories were rated less relevant. This suggests a gap between the university’s educational mission and its broader community engagement efforts, including the perceived relevance and applicability of emerging technologies such as AI for social good. Factors such as resource scarcity, weak institutional–community linkages, limited outreach infrastructure, and nascent AI awareness or capacity may contribute to this perception [82,83,84].
Nonetheless, the stronger performance of pedagogical indicators signals possible entry points for improvement. Curriculum reform, interdisciplinary learning environments, and lab-based pedagogy can serve as low-cost, high-impact strategies to enhance academic outcomes and graduate employability—goals consistent with sustainable smart campus development [19,21].

4.5. Stakeholder Consensus: Alignment Across Institutional Roles

One of the most significant findings of this study is the strong alignment in responses across the three stakeholder groups. As shown in Figure 9, students, academics, and administrative staff demonstrated consistent prioritisation of the top indicators, particularly those related to governance and environment. This convergence enhances the robustness of the findings and suggests shared institutional understanding of the university’s strategic priorities.
The observed consensus across organisational roles also indicates that stakeholders experience and interpret smart campus indicators in similar ways, increasing the framework’s credibility as a planning and assessment tool. In environments with limited resources, such alignment is critical for coordinated digital transformation and reinforces the importance of inclusive stakeholder engagement in smart campus planning [35,38].

4.6. Relevance of Framework in Global South Context

While the results affirm the overall structure and applicability of the Smart Campus Assessment Framework, they also point to the importance of contextual adaptation. Governance and sustainability dimensions, which scored highest, are institutionally embedded and operationally necessary. In contrast, dimensions related to economic and social innovation require more tailored approaches.
For instance, indicators developed in high-income contexts may assume a baseline of digital infrastructure, institutional autonomy, or community integration that may not exist in lower-income settings [85]. As a result, tools such as the framework analysed in this study must remain flexible, allowing institutions to recalibrate dimensions and indicators based on their own development stage and strategic goals [35,36,46].
This study supports calls for more inclusive and adaptive approaches to smart campus planning, especially in the Global South. The combination of top-down weighting via BWM and bottom-up validation through stakeholder perceptions offers a replicable model for other institutions aiming to contextualise global frameworks for local application.

5. Conclusions

This study critically examined the relevance and adaptability of an established smart campus assessment framework within a Global South context, using the Papua New Guinea University of Technology (PNGUoT) as a case institution. Acknowledging the limitations of frameworks developed in high-income settings, the research addressed a key gap by empirically testing the framework’s indicators in an environment marked by resource constraints, infrastructural limitations, and distinct sociocultural dynamics. The findings indicate that while the framework holds general applicability, stakeholder perceptions varied significantly across its dimensions, underscoring the importance of contextual adaptation.
Among the framework’s four dimensions, Smart Governance emerged as the most relevant, with strong stakeholder consensus around decision-making processes—particularly in areas such as communication, consultation and collaboration, and monitoring and evaluation. This reflects the governance-intensive nature of PNGUoT, a public institution operating within a bureaucratic system and subject to significant accountability requirements. The high prioritisation of governance indicators highlights an institutional emphasis on transparency, structure, and procedural integrity—features common in universities across the Global South operating under strict regulatory conditions.
Smart Environment ranked second in perceived importance, with indicators such as energy transformation culture, sustainable lifestyle, and social equity rated highly. These results suggest a growing stakeholder awareness of sustainability imperatives, particularly in contexts where financial and infrastructure limitations make efficiency and inclusion critical. The prominence of these indicators reveals a strategic inclination towards long-term environmental resilience, even under resource-constrained conditions.
By contrast, Smart Economy and Smart Society were rated as less relevant, with lower emphasis placed on indicators such as business services, retail operations, and university social responsibility. These findings may reflect the underdeveloped nature or lower prioritisation of economic and social innovation functions within PNGUoT’s institutional operations. Nonetheless, indicators like workforce productivity, industry engagement, and versatile learning environments received moderate relevance scores, suggesting a foundational potential that could be further developed with targeted support.
Importantly, the study revealed strong alignment across the three stakeholder groups—students, academic staff, and professional staff—on the prioritisation of indicators. This convergence strengthens the reliability of the findings and suggests a shared institutional ethos centred on governance and sustainability. However, several limitations are acknowledged: the study focused on a single institution, excluded external stakeholders (e.g., government agencies, community partners, suppliers), and relied exclusively on perceptual data. Future research should expand the empirical scope to multiple institutions across the Global South, incorporate additional contextual variables (e.g., digital infrastructure readiness, user capabilities), and examine the longitudinal progression of smart campus initiatives.
In sum, this study offers a critical, and a pioneering, empirical contribution to the evolving discourse on smart campus development in developing contexts. By grounding the assessment framework in stakeholder perspectives and contextual realities, it charts a pathway toward more inclusive, adaptable, and sustainable digital transformation strategies in higher education. The findings underscore the need to localise smart campus frameworks—bridging the gap between global innovation agendas and regional implementation capacities.

Author Contributions

K.P.: Data collection, processing, investigation, analysis, and writing—original draft; T.Y.: Supervision, conceptualization, writing—review and editing; M.L., T.W.: Supervision, writing—review and editing; F.G., A.P.: Methodology, formal analysis. All authors have read and agreed to the published version of the manuscript.

Funding

This research received no external funding.

Institutional Review Board Statement

This study received ethical approval from the Queensland University of Technology (QUT) Human Research Ethics Committee (Approval Number: LR 2024-8015-18650).

Informed Consent Statement

Informed consent was obtained from all subjects in the study.

Data Availability Statement

The data will be made available upon request.

Acknowledgments

The authors would like to thank the participants of the study for generously contributing their time and insights. We also extend our appreciation to the three reviewers whose constructive feedback significantly improved the quality of this study.

Conflicts of Interest

The authors declare no conflicts of interest.

References

  1. Rotta, M.; Sell, D.; Pacheco, R.; Yigitcanlar, T. Digital commons and citizen coproduction in smart cities: Assessment of Brazilian municipal e-government platforms. Energies 2019, 12, 2813. [Google Scholar] [CrossRef]
  2. Faisal, A.; Yigitcanlar, T.; Kamruzzaman, M.; Paz, A. Mapping two decades of autonomous vehicle research: A systematic scientometric analysis. J. Urban Technol. 2021, 28, 45–74. [Google Scholar] [CrossRef]
  3. Yigitcanlar, T.; Li, R.; Beeramoole, P.; Paz, A. Artificial intelligence in local government services: Public perceptions from Australia and Hong Kong. Gov. Inf. Q. 2023, 40, 101833. [Google Scholar] [CrossRef]
  4. Baba, K.; Elfaddouli, N.; Cheimanoff, N. The role of information and communication technologies in developing a smart campus with its four pillars’ architectural sketch. Educ. Inf. Technol. 2024, 29, 14815–14833. [Google Scholar] [CrossRef]
  5. Kumar, B.; Padmanabha, V.; Josephmani, P.; Dwivedi, R. Utilizing Packet Tracer Simulation to Modern Smart Campus Initiatives for a Sustainable Future. In Proceedings of the 2024 IEEE 12th International Conference on Smart Energy Grid Engineering, Oshawa, ON, Canada, 18–20 August 2024. [Google Scholar]
  6. Kandil, O.; Rosillo, R.; Aziz, R.; Fuente, D. Investigating the impact of the Internet of Things on higher education: A systematic literature review. J. Appl. Res. High. Educ. 2025, 17, 254–273. [Google Scholar] [CrossRef]
  7. Wang, K.; Pan, H.; Wu, C. Smart Campus Innovative Learning Model for Social Practitioners of Universities’ Third Mission: To Promote Good Health and Well-Being. Sustainability 2024, 16, 6017. [Google Scholar] [CrossRef]
  8. Jing, L.; Manta, O. Research on Digital Campus Construction Based on SOA Service Architecture. In Proceedings of the 3rd International Symposium on Big Data and Artificial Intelligence (ISBDAI 2022), Singapore, 9–10 December 2022; ACM: New York, NY, USA, 2022. [Google Scholar]
  9. Lian, J.; Chen, J. Research and Practice of Data Governance in Universities Based on Data Middleware. In Proceedings of the International Conference on Cloud Computing and Big Data (ICCBD2024), Dali, China, 26–28 July 2024; ACM: New York, NY, USA, 2024. 5p. [Google Scholar]
  10. Wang, Y. Report on Smart Education in China in Smart Education in China and Central & Eastern European Countries; Zhuang, R., Liu, D., Sampson, D., Mandic, D., Zou, S., Huang, Y., Huang, R., Eds.; Lecture Notes in Educational Technology; Springer Nature: Singapore, 2023. [Google Scholar]
  11. Alam, A.; Mohanty, A. Learning on the Move: A Pedagogical Framework for State-of-the-Art Mobile Learning. In Data Management, Analytics and Innovation; Sharma, N., Goje, A., Chakrabarti, A., Bruckstein, A.M., Eds.; Lecture Notes in Networks and Systems; Springer Nature: Singapore, 2023; Volume 662, pp. 735–748. [Google Scholar]
  12. Alam, A. Intelligence Unleashed: An Argument for AI-Enabled Learning Ecologies with Real World Examples of Today and a Peek into the Future. In Proceedings of the International Conference on Innovations in Computer Science, Electronics & Electrical Engineering 2022, Ashta, India, 14–15 February 2022. [Google Scholar]
  13. Alblaihed, M.; Ibrahem, U.; Altamimi, A.; Alqirnas, H.; Salem, M. Infosphere Is Reshaping: How the Internet of Things Leads Smart Campuses for Knowledge Management. Sustainability 2022, 14, 13580. [Google Scholar] [CrossRef]
  14. Afaneh, A.; Alshafei, I. The influence of smart technologies: A comparative study on developing Large to small scale smart cities and smart campuses. IOP Conf. Ser. Earth Environ. Sci. 2023, 1210, 012015. [Google Scholar] [CrossRef]
  15. Hussain, K.; Parandhaman, V.; Rohini, V.; Ravichandran, A.; Bhat, K.; Murugesan, G. Analysis of Developing IoT and Cloud Computing Based Smart Campuses and its Applications. In Proceedings of the International Conference on Advances in Computing, Communication and Applied Informatics 2024, Chennai, India, 9–10 May 2024. [Google Scholar]
  16. Xie, Y.; Zhan, N.; Xu, B. Multimodal data visualization method for digital twin campus construction. Int. J. Digit. Earth 2024, 17, 2431624. [Google Scholar] [CrossRef]
  17. Chen, S.; Li, Q.; Wang, T. Smart Campus and Student Learning Engagement. Int. J. Inf. Commun. Technol. Educ. 2024, 20, 1–22. [Google Scholar] [CrossRef]
  18. Liu, Y.; Zhang, Y.; Ji, X. Intelligent Campus Management System Combining Computer Data Processing and GIS Technology. In Proceedings of the 3rd International Conference on Electronic Information Technology and Smart Agriculture (ICEITSA 2023), Sanya, China, 8–10 December 2023; pp. 8–10. [Google Scholar]
  19. Imbar, R. Approaches that Contribute to a New Definition of the “Smart Campus” based on Smart Systems. In Proceedings of the 2024 International Conference on ICT for Smart Society (ICISS) 2024, Bandung, Indonesia, 4–5 September 2024. [Google Scholar]
  20. Mahariya, A.; Kumar, A.; Singh, R.; Gehlot, A.; Akram, A.; Twala, B.; Iqbal, M.; Priyadarshi, N. Smart Campus 4.0: Digitalization of University Campus with Assimilation of Industry 4.0 for Innovation and Sustainability. J. Adv. Res. Appl. Sci. Eng. Technol. 2023, 32, 120–138. [Google Scholar] [CrossRef]
  21. García-Mongea, M.; Zalbaa, B.; Casasb, R.; Canoc, E.; Guillén-Lambeaa, S.; Martínez, B. Is IoT monitoring key to improve building energy efficiency? Case study of a smart campus in Spain. Energy Build. 2023, 285, 112882. [Google Scholar] [CrossRef]
  22. Aion, N.; Helmandollar, L.; Wang, M.; Ng, J. Intelligent campus (iCampus) impact study. In Proceedings of the 2012 IEEE/WIC/ACMInternational Conferences on Web Intelligence and Intelligent Agent Technology, Macau, China, 4–7 December 2012; pp. 291–295. [Google Scholar]
  23. Pagliaro, F.; Mattoni, B.; Gugliermenti, F.; Bisegna, F.; Azzaro, B.; Tomei, F.; Catucci, S. A roadmap toward the development of Sapienza Smart Campus. In Proceedings of the 2016 IEEE 16th International Conference on Environment and Electrical Engineering (EEEIC), Florence, Italy, 7–10 June 2016. [Google Scholar]
  24. Dong, Z.Y.; Zhang, Y.; Yip, C.; Swift, S.; Beswick, K. Smart campus: Definition, framework, technologies, and services. IET Smart Cities 2020, 2, 43–54. [Google Scholar] [CrossRef]
  25. Janda, K.; Ruyssevelt, P.; Liddiard, R. 4DStock: Adding an organisational dimension to a 3D building stock model. In Proceedings of the European Council on an Energy-Efficient Economy Summer Study, Toulon/Hyeres, France, 6–11 June 2022. [Google Scholar]
  26. Khatun, S.; Khan, M.; Kadir, K.; Paul, A.; Hassan, S.; Aziz, A.; Taj, M. A Comparative Analysis of Smart Education Hub in terms of Cost-effective Infrastructure Remodelling and System Design. J. Eng. Sci. Technol. 2022, 18, 239–254. [Google Scholar]
  27. Djakhdjakha, L.; Cisse, H.; Farou, B. A modular ontology for Smart Campus. In Proceedings of the RIF’23: The 12th Seminary of Computer Science Research at Feminine (CEUR Workshop Proceedings), Constantine, Algeria, 9 March 2023; pp. 17–26. [Google Scholar]
  28. Rahman, E.F.; Erlangga, R. A systematic literature review on augmented reality in smart campus research. AIP Conf. Proc. 2023, 2734, 060004. [Google Scholar]
  29. Prasetyaningtyas, S.; Meliala, J.; Pratiwi, C.; Peranginangin, E. A Smart Campus Framework in Developing Countries: Systematic Literature Approach. In Proceedings of the 10th International Conference on ICT for Smart Society (ICISS), Bandung, Indonesia, 6–7 September 2023. [Google Scholar]
  30. Regehr, C.; Rule, N. Addressing challenges to recovery and building future resilience in the wake of COVID-19. J. Bus. Contin. Emerg. Plan. 2023, 17, 284–297. [Google Scholar] [CrossRef]
  31. Akbar, H.; Faturrahman, M.; Sidharta, S. Guidance in Designing a Smart Campus: A Systematic Literature Review. Proc. Comput. Sci. 2023, 227, 83–91. [Google Scholar] [CrossRef]
  32. Bellaj, M.; Bendahmane, A.; Younes, A.; Boudra, S.; Ennakra, M. A systematic review of smart campus technologies to improve students’ educational experiences. In Proceedings of the Mediterranean Smart Cities Conference (MSCC 2024), Martil, Morocco, 2–4 May 2024. [Google Scholar]
  33. Wei, X.; Yang, C. A study on the technology of reviewing smart campus construction under energy consumption limit constraints. Int. J. Environ. Sustain. Dev. 2024, 23, 176–193. [Google Scholar] [CrossRef]
  34. Izourane, F.; Ardchir, S.; Ounacer, S.; Azzouazi, M. Smart Campus Based on AI and IoT in the Era of Industry 5.0: Challenges and Opportunities. In Industry 5.0 and Emerging Technologies Transformation Through Technology and Innovations; Chakir, A., Bansal, R., Azzouazi, M., Eds.; Studies in Systems, Decision and Control; Springer: Cham, Switzerland, 2024; Volume 565, pp. 39–57. [Google Scholar]
  35. Polin, K.; Yigitcanlar, T.; Limb, L.; Washington, T. Smart Campus Performance Assessment: Framework Consolidation and Validation Through a Delphi Study. Buildings 2024, 14, 4057. [Google Scholar] [CrossRef]
  36. Jawwad, A.; Turab, N.; Al-Mahadin, G.; Owida, H.; Al-Nabulsi, J. A perspective on smart universities as being downsized smart cities: A technological view of internet of thing and big data. Indones. J. Electr. Eng. Comput. Sci. 2024, 35, 1162–1170. [Google Scholar]
  37. Das, D.; Lim, N.D.; Aravind, P. Developing a Smart and Sustainable Campus in Singapore. Sustainability 2022, 14, 14472. [Google Scholar] [CrossRef]
  38. Ahmed, V.; Saboor, S.; Ahmad, N.; Ghaly, M. A multi-attribute utility decision support tool for a smart campus—UAE as a case study. Front. Built Environ. 2022, 8, 1044646. [Google Scholar] [CrossRef]
  39. Samancioglu, N.; Nuere, S. A determination of the smartness level of university campuses: The Smart Availability Scale. J. Eng. Appl. Sci. 2023, 70, 10. [Google Scholar] [CrossRef]
  40. Moraes, P.; Pisani, F.; Borin, J. Smart University: A pathway for advancing Sustainable Development Goals. Int. Things 2024, 27, 101246. [Google Scholar] [CrossRef]
  41. Winarno, A.; Gadzali, S.; Kisahwan, D.; Hermana, D. Leadership and employee environmental performance: Mediation test from model job demands-resources dan sustainability perspective in micro level. Cogent Bus. Manag. 2025, 12, 2442091. [Google Scholar] [CrossRef]
  42. Yin, R. Case Study Research and Applications Design and Methods, 6th ed.; Sage Publications, Inc.: Thousand Oaks, CA, USA, 2018. [Google Scholar]
  43. Sperber, D.; Wilson, D. Pragmatics. UCL Wor. Pap. Linguist. 2005, 17, 353–388. [Google Scholar]
  44. Gilbert, N. Agent-Based Models, Sage Research Methods; Sage Publications: Thousand Oaks, CA, USA, 2020. [Google Scholar] [CrossRef]
  45. Ivancevich, J.; Matterson, M. Organizational Behavior and Management; Richard D. Irwin, Inc.: Homewood, IL, USA, 1990; pp. 71–72. [Google Scholar]
  46. Kolaiti, P. Perceptual relevance and art: Some tentative suggestions. J. Lit. Semant. 2020, 49, 99–117. [Google Scholar] [CrossRef]
  47. Díaz-Pérez, F. Relevance Theory and translation: Translating puns in Spanish film titles into English. J. Pragmat. 2014, 70, 108–129. [Google Scholar] [CrossRef]
  48. Marcet, E.; Sasamoto, R. Examining interlanguage pragmatics from a relevance-theoretic perspective: Challenges in L2 production. Intercult. Pragmat. 2023, 20, 405–427. [Google Scholar] [CrossRef]
  49. Víctor, M.; Galván-Vela, E.; Ravina-Ripoll, R.; Popescu, C. A Focus on Ethical Value under the Vision of Leadership, Teamwork, Effective Communication and Productivity. J. Risk Financ. Manag. 2021, 14, 522. [Google Scholar]
  50. Li, N.; Palaoag, L.; Du, H.; Guo, T. Design and Optimization of Smart Campus Framework Based on Artificial Intelligence. J. Inf. Syst. Eng. Manag. 2023, 8, 23086. [Google Scholar]
  51. Stuckey, M.; Hofstein, A.; Mamlok-Naaman, R.; Eilks, I. The meaning of ‘relevance’ in science education and its implications for the science curriculum. Stud. Sci. Educ. 2013, 49, 1–34. [Google Scholar] [CrossRef]
  52. Herranen, J.; Aksela, M.; Kaul, M.; Lehto, S. Teachers’ Expectations and Perceptions of the Relevance of Professional Development MOOCs. Educ. Sci. 2021, 11, 240. [Google Scholar] [CrossRef]
  53. Bearden, W.; Netemeyer, R. Attitudes, About the Performance of Business Firms, Satisfaction and Post-Purchase Behavior, Consumer Attitudes toward Business Practices and Marketing Social Agencies, and the Marketplace; 2011 Product: Sage Research Methods; Sage Publications: Thousand Oaks, CA, USA, 2011. [Google Scholar]
  54. Lundstrom, W.; Lamont, L. The Development of a Scale to Measure Consumer Discontent. J. Mark. Res. 1976, 13, 373–381. [Google Scholar] [CrossRef]
  55. Parasuraman, A.; Zeithaml, V.; Berry, L. SERVQUAL: A Multiple-Item Scale for Measuring Consumer Perceptions of Service Quality. J. Retail. 1988, 64, 12–40. [Google Scholar]
  56. Polin, K.; Yigitcanlar, T.; Limb, M.; Washington, T. The making of smart campus: A review and conceptual framework. Buildings 2023, 13, 891. [Google Scholar] [CrossRef]
  57. Bienstock, C.; Mentzer, J.; Bird, M. Measuring Physical Distribution Service Quality. J. Acad. Mark. Sci. 1997, 25, 31–44. [Google Scholar] [CrossRef]
  58. Rodríguez, C.V. Relevance and creativity and the translation of multimedia tourist material. Cult. Lang. Represent. 2023, XXXI, 189–214. [Google Scholar]
  59. Likert, R. A technique for the measurement of attitudes. Arch. Psychol. 1932, 22, 55. [Google Scholar]
  60. McIver, J.; Carmines, E. Likert Scaling; Sage Research Methods; SAGE Publications, Inc.: Thousand Oaks, CA, USA, 2011. [Google Scholar] [CrossRef]
  61. Jamieson, S. Likert scales: How to (ab)use them. Med. Educ. 2004, 38, 1217–1218. [Google Scholar] [CrossRef]
  62. Norman, G. Likert scales, levels of measurement and the ‘‘laws’’ of statistics. Adv. Health Sci. Educ. 2010, 15, 625–632. [Google Scholar] [CrossRef]
  63. Bishop, P.; Herron, R. Use and Misuse of the Likert Item Responses and Other Ordinal Measures. Int. J. Exerc. Sci. 2015, 8, 297. [Google Scholar] [CrossRef] [PubMed]
  64. Creswell, J.W. Educational Research: Planning, Conducting, and Evaluating Quantitative and Qualitative Research, 4th ed.; Pearson: Boston, MA, USA, 2012. [Google Scholar]
  65. Yin, R.K. Case Study Research Design and Methods, 4th ed.; SAGE Publications, Inc.: Thousand Oaks, CA, USA, 2009. [Google Scholar]
  66. Rubin, H.; Rubin, I. Qualitative Interviewing the Art of Hearing Data, 3rd ed.; SAGE Publishing: Thousand Oaks, CA, USA, 2012. [Google Scholar]
  67. Omrani, H.; Amini, M.; Alizadeh, A. An integrated group best-worst method–Data envelopment analysis approach for evaluating road safety: A case of Iran. Measurement 2020, 152, 107330. [Google Scholar] [CrossRef]
  68. Rezaei, J. Best-worst multi-criteria decision-making method: Some properties and a linear model. Omega 2016, 64, 126–130. [Google Scholar] [CrossRef]
  69. Gan, X.; Fernandez, I.; Guo, J.; Wilson, M.; Zhao, W.; Zhou, B.; Wu, J. When to use what: Methods for weighting and aggregating sustainability indicators. Ecol. Ind. 2017, 81, 491–502. [Google Scholar] [CrossRef]
  70. Parker, J. Environmental Reporting and Environmental Indices. Ph.D. Thesis, University of Cambridge, Cambridge, UK, 1991. [Google Scholar]
  71. Fazeli, H.; Attarzadeh, B. Problematizing Iranian university autonomy: A historical-institutional perspective. Int. J. Cult. Policy 2024, 30, 877–898. [Google Scholar] [CrossRef]
  72. Alsharif, M. The structural modelling of significant organisational and individual factors for promoting sustainable campus in Saudi Arabia. Front. Sustain. 2024, 5, 1231468. [Google Scholar] [CrossRef]
  73. Kristinsson, S. Constructing Universities for Democracy. Stud. Philos. Educ. 2023, 42, 181–200. [Google Scholar] [CrossRef]
  74. Pruvot, E.; Estermann, T. University Governance: Autonomy, Structures and Inclusiveness. In European Higher Education Area: The Impact of Past and Future Policies; Curaj, A., Deca, L., Pricopie, R., Eds.; Springer Open: Cham, Switzerland, 2021; pp. 619–638. [Google Scholar]
  75. Paspatis, A.; Fiorentzis, K.; Katsigiannis, Y.; Karapidakis, E. Smart Campus Microgrids towards a Sustainable Energy Transition— The Case Study of the Hellenic Mediterranean University in Crete. Mathematics 2022, 10, 1065. [Google Scholar] [CrossRef]
  76. Sugiarto, A.; Lee, C.; Huruta, A. A Systematic Review of the Sustainable Campus Concept. Behav. Sci. 2022, 12, 130. [Google Scholar] [CrossRef]
  77. Wang, J.; Zhang, W.; Zhao, M.; Lai, X.; Chang, L.; Wang, Z. Efficiency of higher education financial resource allocation from the perspective of ‘double first-class’ construction: A three-stage global super slacks-based measure analysis. Edu. Inf. Technol. 2024, 29, 12047–12075. [Google Scholar] [CrossRef]
  78. Ganshina, E. Static and dynamic approaches in industrial metrology in the framework of measuring enterprise productivity. J. Phys. Conf. Ser. 2021, 1889, 042053. [Google Scholar] [CrossRef]
  79. Eklund, J. Theknowledge-incentive tradeoff: Understanding the relationship between research and development decentralization and innovation. Strat. Manag. J. 2022, 43, 2478–2509. [Google Scholar] [CrossRef]
  80. Salvadorinho, J.; Teixeira, L. Stories Told by Publications about the Relationship between Industry 4.0 and Lean: Systematic Literature Review and Future Research. Agenda Publ. 2021, 9, 29. [Google Scholar] [CrossRef]
  81. Dehbozorgi, M.; Rossi, M.; Terzi, S.; Carminati, L.; Sala, R.; Magni, F.; Pirola, F.; Pozz, R.; Strozzi, F.; Rossi, T. AI Education for Tomorrow’s Workforce: Leveraging Learning Factories for AI Education and Workforce Preparedness. In Proceedings of the 2024 IEEE 8th Forum on Research and Technologies for Society and Industry Innovation (RTSI), Milano, Italy, 18–20 September 2024; pp. 677–682. [Google Scholar]
  82. Konstantinidis, E.; Petsani, D.; Bamidis, P. Teaching university students co-creation and living lab methodologies through experiential learning activities and preparing them for RRI. Health Inform. J. 2021, 27, 1460458221991204. [Google Scholar] [CrossRef]
  83. Nhem, D. Quality in higher education: What do students in Cambodia perceive? Tert. Educ. Manag. 2022, 28, 43–59. [Google Scholar] [CrossRef]
  84. Yigitcanlar, T.; Agdas, D.; Degirmenci, K. Artificial intelligence in local governments: Perceptions of city managers on prospects, constraints and choices. AI Soc. 2023, 38, 1135–1150. [Google Scholar] [CrossRef]
  85. Yigitcanlar, T.; Guaralda, M.; Taboada, M.; Pancholi, S. Place making for knowledge generation and innovation: Planning and branding brisbane’s knowledge community precincts. J. Urban Technol. 2016, 23, 115–146. [Google Scholar] [CrossRef]
Figure 1. Case-study plan.
Sustainability 17 06369 g001
Figure 2. Descriptive case-study path.
Sustainability 17 06369 g002
Figure 3. Smart campus framework.
Sustainability 17 06369 g003
Figure 4. The relative importance of smart campus dimensions.
Sustainability 17 06369 g004
Figure 5. The relative importance of Smart Economy categories.
Sustainability 17 06369 g005
Figure 6. The relative importance of Smart Society categories.
Sustainability 17 06369 g006
Figure 7. The relative importance of Smart Environment categories.
Sustainability 17 06369 g007
Figure 8. The relative importance of Smart Governance categories.
Sustainability 17 06369 g008
Figure 9. Groups aggregated weights.
Sustainability 17 06369 g009
Table 1. Smart campus assessment framework.
DimensionCategoryIndicator
Smart EconomyBusiness ServicesRetail Services
Recreation Services
Art Services
Business EfficiencyLean Principles
Automation Systems
Workforce Productivity
Utility Cost SavingsEnergy Saving
Smart Monitoring
Maintenance
Innovation EcosystemR&D Support
Innovation Hubs
Industry Engagement
Smart SocietyVersatile Learning and ResearchResponsive Curriculum
Collaborative Learning
Living Labs
University Social ResponsibilityManaging Social Responsibility
Teaching Social Responsibility
Researching Social Responsibility
Quality Of Campus LifeDiversity and Inclusion
Comfort, Safety and Security
Social Interactions
Campus Community EngagementCommunication
Connection; Resources and Channels
Involvement
Smart EnvironmentEnvironmentally Friendly ServicesSustainable Lifestyle
Responsible Suppliers
Eco-friendly Initiatives
Renewable EnergyEnergy Transformation Culture
Energy Efficiency Systems
Energy Best Practices
Sustainable DevelopmentSustainable Policy
Social Equity
Partnerships for Sustainability
Zero WasteWaste Reduction Programs
Recycling Program
Incentive Program
Smart GovernanceCybersecurityOverseeing Committee
Policy and Regulations
Monitoring Programs
Data GovernanceData Governance Policies
Data Governance Processes
Management Structures
Decision-MakingConsultation and Collaboration
Communication Practices
Monitoring and Evaluation
Service ManagementCataloguing and Design
Service Delivery Efficiency
Resource Allocation
Table 2. Participant profiles.
PositionQualificationAverage Period of Employment (Years)
Associate professorPhD16
Senior lecturerMasters
ManagerBachelor’s degree
AdministratorDiploma
EngineerTrade certificate
Principle technical instructor
Senior technical officer
Table 3. Typical 5-point online Likert-scale question.
Indicator0 (Not Available)1 (Very Irrelevant)2 (Irrelevant)3 (Neither Relevant nor Irrelevant)4 (Relevant)5 (Very Relevant)
Retail services: Variety of food, retail, and other business services
Table 4. Target interview survey questions.
School/Section:
Estates and Services
0 (Not Available)1 (Very Irrelevant)2 (Irrelevant)3 (Neither Relevant nor Irrelevant)4 (Relevant)5 (Very Relevant)
Retail services: Variety of food, retail, and other business services
Table 5. The importance weights of smart campus dimensions.
DimensionWeight
Smart EconomyW1: 0.0909
Smart SocietyW2: 0.0909
Smart EnvironmentW3: 0.3182
Smart GovernanceW4: 0.5000
Table 6. The importance weights of Smart Economy categories.
CategoryWeight
Business servicesW1: 0.0763
Business efficiencyW2: 0.4417
Utility cost savingsW3: 0.1165
Innovation ecosystemW4: 0.3655
Table 7. The importance weights of Smart Society categories.
CategoryWeight
Versatile learning and researchW1: 0.4615
University social responsibilityW2: 0.0769
Utility cost savingsW3: 0.2308
Campus community engagementW4: 0.2308
Table 8. The importance weights of Smart Environment categories.
CategoryWeight
Environmentally friendly servicesW1: 0.3000
Renewable energyW2: 0.3000
Sustainable developmentW3: 0.3000
Zero wasteW4: 0.1000
Table 9. The importance weights of Smart Governance categories.
CategoryWeight
CybersecurityW1: 0.077960
Data governanceW2: 0.138595
Decision-makingW3: 0.641001
Service managementW4: 0.142445
Table 10. The importance weights of indicators within their subgroups.
DimensionsCategoriesIndicatorsAll ParticipantsStudentsScholarsAdministrative/Professional Staff
Mean ScoreIndicator WeightMean ScoreIndicator WeightMean ScoreIndicator WeightMean ScoreIndicator Weight
1. Smart Economy1. Business services1. Relevance Levels of Retail Services2.64030.37222.61020.36792.76920.38713.18180.4545
2. Relevance Levels of Recreation Services2.75900.38892.78740.39292.69230.37632.18180.3117
3. Relevance Levels of Art Services1.69420.23881.69690.23921.69230.23661.63640.2338
2. Business efficiency4. Relevance Levels of Lean Principles2.24190.34262.20160.34282.23080.32583.18180.3535
5. Relevance Levels of Automation Systems1.90290.29081.88190.29301.92310.28092.36360.2626
6. Relevance Levels of Workforce Productivity2.39930.36662.33860.36412.69230.39333.45450.3838
3. Utility cost savings7. Relevance Levels of Energy Saving1.85970.32931.85830.32551.76920.38982.00000.3607
8. Relevance Levels of Smart Monitoring1.72300.30511.83460.32140.46150.10170.63640.1148
9. Relevance Levels of Maintenance2.06470.36562.01570.35312.30770.50852.90910.5246
4. Innovation ecosystem10. Relevance Levels of R & D Support2.16190.32232.18900.32182.00000.33331.72730.3220
11. Relevance Levels of Innovation Hubs2.04680.30512.11810.31131.07690.17951.54550.2881
12. Relevance Levels Industry Engagement2.50000.37272.49610.36692.92310.48722.09090.3898
2. Smart Society5. Versatile learning and research13. Relevance Levels of Responsive Curriculum2.55760.31282.57870.31432.61540.29312.00000.3014
14. Relevance Levels of Collaborative Learning2.53600.31022.51570.30663.00000.33622.45450.3699
15. Relevance Levels of Living Labs3.08270.37703.11020.37913.30770.37072.18180.3288
6. University social responsibility16. Relevance Levels of Managing Social Responsibility2.68350.35312.64960.35093.00000.33913.09090.4250
17. Relevance Levels of Teaching Social Responsibility2.42810.31952.39760.31753.30770.37392.09090.2875
18. Relevance Levels of Researching Social Responsibility2.48920.32752.50390.33162.53850.28702.09090.2875
7. Quality of campus life19. Relevance Levels of Diversity and Inclusion3.02160.35402.95280.35833.84620.33113.63640.3101
20. Relevance Levels of Comfort, Safety and Security2.66910.31272.53940.30824.15380.35763.90910.3333
21. Relevance Levels of Social Interactions2.84530.33332.74800.33353.61540.31134.18180.3566
8. Campus community engagement22. Relevance Levels of Communication2.81650.33552.72830.33523.69230.33573.81820.3415
23. Relevance Levels of Connection; Resources and Channels2.83810.33812.76380.33953.53850.32173.72730.3333
24. Relevance Levels of Involvement2.74010.32642.64820.32533.76920.34273.63640.3252
3. Smart Environment9. Environmentally friendly services25. Relevance Levels of Sustainable Lifestyle2.46040.36292.36220.34843.69230.48983.27270.5538
26. Relevance Levels of Responsible Suppliers2.24100.33052.24020.33042.84620.37761.54550.2615
27. Relevance Levels of Eco-friendly Initiatives2.07910.30662.17720.32111.00000.13271.09090.1846
10. Renewable energy28. Relevance Levels of Energy Transformation Culture2.07550.37062.09060.36021.92310.53191.90910.5833
29. Relevance Levels of Energy Efficiency Systems1.84530.32951.92520.33181.00000.27661.00000.3056
30. Relevance Levels of Energy Best Practices1.67990.29991.78740.30800.69230.19150.36360.1111
11. Sustainable development31. Relevance Levels of Sustainable Policy2.12230.31412.16930.32351.38460.20451.90910.2414
32. Relevance Levels of Social Equity2.52880.37432.48430.37053.00000.44323.00000.3793
33. Relevance Levels of Partnerships for Sustainability2.10470.31152.05140.30602.38460.35233.00000.3793
12. Zero waste34. Relevance Levels of Waste Reduction Programs1.91010.37531.92520.36791.61540.51221.90910.4667
35. Relevance Levels of Recycling Program1.75900.34561.79130.34241.23080.39021.63640.4000
36. Relevance Levels of Incentive program1.42090.27921.51570.28970.30770.09760.54550.1333
4. Smart Governance13. Cybersecurity37. Relevance Levels of Overseeing Committee1.67990.32731.78740.32900.76920.38460.27270.1429
38. Relevance Levels of Policy and Regulations1.73380.33781.82680.33620.61540.30770.90910.4762
39. Relevance Levels of Monitoring Programs1.71940.33501.81890.33480.61540.30770.72730.3810
14. Data governance40. Relevance Levels of Data Governance Policies2.13670.30062.14960.30121.46150.27542.63640.3085
41. Relevance Levels of Data Governance Processes2.20140.30972.20470.30891.46150.27543.00000.3511
42. Relevance Levels of Management Structures2.76980.38972.78350.39002.38460.44932.90910.3404
15. Decision-making43. Relevance Levels of Consultation and Collaboration in Decision-making2.74100.32302.63390.31993.46150.34624.36360.3478
44. Relevance Levels of Communication Practices in Decision-making3.09710.36503.01180.36593.69230.36924.36360.3478
45. Relevance Levels of Monitoring and Evaluation in Decision-making2.64750.31202.58660.31422.84620.28463.81820.3043
16. Service management46. Relevance Levels of Cataloguing and Design in Decision-making2.68710.33832.61420.33773.23080.33873.72730.3475
47. Relevance Levels of Service Delivery Efficiency in Decision-making2.58990.32612.48820.32153.46150.36293.90910.3644
48. Relevance Levels of Resource allocation in Decision-making2.66550.33562.63780.34082.84620.29843.09090.2881
Table 11. Overall importance weights of criteria in smart campus framework.
DimensionCategoryCategory Overall WeightIndicatorAll ParticipantsStudentsScholarsAdministrative/Professional Staff
Indicator WeightIndicator Overall WeightIndicator WeightIndicator Overall WeightIndicator WeightIndicator Overall WeightIndicator WeightIndicator Overall Weight
1. Smart economy, W: 0.09091. Business services, W: 0.0763 0.00691. Relevance Levels of Retail Services0.37220.00260.36790.00260.38710.00270.45450.0032
2. Relevance Levels of Recreation Services0.38890.00270.39290.00270.37630.00260.31170.0022
3. Relevance Levels of Art Services0.23880.00170.23920.00170.23660.00160.23380.0016
2. Business efficiency, W: 0.44170.04024. Relevance Levels of Lean Principles0.34260.01380.34280.01380.32580.01310.35350.0142
5. Relevance Levels of Automation Systems0.29080.01170.29300.01180.28090.01130.26260.0105
6. Relevance Levels of Workforce Productivity0.36660.01470.36410.01460.39330.01580.38380.0154
3. Utility cost savings, W: 0.11650.01067. Relevance Levels of Energy Saving0.32930.00350.32550.00340.38980.00410.36070.0038
8. Relevance Levels of Smart Monitoring0.30510.00320.32140.00340.10170.00110.11480.0012
9. Relevance Levels of Maintenance0.36560.00390.35310.00370.50850.00540.52460.0056
4. Innovation ecosystem, W: 0.36550.033210. Relevance Levels of R & D Support0.32230.01070.32180.01070.33330.01110.32200.0107
11. Relevance Levels of Innovation Hubs0.30510.01010.31130.01030.17950.00600.28810.0096
12.Relevance Levels Industry Engagement0.37270.01240.36690.01220.48720.01620.38980.0130
2. Smart society, W: 0.09095. Versatile learning and research, W: 0.46150.042013. Relevance Levels of Responsive Curriculum0.31280.01310.31430.01320.29310.01230.30140.0126
14. Relevance Levels of Collaborative Learning0.31020.01300.30660.01290.33620.01410.36990.0155
15. Relevance Levels of Living Labs0.37700.01580.37910.01590.37070.01560.32880.0138
6. University social responsibility, W: 0.07690.007016. Relevance Levels of Managing Social Responsibility0.35310.00250.35090.00250.33910.00240.42500.0030
17. Relevance Levels of Teaching Social Responsbility0.31950.00220.31750.00220.37390.00260.28750.0020
18. Relevance Levels of Researching Social Responsibility0.32750.00230.33160.00230.28700.00200.28750.0020
7. Quality of campus life, W: 0.23080.021019. Relevance Levels of Diversity and Inclusion0.35400.00740.35830.00750.33110.00690.31010.0065
20. Relevance Levels of Comfort, Safety and Security0.31270.00660.30820.00650.35760.00750.33330.0070
21. Relevance Levels of Social Interactions0.33330.00700.33350.00700.31130.00650.35660.0075
8. Campus community engarement, W: 0.23080.021022. Relevance Levels of Communication0.33550.00700.33520.00700.33570.00700.34150.0072
23. Relevance Levels of Connection; Resources and Channels0.33810.00710.33950.00710.32170.00670.33330.0070
24. Relevance Levels of Involvement0.32640.00680.32530.00680.34270.00720.32520.0068
3. Smart environment, W: 0.31829. Environmentally friendly services, W: 0.30.095525. Relevance Levels of Sustainable Lifestyle0.36290.03460.34840.03330.48980.04680.55380.0529
26. Relevance Levels of Responsbile Suppliers0.33050.03150.33040.03150.37760.03600.26150.0250
27. Relevance Levels of Eco-friendly Initiatives0.30660.02930.32110.03070.13270.01270.18460.0176
10. Renewable energy, W: 0.30.095528. Relevance Levels of Energy Transformation Culture0.37060.03540.36020.03440.53190.05080.58330.0557
29. Relevance Levels of Energy Efficiency Systems0.32950.03150.33180.03170.27660.02640.30560.0292
30. Relevance Levels of Energy Best Practices0.29990.02860.30800.02940.19150.01830.11110.0106
11. Sustainable development, W: 0.30.095531. Relevance Levels of Sustainable Policy0.31410.03000.32350.03090.20450.01950.24140.0230
32. Relevance Levels of Social Equity0.37430.03570.37050.03540.44320.04230.37930.0362
33. Relevance Levels of Partnerships for Sustainability0.31150.02970.30600.02920.35230.03360.37930.0362
12. Zero waste, W: 0.10.031834. Relevance Levels of Waste Reduction Programs0.37530.01190.36790.01170.51220.01630.46670.0148
35. Relevance Levels of Recyciling Program0.34560.01100.34240.01090.39020.01240.40000.0127
36. Relevance Levels of Incentive program0.27920.00890.28970.00920.09760.00310.13330.0042
4. Smart governance, W: 0.513. Cybersecurity, W: 0.07800.039037. Relevance Levels of Overseeing Committee0.32730.01280.32900.01280.38460.01500.14290.0056
38. Relevance Levels of Policy and Regulations0.33780.01320.33620.01310.30770.01200.47620.0186
39. Relevance Levels of Monitoring Programs0.33500.01310.33480.01300.30770.01200.38100.0148
14. Data governance, W: 0.13860.069340. Relevance Levels of Data Governance Policies0.30060.02080.30120.02090.27540.01910.30850.0214
41. Relevance Levels of Data Governance Processes0.30970.02150.30890.02140.27540.01910.35110.0243
42. Relevance Levels of Management Structures0.38970.02700.39000.02700.44930.03110.34040.0236
15. Decision-making, W: 0.64100.320543. Relevance Levels of Consultation and Collaboration in Decision-making0.32300.10350.31990.10250.34620.11090.34780.1115
44. Relevance Levels of Communication Practices in Decision-making0.36500.11700.36590.11730.36920.11830.34780.1115
45. Relevance Levels of Monitoring and Evaluation in Decision-making0.31200.10000.31420.10070.28460.09120.30430.0975
16. Service management, W: 0.14240.071246. Relevance Levels of Cataloguing and Design in Decision-making0.33830.02410.33770.02410.33870.02410.34750.0247
47. Relevance Levels of Service Delivery Efficiency in Decision-making0.32610.02320.32150.02290.36290.02580.36440.0260
48. Relevance Levels of Resource allocation in Decision-making0.33560.02390.34080.02430.29840.02130.28810.0205
Table 12. Ranking of weights for indicators.
IndicatorAll ParticipantsStudentsScholarsAdministrative/Professional Staff
Overall WeightRankOverall WeightRankOverall WeightRankOverall Weight Rank
Relevance Levels of Communication Practices in Decision-making0.1169810.1172610.1183410.111481
Relevance Levels of Consultation and Collaboration in Decision-making0.1035320.1025420.1109420.111482
Relevance Levels of Monitoring and Evaluation in Decision-making0.1000030.1007030.0912230.097543
Relevance Levels of Social Equity0.0357340.0353740.0423160.036216
Relevance Levels of Energy Transformation Culture0.0353850.0343950.0507840.055694
Relevance Levels of Sustainable Lifestyle0.0346460.0332660.0467650.052875
Relevance Levels of Responsible Suppliers0.0315570.0315480.0360470.0249710
Relevance Levels of Energy Efficiency Systems0.0314580.0316770.02640100.029178
Relevance Levels of Sustainable Policy0.0299990.0308890.01953140.0230414
Relevance Levels of Partnerships for Sustainability0.02974100.02921120.0336380.036217
Relevance Levels of Eco-friendly Initiatives0.02927110.03066100.01266250.0176218
Relevance Levels of Energy Best Practices0.02863120.02940110.01828170.0106129
Relevance Levels of Management Structures0.02700130.02702130.0311390.0235913
Relevance Levels of Cataloguing and Design in Decision-making0.02410140.02405150.02412120.0247511
Relevance Levels of Resource allocation in Decision-making0.02390150.02427140.02125130.0205216
Relevance Levels of Service Delivery Efficiency in Decision-making0.02322160.02290160.02585110.025959
Relevance Levels of Data Governance Processes0.02146170.02140170.01908150.0243312
Relevance Levels of Data Governance Policies0.02083180.02087180.01908160.0213815
Relevance Levels of Living Labs0.01582190.01590190.01555210.0137924
Relevance Levels of Workforce Productivity0.01472200.01462200.01579200.0154120
Relevance Levels of Lean Principles0.01375210.01376210.01308240.0141923
Relevance Levels of Policy and Regulations0.01317220.01311230.01199280.0185617
Relevance Levels of Responsive Curriculum0.01312230.01318220.01230270.0126427
Relevance Levels of Monitoring Programs0.01306240.01305240.01199290.0148521
Relevance Levels of Collaborative Learning0.01301250.01286250.01410230.0155219
Relevance Levels of Overseeing Committee0.01276260.01282260.01499220.0055738
Relevance Levels Industry Engagement0.01238270.01219270.01619190.0129525
Relevance Levels of Waste Reduction Programs0.01194280.01171290.01630180.0148522
Relevance Levels of Automation Systems0.01167290.01177280.01128300.0105430
Relevance Levels of Recycling Program0.01100300.01089300.01242260.0127326
Relevance Levels of R & D Support0.01071310.01069310.01107310.0107028
Relevance Levels of Innovation Hubs0.01014320.01034320.00596380.0095731
Relevance Levels of Incentive program0.00888330.00922330.00310410.0042440
Relevance Levels of Diversity and Inclusion0.00743340.00752340.00695350.0065137
Relevance Levels of Connection; Resources and Channels0.00709350.00712350.00675360.0069935
Relevance Levels of Communication0.00704360.00703360.00704340.0071633
Relevance Levels of Social Interactions0.00699370.00700370.00653370.0074832
Relevance Levels of Involvement0.00685380.00683380.00719330.0068236
Relevance Levels of Comfort, Safety and Security0.00656390.00647390.00750320.0069934
Relevance Levels of Maintenance0.00387400.00374400.00538390.0055639
Relevance Levels of Energy Saving0.00349410.00345410.00413400.0038241
Relevance Levels of Smart Monitoring0.00323420.00340420.00108480.0012248
Relevance Levels of Recreation Services0.00270430.00273430.00261440.0021644
Relevance Levels of Retail Services0.00258440.00255440.00268420.0031542
Relevance Levels of Managing Social Responsibility0.00247450.00245450.00237450.0029743
Relevance Levels of Researching Social Responsibility0.00229460.00232460.00201460.0020146
Relevance Levels of Teaching Social Responsibility0.00223470.00222470.00261430.0020145
Relevance Levels of Art Services0.00166480.00166480.00164470.0016247
Disclaimer/Publisher’s Note: The statements, opinions and data contained in all publications are solely those of the individual author(s) and contributor(s) and not of MDPI and/or the editor(s). MDPI and/or the editor(s) disclaim responsibility for any injury to people or property resulting from any ideas, methods, instructions or products referred to in the content.

