

Analysis of the Properties of Upcycled Wood Waste for Sustainable Furniture Production


Abstract
1. Introduction
2. Materials and Methods
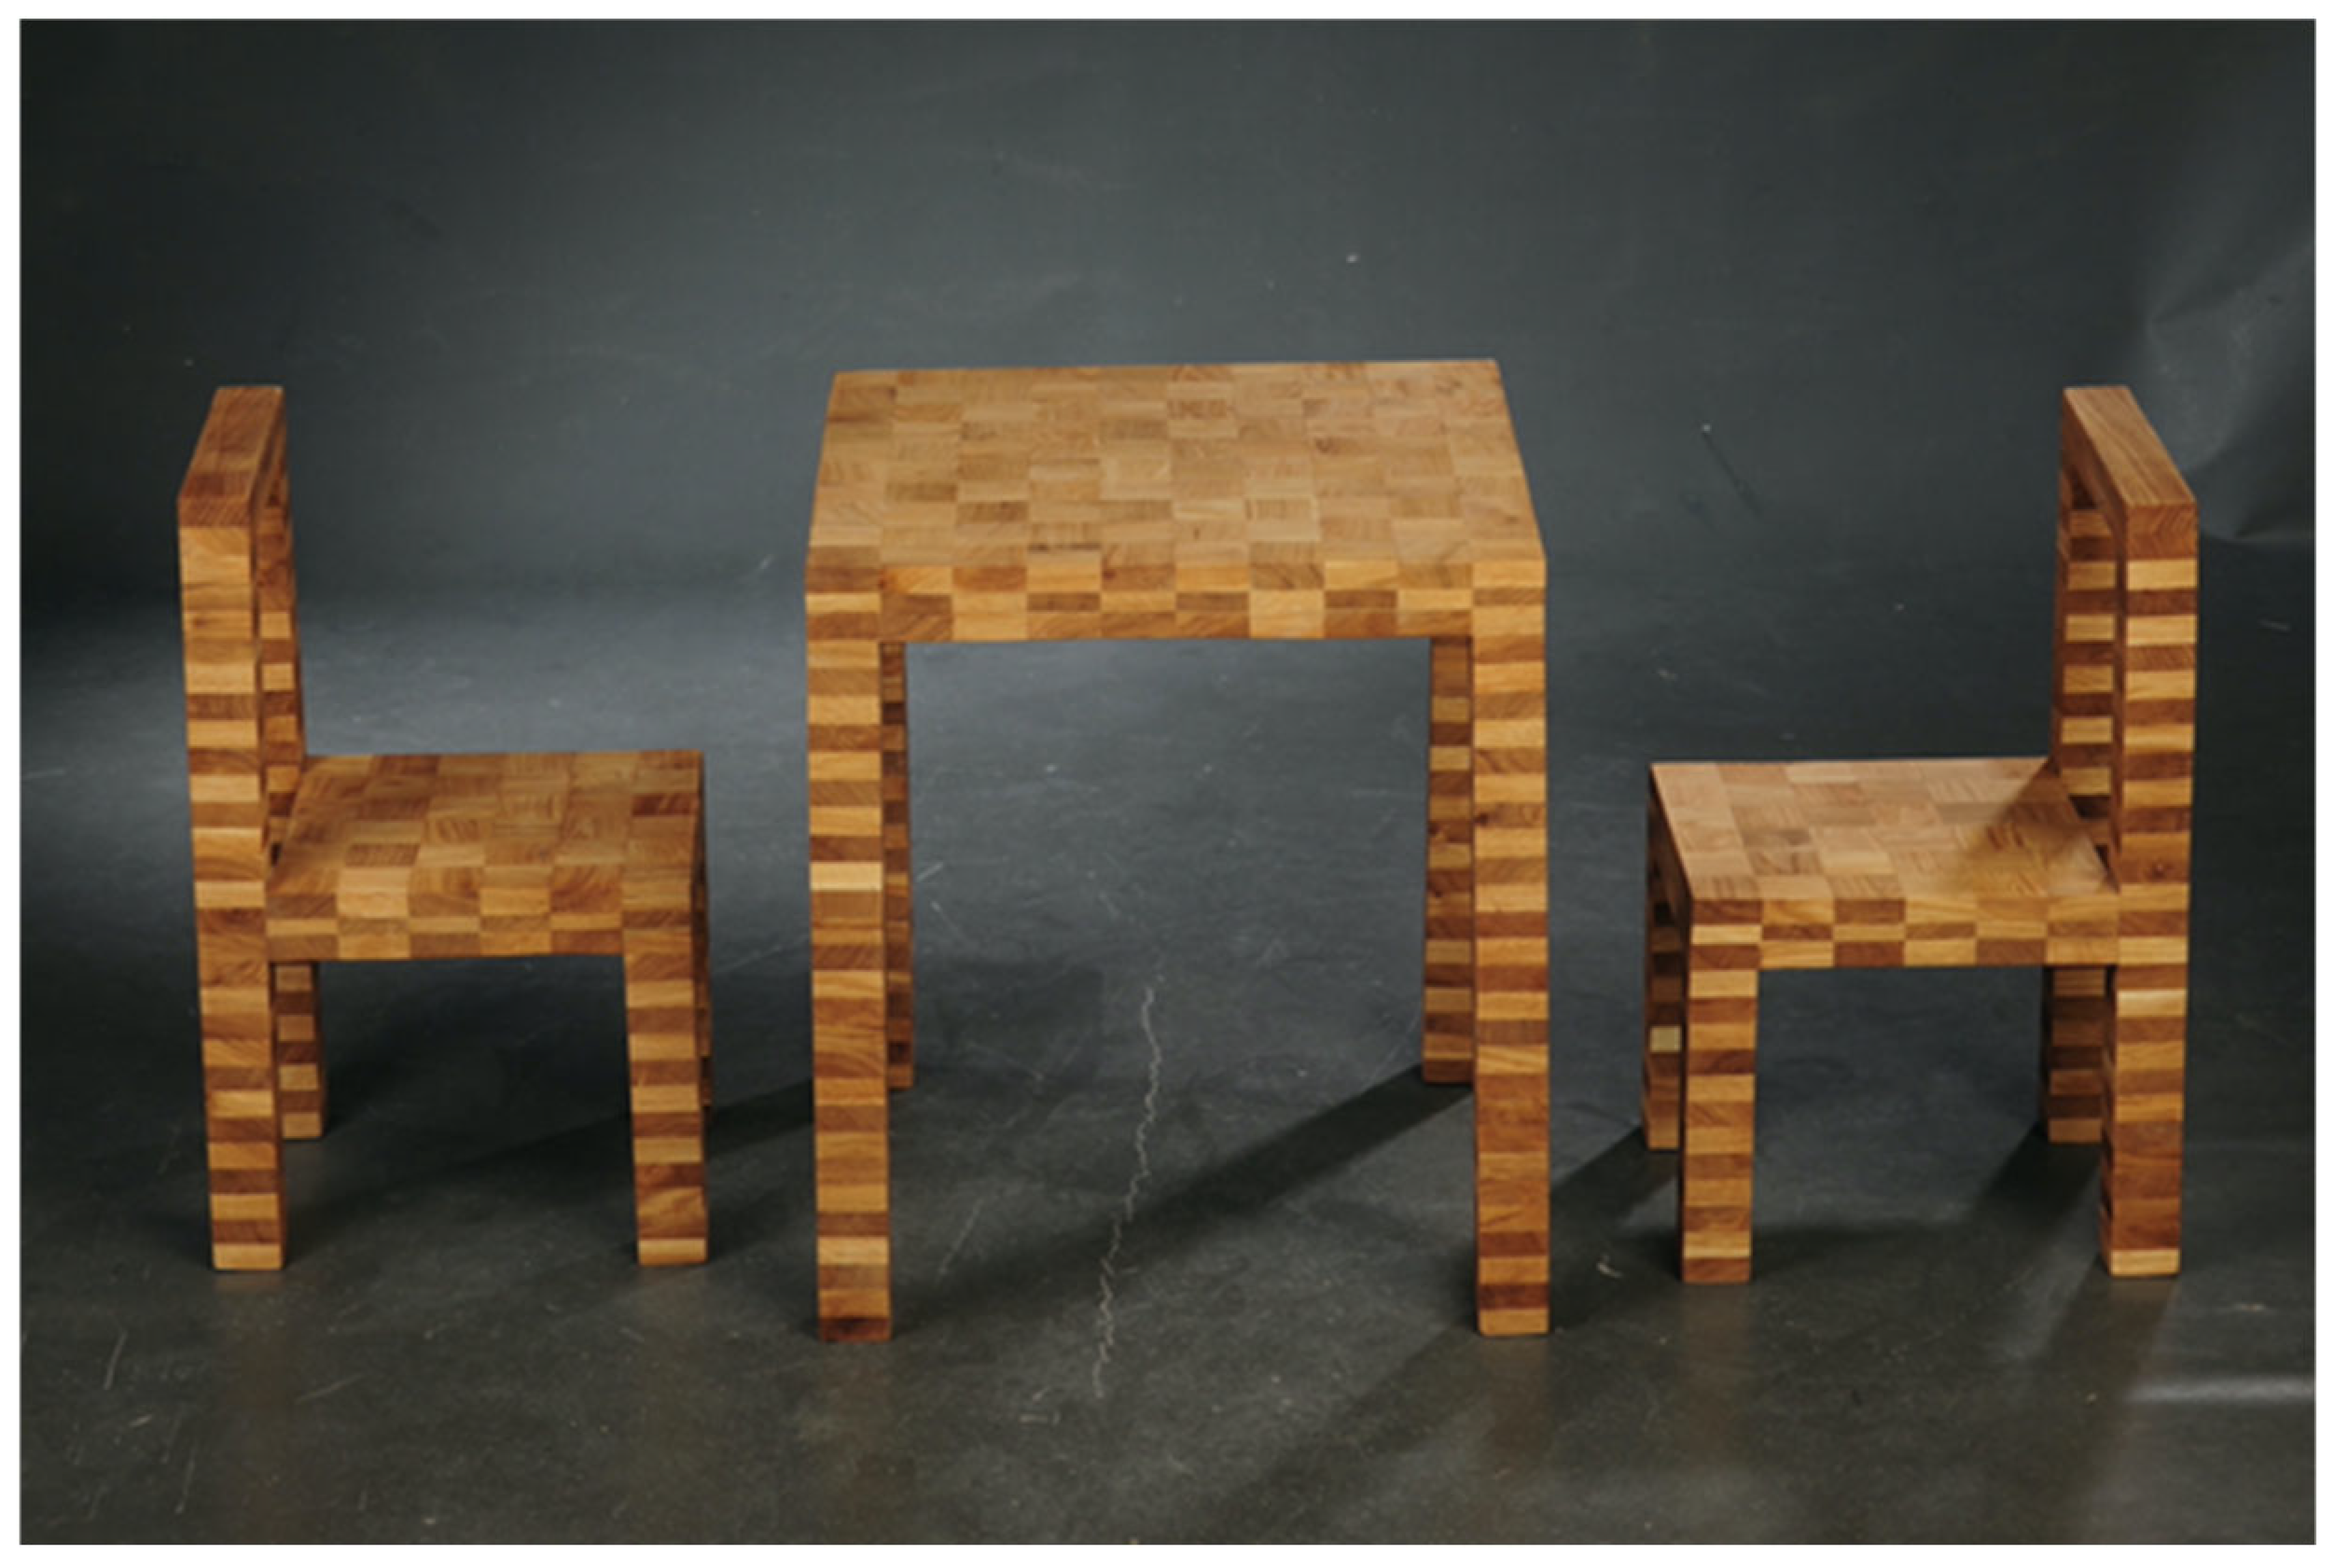
2.1. Experimental Materials and Samples
- Adhesive application 90–180 g/m2;
- Bonding process temperature 15–25 °C;
- Wood moisture 8–12%;
- Air relative humidity 40–70%;
- Cold press time 15–30 min;
- Pressure 1 N/mm2.
2.2. Experimental Methods
3. Results and Discussion
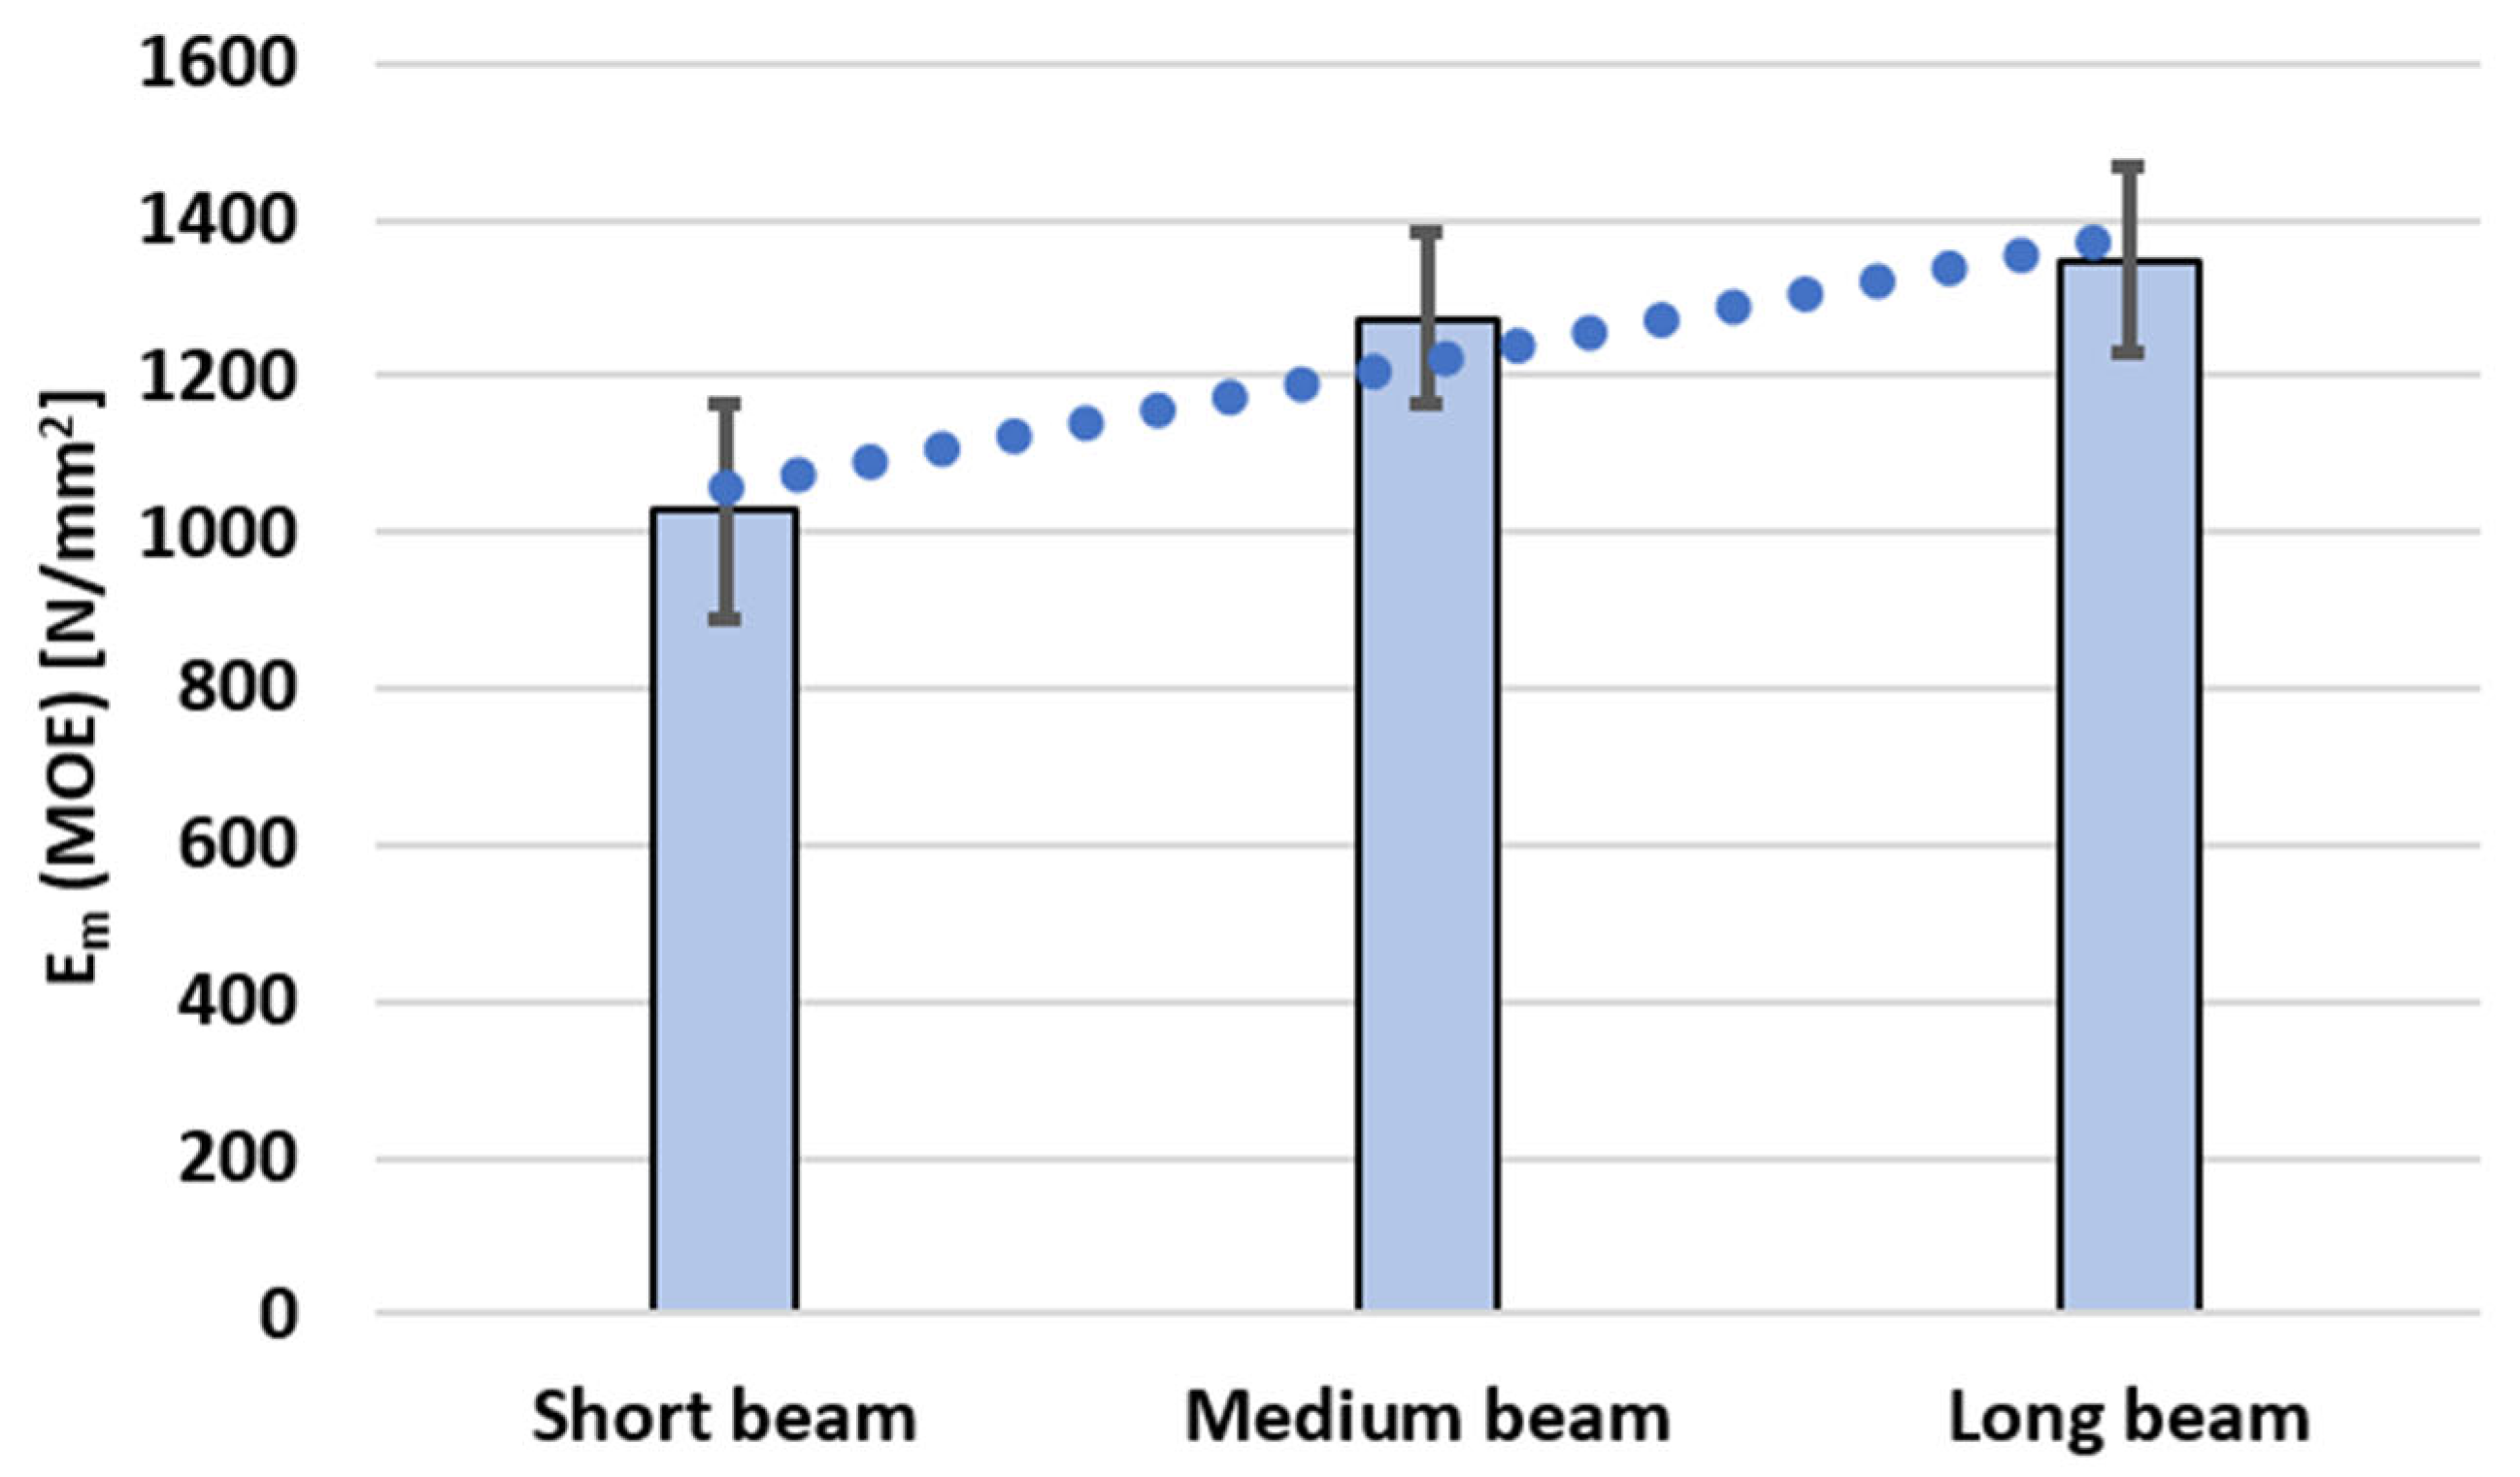
3.1. Modulus of Elasticity
3.2. Modulus of Rupture
3.3. Stiffness (k)
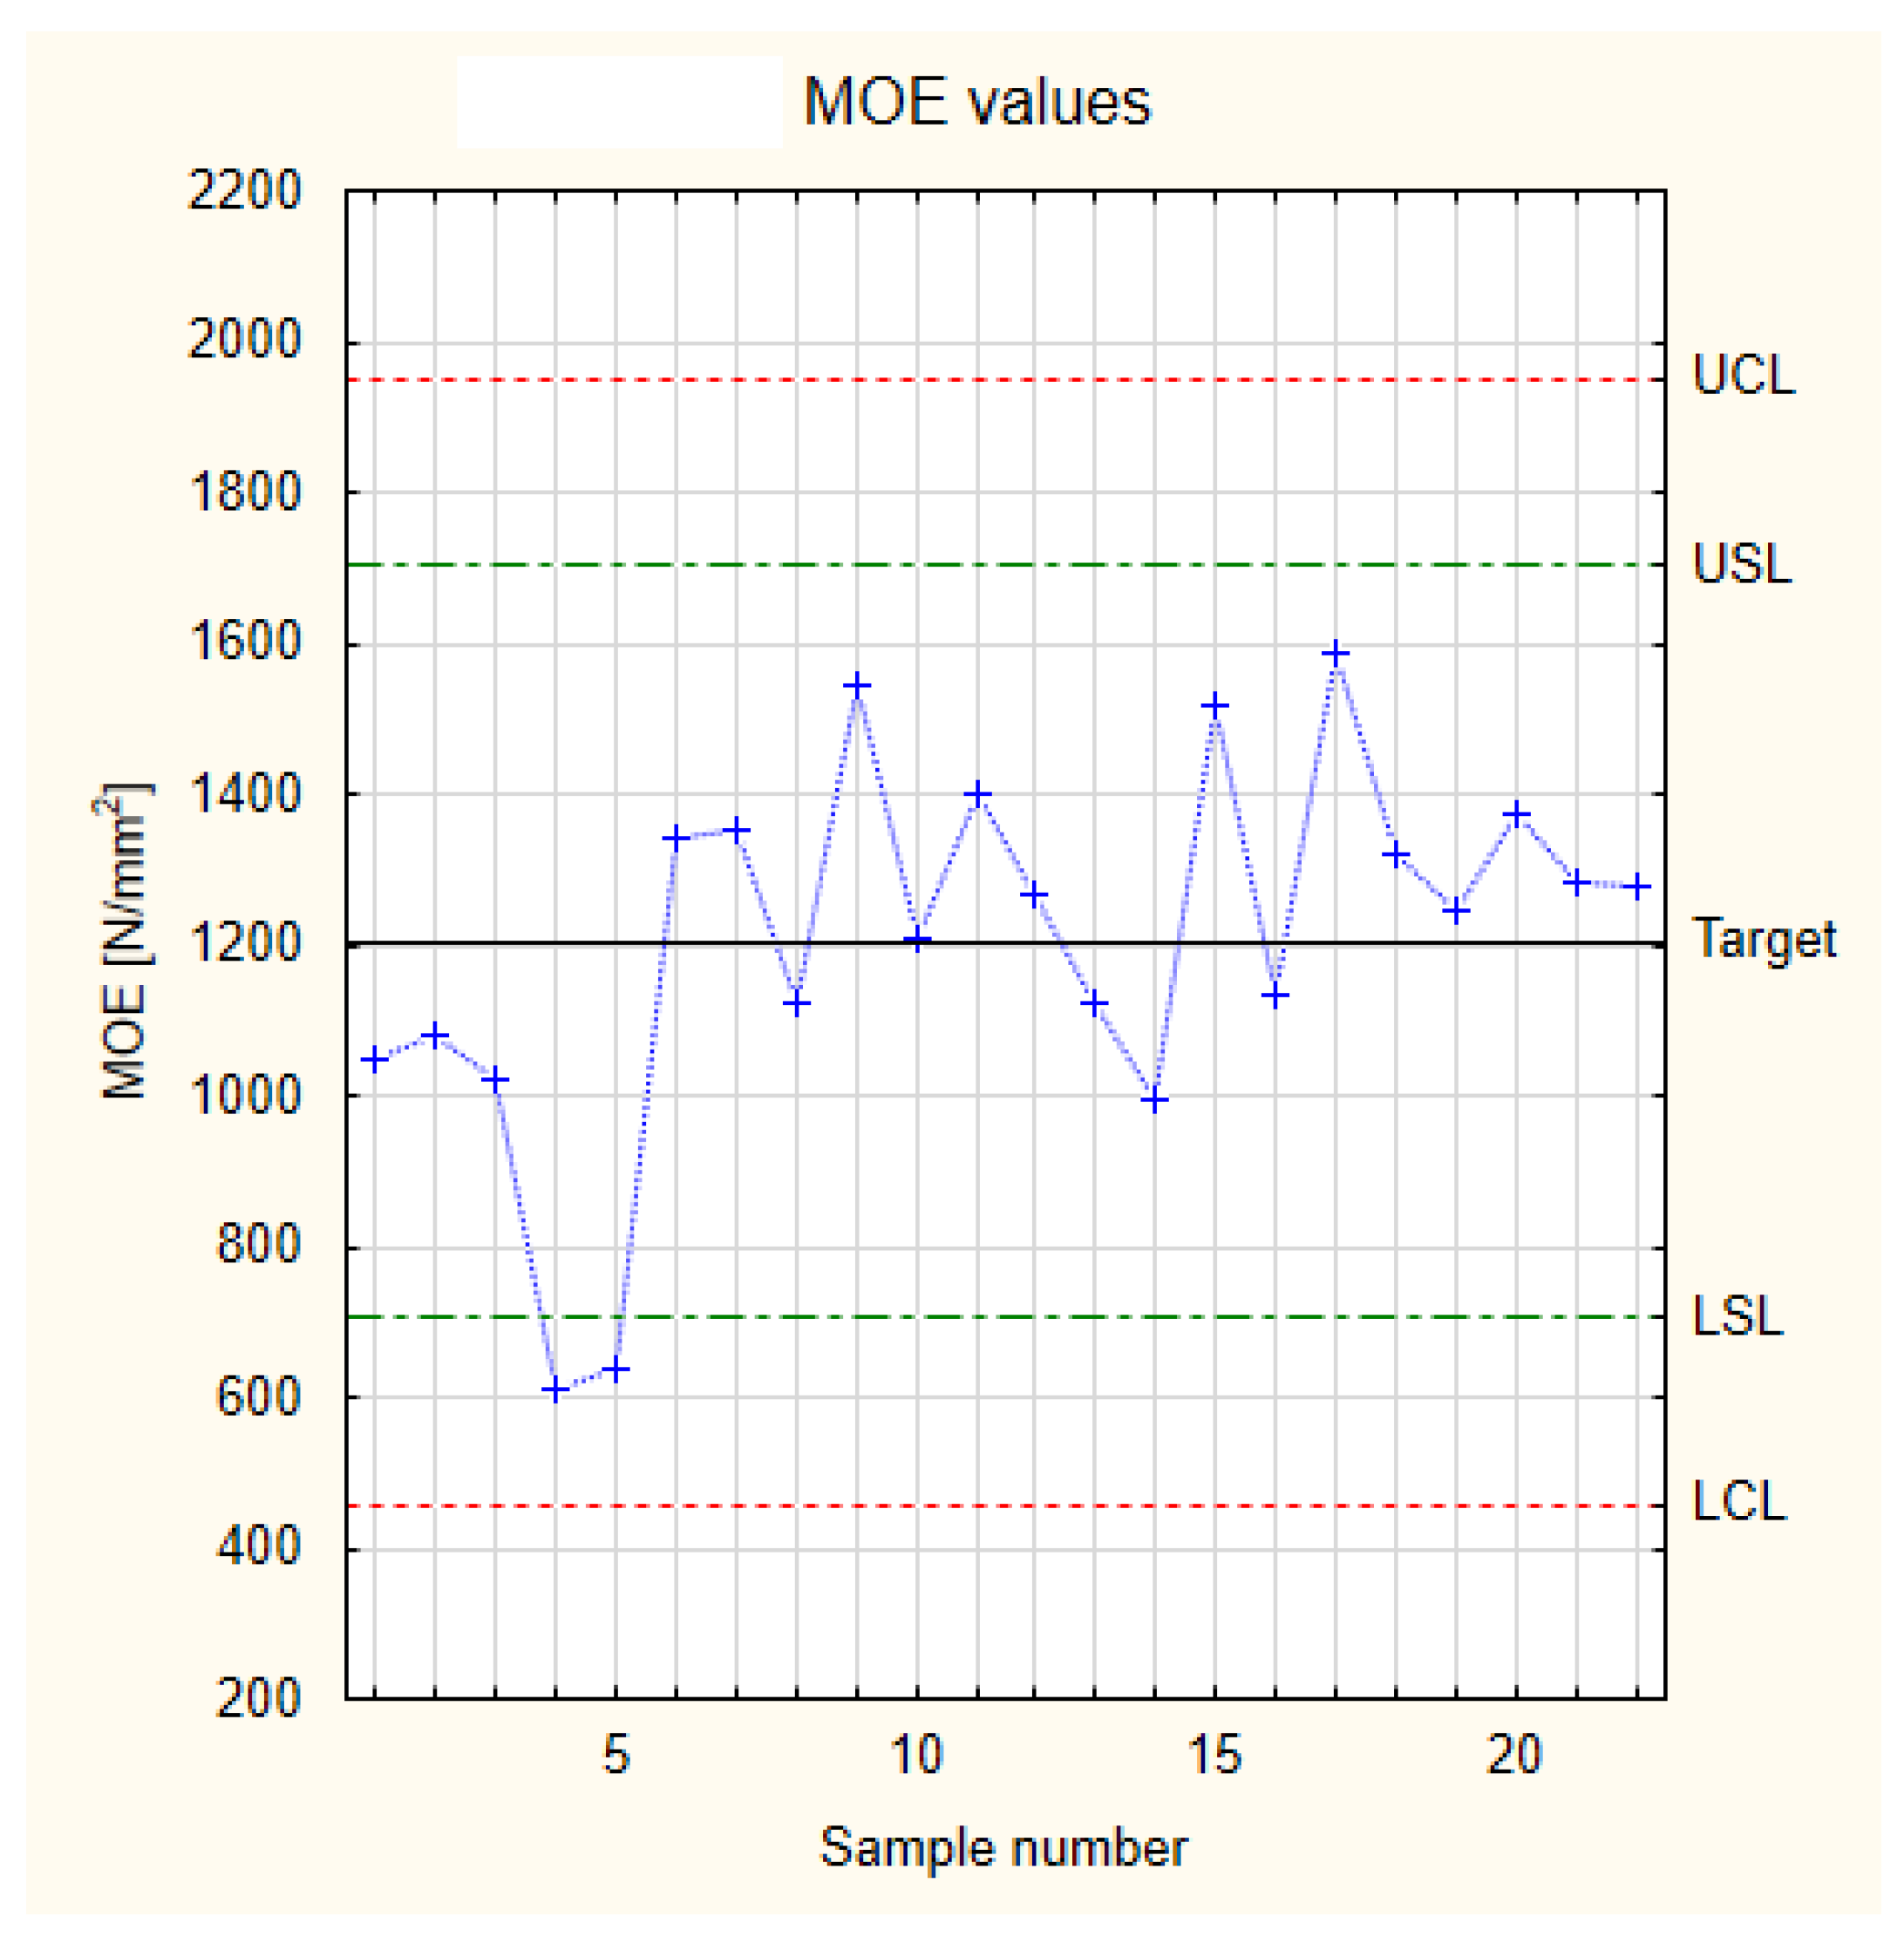
3.4. Statistical Analyses
4. Conclusions
Author Contributions
Funding
Institutional Review Board Statement
Informed Consent Statement
Data Availability Statement
Conflicts of Interest
References
- SDGS. Transforming Our World: The 2030 Agenda for Sustainable Development. 2015. Available online: https://sdgs.un.org/2030agenda (accessed on 26 February 2022).
- Reichel, A.; de Schoenmakere, M.; Gillabel, J.; Grossi, F.; Brueggemann, N.; Wilts, H.; Zoboli, R.; Arnold, M. Circular Economy in Europe Developing the Knowledge Base; Publications Office of the European Union: Luxembourg, 2015; pp. 6–29. Available online: https://www.eea.europa.eu/publications/circular-economy-in-europe (accessed on 12 March 2025).
- EC. Public Procurement for a Circular Economy. Good Practice and Guidance; Publication Office: Brussels, Belgium, 2017; pp. 4–16. Available online: https://circulars.iclei.org/wp-content/uploads/2021/01/CP_European_Commission_Brochure_webversion_small.pdf (accessed on 12 March 2025).
- Wautelet, T. The Concept of Circular Economy: Its Origins and its Evolution; Positive Impakt: Luxembourg, 2018. [Google Scholar]
- de Carvalho Araújo, C.K.; Salvador, R.; Moro Piekarski, C.; Sokulski, C.C.; de Francisco, A.C.; de Carvalho Araújo Camargo, S.K. Circular Economy Practices on Wood Panels: A Bibliographic Analysis. Sustainability 2019, 11, 1057. [Google Scholar] [CrossRef]
- EEB. Circular Economy Opportunities in the Furniture Sector; European Environmental Bureau: Brussels, Belgium, 2019; pp. 6–50. Available online: https://eeb.org/wp-content/uploads/2019/05/Report-on-the-Circular-Economy-in-the-Furniture-Sector.pdf (accessed on 12 March 2025).
- Jarre, M.; Petit-Boix, A.; Priefer, C.; Meyer, R.; Leipold, S. Transforming the bio-based sector towards a circular economy—What can we learn from wood cascading? For. Policy Econ. 2020, 110, 101872. [Google Scholar] [CrossRef]
- Neykov, N.; Antov, P.; Savov, V. Circular Economy Opportunities for Economic Efficiency Improvement in Wood-based Panel Industry. In Proceedings of the 11th International Scientific Conference “Business and Management 2020”, Vilnius, Lithuania, 7–8 May 2020. [Google Scholar]
- Tomić, T.; Schneider, D. Circular economy in waste management—Socio-economic effect of changes in waste management system structure. J. Environ. Manag. 2020, 267, 110564. [Google Scholar] [CrossRef] [PubMed]
- Deloitte. Sustainable Manufacturing: From Vision to Action; DTLL, Deloitte Global: London, UK, 2021; pp. 3–20. Available online: https://www2.deloitte.com/content/dam/Deloitte/global/Documents/Energy-and-Resources/gx-eri-sustainable-manufacturing-2021.pdf (accessed on 12 March 2025).
- De Klerk, S.; Ghaffariyan, M.; Miles, M. Leveraging the Entrepreneurial Method as a Tool for the Circular Economy: The Case of Wood Waste. Sustainability 2022, 14, 1559. [Google Scholar] [CrossRef]
- Ramani, K.; Ramanujan, D.; Bernstein, W.Z.; Zhao, F.; Sutherland, J.; Handwerker, C.; Choi, J.; Kim, H.; Thurston, D. Integrated Sustainable Life Cycle Design: A Review. J. Mech. Des. 2010, 132, 091004. [Google Scholar] [CrossRef]
- Von Geibler, J.; Wiesen, K.; Mostyn, R.S.; Werner, M.; Riera, N.; Su, D.Z.; Björling, S.-E.; Domen, T.; Smith, J.; Jenkins, A.; et al. Forming the Nucleus of a Novel Ecological Accounting System: The myEcoCost Approach. Key Eng. Mater. 2013, 572, 78–83. [Google Scholar] [CrossRef]
- ARC+. A Key Solution to Climate Change: Sustainable Materials Management; ARC+: Brussels, Belgium, 2015; pp. 1–4. Available online: https://www.acrplus.org/en/news/a-key-solution-to-climate-change-sustainable-materials-management-1265?id_details_groupe=39 (accessed on 12 March 2025).
- Moldavska, A.; Welo, T. The concept of sustainable manufacturing and its definitions: A content-analysis based literature review. J. Clean. Prod. 2017, 166, 744–755. [Google Scholar] [CrossRef]
- Besserer, A.; Troilo, S.; Girods, P.; Rogaume, Y.; Brosse, N. Cascading Recycling of Wood Waste: A Review. Polymers 2021, 13, 1752. [Google Scholar] [CrossRef] [PubMed]
- Vis, M.; Mantau, U.; Allen, B.; Essel, R.; Reichenbach, J. (Eds.) Study on the Optimised Cascading Use of Wood; Publications Office of the European Union: Brussels, Belgium, 2016. [Google Scholar]
- Jahan, I.; Zhang, G.; Bhuiyan, M.; Navaratnam, S. Circular Economy of Construction and Demolition Wood Waste—A Theoretical Framework Approach. Sustainability 2022, 14, 478. [Google Scholar] [CrossRef]
- EC. A New Industrial Strategy for a Globally Competitive, Green and Digital Europe; Publications Office of the European Union: Brussels, Belgium, 2020; pp. 1–4. Available online: https://ec.europa.eu/commission/presscorner/api/files/attachment/863067/EU_industrial_strategy_en.pdf.pdf (accessed on 12 March 2025).
- International Advisory Council on Global Bioeconomy. Global Bioeconomy Policy Report (IV); Secretariat of the Global Bioeconomy Summit: Berlin, Germany, 2020; pp. 1–161. Available online: https://gbs2020.net/wp-content/uploads/2020/11/GBS-2020_Global-Bioeconomy-Policy-Report_IV_web.pdf (accessed on 13 March 2025).
- GBS. Expanding the Sustainable Bioeconomy—Vision and Way Forward; Communiqué of the Global Bioeconomy Summit, IACGB: Berlin, Germany, 2020; pp. 4–17. Available online: https://gbs2020.net/wp-content/uploads/2020/11/GBS2020_IACGB-Communique.pdf (accessed on 13 March 2025).
- BPF. Design Products for Sustainability. 2021. Available online: http://bpf.co.uk/Sustainable_Manufacturing/Design/Designing_Sustainability.aspx (accessed on 13 March 2025).
- EC. Sustainable Product Policy. 2021. Available online: https://single-market-economy.ec.europa.eu/industry/sustainability/sustainable-product-policy-ecodesign_en (accessed on 13 March 2025).
- WRAP. We are Accelerating Sustainability Worldwide. 2021. Available online: https://wrap.org.uk/sites/default/files/2021-01/WRAP-case-for-support-accelerating-sustainability-worldwide.pdf (accessed on 12 March 2025).
- World Commission on Environment and Development. Report of the World Commission on Environment and Development: Our Common Future; Oxford University Press: Oxford, UK, 1987. [Google Scholar]
- Klöpffer, W. Life-Cycle based methods for sustainable product development. Int. J. Life Cycle Assess. 2003, 8, 157–159. [Google Scholar] [CrossRef]
- Byggeth, S.; Broman, G.; Robèrt, K. A method for sustainable product development based on a modular system of guiding questions. J. Clean. Prod. 2007, 15, 1–11. [Google Scholar] [CrossRef]
- McAloone, T.C.; Bey, N. Environmental Improvement Through Product Development: A Guide; Danish Environmental Protection Agency: Copenhagen, Denmark, 2009; pp. 10–40. [Google Scholar]
- Pigosso, D.C.A.; Rozenfeld, H.; McAloone, T.C. Ecodesign maturity model: A management framework to support ecodesign implementation into manufacturing companies. J. Clean. Prod. 2013, 59, 160–173. [Google Scholar] [CrossRef]
- Church, T.R.; Sherwin, C.; Forster, A. Back to the Drawing Board: How Good Design Can Eliminate Waste. The Guardian, 3 September 2014. [Google Scholar]
- Telenko, C.; O’Rourke, J.; Seepersad, C.C.; Webber, M.E. A Compilation of design for environment guidelines. J. Mech. Des. 2016, 138, 031102. [Google Scholar] [CrossRef]
- Stock, T.; Obenaus, M.; Slaymaker, A.; Seliger, G. A Model for the Development of Sustainable Innovations for the Early Phase of the Innovation Process. Procedia Manuf. 2017, 8, 215–222. [Google Scholar] [CrossRef]
- Su, D. Introduction and Sustainable Product Development. In Sustainable Product Development; Springer: Cham, Switzerland, 2020; pp. 1–11. [Google Scholar]
- Qiu, L.; Jie, X.; Wang, Y.; Zhao, M. Green product innovation, green dynamic capability, and competitive advantage: Evidence from Chinese manufacturing enterprises. Corp. Soc. Responsib. Environ. Manag. 2020, 27, 146–165. [Google Scholar] [CrossRef]
- Wang, M.; Li, Y.; Li, J.; Wang, Z. Green process innovation, green product innovation and its economic performance improvement paths: A survey and structural model. J. Environ. Manag. 2021, 297, 113282. [Google Scholar] [CrossRef] [PubMed]
- CIRCULAB. Eco Design, What Are We Talking About? 2022. Available online: https://circulab.com/eco-design-definition/ (accessed on 17 March 2025).
- WIKI. Ecological Design. 2022. Available online: https://en.wikipedia.org/wiki/Ecological_design (accessed on 18 March 2025).
- EN 1927-2:2008; Qualitative Classification of Softwood Round Timber—Part 2: Pines. iTeh Standards: Toronto, ON, Canada, 2008; pp. 1–9.
- Analiza Rynku Meblarskiego w Polsce. 2020. Available online: https://markethub.pl/rynek-meblarski-w-polsce/ (accessed on 26 March 2025). (In Polish).
- Goodair. Jaka Jest Optymalna Temperatura i Wilgotność w Domu? 2015. Available online: https://goodair.pl/blog/temperatura-i-wilgotnosc-w-domu (accessed on 26 March 2025). (In Polish).
- EN 322:1993; Wood-Based Panels—Determination of Moisture Content. European Committee for Standardization: Brussels, Belgium, 1993; pp. 1–7.
- EN 323:1993; Wood-Based Panels—Determination of Density. European Committee for Standardisation: Brussels, Belgium, 1993; pp. 1–8.
- EN 310:1994; Wood-Based Panels—Determination of Modulus of Elasticity in Bending and of Bending Strength. European Committee for Standardization: Brussels, Belgium, 1994; pp. 1–8.
- ISO 9052:1989; Acoustics—Determination of Dynamic Stiffness—Part 1: Materials Used Under Floating Floors in Dwellings. ISO: Geneva, Switzerland, 1989; pp. 1–4.
- Burawska-Kupniewska, I.; Mycka, P.; Beer, P. Influence of Scots Pine (Pinus sylvestris L.) Veneers Quality on Selected Properties of Layered Composite for Flooring Materials. Forests 2021, 12, 1017. [Google Scholar] [CrossRef]
- Beer, P.; Pacek, P.; Burawska-Kupniewska, I. Influence of the Thickness of Scots Pine (Pinus sylvestris L.) Veneers on Selected Properties of Flooring Materials. Forests 2022, 13, 175. [Google Scholar] [CrossRef]
- Oleńska, S.; Beer, P. Quality Evaluation of New Types of Layered Composites for Flooring Materials. Materials 2024, 17, 1892. [Google Scholar] [CrossRef] [PubMed]
- Oleńska, S.; Beer, P. Quality Evaluation of New Types of Core Layers Based on Different Thicknesses of Veneers for Flooring Materials. Materials 2024, 17, 5881. [Google Scholar] [CrossRef] [PubMed]
- Binderholz. Drewno Klejone Warstwowo CLT. 2021. Available online: https://www.binderholz.com/fileadmin/user_upload/books/pl/drewno-klejone-warstwowo-clt/ (accessed on 1 April 2025). (In Polish).
- PN-EN 14080:2013; Konstrukcje Drewniane—Drewno Klejone Warstwowo i Drewno Lite Klejone Warstwowo (Konstrukcyjne Sklejone Drewno Lite)—Wymagania. Polski Komitet Normalizacyjny: Cracov, Poland, 2013. (In Polish)
- EN 338: 2004; Structural Timber—Strength Classes. European Committee for Standardization: Brussels, Belgium, 2004.


| Sample Number | Short Beam | Medium Beam | Long Beam |
|---|---|---|---|
| 1 | 1048 | 1545 | 1586 |
| 2 | 1078 | 1208 | 1318 |
| 3 | 1020 | 1399 | 1248 |
| 4 | 612 | 1266 | 1375 |
| 5 | 639 | 1121 | 1284 |
| 6 | 1342 | 997 | 1279 |
| 7 | 1352 | 1518 | – |
| 8 | 1123 | 1136 | – |
| Mean | 1027 | 1274 | 1348 |
| Variable | Value |
|---|---|
| Arithmetic mean | 1204 |
| Standard deviation | 249 |
| Lower control limit (LCL) | 457 |
| Lower specification limit (LSL) | 706 |
| Upper specification limit (USL) | 1702 |
| Upper control limit (UCL) | 1951 |
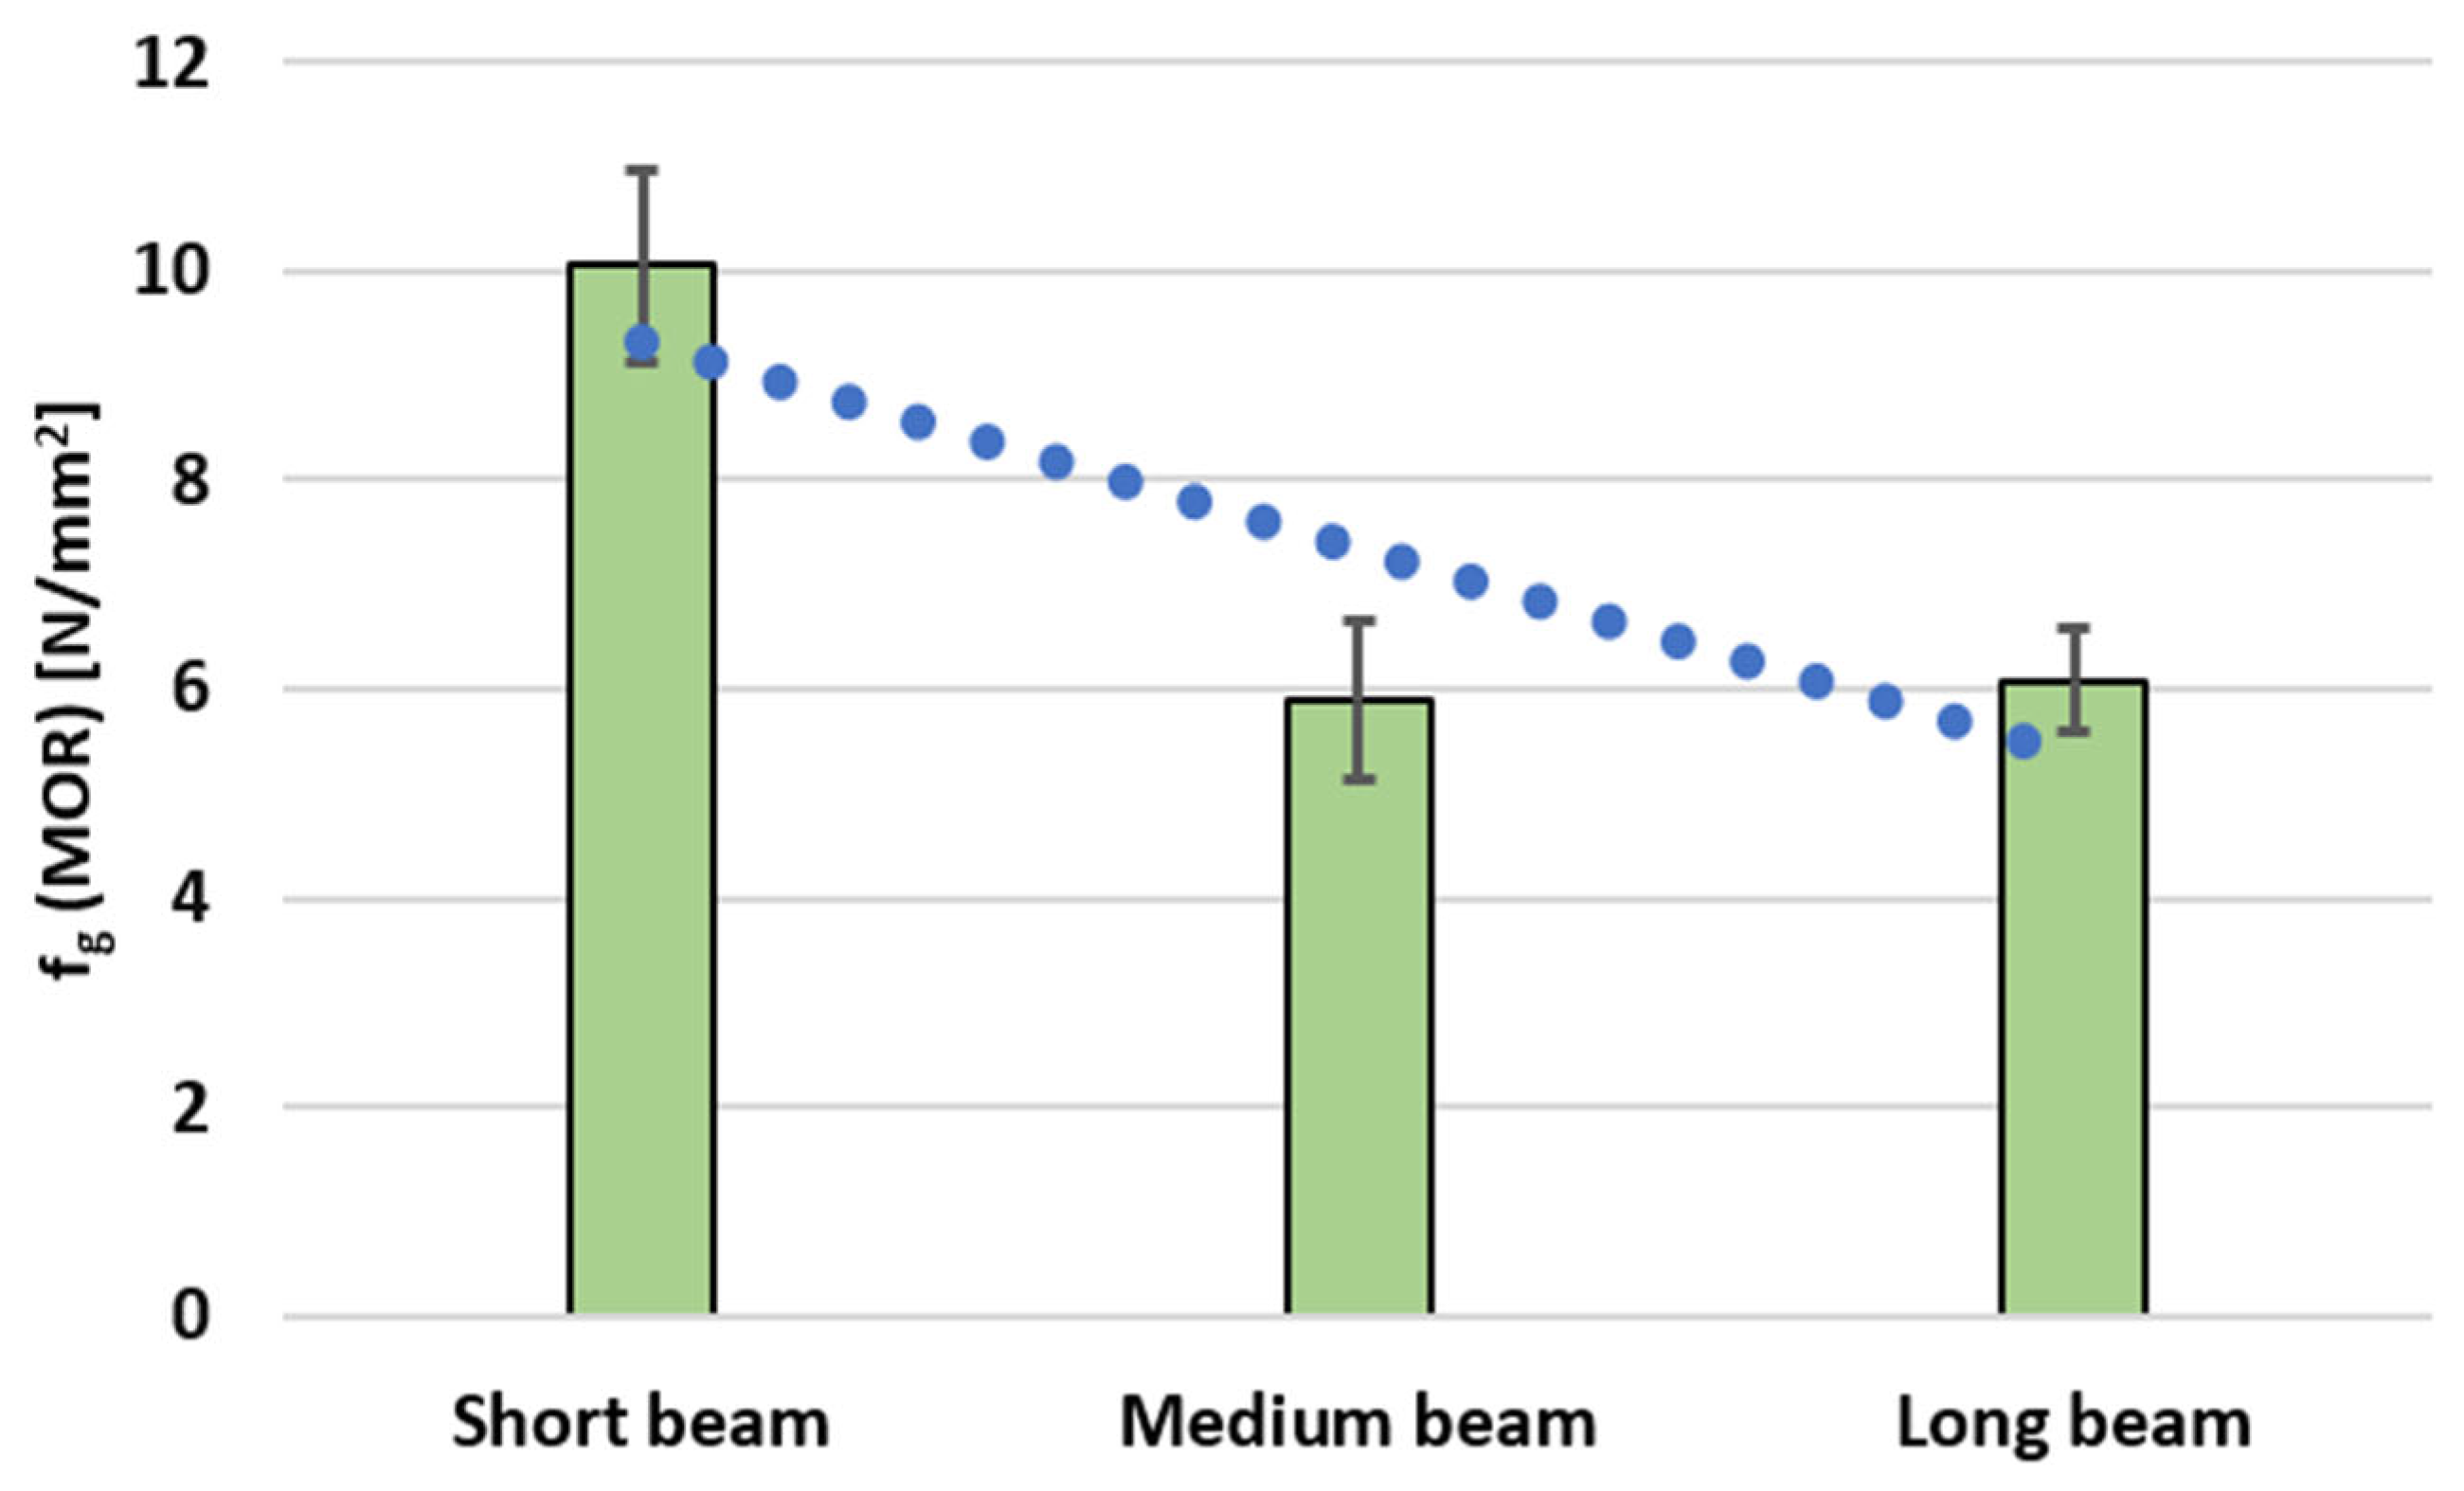
| Sample Number | Short Beam | Medium Beam | Long Beam |
|---|---|---|---|
| 1 | 11.14 | 4.92 | 4.60 |
| 2 | 9.41 | 5.54 | 6.70 |
| 3 | 9.00 | 6.03 | 7.17 |
| 4 | 10.52 | 3.21 | 6.35 |
| 5 | 12.52 | 5.62 | 5.64 |
| 6 | 9.32 | 7.47 | 6.07 |
| 7 | 9.48 | 7.24 | – |
| 8 | 9.01 | 7.07 | – |
| Mean | 10.05 | 5.89 | 6.09 |
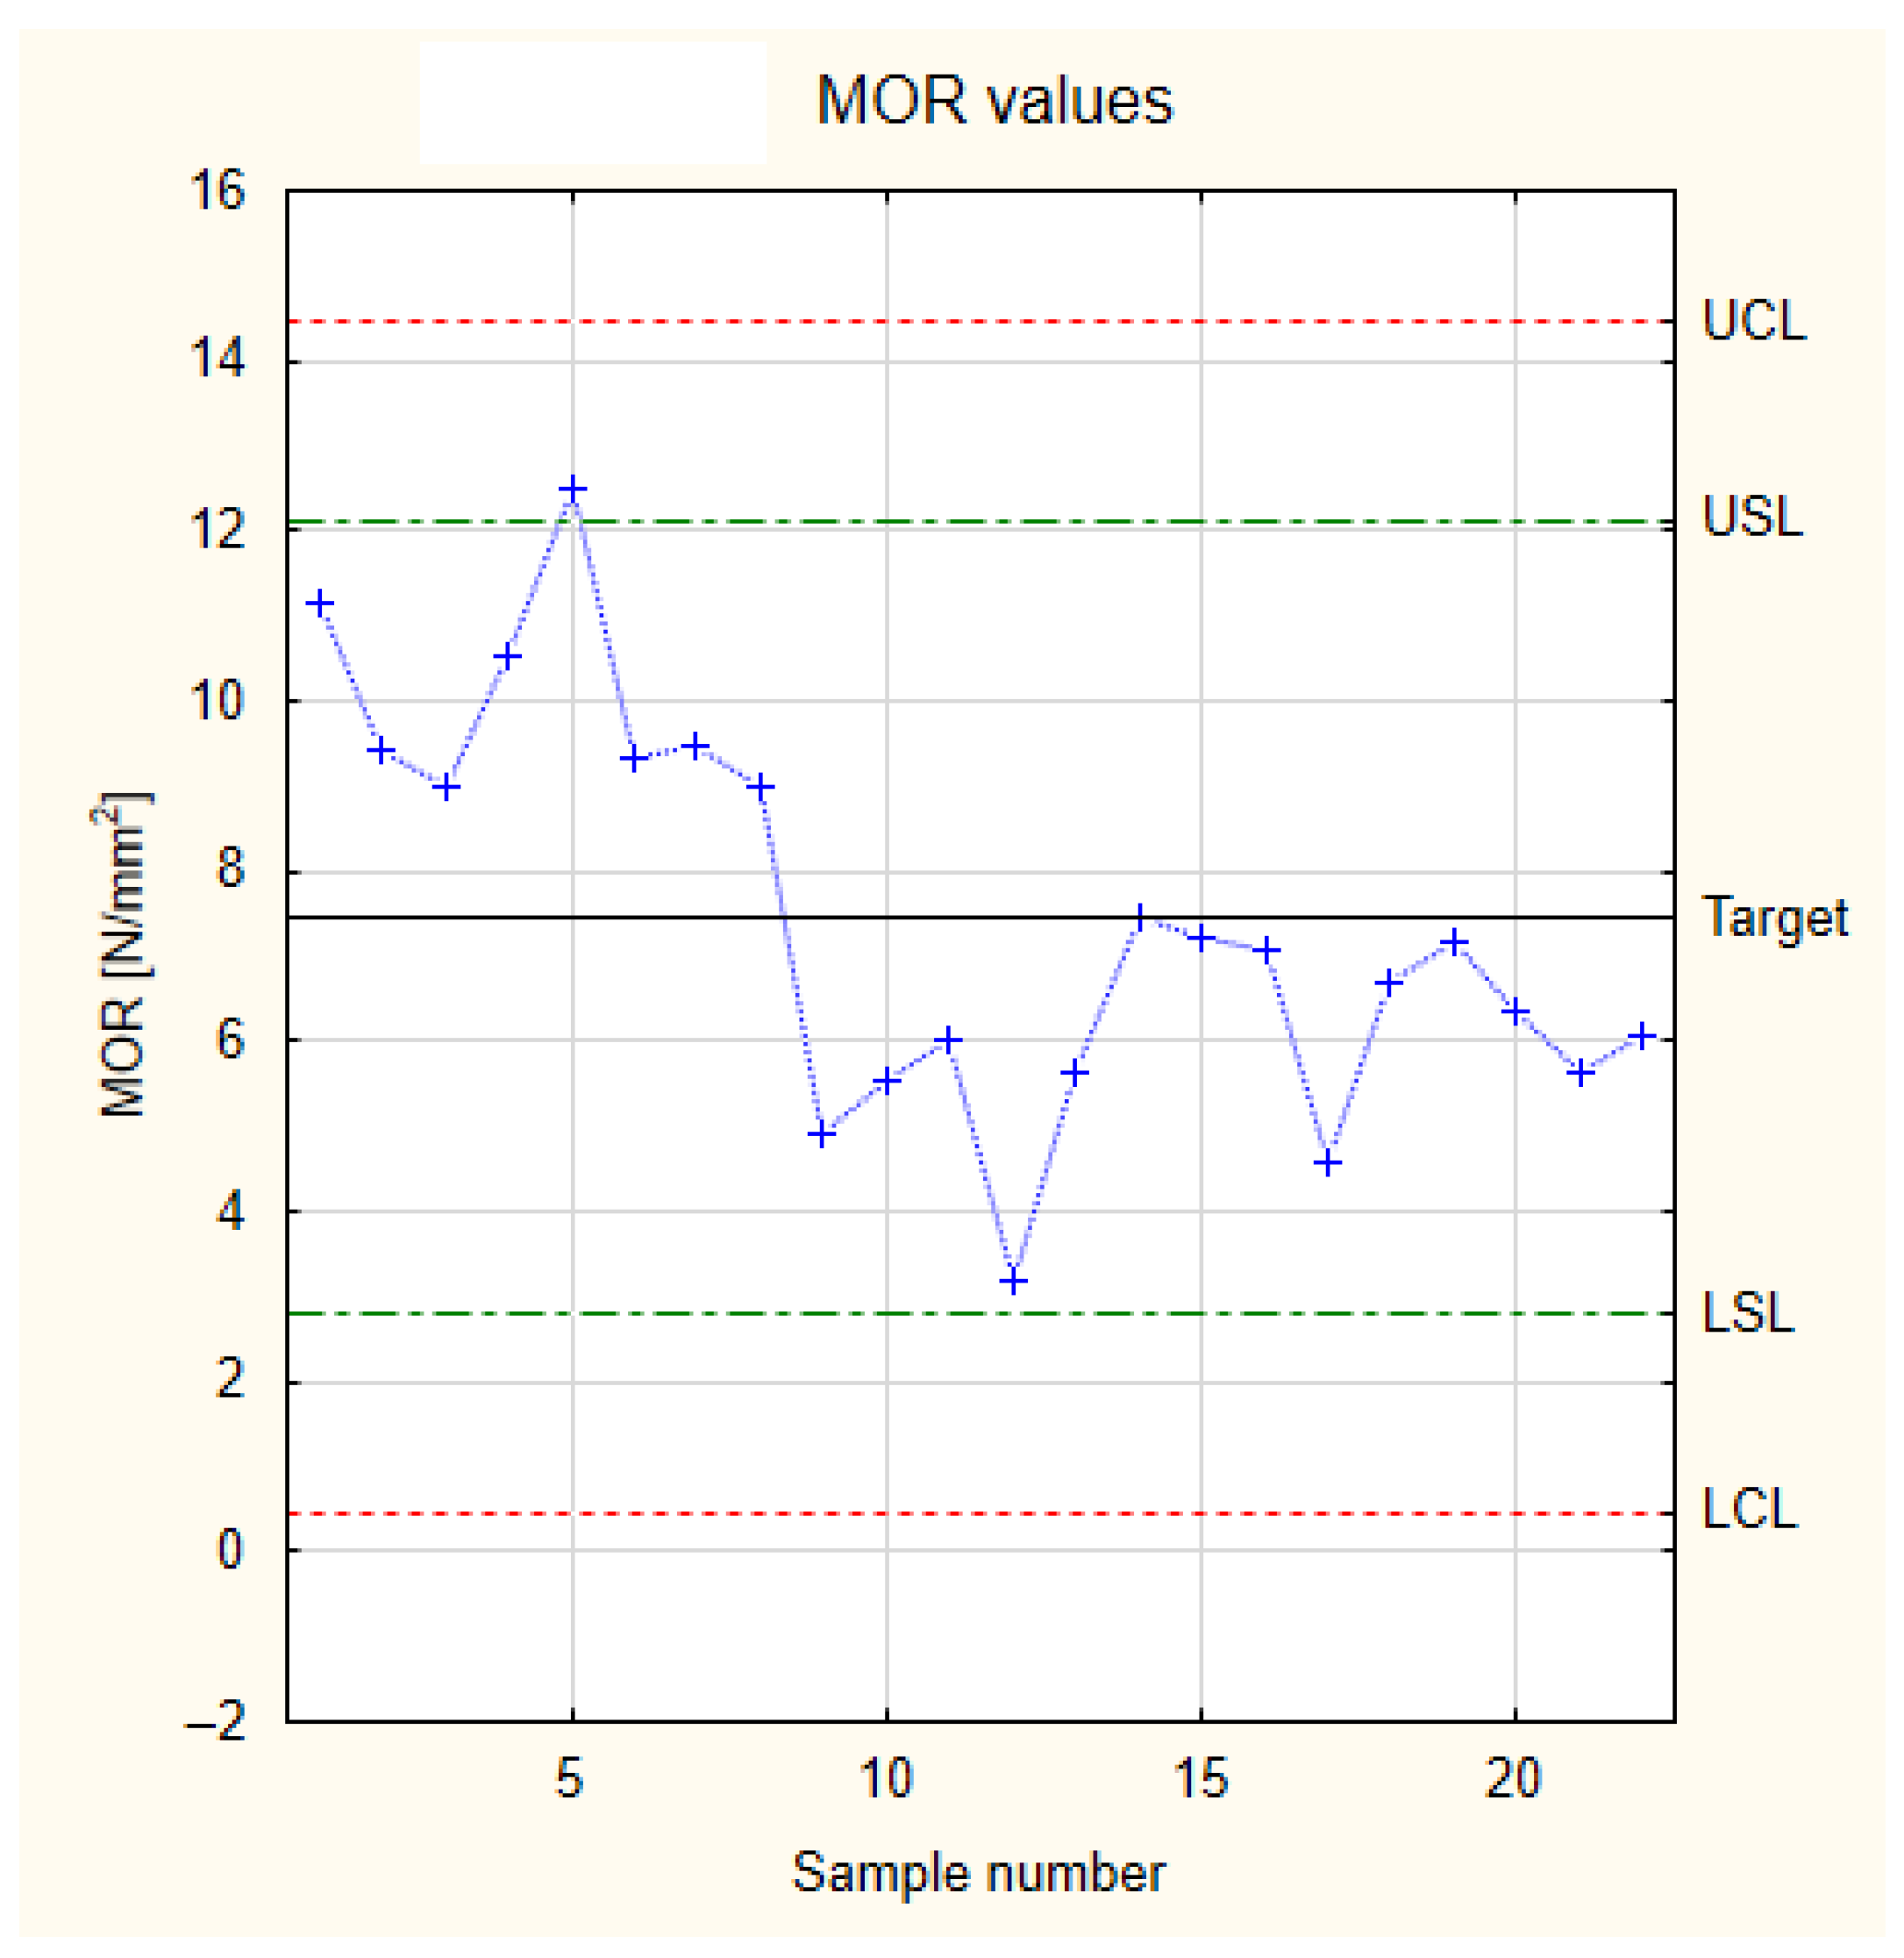
| Variable | Value |
|---|---|
| Arithmetic mean | 7.46 |
| Standard deviation | 2.33 |
| LCL | 0.47 |
| LSL | 2.80 |
| USL | 12.12 |
| UCL | 14.45 |
| Sample Number | Short Beam | Medium Beam | Long Beam |
|---|---|---|---|
| 1 | 244 | 885 | 2170 |
| 2 | 231 | 702 | 2682 |
| 3 | 244 | 817 | 2573 |
| 4 | 316 | 1433 | 2877 |
| 5 | 334 | 1265 | 2702 |
| 6 | 722 | 1109 | 2669 |
| 7 | 1745 | 1858 | – |
| 8 | 1444 | 1407 | – |
| Mean | 660 | 1184 | 2612 |
| Variable | Value |
|---|---|
| Arithmetic mean | 1383 |
| Standard deviation | 911 |
| LCL | 0 |
| LSL | 0 |
| USL | 3205 |
| UCL | 4116 |
| Type of Material | Variable | Arithmetic Mean | Median | Minimum | Maximum | Standard Deviation | Variation Coefficient |
|---|---|---|---|---|---|---|---|
| Short beam | MOE | 983 | 1047 | 596 | 1352 | 276 | 28 |
| MOR | 9.13 | 9.32 | 5.43 | 12.52 | 1.82 | 19.91 | |
| k | 579 | 282 | 195 | 1745 | 547 | 94 | |
| Medium beam | MOE | 1310 | 1332 | 987 | 1603 | 220 | 17 |
| MOR | 5.35 | 5.58 | 2.91 | 7.47 | 1.54 | 28.77 | |
| k | 1164 | 1187 | 473 | 1858 | 447 | 38 | |
| Long beam | MOE | 1491 | 1375 | 1248 | 1796 | 235 | 16 |
| MOR | 5.60 | 5.64 | 4.28 | 7.17 | 1.03 | 18.44 | |
| k | 2556 | 2573 | 2170 | 2877 | 206 | 8 |
Disclaimer/Publisher’s Note: The statements, opinions and data contained in all publications are solely those of the individual author(s) and contributor(s) and not of MDPI and/or the editor(s). MDPI and/or the editor(s) disclaim responsibility for any injury to people or property resulting from any ideas, methods, instructions or products referred to in the content. |
© 2025 by the authors. Licensee MDPI, Basel, Switzerland. This article is an open access article distributed under the terms and conditions of the Creative Commons Attribution (CC BY) license (https://creativecommons.org/licenses/by/4.0/).
Share and Cite
Grotowska, M.; Olenska, S.; Gruszczynska, J.; Beer, P. Analysis of the Properties of Upcycled Wood Waste for Sustainable Furniture Production. Sustainability 2025, 17, 6368. https://doi.org/10.3390/su17146368
Grotowska M, Olenska S, Gruszczynska J, Beer P. Analysis of the Properties of Upcycled Wood Waste for Sustainable Furniture Production. Sustainability. 2025; 17(14):6368. https://doi.org/10.3390/su17146368
Chicago/Turabian StyleGrotowska, Małgorzata, Sylwia Olenska, Joanna Gruszczynska, and Piotr Beer. 2025. "Analysis of the Properties of Upcycled Wood Waste for Sustainable Furniture Production" Sustainability 17, no. 14: 6368. https://doi.org/10.3390/su17146368
APA StyleGrotowska, M., Olenska, S., Gruszczynska, J., & Beer, P. (2025). Analysis of the Properties of Upcycled Wood Waste for Sustainable Furniture Production. Sustainability, 17(14), 6368. https://doi.org/10.3390/su17146368