Article

Fingerprinting Agro-Industrial Waste: Using Polysaccharides from Cell Walls to Biomaterials

by
Débora Pagliuso
1,†,
Adriana Grandis
1,†,
Amanda de Castro Juraski
2,
Adriano Rodrigues Azzoni
2,
Maria de Lourdes Teixeira de Morais Polizeli
3,
Helio Henrique Villanueva
4,
Guenther Carlos Krieger Filho
4 and
Marcos Silveira Buckeridge
1,*
1
Laboratory of Plant Physiological Ecology, Department of Botany, Institute of Biosciences, University of São Paulo, São Paulo 05508-090, Brazil
2
Laboratory of Bioprocess Engineering, Department of Chemical Engineering, Polytechnic School, University of São Paulo, São Paulo 05508-010, Brazil
3
Laboratory of Microbiology and Cell Biology, Department of Biology, Faculty of Philosophy, Science and Letters of Ribeirão Preto, University of São Paulo, Ribeirão Preto 14040-901, Brazil
4
Laboratory of Thermal and Environmental Engineering, Department of Mechanical Engineering, Polytechnic School, University of São Paulo, São Paulo 05508-030, Brazil
*
Author to whom correspondence should be addressed.
These authors contributed equally to this work.
Sustainability 2025, 17(14), 6362; https://doi.org/10.3390/su17146362
Submission received: 22 May 2025 / Revised: 25 June 2025 / Accepted: 29 June 2025 / Published: 11 July 2025
(This article belongs to the Section Waste and Recycling)

Abstract

Climate change resulting from human development necessitates increased land use, food, and energy consumption, underscoring the need for sustainable development. Incorporating various feedstocks into value-added liquid fuels and bioproducts is essential for achieving sustainability. Most biomass consists of cell walls, which serve as a primary carbon source for bioenergy and biorefinery processes. This structure contains a cellulose core, where lignin and hemicelluloses are crosslinked and embedded in a pectin matrix, forming diverse polysaccharide architectures across different species and tissues. Nineteen agro-industrial waste products were analyzed for their potential use in a circular economy. The analysis included cell wall composition, saccharification, and calorific potential. Thermal capacity and degradation were similar among the evaluated wastes. The feedstocks of corn cob, corn straw, soybean husk, and industry paper residue exhibited a higher saccharification capacity despite having lower lignin and uronic acid contents, with cell walls comprising 30% glucose and 60% xylose. Therefore, corn, soybeans, industrial paper residue, and sugarcane are more promising for bioethanol production. Additionally, duckweed, barley, sorghum, wheat, rice, bean, and coffee residues could serve as feedstocks for other by-products in green chemistry, generating valuable products. Our findings show that agro-industrial residues display a variety of polymers that are functional for various applications in different industry sectors.

1. Introduction

Population growth is projected to reach 9 billion people by 2050 [1]. This growth, along with climate change, necessitates an increase in land use, food, and energy production, making sustainable development essential to ensure the health and well-being of society. The International Panel on Climate Change (IPCC) assessed the effects of global warming in various scenarios, indicating that new carbon capture and storage systems are vital to mitigate climate change [2]. A notable measure is Biomass Energy with Carbon Capture and Storage (BECCS), which “combines energy from biomass with geological carbon capture and storage” [3]. Therefore, to achieve sustainability, various feedstocks, including valuable liquid biofuels and other value-added by-products, are crucial for replacing oil consumption [3].
Productive chains that lead to a circular economy utilize feedstock until its depletion [4]. The circular economy replaces the end-of-life concept with sustainability to fully optimize feedstocks by reducing, reusing, recycling, and recovering [5,6]. The primary available feedstock is plant biomass, which assimilates atmospheric carbon through photosynthesis and primarily transforms it into cell wall polysaccharides [7]. The cell wall is a rigid and complex structure consisting of pectins, hemicelluloses, cellulose, lignin, and proteins surrounding each plant cell. Pectins are polysaccharides that are rich in galacturonic acid, including homogalacturonans (a linear homopolymer of α-1,4-linked galacturonic acid), rhamnogalacturonan I (the backbone of the disaccharide repeat α-galacturonic acid-1,2-α-rhamnose-1,4), rhamnogalacturonan II (a galacturonic acid backbone with four side branches containing 12 different sugars), xylogalacturonans (galacturonic acid chains with O-3-linked xylose), and apiogalacturonans (galacturonic acid chains with O-2/O-3-linked apiose) [8]. Another polysaccharide that makes up the cell wall is hemicellulose, which consists of β(1-4)-linked backbones with an equatorial configuration that includes xyloglucans (a glucose backbone substituted with side chains of xylose, galactose, arabinose, and fucose), xylans (a xylose backbone), mannans (a mannose backbone), and β-glucans (β-1,3; 1,4 glucose chains) [9]. Cellulose is a β-1,4 glucose chain [10]. The cell wall is organized around a cellulose core, to which hemicellulose and lignin are firmly attached and crosslinked, immersed in a pectin matrix [11]. The primary cell wall is expandable, constituting 90% of its dry weight in polysaccharides. Despite their proportions and compositions, these polysaccharides vary among plants and are classified as Types I, II, and III [11,12]. The Type I cell wall in eudicots and monocots consists of approximately 30% pectins, 30% hemicelluloses (predominantly xyloglucan), 30% cellulose, and 10% proteins [13]. Additionally, minor levels of glucoarabinoxylan are present in Type I cell walls [13]. The Type II cell wall is found in grasses, where glucuronoarabinoxylan serves as the major cross-linking glycan with cellulose [11]. Additionally, in Type II cell walls, it is found that β-glucan, along with low levels of xyloglucan, accounts for 45% of hemicelluloses, 30–36% of cellulose, and 5–10% of pectin [11,14]. Type III cell walls are observed in some ferns, which have high mannan levels, consisting of 31% pectins, 23% hemicelluloses, and 46% cellulose [12]. The secondary cell wall forms after cell growth and elongation during the differentiation of the xylem, phloem, and transfer cells, involving the deposition of cellulose, hemicellulose, and lignin [15].
Cell walls exhibit diverse architectures and chemical compositions across various species and organs [11,14]. Considering the quantitative importance of cell walls in plant biomass for bioenergy production, it is crucial to characterize and elucidate the chemical structures and interactions among the polymers of different cell walls from distinct biomasses through physical, chemical, and genetic analyses to enhance the diversification of sustainable bioproducts [16]. The diversity of biomass and agro-industrial wastes is categorized into waste from wood product industries, municipal solid waste, agricultural residues, and energy crops [17]. Worldwide, 181.5 billion tons of lignocellulosic biomass is produced annually [18]. Among this, 4.6 million tons is agricultural waste, yet only 1.2 billion tons has further applications [19]. Most biomass residues from crops (husks, seeds, roots, bagasse, molasses, leaves, stems, and bark) are underutilized, despite being promising feedstocks for biotechnological products [20].
The advances in biorefinery, green chemistry, and bioprocessing enable the conversion of cellulose, hemicellulose, pectins, and lignin into biofuels, nanoparticles, prebiotics, gels, emulsions, wound-healing agents, drug release systems, and resins [3,21], depending on the composition and architecture of the wall. Furthermore, lignocellulosic materials resist saccharification and enzyme hydrolysis [22], necessitating the use of efficient pretreatments for second-generation ethanol production [18]. Understanding the composition and properties of agro-waste is essential for improving cocktail formulations and effectively pretreating biomass to release monosaccharides or oligosaccharides that microorganisms can metabolize to produce various compounds. The basic units that constitute biomass—carbon, nitrogen, hydrogen, oxygen, and inorganic compounds—are crucial for calculating the calorific potential and other uses of these materials. This work characterized 19 agro-industrial wastes by their cell wall class composition and correlated them with Fourier-Transform Infrared Spectroscopy (FT-IR) analysis, thermogravimetric analysis (TGA), and saccharification capacity to fully assess each polysaccharide’s potential in biorefinery and circular economy. In addition to the similarities in thermal composition, the biomass profile revealed that corn cob, corn straw, soybean husk, and industrial paper residue are more suitable for biofuel production despite having lower lignin and uronic acids. On the other hand, duckweed, barley, sorghum, wheat, rice, bean, and coffee residues are suitable for by-products of green chemistry, despite the polysaccharides’ properties.

2. Materials and Methods

2.1. Agro-Wastes Evaluated

Nineteen agro-wastes (Table 1) were obtained and analyzed for their cell wall composition, chemical properties, and thermal performance. Most of the residues were sourced from local industries; therefore, we are not able to provide an estimation of the collection time and storage conditions at the lab a priori. The residues grown and harvested in the lab were from duckweed, sorghum, soybean, sugarcane, and energy cane plants. The plants followed their growth cycle before harvest, and after harvesting, the obtained residues were lyophilized and stored at room temperature prior to any degradation process. Sugarcane (Saccharum var SP80-3280), energy cane V2 (Saccharum var Vertix 2), energy cane V3 (Saccharum var Vertix 3), industrial sugarcane bagasse (Saccharum spp.), barley bagasse (Hordeum vulgare), sorghum residue (Sorghum bicolor), corn cob (Zea mays), corn straw (Zea mays), wheat bran (Triticum), rice husk (Oryza sativa), soybean straw (Glycine max), soybean residues (leaves + stalk), soybean husk, coffee husk (Coffea spp.), bean straw (Phaseolus vulgaris), duckweed (Lemna minor 8627), pruning tree residue, eucalyptus chip (Eucalyptus spp.), and industrial paper residue (pulp and paper-milled sludge) were dried at 50 °C and ground in a ball mill until a fine powder was obtained.

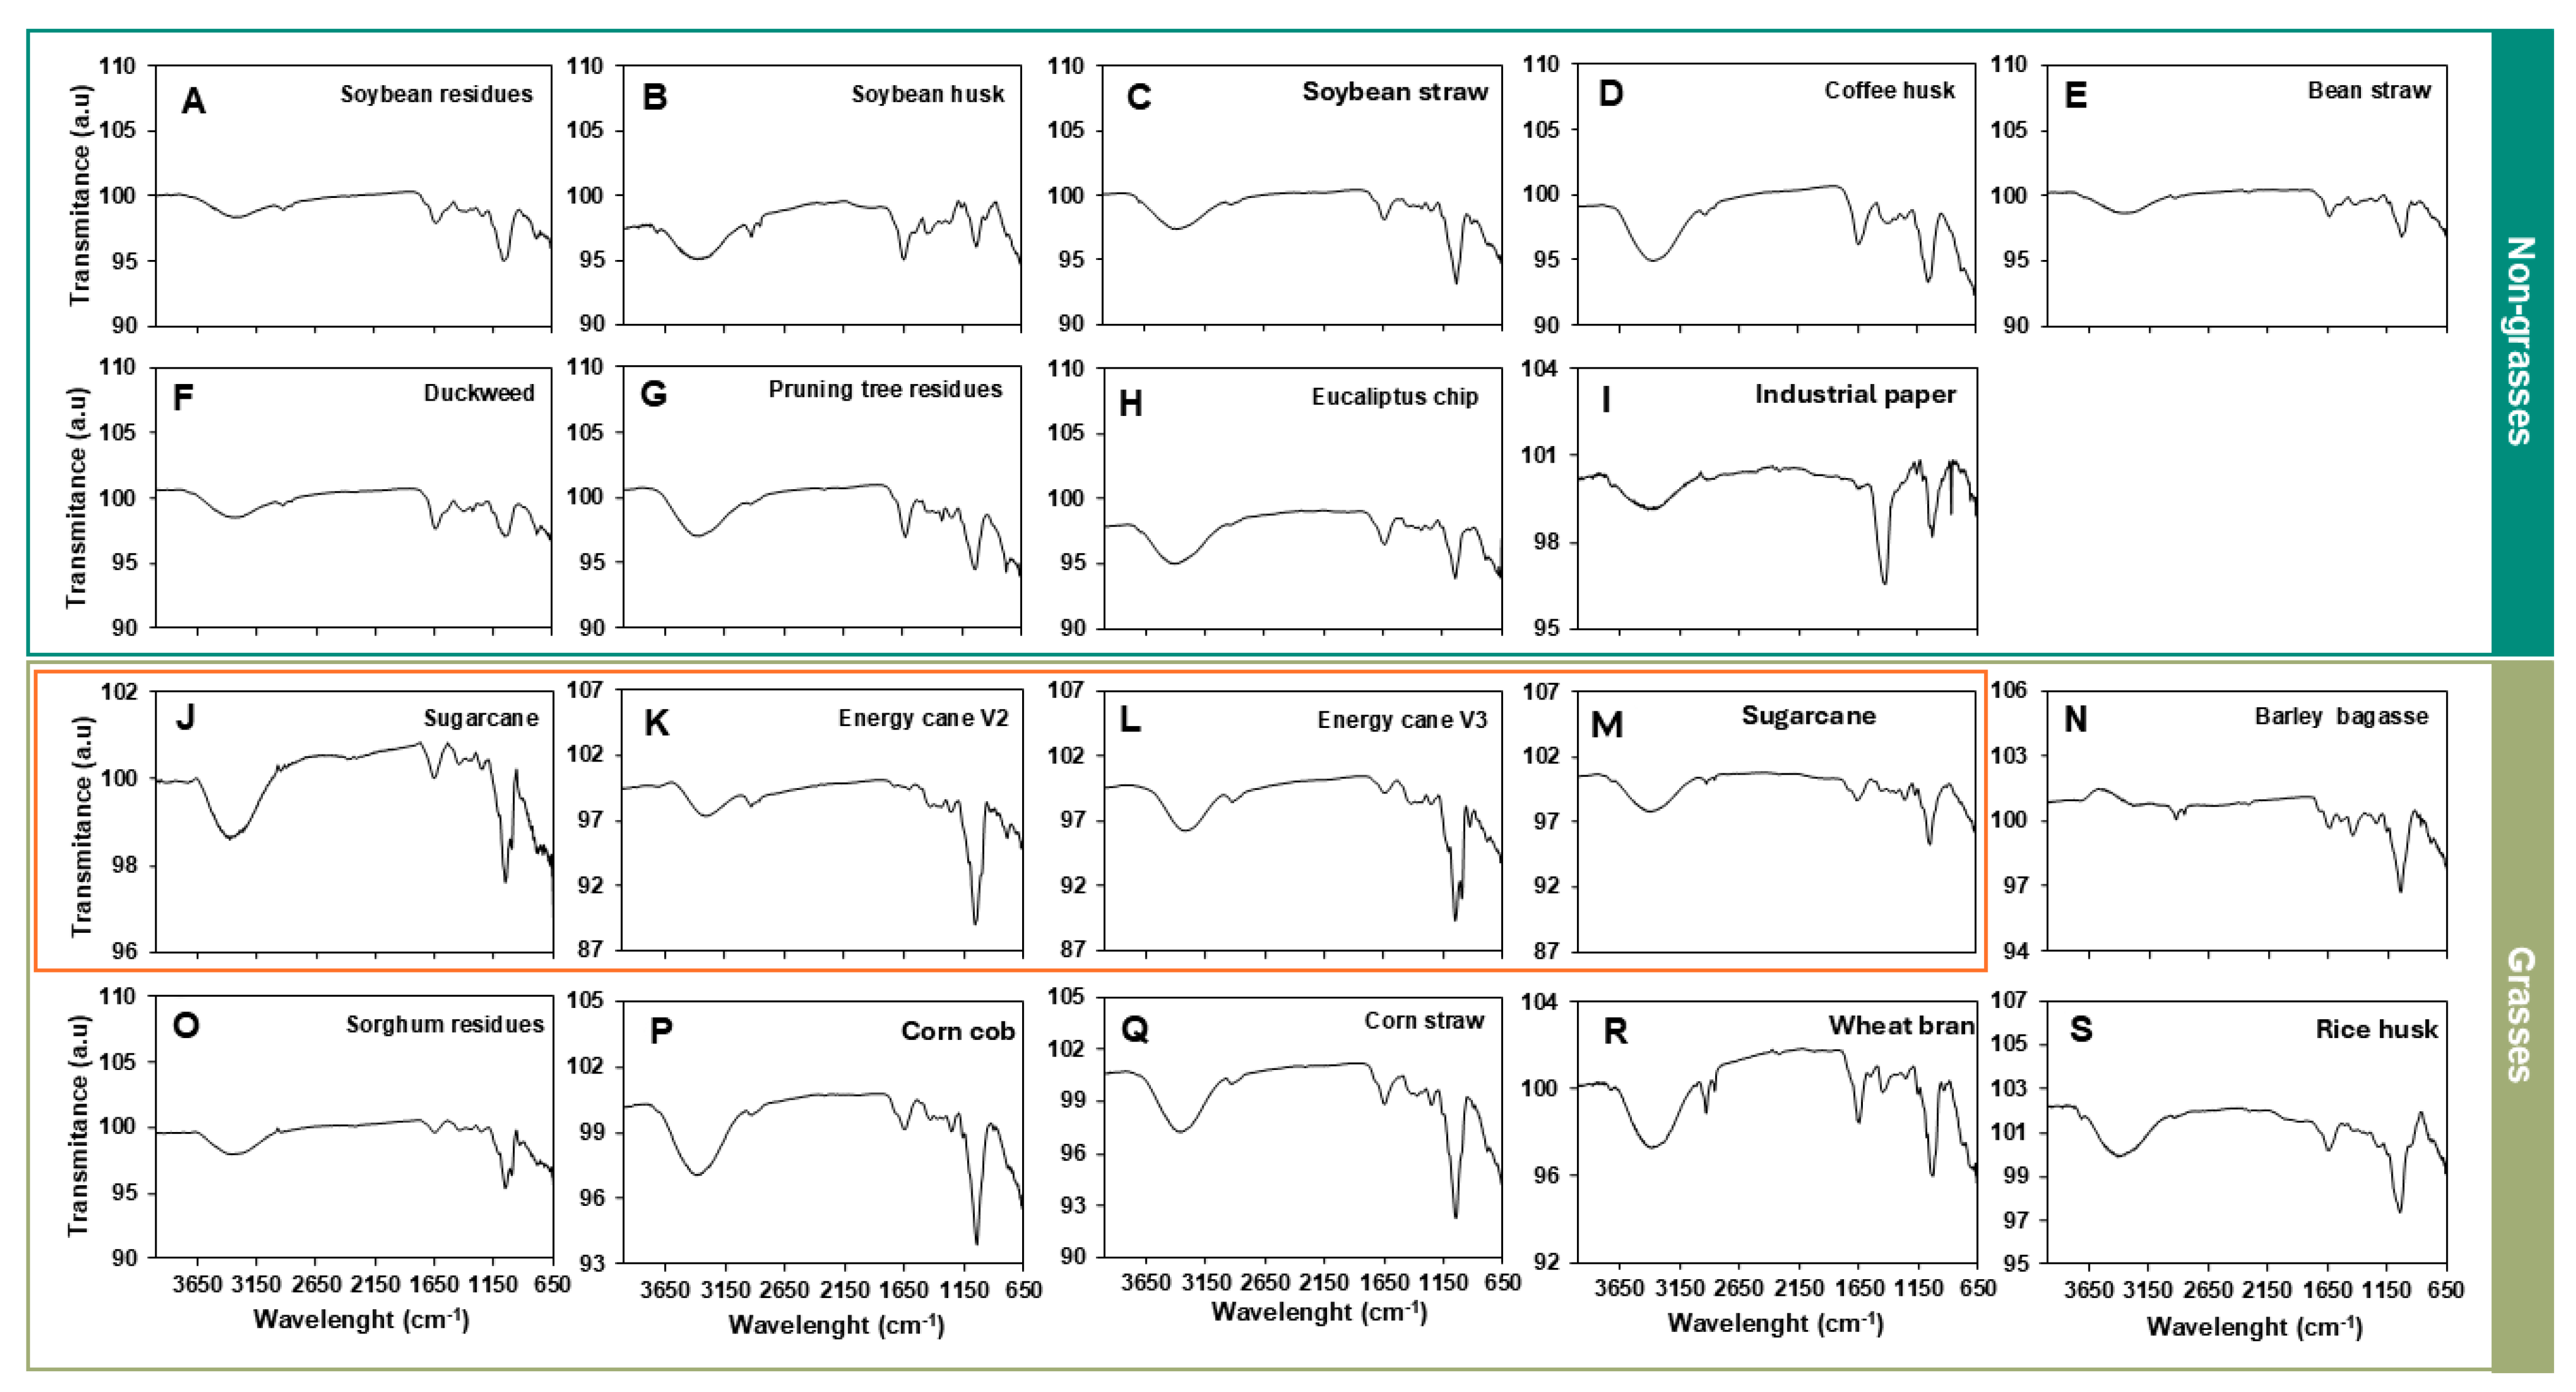
2.2. Compositional Characterization by Fourier-Transform Infrared Spectroscopy (FT-IR)

The chemical composition of the samples was evaluated using FT-IR. The infrared spectrophotometer IRPrestige-21 (Shimadzu, Kyoto, Japan), equipped with an attenuated total reflectance (ATR) accessory and a germanium crystal, was employed. All spectra were recorded between 4000 and 650 cm−1, with a resolution of 4 cm−1 and a minimum of 60 scans.

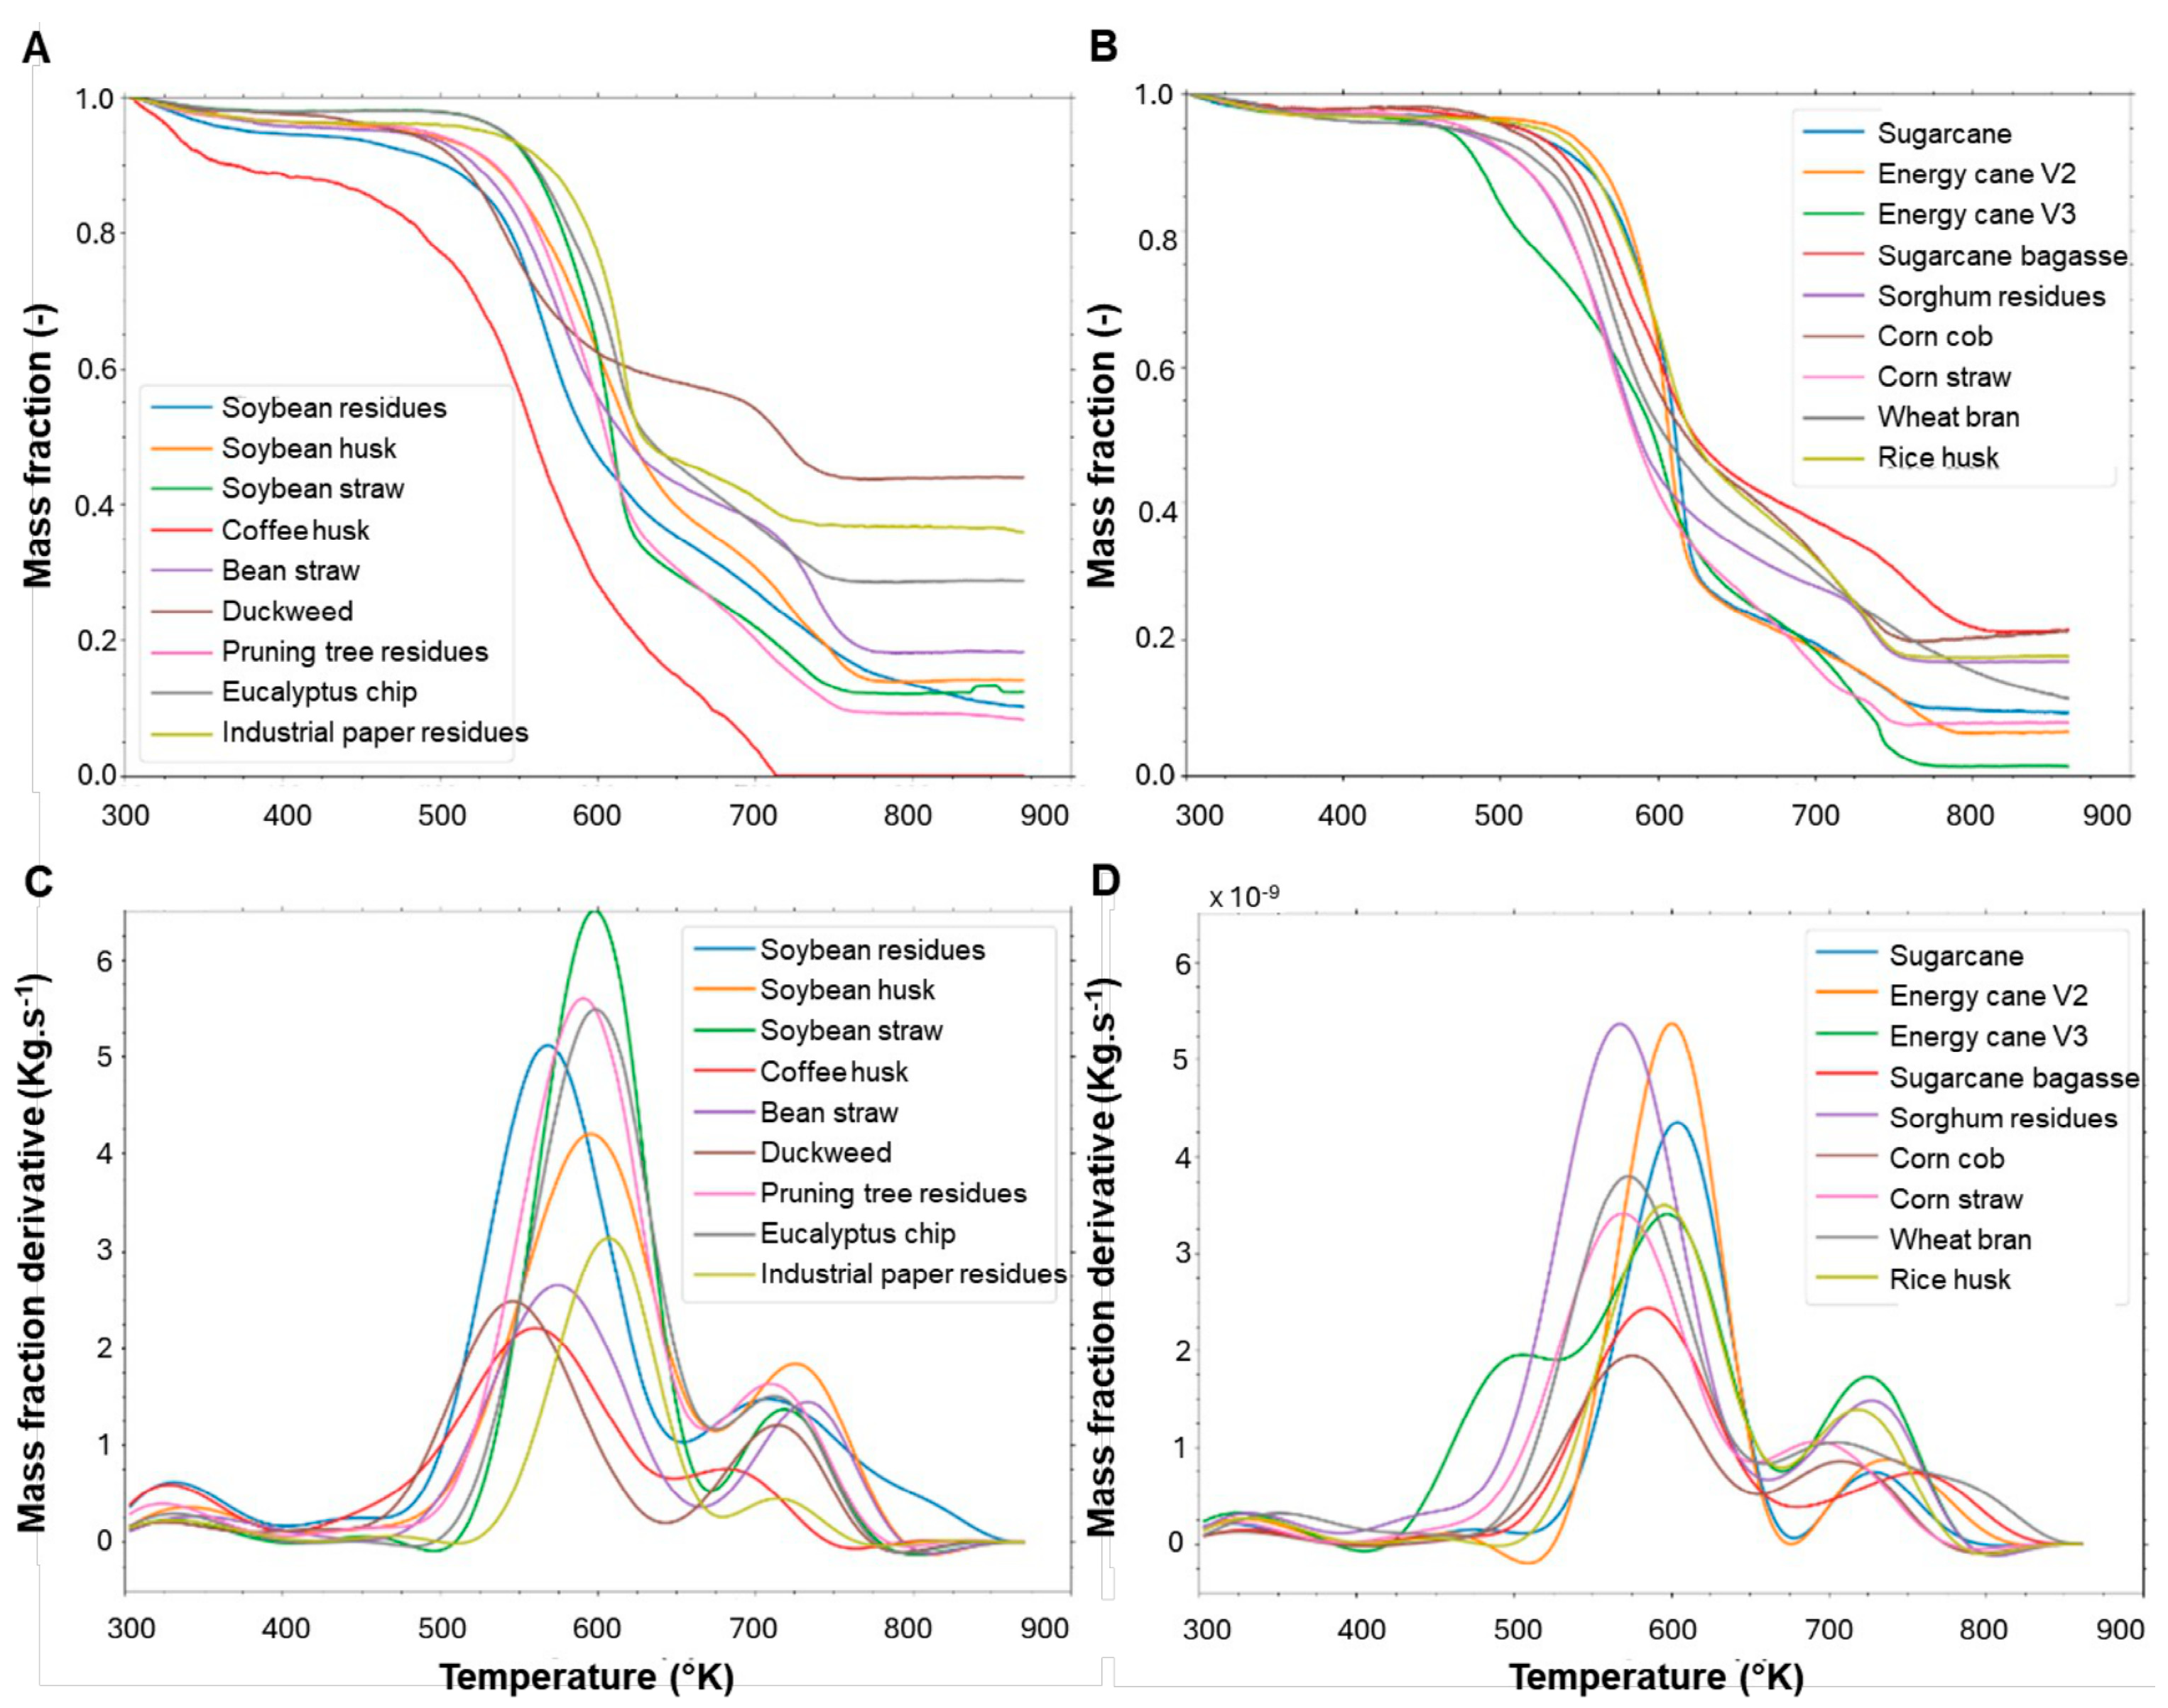
2.3. Elemental Composition and Calorific Power

To evaluate the energetic potential of different agro-wastes’ physicochemical properties, thermogravimetric analysis (TGA) and differential scanning calorimetry (DSC) were conducted to determine the higher heating value (HHV) and identify the peaks of the maximum mass degradation rate as a function of temperature. The ball-milled samples were dried using air circulation at 80 °C (Tecnal TE-394/2, Tecnal, Piracicaba, Brazil) until they reached a constant mass, and then they were sieved through a Tyler 60 mesh, homogenized, and quartered. Ash content was determined following the ASTM D2974 protocol [23], utilizing the microprocessor temperature programmer (LLF9613) and an analytical scale (Shimadzu AUX 220, Shimadzu, Kyoto, Japan).
The elemental composition of agro-waste was analyzed using a CHN Perkin Elmer 2400 Series II analyzer (PerkinElmer, Waltham, MA, USA), with 1.5 mg of each sample. The oxygen content was determined by gravimetric differences. The CHNS/ash correlation was used to evaluate the HHV (higher heating value) [kJ/Kg] of the agro-wastes, as reported by Basu (2013) [24] (Equation (1)):
HHV = 349.1C + 1178.3H + 100.5S − 103.4O − 15.1N − 21.1ASH
where C, H, S, O, N, and ASH represent mass fraction proportions.
The TGA/DSC was conducted using 2–5 mg in the DTG-60H analyzer (Shimadzu), with a temperature gradient ranging from 303 K to 873 K and heating rates of 10 K·min−1 and 30 K·min−1. The experiments employed an oxidative synthetic air composition of N2/O2 at 80/20 vol% and a flow rate of 50 mL·min−1.

2.4. Lignin Quantification

Thirty milligrams of the agro-waste was washed with 1 mL of water, ethanol, a 1:1 v/v mixture of ethanol and chloroform, and acetone at temperatures of 98 °C, 76 °C, 59 °C, and 54 °C, respectively, for 15 min each, while maintaining constant stirring at 750 rpm [25]. After each extraction, the samples were centrifuged at 14,000× g for 5 min at room temperature (RT), the supernatants were discarded, and the final residue was dried at 45 °C. The resulting residue was then submitted for lignin determination using the acetyl bromide method [26,27]. The lignin levels were calculated as described by Chang et al. (2008) [28] (Equation (2)):
A = ε × c × l
where ε = 23.35 l·g−1·cm−1 (for monocots and eudicots) or 17.75 l·g−1·cm−1 (for grasses), and l = 0.1 cm.

2.5. Cell Wall Obtention and Fractionation

The soluble sugars from 500 mg of pulverized waste were extracted thoroughly using 80% ethanol (v/v) at 80 °C. The residue was collected by centrifugation and dried at 50 °C. Starch from the alcohol-insoluble residue (AIR) was extracted twice with 90% DMSO (v/v). The de-starched AIR (cell wall) underwent extraction with 0.5% ammonium oxalate (pH 7.0) at 80 °C for pectin solubilization. All supernatants containing pectins were collected via centrifugation. The ammonium oxalate residues were then further extracted with 3% sodium chloride (m/v) in 0.4% acetic acid (v/v) for 3 h at 70 °C to remove lignin and obtain pectin along with soluble hemicelluloses [29]. The supernatant containing soluble polysaccharides was recovered as previously mentioned. The sodium chlorite residues were extracted with sodium borohydride at room temperature. The supernatants containing hemicelluloses were neutralized with glacial acetic acid. Additionally, the obtained residue primarily consisted of cellulose. After all extractions, the residues were washed with distilled water, frozen, and freeze-dried. The supernatants from ammonium oxalate, sodium chloride, and 4M NaOH were dialyzed, frozen, and freeze-dried. The yields of the cell wall fractions were determined gravimetrically. This procedure followed the one described by De Souza [14] and Gorshkova [30], with modifications.

2.6. Neutral Monosaccharides’ Hydrolysis and Quantification

Two milligrams of the de-starched cell wall and the cell fractions (ammonium oxalate, sodium chloride, 4M NaOH, and residue) were hydrolyzed with 1 mL of 2 M trifluoroacetic acid (TFA) at 100 °C for 3 h while stirring continuously at 750 rpm. The supernatants were vacuum-dried and resuspended in 1 mL of distilled water. The residue fraction primarily contained cellulose; thus, 2 mg of this fraction was pre-hydrolyzed with 100 μL of 72% H2SO4 (v/v) at 30 °C for 30 min, diluted to 4% (v/v), and then heated at 100 °C for 1 h. The supernatants from sulfuric acid hydrolysis were collected by centrifugation at 14,000× g for 10 min at room temperature and then analyzed. The monosaccharides were identified and quantified using HPAEC-PAD with a CarboPac SA10 column (ICS 5000, Thermo-Dionex®, Thermo Fisher Scientific, Waltham, MA, USA). The sugars were eluted isocratically with 0.8% sodium hydroxide at 200 mM (1 min·mL−1) and detected by a post-column flow rate of 500 mM (0.5 min·mL−1). The sugars arabinose, galactose, glucose, xylose, fucose, rhamnose, and mannose were quantified using a standard curve.

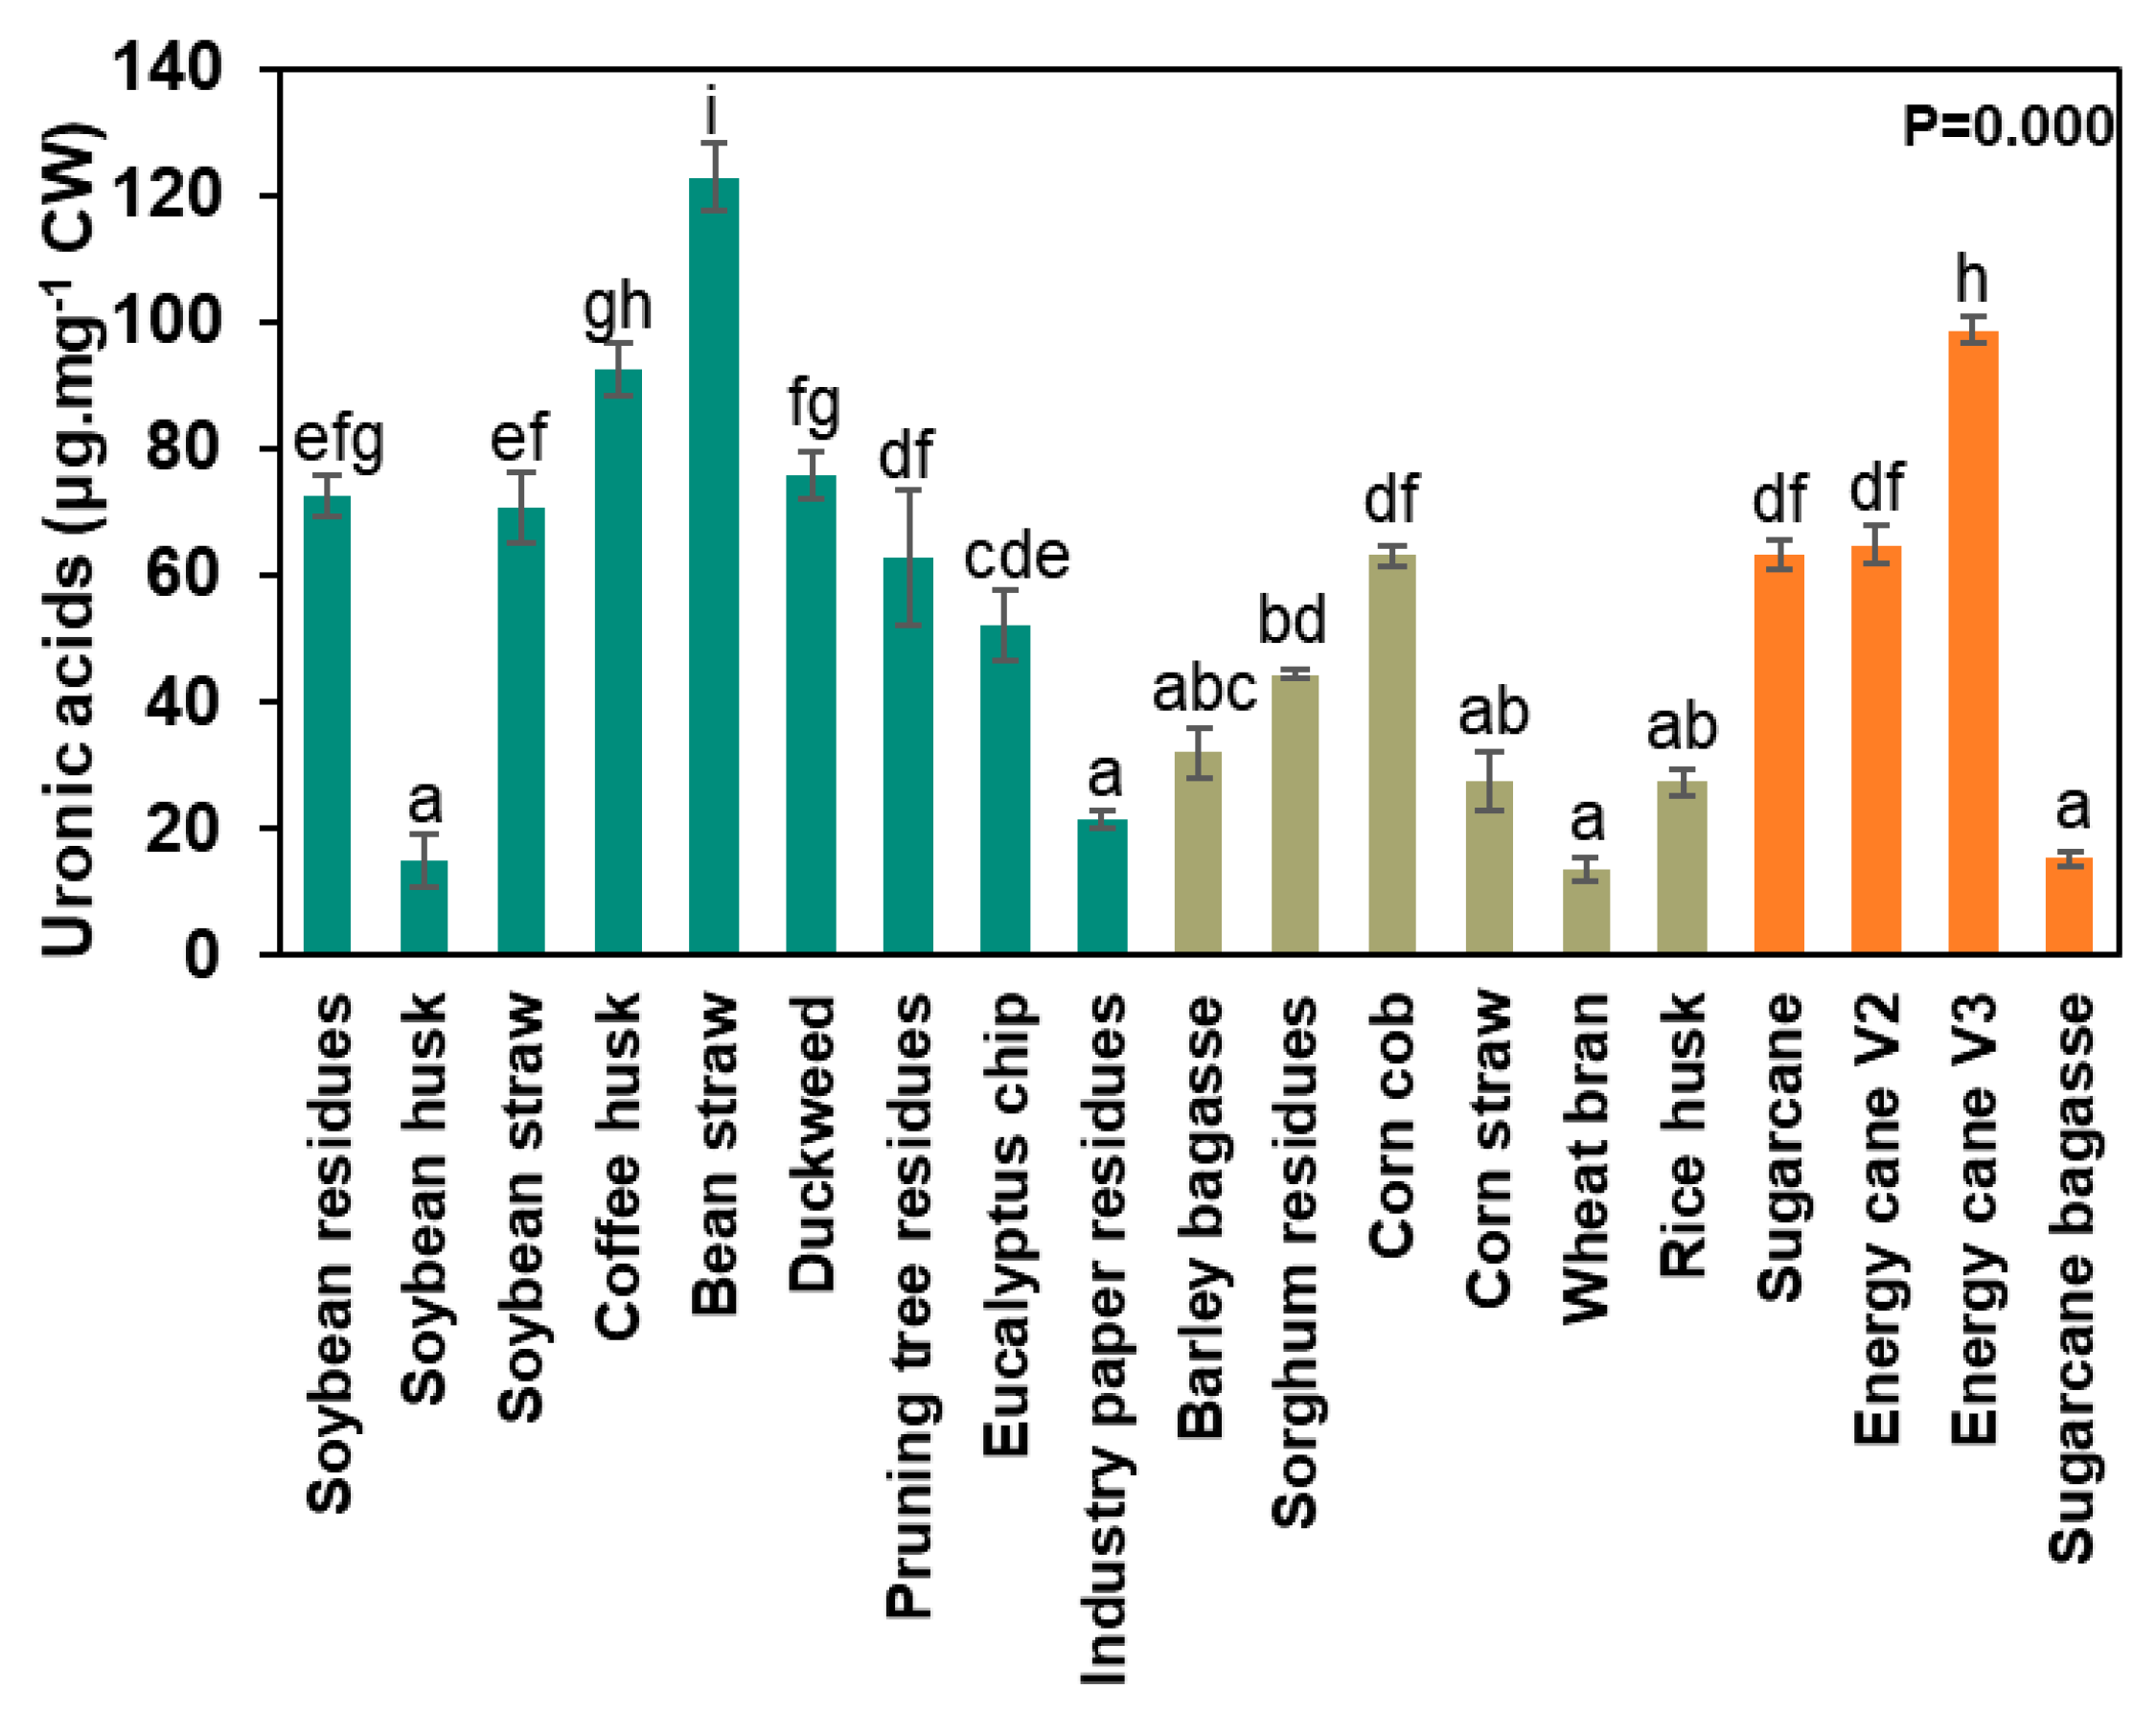
2.7. Uronic Acid Determination

Five milligrams of the de-starched cell wall was submitted to determine uronic acids, as detailed by Filisetti-Cozzi & Carpita [31]. The samples were hydrolyzed in 99.8% sulfuric acid on ice for 10 min while stirring. Deionized water was then added to the mixture and incubated on ice for another 10 min while stirring, repeating this procedure. The final hydrolysate was diluted to 10 mL to achieve a 4% concentration and centrifuged at 4000× g for 10 min at room temperature. The colorimetric assay for uronic acid determination utilized the hydrolysis product with 4M sulfamic acid in potassium sulfamate solution (pH 1.6) and 75 mM sodium borate in sulfuric acid, heated at 100 °C for 20 min. The reaction was cooled on ice for 10 min, after which m-hydroxyphenyl in 0.5% NaOH was added and vortexed. The samples were measured at 525 nm, with quantification based on the D-galacturonic acid curve of 0.12–2.5 M (Sigma-Aldrich®, St. Louis, MO, USA).

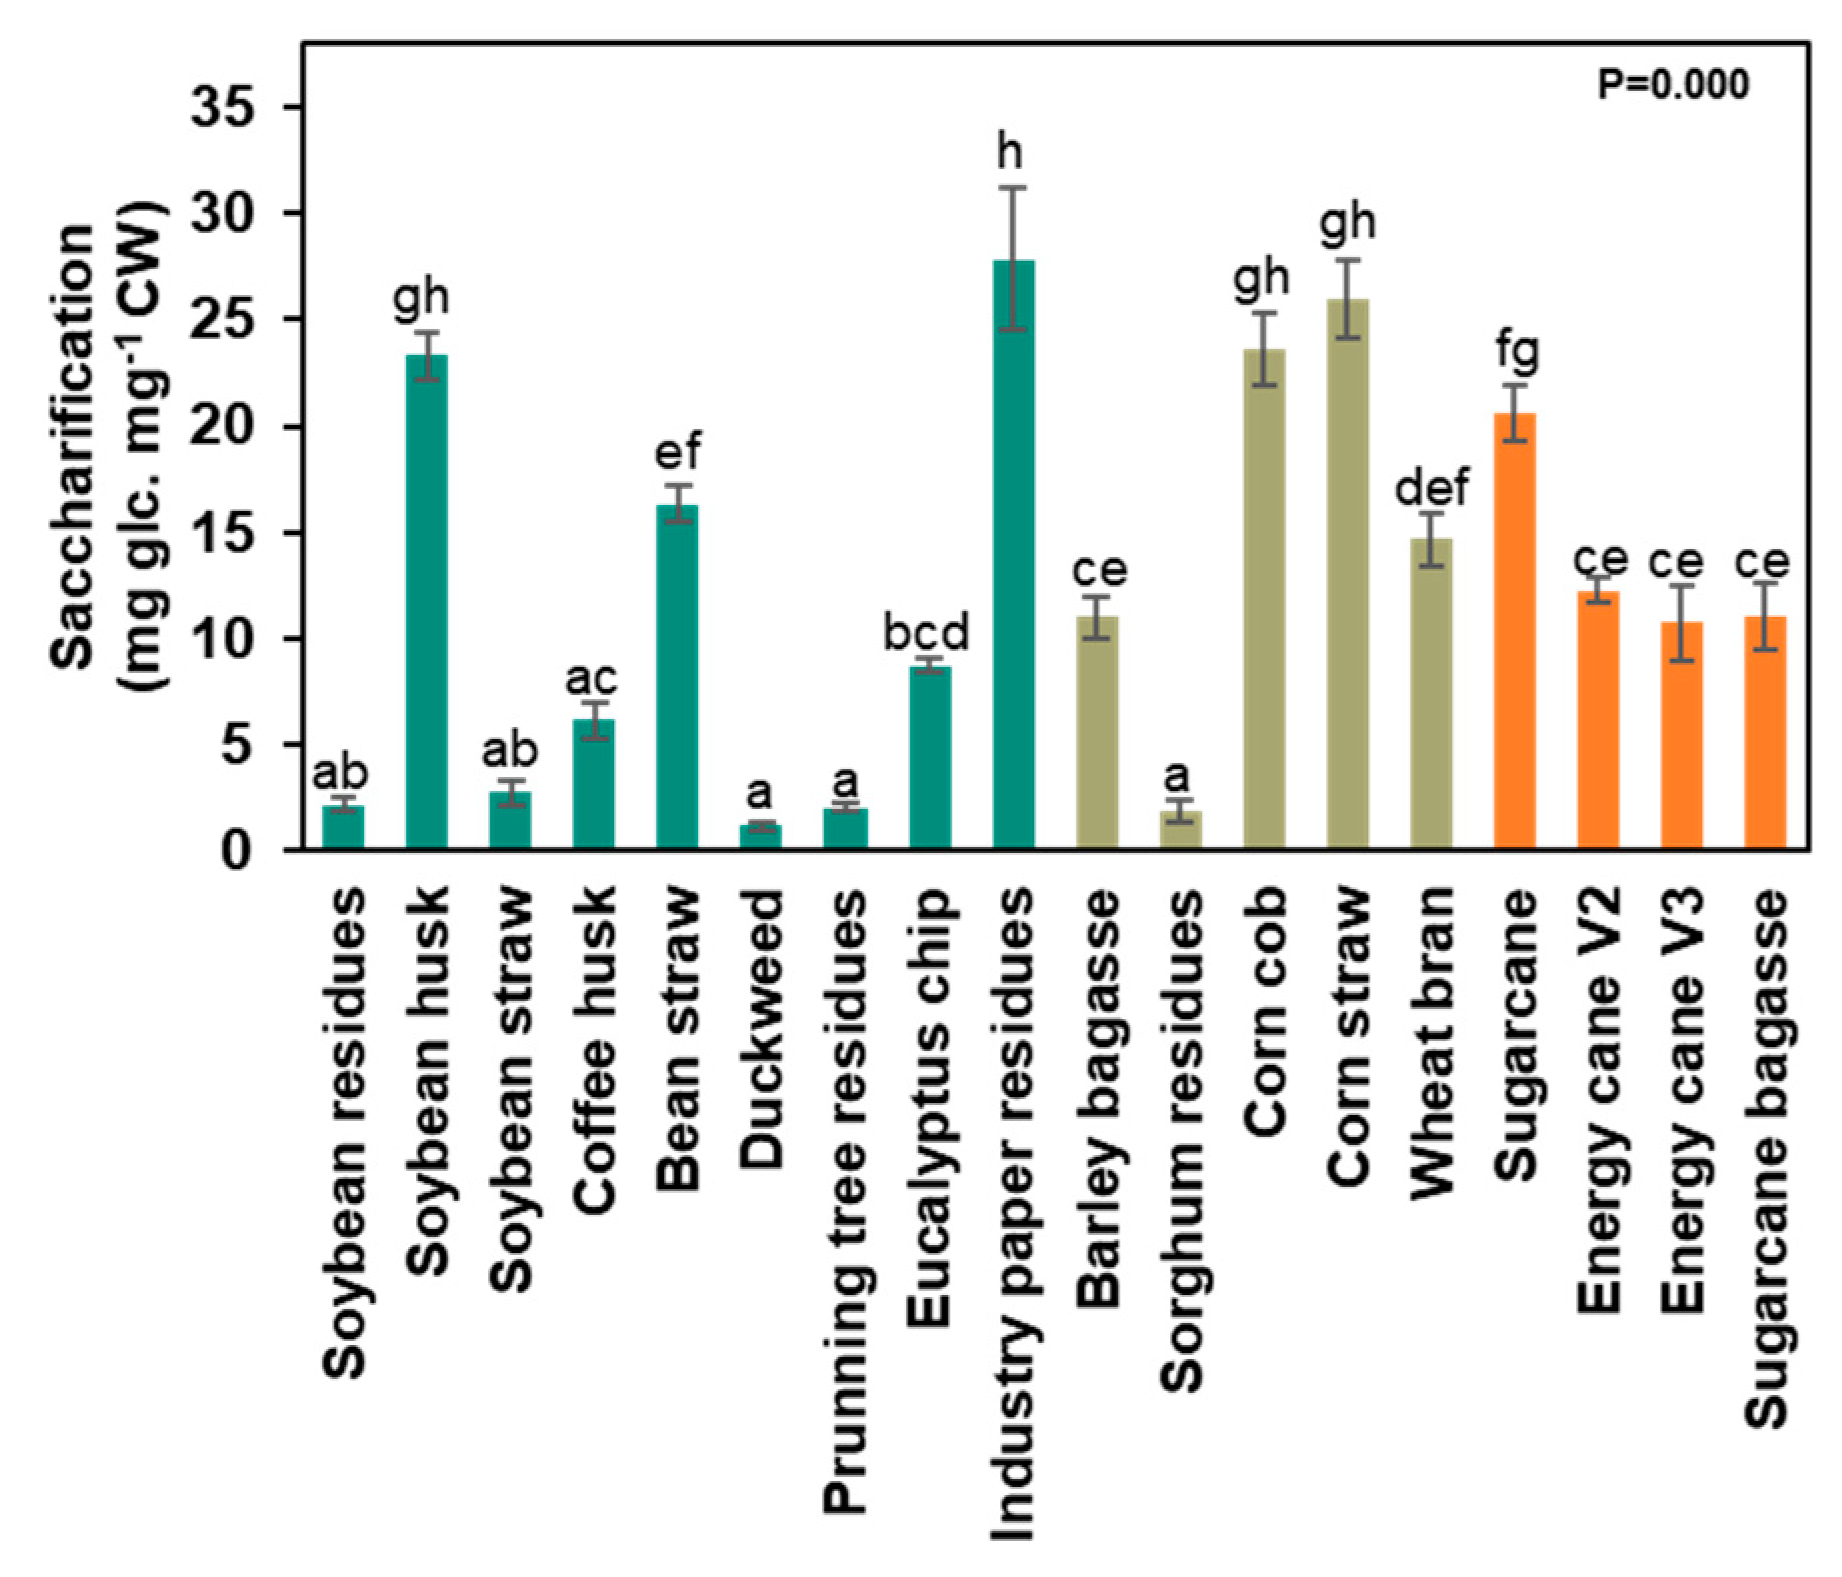
2.8. Cell Wall Saccharification

To evaluate the sugar release capacity of agro-wastes, 10 mg of de-starched cell wall was pretreated with 0.5 N NaOH for 30 min at 90 °C and then washed three times with 25 mM sodium acetate buffer (pH 4.5) for saccharification. The enzyme blend Celic Ctec-II (Novozymes®, Bagsværd, Denmark) was added to the treated samples, which were diluted 1:1000 in 25 mM sodium acetate buffer (pH 5) and incubated for 16 h at 50 °C. The released sugars were determined using the MBTH method [32]. For the enzymatic hydrolysis, 1 M NaOH and MBTH reagent (3 mg/mL MBTH and 1 mg/mL DTT) were added and incubated at 60 °C for 20 min. For color development, an oxidizing reagent [0.2% FeNH4(SO4)], 0.2% sulfamic acid, and 0.1% HCl were added, and the samples were read at 620 nm using a glucose standard curve of 50–200 nmol for quantification.

2.9. Data Analysis

Statistical analysis was performed using ANOVA one-way followed by Tukey’s test, at a significance level of p ≤ 0.05 (R® version 4.2.1), to compare the various biomasses across each analyzed variable. Cell wall fractionation, monosaccharides, uronic acids, lignin analyses, and saccharification were conducted in quintuplicate (n = 5), while organic matter (C, H, O, N, S) and ash were examined in triplicate (n = 3).

3. Results

The agro-wastes were grouped according to the primary cell wall type for data analysis. The classification of non-grass (Type I) and grass (Type II) cell walls was based on the levels of pectins, hemicelluloses, and cellulose, as well as the predominance of hemicellulose, as proposed by McCann & Roberts [13] and Carpita & Gibeaut [11]. Nine waste products were classified as non-grasses (soybean residue, soybean husk, soybean straw, duckweed, coffee husk, bean straw, pruning tree residues, eucalyptus chip, and industrial paper residue), while ten were classified as grasses (sugarcane bagasse, sugarcane, energy cane v2, energy cane v3, rice husk, barley bagasse, corn straw, corn cob, sorghum residue, and wheat bran).

3.1. Agro-Wastes Have Similar Industrial Characteristics

The FT-IR technique enabled the identification of molecules in agro-industrial wastes by analyzing radiation wavelengths and intensities. The 19 waste samples exhibited similar spectra, revealing characteristic peaks at 3340 cm−1 (OH) to 2290 cm−1 (C-H) (cellulose), 1750 cm−1 and 1630 cm−1 (C=O bonds from aromatic rings), and peaks at 800 cm−1 and 1050 cm−1 (C-O, C=C, and C-O-C polysaccharide bonds) (Figure 1). Since the spectrum shown in Figure 1D represents cell walls (alcohol-insoluble residues), and the more soluble low-molecular-weight materials have already been extracted, the vibrations common to most samples around 1000 and 1650 cm−1 likely originate from C-O and C-O-C stretching associated with cellulose, mannans, and xylans. The vibrations near 1650 cm−1 are typical of carbohydrates, as they indicate OH groups (O-H bending) and correlate with the high concentrations of carbohydrates in the samples. Additionally, vibrations in this spectral region may represent C=O stretching typical of lignin, which was also present in the samples. Overall, the FT-IR analyses confirm that the composition of the biomass from the residues studied in this research mainly consists of carbohydrate polymers.
On average, the elemental composition of the agro-wastes consisted of 40.9% carbon, 5.9% hydrogen, 46% oxygen, 1.2% nitrogen, and 6% ash (Table 2). The average higher heating value, which indicates the energy stored in these materials, was 16.3 MJ/kg. The percentages of C and H in the samples correlated directly with the HHV, while N and O did not (Supplementary Figure S1). This confirms that carbohydrates are the primary compounds associated with the energy present in biomass. A clear distinction between Non-grasses and Grasses is evident in Figure 2, indicating that more energy is stored in the biomasses of grass-generated residues. Sugarcane residues show a significant difference toward higher HHVs. Non-grass wall residues exhibited higher carbon and hydrogen contents, which were reflected in the increased oxygen content of grass walls (Table 2). The carbon content of sugarcane, energy cane V2 and V3, sugarcane bagasse, barley bagasse, and soybean straw were greater (~44%) than that of bean straw, eucalyptus chip, duckweed, and rice husk (~38%). The hydrogen contents in eucalyptus chips (4.7%) and industrial paper residues (4.42%) were the lowest recorded. The ash content varied from 0.96% to 23%. Non-grass ash was 3%, except for bean straw, duckweed, and industrial paper residue, which contained 8.2%, 9.9%, and 22.9% ash, respectively. The ash content in some sugarcane-related materials (sugarcane, energy cane V2, energy cane V3, and sugarcane bagasse) was 1.1%, while rice husk contained 14.98% (Table 2).
The thermal composition exhibited a similar pattern across the evaluated agro-wastes. However, the highest HHV was recorded in barley bagasse (18.93 MJ·Kg−1), followed by sugarcane bagasse (18.04 MJ·Kg−1), sugarcane (18.10 MJ·Kg−1), energy cane V2 (18.10 MJ·Kg−1), energy cane V3 (17.72 MJ·Kg−1), and soybean straw (17.42 MJ·Kg−1). In contrast, the lowest values were observed in eucalyptus chips (12.33 MJ·Kg−1) and industrial paper residues (11.76 MJ·Kg−1), indicating a reduction in energy content of up to 38% (Table 2). The TGA results revealed a comparable thermal degradation pattern among the 19 assessed agro-wastes. The maximum mass loss rate was found to occur at 600 K, while a secondary peak of lower magnitude was identified at 750 K (Figure 2).
The saccharification capacity was assessed to verify its potential for producing monosaccharides for the fermentative process of bioethanol production. Sugarcane, soybean husk, corn cob, corn straw, and industrial paper residue exhibited higher saccharification capacity (23.4 mg glc·mg CW−1) (Figure 3). Industrial paper residue (27.8 mg glc·mg CW−1), corn straw (26.0 mg glc·mg CW−1), corn cob (23.6 mg glc·mg CW−1), and soybean husk (23.3 mg glc·mg CW−1) demonstrated 13 times more saccharification capacity than duckweed (1.2 mg glc·mg CW−1), sorghum residue (1.9 mg glc·mg CW−1), pruning tree residue (2 mg glc·mg CW−1), soybean residue (2.2 mg glc·mg CW−1), and soybean straw (2.7 mg glc·mg CW−1) (Figure 3). Grass walls displayed slightly higher saccharification than non-grass walls, measuring 14.2 and 10 mg glc·mg CW−1, respectively (Figure 3). The varying saccharification capacities of the different cell wall types and samples indicate compositional differences that require further evaluation.

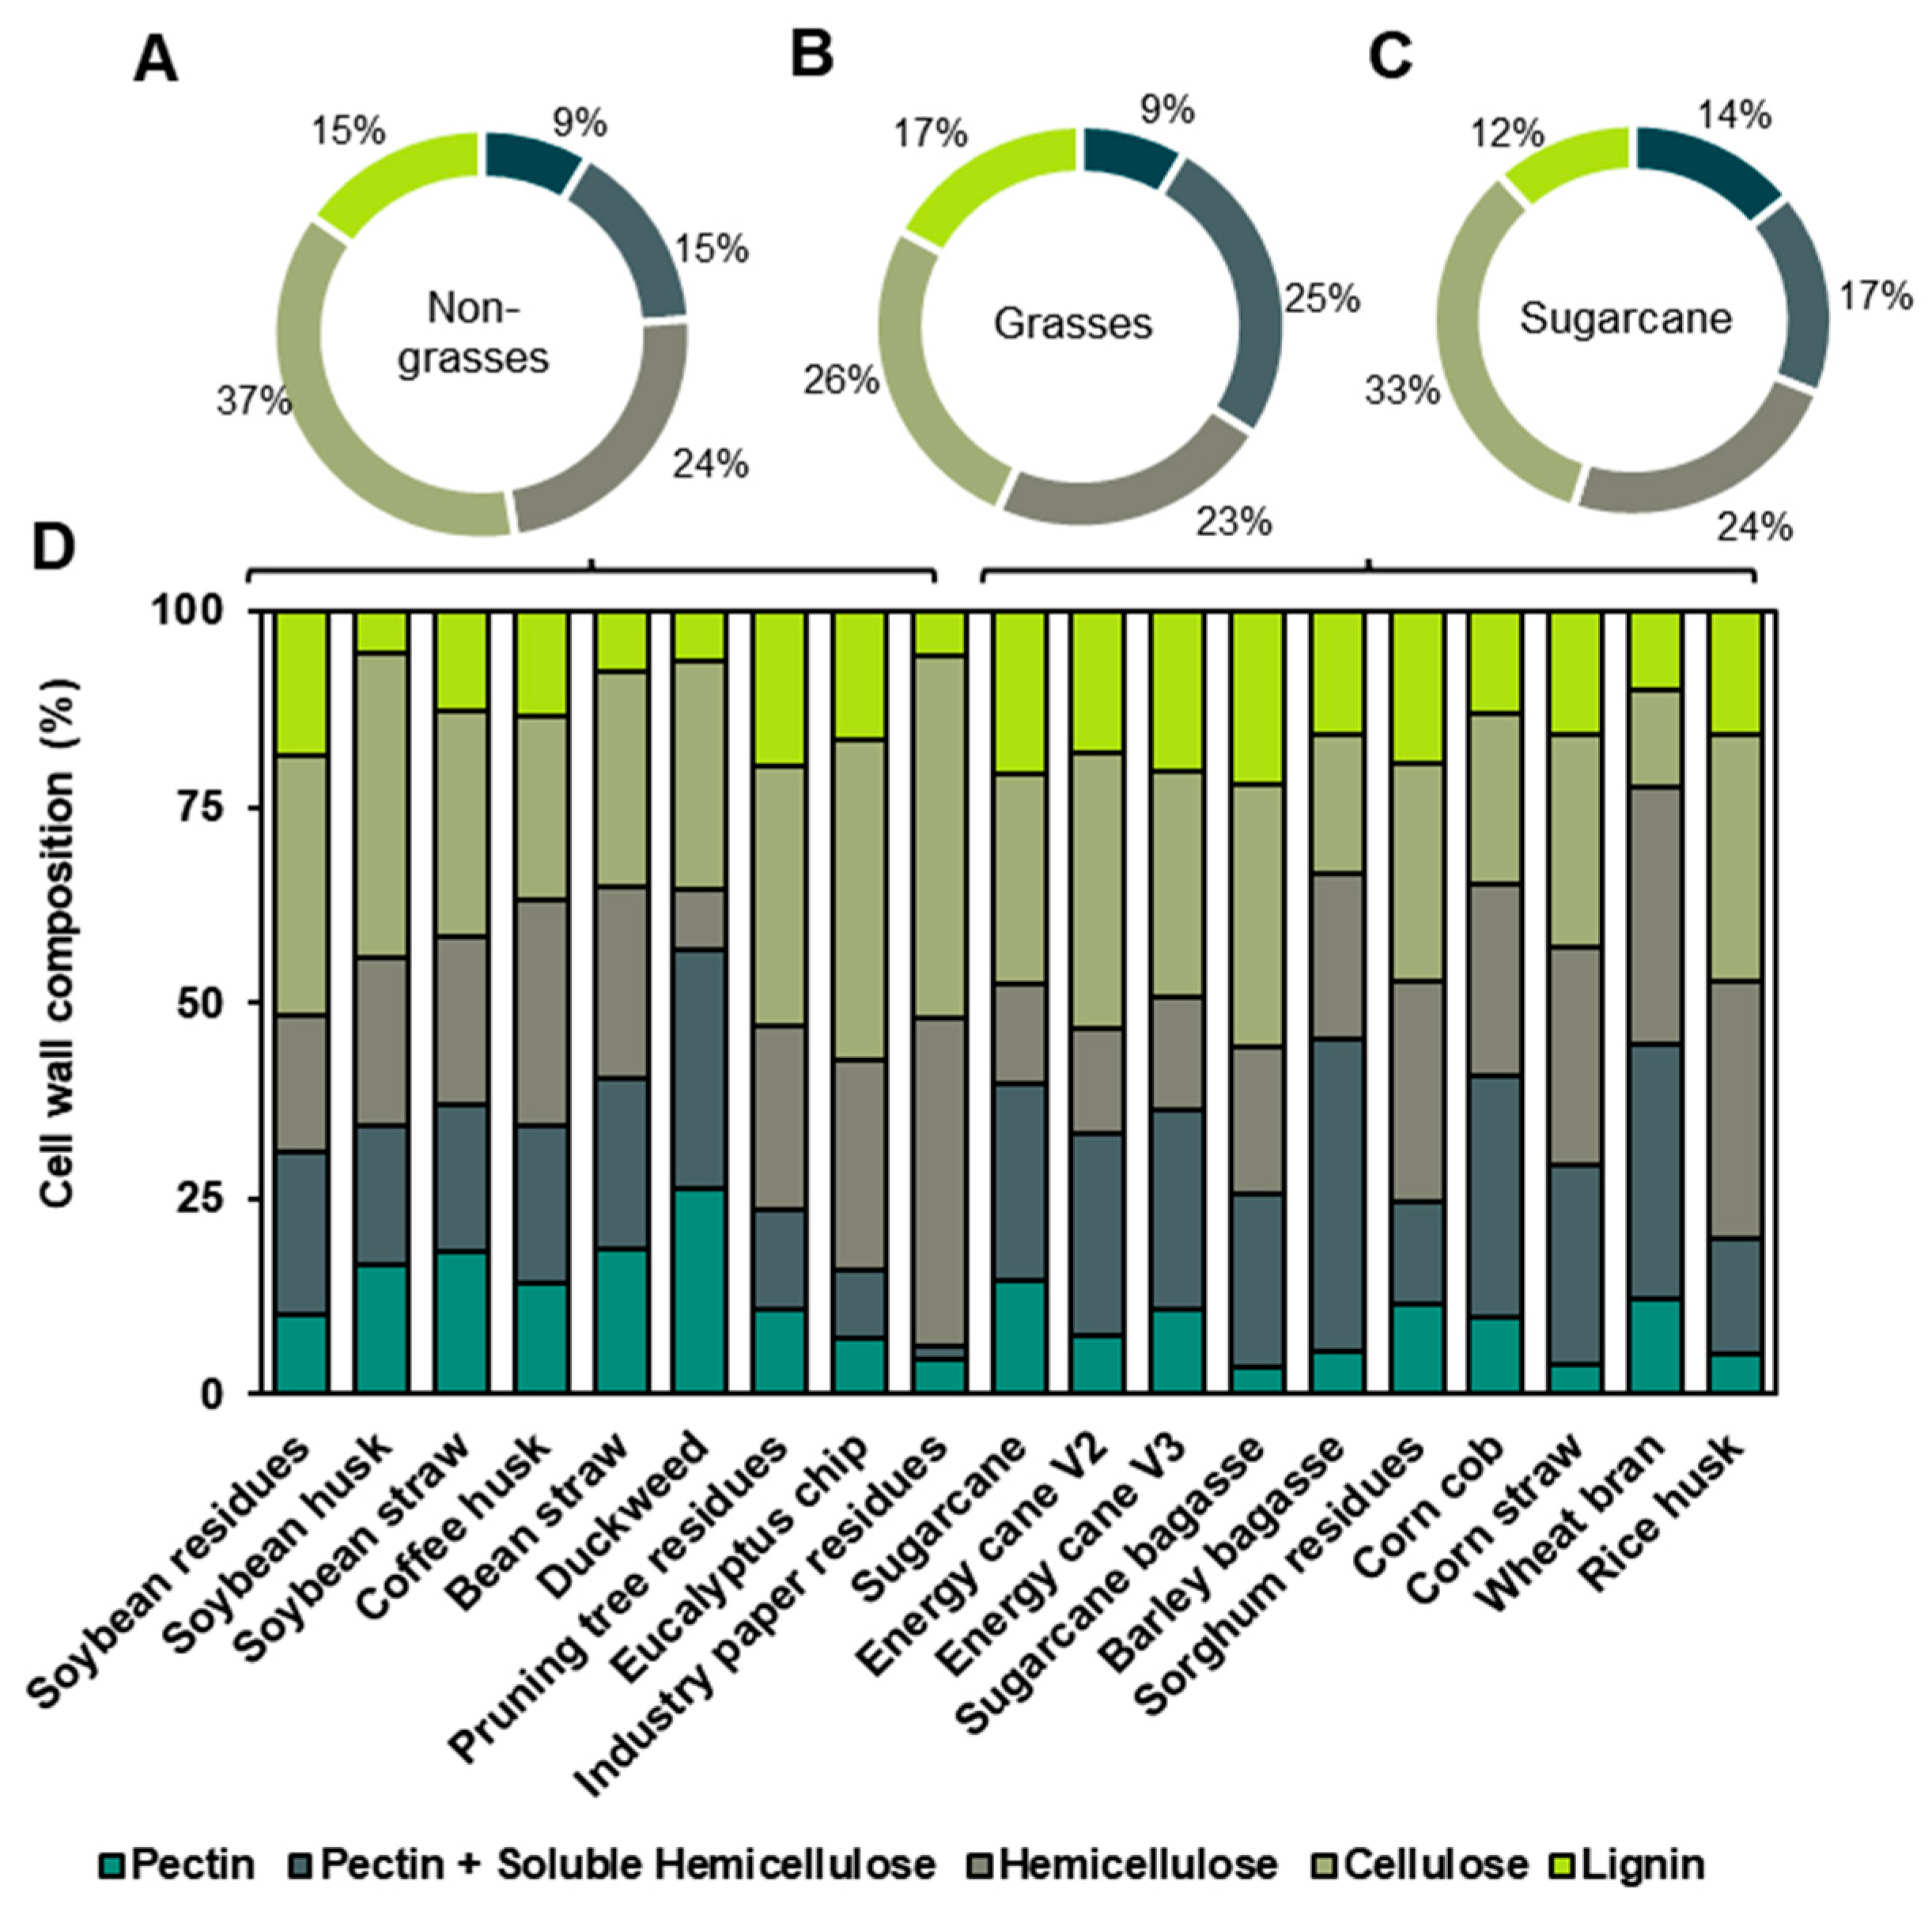
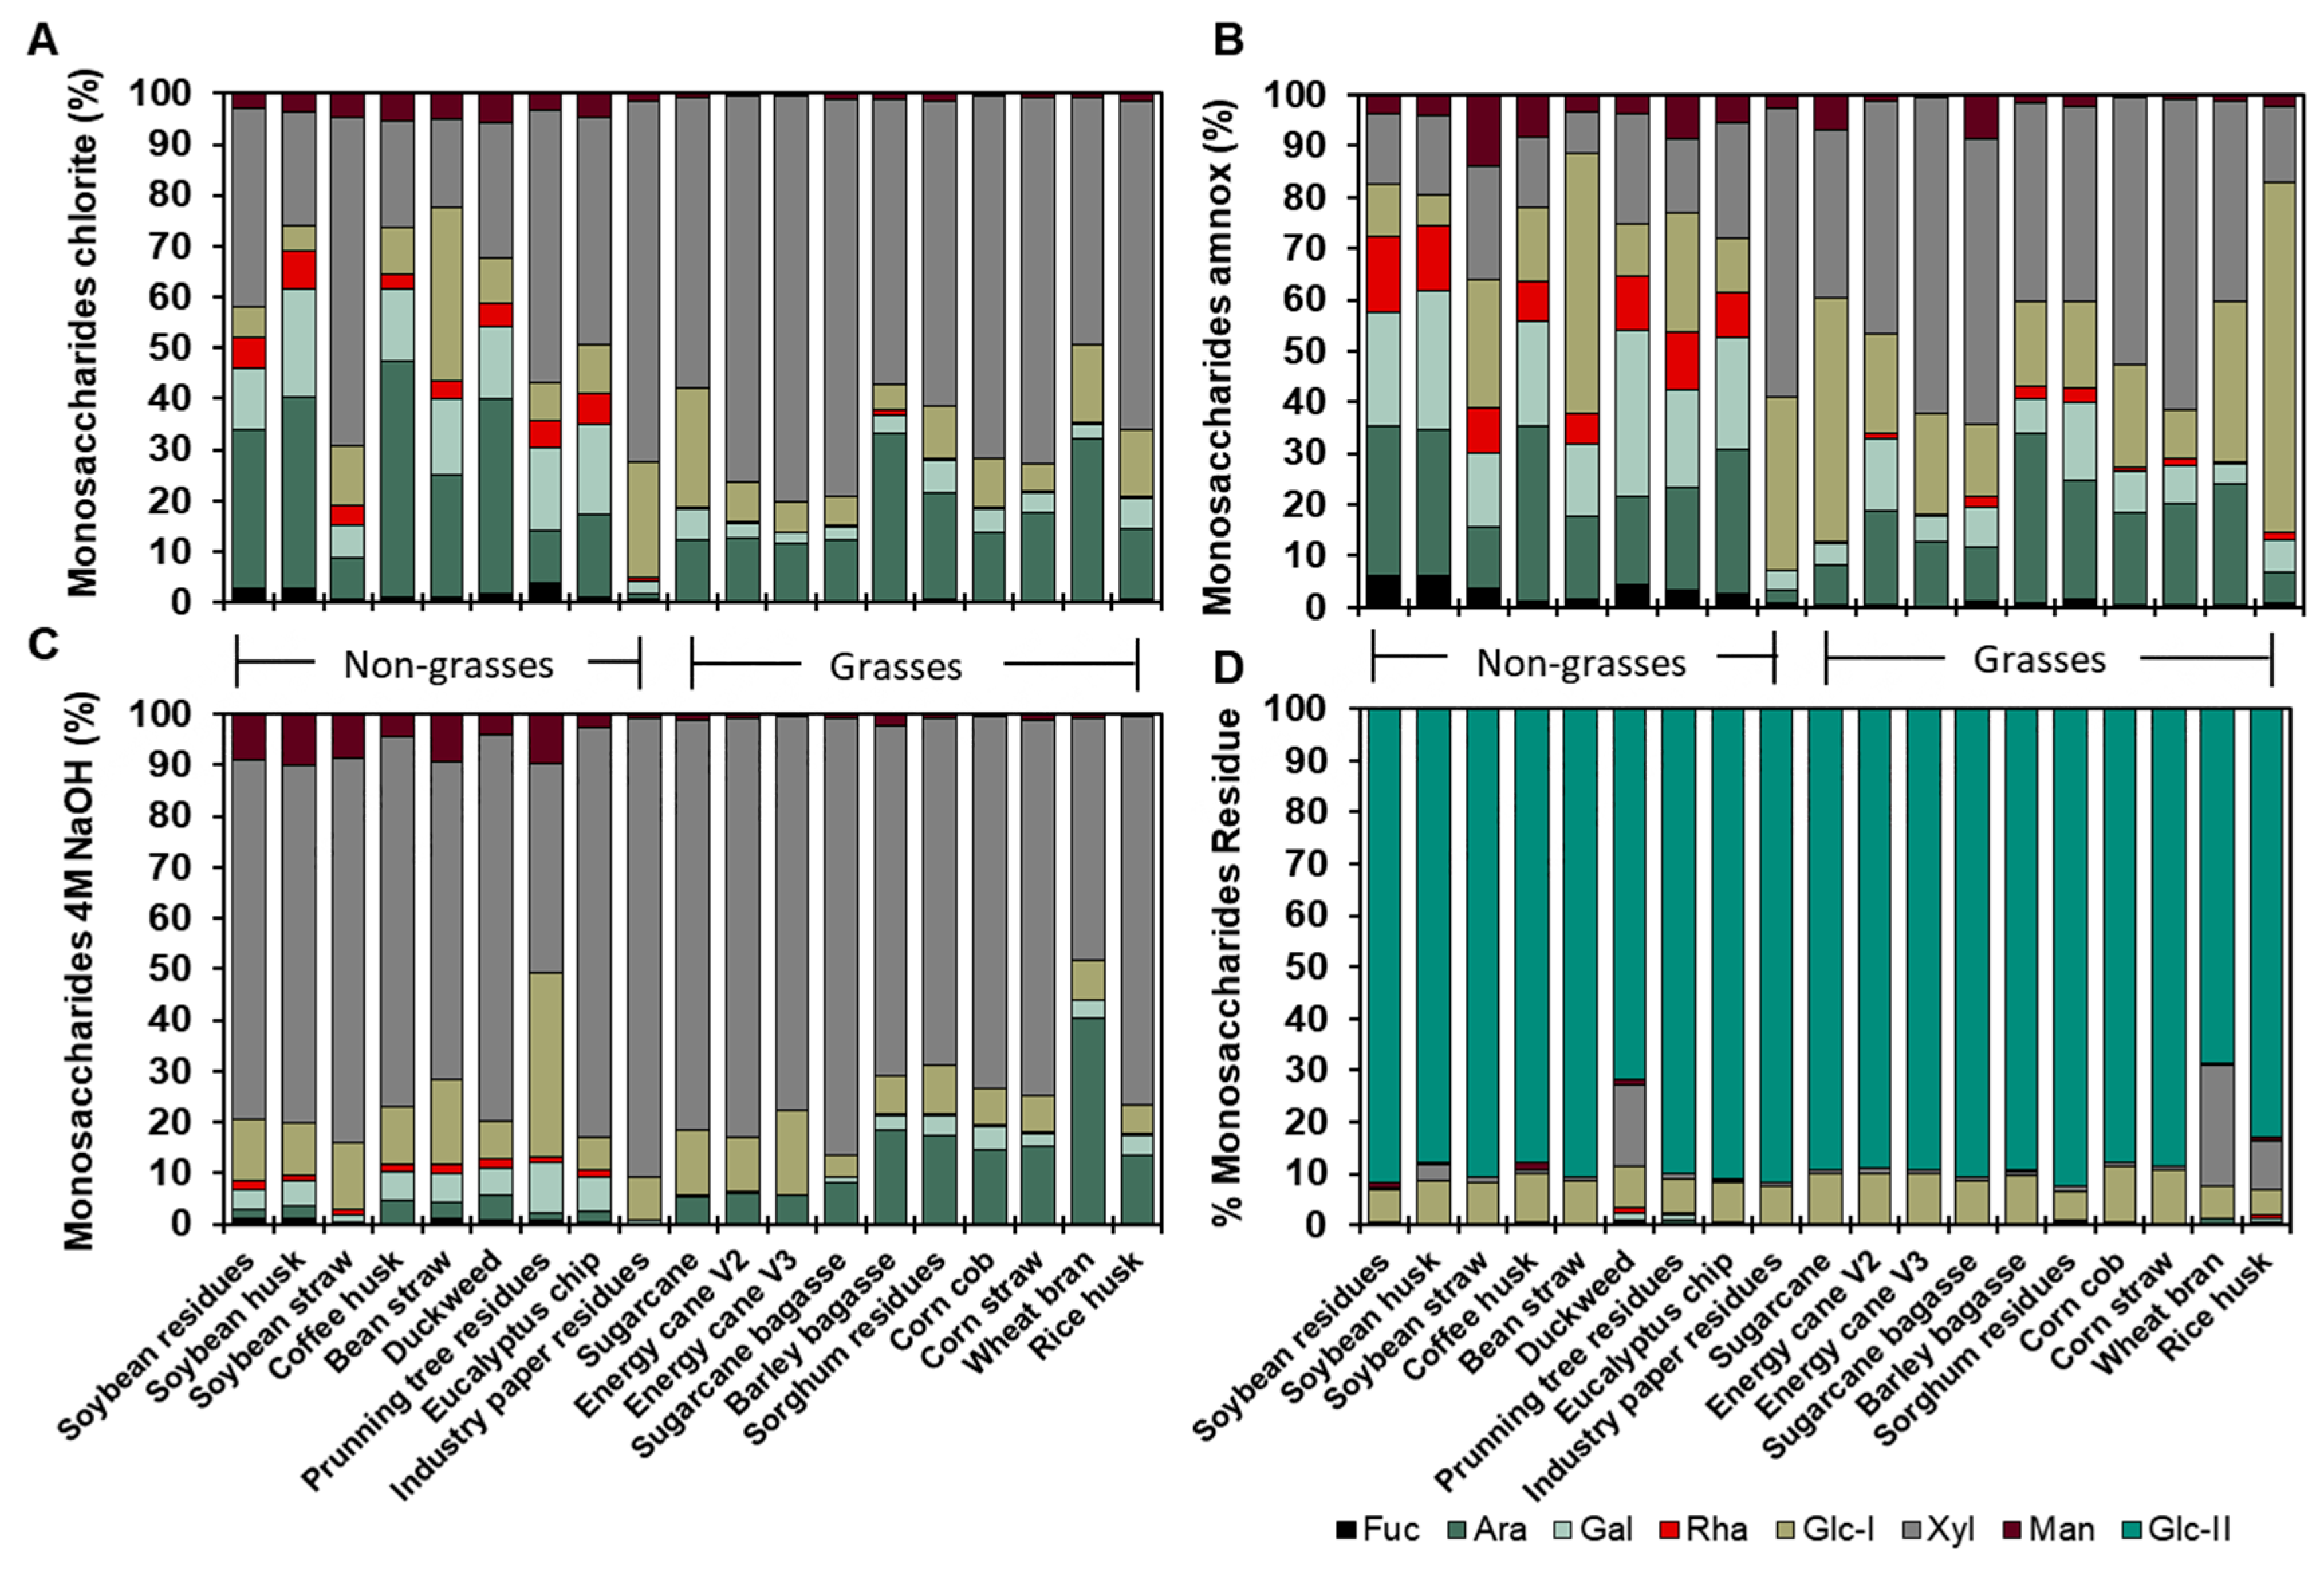
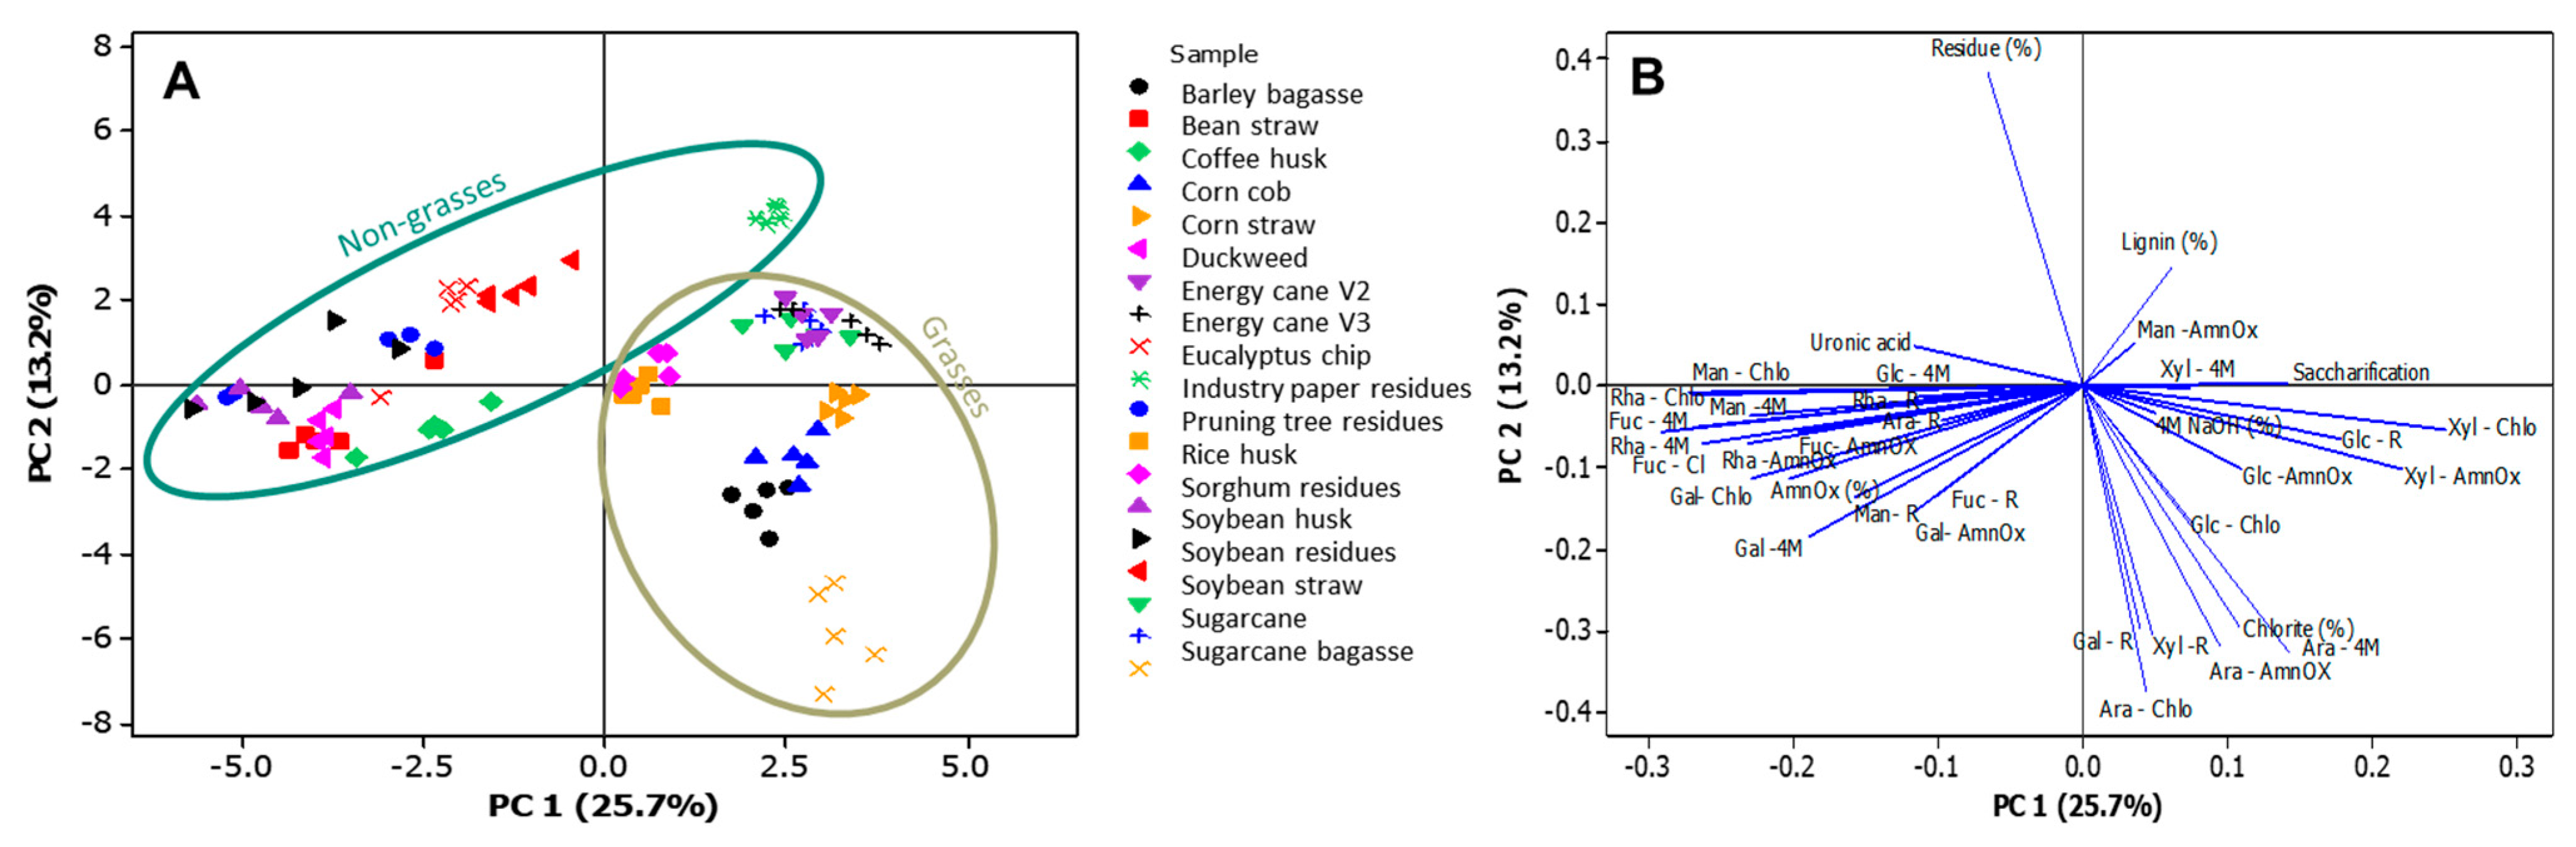
3.2. Agro-Wastes Have Different Proportions of Cell Wall Domains

The materials resulting from the industrial process that represent non-grass cell walls contained, on average, 14% pectins, 17% pectins plus soluble hemicelluloses, 24% hemicelluloses, 33% cellulose, and 12% lignin (Figure 4). The industrial paper residue was rich in hemicelluloses and cellulose, comprising 41.8% hemicelluloses, 46.3% cellulose, and 5.6% lignin, while duckweed was pectin-rich, with 26.3% pectins and 30.5% pectins plus soluble hemicelluloses (Figure 4 and Supplementary Table S1). Conversely, the pruning tree residues and eucalyptus chips contained lignin (19.7% and 17.5%, respectively), hemicellulose (23.6% and 26.3%, respectively), and cellulose (33.1% and 40.4%, respectively) (Figure 4 and Supplementary Table S1).
Furthermore, the various soybean wastes (husk, straw, and residue) exhibited differing cellulose proportions (38.9%, 33.1%, and 28.8%, respectively) and lignin levels (5.3%, 18.5%, and 12.8%, respectively), while showing similar levels of pectins (16.7%, 10.3%, and 18.2%, respectively), pectins plus soluble hemicelluloses (17.8%, 20.8%, and 19.0%, respectively), and hemicelluloses (21.4%, 17.4%, and 21.4%, respectively) (Figure 4 and Supplementary Table S1). Grass cell walls contained 9% pectins, 25% pectins plus soluble hemicelluloses, 23% hemicellulose, 26% cellulose, and 17% lignin (Figure 4 and Supplementary Table S1). Pectin levels were lower in sugarcane bagasse (3.4%), corn straw (3.9%), rice husk (5.2%), and barley bagasse (5.4%), which correspondingly had higher levels of hemicelluloses (19%, 28%, 33%, and 21%, respectively) and cellulose (33.5%, 27%, 31.4%, and 17.7%, respectively) (Figure 4 and Supplementary Table S1). Wheat bran was rich in hemicellulose (32.5% pectins plus soluble hemicelluloses and 32.6% hemicelluloses) (Figure 4 and Supplementary Table S1).

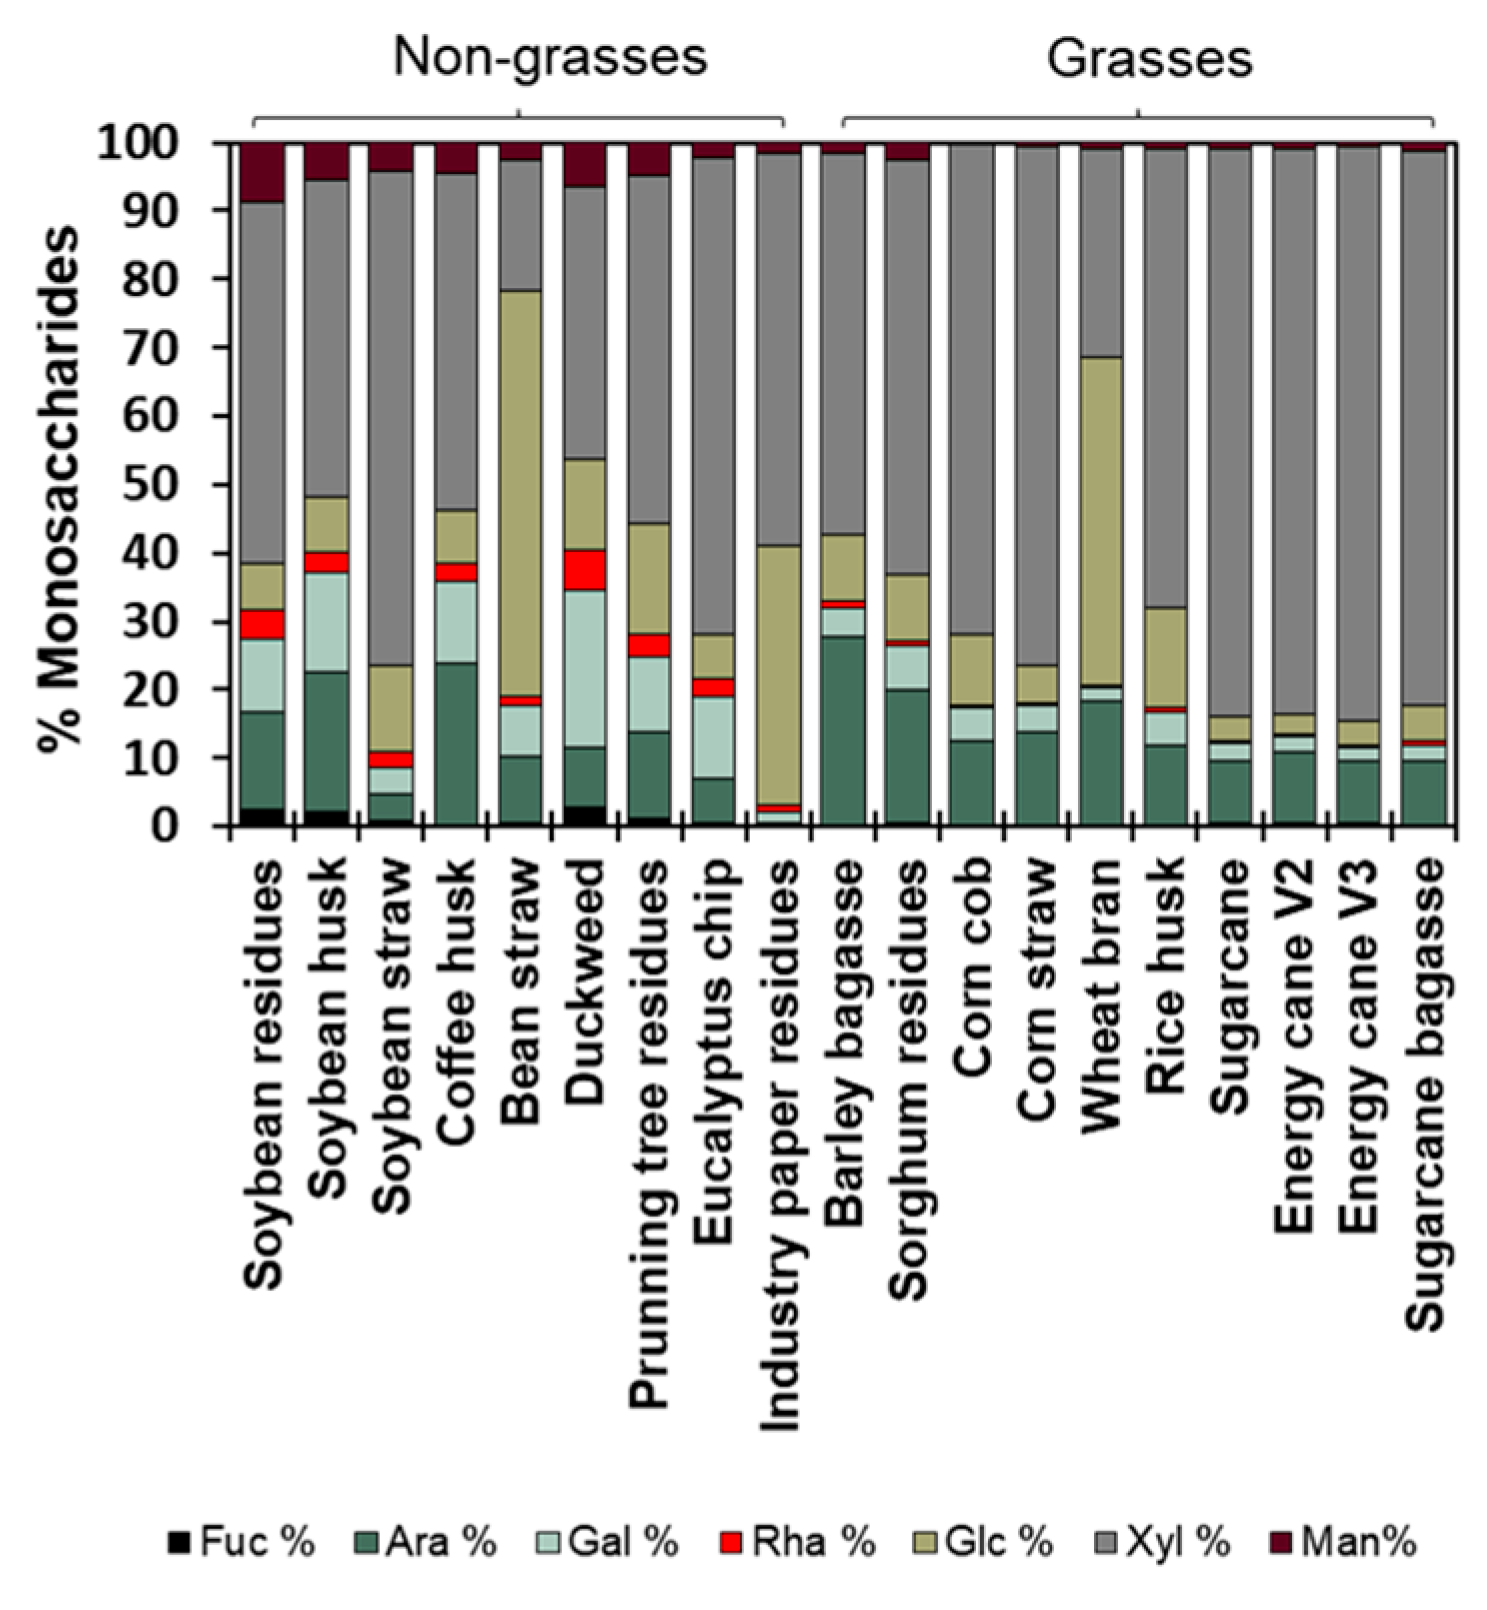
3.3. Fine Composition of the Cell Wall Agro-Wastes

The determination of uronic acid reflects the levels of galacturonic acid from pectin chains and glucuronic acid from certain hemicelluloses, such as arabinoxylan, present in the samples. Non-grass cell wall biomass has a higher pectin composition and, therefore, contains more galacturonic acid (65 μg·mg−1 CW on average) than grass (Type II walls) (44.9 μg·mg−1 CW on average) (Figure 5). Industrial paper residue and soybean husk show lower levels of uronic acid (21.6 μg·mg−1 CW and 14.8 μg·mg−1 CW, respectively) in the non-grass cell walls due to the extractive production phases in the industry (Figure 5). Conversely, eucalyptus chips (52.2 μg·mg−1 CW), pruning tree residue (62.7 μg·mg−1 CW), soybean straw (70.6 μg·mg−1 CW), soybean residue (72.4 μg·mg−1 CW), and duckweed (75.7 μg·mg−1 CW) exhibited medium levels. In contrast, coffee husk (92.5 μg·mg−1 CW) and bean straw (122.8 μg·mg−1 CW) displayed the highest contents (Figure 5). For the grass cell walls, wheat bran (13.6 μg·mg−1 CW) and sugarcane bagasse (15.1 μg·mg−1 CW) had the lowest levels, while rice husk (27.2 μg·mg−1 CW), corn straw (27.4 μg·mg−1 CW), barley bagasse (31.8 μg·mg−1 DW), and sorghum residue (44.3 μg·mg−1 CW) showed medium levels. Corn cob (62.9 μg·mg−1 CW), sugarcane (63.2 μg·mg−1 CW), energy cane V2 (64.6 μg·mg−1 CW), and energy cane V3 (98.6 μg·mg−1 CW) exhibited varying levels (Figure 5).
Figure 6 illustrates the main composition of agro-waste in cell walls. The biomasses representing non-grass walls contained an average of 1.2% fucose, 11.2% arabinose, 10.7% galactose, 2.9% rhamnose, 18.7% glucose, 50.8% xylose, and 4.6% mannose (Figure 6). Bean straw was notably rich in galactose (21.1 μg·mg−1 CW) and glucose (173.8 μg·mg−1 CW) compared to coffee husk, duckweed, pruning tree residue, eucalyptus chips, and industrial paper residues (Supplementary Table S2). Coffee husk and bean straw shared similar proportions of arabinose (about 28 μg·mg−1 CW), while all other non-grass wall waste samples displayed lower proportions (0.2–3.2 μg·mg−1 CW). The eucalyptus chips were xylose-rich (83.1 μg·mg−1 CW), and the cell walls of industrial paper residues comprised 95% xylose (33.3 μg·mg−1 DW) and glucose (21.8 μg·mg−1 CW). Meanwhile, soybean husk demonstrated higher levels of fucose (1.9 μg·mg−1 CW), galactose (19.1 μg·mg−1 CW), and rhamnose (3.8 μg·mg−1 DW) compared to other non-grass walls (Figure 6 and Supplementary Table S2). Duckweed displayed a distinct cell wall composition, marked by significant apiose content in pectin structures (Supplementary Table S2). Grass walls contained approximately 0.2% fucose, 14.1% arabinose, 3.6% galactose, 0.5% rhamnose, 11.4% glucose, 69.2% xylose, and 1% mannose (Figure 6). Barley bagasse and wheat bran were rich in arabinose (100.1 μg·mg−1 CW and 80 μg·mg−1 CW, respectively), while wheat bran had 48.2% glucose in its cell wall (208.7 μg·mg−1 CW) (Figure 6).
Cell wall fractionation enabled the characterization of monosaccharides across polysaccharide classes, facilitating the evaluation of the fine cell wall structure. The ammonium oxalate fraction represents pectins, with Type I walls composed of 80% arabinose (20.9 μg·mg−1), galactose (19.5 μg·mg−1), glucose (20.5 μg·mg−1), and xylose (20.8 μg·mg−1). In the agro-wastes from Type II walls (grasses), these sugars accounted for 90% (Figure 7 and Supplementary Table S3). Arabinose levels were elevated in barley bagasse (40.5 μg·mg−1), galactose was highest in soybean husk (12.6 μg·mg−1) and duckweed (12.4 μg·mg−1), glucose peaked in sugarcane (64 μg·mg−1) and rice husk (62.8 μg·mg−1), and xylose was most abundant in energy cane V3 (76.2 μg·mg−1) compared to the other wastes (Figure 7 and Supplementary Table S3). In grasses, most of the ammonium oxalate fractions comprised arabinoxylan-soluble hemicellulose and beta-glucans, exhibiting high glucose levels.
The sodium chloride fraction consisted of pectin methyl-esterified and soluble hemicelluloses. The non-grass sodium chlorite fractions were rich in xylose (43.5 μg·mg−1), exhibiting higher levels of arabinose (32.3 μg·mg−1), glucose (16.4 μg·mg−1), and galactose (10.4 μg·mg−1). A similar pattern was noted in grass cell walls, with 140.0 μg·mg−1 of xylose, 39.2 μg·mg−1 of arabinose, 19.4 μg·mg−1 of glucose, and 8.1 μg·mg−1 of galactose (Figure 7 and Supplementary Table S3). In both cell wall types, over 70% of the 4M sodium hydroxide fraction (hemicelluloses) was xylose (164.5 and 203.4 μg·mg−1), while the remaining 30% varied in composition among biomass sources (Figure 7 and Supplementary Table S3). Pruning tree residues exhibited elevated levels of glucose (21.5 μg·mg−1), whereas wheat bran had more arabinose (137.3 μg·mg−1).
The cellulose content was assessed through sulfuric acid hydrolysis, comprising 86.6% of the residue fraction (see Figure 7 and Supplementary Table S3 for Glucose II and Residue II). Duckweed and wheat bran displayed lower cellulose contents, at 60% (181.7 μg·mg−1) and 69% (346.2 μg·mg−1), respectively (Figure 7 and Supplementary Table S3—Glc II and Residue II). Non-cellulosic residue fractions from the non-grasses contained 0.2% fucose (0.6 μg·mg−1), 0.2% arabinose (1 μg·mg−1), 0.4% galactose (1 μg·mg−1), 0.2% rhamnose (0.4 μg·mg−1), 7.8% glucose (28.4 μg·mg−1), 2.3% xylose (13.9 μg·mg−1), 0.5% mannose (1.2 μg·mg−1), and 2% apiose (present only in duckweed at 53.9 μg·mg−1). The walls from grasses included 0.1% fucose (0.5 μg·mg−1), 0.3% arabinose (1.3 μg·mg−1), 0.2% galactose (0.7 μg·mg−1), 0.1% rhamnose (0.3 μg·mg−1), 8.5% glucose (38.6 μg·mg−1), 4% xylose (19.5 μg·mg−1), and 0.1% mannose (0.6 μg·mg−1) (see Figure 7 and Supplementary Table S3).

4. Discussion

4.1. Agro-Waste Characterization and Its Potential

Society is moving from a linear economy that disposes of all waste to a circular economy that reuses it [33]. The circular economy has become essential, with biomass playing a pivotal role in fostering a sustainable, low-carbon, and resource-efficient culture. Traditionally, these biomasses have been used for cooking, heating, civil construction, and the paper industry. However, they have recently started being used to produce high-value-added biofuels and bioproducts. Biorefineries enhance the value of these materials, which are rich in cellulose, hemicellulose, and lignin [34].
The cell walls of the evaluated agro-wastes comprised 68% of the biomass. Therefore, the available lignocellulosic material for application is significant. These complex structures have distinct compositions and, consequently, different interactions among the polysaccharides, resulting in a unique architecture. The presence of OH groups in the region from 3340 cm−1 to 2290 cm−1 was identified and attributed to cellulose [35]. The peaks between 800 and 1050 cm−1 were associated with the C-O, C=C, and C-O-C bonds of cellulose, hemicelluloses, and pectins [36,37,38,39]. The FT-IR spectra were consistent across the various cell wall types due to the polysaccharide signatures, but further differences are necessary to fully distinguish the diversity of the biomass (Figure 1).
The high carbon (41.34%) and hydrogen (5.98%) content of the agro-waste (Table 2) indicates significant potential for gasification or liquid biofuel production [40,41]. The higher heating value (HHV) is a critical parameter for fuel quality, as it represents the amount of heat released when one unit weight of the fuel is completely combusted and its products are cooled to 298 K [42]. The HHV for cell walls from non-grasses was 15.24 MJ·Kg−1, while for grasses it was 17.19 MJ·Kg−1 (Table 2). The highest HHV was observed for barley bagasse (18.93 MJ·Kg−1), whereas the lowest was for industrial paper residue (11.76 MJ·Kg−1) (Table 2). Thus, the difference in the samples’ HHV is 38%, which is significant with respect to energy capacity. To evaluate the energy quality of the agro-wastes, thermogravimetric analysis (TGA) was performed, including the mass loss curve as a function of temperature and its derivative. The thermal degradation pattern was similar across all agro-wastes (Figure 2), suggesting comparable behavior of the agro-wastes in a thermal reactor for energy conversion. Two mass loss peaks (600 K and 750 K) were identified, indicating where volatiles pyrolyze and char oxidation occurs, respectively (Figure 2C,D). This corroborates the findings of Krieger Filho et al. [43]. Each of these derivative peaks represents an independent degradation stage associated with a chemical reaction. Consequently, if the mass loss rate’s derivative curve exhibits two peaks, the sample’s decomposition modeling should account for at least two reactions. Understanding the minimal number of reactions necessary to model sample degradation with the mass loss rate data enables any optimization process—whether deterministic or heuristic—to determine the kinetic parameters. Biomass with high cellulose and lignin contents has greater thermal resistance, while those rich in soluble polysaccharides, such as pectin and some hemicelluloses, tend to degrade more readily (Figure 2). Thermal stability denotes the cell wall components’ ability to withstand elevated temperatures without degradation. This can be associated with the efficiency of the saccharification process, despite the maintenance of structural integrity during enzymatic treatment [44,45,46]. This sequential degradation can adversely affect the saccharification capacity, since the breakdown of hemicellulose is often essential for enhancing the accessibility of cellulose for enzymatic action [47]. Therefore, the properties of thermal stability, along with saccharification capacity, dictate the suitability for biofuel production, biomaterial synthesis, and bioenergy generation.
For 2G bioethanol production, the monosaccharides glucose, mannose, galactose, and fucose can be fermented by yeasts and then distilled [48]. The saccharification capacity was greater for industrial paper residue, corn straw, corn cob, soybean husk, and sugarcane (Figure 3), regardless of the fermentable sugar content (Figure 6 and Supplementary Table S2). Therefore, these biomass sources should be utilized more effectively for biofuel production.
The pentoses xylose and arabinose (non-fermentable sugars) constitute 61.9% of the cell walls of non-grasses and 83.3% of the cell walls of grasses in agro-industrial wastes (Figure 6). Therefore, effective cell wall pretreatment is crucial, and pentose must be considered for fermentation to optimize ethanol conversion [49]. Pathways for xylose catabolism have been engineered into yeast lineages to improve the conversion of biomass into ethanol [49,50].

4.2. Cell Wall Components and Their Polysaccharides’ Applications

Cellulose is the most abundant polysaccharide, formed by linear β-1,4-linked glucose, which provides strength to resist turgor pressure, maintain shape, and control cell size [51]. Typically, terrestrial plants contain about 40% cellulose in their cell walls [52]. The agro-industrial wastes with the highest cellulose content include industrial paper residue (46%), eucalyptus chips (40%), soybean husk (39%), energy cane V2 (36%), and sugarcane bagasse (35%) (Figure 4 and Figure 7D, Supplementary Table S1). Therefore, these materials could be utilized in food, cosmetics, biomedical, and pharmaceutical applications [53]. The water absorption capacity of cellulose enables the formation of hydrogels, which are stabilized by ionic interactions and hydrogen bonds [54]. Consequently, cellulose can also serve as an emulsifier, film former, humectant, and anti-aging agent [55].
Hemicellulose and lignin crosslink to the cellulose core. Lignin is a phenolic compound made up of coupled 4-hydroxyphenylpropanoids that provide tissue resistance and protection against pathogens [56]. Lignin acts as a barrier to biofuel production due to its contribution to cell wall resistance [22]. Therefore, the high lignin levels (16 to 22%) in energy cane V2, sorghum residue, sugarcane, eucalyptus chips, sugarcane bagasse, soybean straw, energy cane V3, and pruning tree residue make these materials unsuitable as biomass for biofuel production without lignin removal (Figure 4 and Supplementary Table S1). Conversely, duckweed and bean straw require less processing, despite having a lignin content of around 7% (Figure 4). However, the properties of lignin—including good biocompatibility, low toxicity, and elevated carbon content—enhance its potential for industrial applications as a high-value material [57]. Approximately 50–100 million tons of lignin is produced annually in the pulp and paper industry, with 95% used for energy generation [58,59]. Nevertheless, emerging technologies in green chemistry and biorefinery present promising opportunities. These phenolic compounds can be utilized as hydrogels, resins, carbon fibers, UV shielding, wearable electronics, flocculants, plastic composites, and biomaterials [57]. Furthermore, the catalytic depolymerization and conversion of lignin can yield syngas products (methanol, ethanol, DME, C1-C7 gases, and Fischer–Tropsch liquids), hydrocarbons (benzene, toluene, cyclohexene, and others), phenols (eugenol, cresol, catechol, resorcinol, syringol, coniferol, guaiacol), oxidized products (vanillin, DMSO, aromatic acids, aliphatic acids, aldehydes, quinones, cyclohexanol, syringaldehyde, and β-keto adipate), and macromolecules (pharmaceuticals, binders, composites, adhesives, extenders, fillers, etc.) [60].
Hemicellulose polysaccharides feature an equatorial β-1,4-linked backbone structure that generates various xyloglucans, xylans, mannans, and mixed (β-1,4; β-1,3)-linkage glucans. Xyloglucans consist of a glucose backbone with branches of xylose substituted by galactose, arabinose, and fucose, which are found in land plants, particularly in the primary walls of spermatophytes [9]. This type of hemicellulose predominates in the cell walls of non-grasses [11], as demonstrated by the 4M NaOH fraction composition (Figure 7C and Supplementary Table S3). The levels of glucose and xylose account for 84.4% of the monosaccharide composition in the non-grass walls (Figure 7C and Supplementary Table S3). Xyloglucans exhibit self-aggregating, water-retaining, gel-forming, and adsorption properties, making them useful in wound dressings, mucosal protection, and ocular lubrication [61]. Additionally, xyloglucan is widely utilized as an additive in food and cosmetics, due to its thickening and stabilizing properties [62].
The characteristics of grass walls feature arabinoxylan as the primary hemicellulose [11]. Arabinoxylan belongs to the xylan group, which has a backbone of β-1,4-xylose with substitutions of α-1,2-glucuronosyl and 4-O-glucuronosyl residues, resulting in glucuronoxylans. When arabinose is attached to the O-2 and O-3 positions of the xylan chain, the polysaccharide is referred to as arabinoxylan or glucuronoarabinoxylan [9]. Among the cell walls of grasses, wheat bran has a 1:1 ratio of arabinose to xylose (Figure 7C and Supplementary Table S3). Arabinose constitutes 14%, while xylose accounts for 73% of the 4M NaOH fractions of the cell walls from grasses (Figure 7C). The arabinoxylans from corn, wheat, and sorghum exhibit high viscosity and can therefore be utilized in the food industry as emulsifiers and gelling agents [63]. Furthermore, arabinoxylans can form hydrogels and aerogels, serving as drug delivery systems [64]. Other applications of arabinoxylans include sunscreen, cement, oral granules, packaging, and treatments for osteoarthritis [65].
The hemicellulose with a β-1,4-mannose backbone is found in mannans and galactomannans (which have branches with galactose), whereas a non-repeating pattern of mannose and glucose exists in glucomannans and galactoglucomannans [9]. The monosaccharide mannose was detected in all fractions, with a greater concentration in the 4M fraction (Figure 7C). Mannose comprised 7% of the cell walls from non-grasses, surpassing the percentages found in soybean residue, bean straw, soybean husk, pruning tree residue, and soybean straw (Figure 7C and Supplementary Table S3). In contrast, the walls from grasses contained only 1% mannose (Figure 7C and Supplementary Table S3). Galactomannans and glucomannans are non-toxic and can thus be utilized in the food, pharmaceutical, biomedical, cosmetics, and textile industries. One of their main applications in food includes gel formation, coating, stiffeners, viscosity modifiers, and stabilizers [66].
A hemicellulose unique to grasses is β-glucan. This polysaccharide is formed through the linkage of glucose units via β-1,3 and β-1,4 bonds. Despite its solubility and crosslinking with other polysaccharides, the glucose level detected in all fractions of the integrated cell wall was 11%. In the ammonium oxalate fraction, the glucose levels reached 26%, while in sodium chlorite, 10%, and in 4M NaOH, 9%, based on analyses from sugarcanes, barley, sorghum, corn, wheat, and rice (Type II cell walls) (Figure 7). These polysaccharides may be prebiotics due to their effects on reducing glycemic levels and serum cholesterol, managing diabetes, controlling cardiovascular diseases, fighting cancer, aiding in hypertension, and promoting wound healing [67]. Additionally, β-glucan can be applied in the food industry for thickening, stabilizing, emulsifying, and gelation, similar to pectins and galactomannans [68].
Pectins are complex polysaccharides with a homogalacturonan backbone made of galacturonic acid, which is modified to create rhamnogalacturonan Type I, rhamnogalacturonan Type II, xylogalacturonan, and apiogalacturonan [8]. The concentration of pectins is 14% in Type I and 9% in Type II (see Figure 4 and Supplementary Table S1). The uronic acid dosages shown in Figure 5 assess the galacturonic and glucuronic acid contents in the different biomass cell walls. As expected, cell wall Type I shows a 31% higher uronic acid content, particularly in coffee husk and bean straw (Figure 5). The agro-waste categorized as Type II primary cell walls ranges from 44.9 to 98.6 μg·mg−1 CW (Figure 5). The pectin composition reveals a high abundance of arabinogalactans (arabinose and galactose), while non-grass walls contain greater amounts of rhamnose (Figure 7A,B). Among the examined agro-wastes, duckweeds have distinct pectins, apiogalacturonans, and xylogalacturonans that consist of galacturonic acid backbones with O-2 and O-3 branches formed by apiose and xylose [8]. Apiose was detected in all duckweed cell wall fractions, and the overall cell wall composition was found to represent 44.7% of the total composition (Supplementary Table S3). Carbohydrates containing apiose are widely used in biotechnology for defense and resistance against stresses, as well as in dermatological preparations, sunscreen, and emulsification bases [69,70,71,72,73]. The primary pectins found in plants are homogalacturonans (~65%) and rhamnogalacturonan Type I (~35%) [8]. The monosaccharide compositions illustrated in Figure 7A,B support these polymer findings. Pectins are a low-cost, highly available polysaccharide commonly used in food (as gelling, thickening, stabilizing, and emulsifying agents), cosmetics (for stability and rheological properties), pharmaceuticals (for drug delivery, gene delivery, wound healing, cholesterol reduction, tissue engineering, synthetic membranes, and anticancer activities), biopolymers (films and packaging), and as adsorbents in effluent treatments [74]. Despite the diverse cell wall compositions, the pectin content and profile of duckweed, bean straw, soybean residue, soybean husk, and wheat bran suggest that these pectins can enhance the valorization of agro-industrial residues and support the applications described above.
The diversity and unique composition of each cell wall agro-waste defines strategies for the efficient and sustainable reuse of polysaccharides. Cellulose and hemicelluloses from grasses support the development of biodegradable films, drug delivery systems, and biofuels [53]. At the same time, the complex pectins from non-grasses and duckweed enable innovations in the food, pharmaceutical, and cosmetics industries [72,74]. Once considered waste, lignin-rich residues are now recognized as sources of valuable aromatic monomers, hydrogels, carbon fibers, and advanced functional materials [57,60].
Principal component analysis (PCA) revealed apparent compositional differences among the evaluated agro-industrial residues (Figure 8), with non-grasses and grasses grouped distinctly. The first two principal components (PC1 and PC2) accounted for 25.7% and 13.2% of the total variance, respectively. Grasses were clustered on the positive side of PC1 (opposite to non-grasses), driven by higher lignin content, xylan-derived residues (e.g., vectors in Figure 8B: Xyl-4M, Xyl-AmOx, Xyl-Chlo), and greater saccharification potential. In contrast, non-grass residues—including woody and soft tissues—were associated with negative PC1 loadings, reflecting higher levels of uronic acids, galactose, rhamnose, and fucose, indicative of a pectin-rich matrix. PC2 explained the data concerning the varying side-chain glucosides in pectins and soluble hemicellulose. The primary positive contributor from PC2 that distinguished the wastes was Residue, which separated the bagasse from the other waste compositions. Sugarcane bagasse, barley bagasse, and corn cob have fewer residues and a higher presence of galactose and xylose in the residue, along with arabinose in the AmmOX and chlorite cell wall fractions.
Sugarcanes exhibited elevated xylose levels in the 4M NaOH and sodium chlorite fractions, similar to sorghum and rice. Corn showed higher glucose levels in the 4M NaOH and residue, while wheat contained more arabinose. Bean straw was clustered near the rhamnose in the ammonium oxalate fraction, and duckweed, despite its contents of pectin, rhamnose, and apiose exhibiting distinct characteristics as well. The wood biomasses also had elevated glucose levels. However, industrial paper residue displayed a lower lignin content (Figure 8 and Supplementary Table S3), yet in PC1 it was closer to grasses, primarily due to its xylose content and higher saccharification compared to other non-grass wastes. These results underscore the influence of taxonomic origin and cell wall composition on the selection of downstream processing for effective targeted valorization strategies.
The PCA and biochemical analyses highlight the compositional differences among the nineteen agro-wastes, driven by xylans, pectins, and lignin (Figure 4, Figure 6, and Figure 8). These structural distinctions are directly linked to the saccharification potential and thermal behavior of each biomass type (Figure 3). The cell wall composition shapes processing by favoring pectin-rich wastes, such as duckweed and bean straw, for food, pharmaceutical, or cosmetics applications, or lignin and cellulose-rich wastes, like sugarcane and corn, for biofuel and biomaterial production, which can enhance economic viability and resource efficiency (Figure 4 and Figure 7) [57,68,74,75]. These results support policy frameworks that prioritize the valorization of specific feedstocks, optimize the utilization of local residues, and minimize waste. By integrating the knowledge from this work, small biorefineries can diversify their product portfolios, reduce processing costs, and contribute more effectively to circular bioeconomy goals and climate mitigation efforts.

5. Conclusions

Understanding the structural and compositional basis of agro-wastes enables the strategic selection and processing of residues for specific value-added by-product applications. This integrative approach enhances the economic feasibility of biorefinery operations and promotes circular economy principles by transforming underutilized agricultural by-products into sustainable solutions for health, materials, and energy sectors. The distinction between the cell wall composition of grasses and non-grasses reveals that non-grasses contain more pectins, mannans, and xyloglucans, making them more suitable for food, cosmetics, and pharmaceutical applications due to the thickening, gelling, and stabilizing properties of these polysaccharides. Conversely, Type II cell walls are rich in cellulose, β-glucan, and lignin, serving as food, prebiotics, biomaterials, and syngas by-products, as well as applications such as gelling, wound dressings, lowering glycemic levels and cholesterol, and providing resistance properties. Therefore, exploring this potential is urgent, as it may significantly impact sustainability.

Supplementary Materials

The following supporting information can be downloaded at https://www.mdpi.com/article/10.3390/su17146362/s1: Figure S1: Correlation analysis of elemental composition and high heating value (HHV); Table S1: Cell wall extractive composition of agro-wastes; Table S2: Non-cellulosic monosaccharides composition from the intact cell wall; Table S3: Monosaccharides composition of cell wall fractions.

Author Contributions

D.P., A.G. and M.S.B. planned and designed the experiments. D.P. and A.G. performed the laboratory analyses. M.d.L.T.d.M.P. provided the biomass. A.d.C.J. and A.R.A. performed the FT-IR analysis and interpretation. H.H.V. and G.C.K.F. performed the HHM and TGA analyses. D.P. and A.G. analyzed the data. D.P., A.G. and M.S.B. wrote the original draft, reviewed it, and edited it. All authors have read and agreed to the published version of the manuscript.

Funding

This research was funded by the Instituto Nacional de Ciência e Tecnologia do Bioetanol-INCT do Bioetanol, grant numbers FAPESP 2014/50884-5 and CNPq 465319/2014-9; and the Centro de Pesquisa e Inovação de Gases de Efeito Estufa—RCGI/Shell/FUSP 371055 (FAPESP/Shell 2020/15230-5). A.G. (FAPESP 2019/13936-0) appreciates the fellowship.

Institutional Review Board Statement

Not applicable.

Informed Consent Statement

Not applicable.

Data Availability Statement

The original contributions presented in this study are included in the article/Supplementary Material. Further inquiries can be directed to the corresponding author.

Conflicts of Interest

The authors declare no conflicts of interest. The funders had no role in the design of the study; in the collection, analyses, or interpretation of data; in the writing of the manuscript; or in the decision to publish the results.

References

  1. HLPE High Level Panel of Experts. Nutrition and Food Systems. Comm. World Food Secur. (CFS) 2017, 44, 150. [Google Scholar]
  2. de Coninck, H.; Revi, A.; Babiker, M.; Bertoldi, P.; Buckeridge, M.; Cartwright, A.; Dong, W.; Ford, J.; Fuss, S.; Hourcade, J.C.; et al. Strenthening and Implementing the Global Response. In Global Warming of 1.5 °C: Summary for Policy Makers; IPCC—The Intergovernmental Panel on Climate Change: Geneva, Switzerland, 2018; pp. 313–443. [Google Scholar]
  3. Mishra, A.; Kumar, M.; Medhi, K. Biomass Energy with Carbon Capture and Storage (BECCS). In Current Developments in Biotechnology and Bioengineering: Sustainable Bioresources for the Emerging Bioeconomy; Elsevier: Amsterdam, The Netherlands, 2020; pp. 399–427. ISBN 9780444643094. [Google Scholar]
  4. Martinez-Burgos, W.J.; Bittencourt Sydney, E.; Bianchi Pedroni Medeiros, A.; Magalhães, A.I.; de Carvalho, J.C.; Karp, S.G.; Porto de Souza Vandenberghe, L.; Junior Letti, L.A.; Thomaz Soccol, V.; de Melo Pereira, G.V.; et al. Agro-Industrial Wastewater in a Circular Economy: Characteristics, Impacts and Applications for Bioenergy and Biochemicals. Bioresour. Technol. 2021, 341, 125795. [Google Scholar] [CrossRef]
  5. Mancini, S.D.; de Medeiros, G.A.; Paes, M.X.; de Oliveira, B.O.S.; Antunes, M.L.P.; de Souza, R.G.; Ferraz, J.L.; Bortoleto, A.P.; de Oliveira, J.A.P. Circular Economy and Solid Waste Management: Challenges and Opportunities in Brazil. Circ. Econ. Sustain. 2021, 1, 261–282. [Google Scholar] [CrossRef]
  6. Yang, N.-H.N.; Bertassini, A.C.; Mendes, J.A.J.; Gerolamo, M.C. The ‘3CE2CE’ Framework—Change Management Towards a Circular Economy: Opportunities for Agribusiness. Circ. Econ. Sustain. 2021, 1, 697–718. [Google Scholar] [CrossRef]
  7. Verbančič, J.; Lunn, J.E.; Stitt, M.; Persson, S. Carbon Supply and the Regulation of Cell Wall Synthesis. Mol. Plant 2017, 11, 75–94. [Google Scholar] [CrossRef] [PubMed]
  8. Mohnen, D. Pectin Structure and Biosynthesis. Curr. Opin. Plant Biol. 2008, 11, 266–277. [Google Scholar] [CrossRef]
  9. Scheller, H.V.; Ulvskov, P. Hemicelluloses. Annu. Rev. Plant Biol. 2010, 61, 263–289. [Google Scholar] [CrossRef]
  10. Maleki, S.S.; Mohammadi, K.; Ji, K. Characterization of Cellulose Synthesis in Plant Cells. Sci. World J. 2016, 2016, 8641373. [Google Scholar] [CrossRef]
  11. Carpita, N.C.; Gibeaut, D.M. Structural Models of Primary Cell Walls in Flowering Plants: Consistency of Molecular Structure with the Physical Properties of the Walls during Growth. Plant J. 1993, 3, 1–30. [Google Scholar] [CrossRef]
  12. Silva, G.B.; Ionashiro, M.; Carrara, T.B.; Crivellari, A.C.; Tiné, M.A.S.S.; Prado, J.; Carpita, N.C.; Buckeridge, M.S. Cell Wall Polysaccharides from Fern Leaves: Evidence for a Mannan-Rich Type III Cell Wall in Adiantum raddianum. Phytochemistry 2011, 72, 2352–2360. [Google Scholar] [CrossRef]
  13. McCann, M.C.; Roberts, K. Changes in Cell Wall Architecture during Cell Elongation. J. Exp. Bot. 1994, 45, 1683–1691. [Google Scholar] [CrossRef]
  14. de Souza, A.P.; Leite, D.C.C.; Pattathil, S.; Hahn, M.G.; Buckeridge, M.S. Composition and Structure of Sugarcane Cell Wall Polysaccharides: Implications for Second-Generation Bioethanol Production. Bioenergy Res. 2013, 6, 564–579. [Google Scholar] [CrossRef]
  15. McCann, M.C.; Carpita, N.C. Designing the Deconstruction of Plant Cell Walls. Curr. Opin. Plant Biol. 2008, 11, 314–320. [Google Scholar] [CrossRef] [PubMed]
  16. Sarkar, P.; Bosneaga, E.; Auer, M. Plant Cell Walls throughout Evolution: Towards a Molecular Understanding of Their Design Principles. J. Exp. Bot. 2009, 60, 3615–3635. [Google Scholar] [CrossRef]
  17. Saini, J.K.; Saini, R.; Tewari, L. Lignocellulosic Agriculture Wastes as Biomass Feedstocks for Second-Generation Bioethanol Production: Concepts and Recent Developments. 3 Biotech 2015, 5, 337–353. [Google Scholar] [CrossRef]
  18. Ashokkumar, V.; Venkatkarthick, R.; Jayashree, S.; Chuetor, S.; Dharmaraj, S.; Kumar, G.; Chen, W.H.; Ngamcharussrivichai, C. Recent Advances in Lignocellulosic Biomass for Biofuels and Value-Added Bioproducts—A Critical Review. Bioresour. Technol. 2022, 344, 126195. [Google Scholar] [CrossRef] [PubMed]
  19. Dahmen, N.; Lewandowski, I.; Zibek, S.; Weidtmann, A. Integrated Lignocellulosic Value Chains in a Growing Bioeconomy: Status Quo and Perspectives. GCB Bioenergy 2019, 11, 107–117. [Google Scholar] [CrossRef]
  20. Singh, A.T.; Sharma, M.; Sharma, M.; Dutt Sharma, G.; Kumar Passari, A.; Bhasin, S. Valorization of Agro-Industrial Residues for Production of Commercial Biorefinery Products. Fuel 2022, 322, 124284. [Google Scholar] [CrossRef]
  21. Chapple, C.; Carpita, N. Plant Cell Walls as Targets for Biotechnology. Curr. Opin. Plant Biol. 1998, 1, 179–185. [Google Scholar] [CrossRef]
  22. Cesarino, I.; Araújo, P.; Domingues, A.P.; Mazzafera, P. An Overview of Lignin Metabolism and Its Effect on Biomass Recalcitrance. Braz. J. Bot. 2012, 35, 303–311. [Google Scholar] [CrossRef]
  23. ASTM D2974; Standard Test Methods for Determining the Water (Moisture) Content, Ash Content, and Organic Material of Peat and Other Organic Soils. ASTM: Philadelphia, PA, USA, 1987.
  24. Basu, P. Biomass Gasification, Pyrolysis and Torrefaction: Practical Design and Theory; Academic Press: Cambridge, MA, USA, 2013; pp. 1–530. [Google Scholar] [CrossRef]
  25. Van Acker, R.; Vanholme, R.; Storme, V.; Mortimer, J.C.; Dupree, P.; Boerjan, W. Lignin Biosynthesis Perturbations Affect Secondary Cell Wall Composition and Saccharification Yield in Arabidopsis thaliana. Biotechnol. Biofuels 2013, 6, 46. [Google Scholar] [CrossRef]
  26. Fukushima, R.S.; Kerley, M.S. Use of Lignin Extracted from Different Plant Sources as Standards in the Spectrophotometric Acetyl Bromide Lignin Method. J. Agric. Food Chem. 2011, 59, 3505–3509. [Google Scholar] [CrossRef] [PubMed]
  27. Fukushima, R.S.; Kerley, M.S.; Ramos, M.H.; Porter, J.H.; Kallenbach, R.L. Comparison of Acetyl Bromide Lignin with Acid Detergent Lignin and Klason Lignin and Correlation with in Vitro Forage Degradability. Anim. Feed. Sci. Technol. 2015, 201, 25–37. [Google Scholar] [CrossRef]
  28. Chang, X.F.; Chandra, R.; Berleth, T.; Beatson, R.P. Rapid, Microscale, Acetyl Bromide-Based Method for High-Throughput Determination of Lignin Content in Arabidopsis thaliana. J. Agric. Food Chem. 2008, 56, 6825–6834. [Google Scholar] [CrossRef]
  29. Carpita, N.C. Fractionation of Hemicelluloses from Maize Cell Walls with Increasing Concentrations of Alkali. Phytochemistry 1984, 23, 1089–1093. [Google Scholar] [CrossRef]
  30. Gorshkova, T.A.; Wyatt, S.E.; Salnikov, V.V.; Gibeaut, D.M.; Lozovaya, V.V.; Carpita, N.C.; Ibragimov, R. Cell-Wall Polysaccharides of Developing Flax Plants. Plant Physiol. 1996, 110, 721–729. [Google Scholar] [CrossRef] [PubMed]
  31. Filisetti-Cozzi, T.M.C.C.; Carpita, N.C. Measurement of Uronic Acids without Interference from Neutral Sugars. Anal. Biochem. 1991, 197, 157–162. [Google Scholar] [CrossRef]
  32. Gomez, L.D.; Whitehead, C.; Barakate, A.; Halpin, C.; McQueen-Mason, S.J. Automated Saccharification Assay for Determination of Digestibility in Plant Materials. Biotechnol. Biofuels 2010, 3, 23. [Google Scholar] [CrossRef]
  33. Leong, H.Y.; Chang, C.K.; Khoo, K.S.; Chew, K.W.; Chia, S.R.; Lim, J.W.; Chang, J.S.; Show, P.L. Waste Biorefinery towards a Sustainable Circular Bioeconomy: A Solution to Global Issues. Biotechnol. Biofuels 2021, 14, 87. [Google Scholar] [CrossRef]
  34. Usmani, Z.; Sharma, M.; Karpichev, Y.; Pandey, A.; Chandra Kuhad, R.; Bhat, R.; Punia, R.; Aghbashlo, M.; Tabatabaei, M.; Gupta, V.K. Advancement in Valorization Technologies to Improve Utilization of Bio-Based Waste in Bioeconomy Context. Renew. Sustain. Energy Rev. 2020, 131, 109965. [Google Scholar] [CrossRef]
  35. Kumar, A.; Singh Negi, Y.; Choudhary, V.; Kant Bhardwaj, N. Characterization of Cellulose Nanocrystals Produced by Acid-Hydrolysis from Sugarcane Bagasse as Agro-Waste. J. Mater. Phys. Chem. 2014, 2, 1–8. [Google Scholar] [CrossRef]
  36. Fávaro, S.L.; Lopes, M.S.; Vieira de Carvalho Neto, A.G.; Rogério de Santana, R.; Radovanovic, E. Chemical, Morphological, and Mechanical Analysis of Rice Husk/Post-Consumer Polyethylene Composites. Compos. Part A Appl. Sci. Manuf. 2010, 41, 154–160. [Google Scholar] [CrossRef]
  37. Mondal, M.I.H.; Yeasmin, M.S.; Rahman, M.S. Preparation of Food Grade Carboxymethyl Cellulose from Corn Husk Agrowaste. Int. J. Biol. Macromol. 2015, 79, 144–150. [Google Scholar] [CrossRef] [PubMed]
  38. Shehzad, M.; Asghar, A.; Ramzan, N.; Aslam, U.; Bello, M.M. Impacts of Non-Oxidative Torrefaction Conditions on the Fuel Properties of Indigenous Biomass (Bagasse). Waste Manag. Res. 2020, 38, 1284–1294. [Google Scholar] [CrossRef] [PubMed]
  39. Silva, T.P.; Ferreira, A.N.; de Albuquerque, F.S.; de Almeida Barros, A.C.; da Luz, J.M.R.; Gomes, F.S.; Pereira, H.J.V. Box–Behnken Experimental Design for the Optimization of Enzymatic Saccharification of Wheat Bran. Biomass Convers. Biorefin. 2022, 12, 5597–5604. [Google Scholar] [CrossRef]
  40. Shamsul, N.S.; Kamarudin, S.K.; Rahman, N.A. Study on the Physical and Chemical Composition of Agro Wastes for the Production of 5-Hydroxymethylfurfural. Bioresour. Technol. 2018, 247, 821–828. [Google Scholar] [CrossRef]
  41. Antolini, D.; Piazzi, S.; Menin, L.; Baratieri, M.; Patuzzi, F. High Hydrogen Content Syngas for Biofuels Production from Biomass Air Gasification: Experimental Evaluation of a Char-Catalyzed Steam Reforming Unit. Int. J. Hydrogen Energy 2022, 47, 27421–27436. [Google Scholar] [CrossRef]
  42. Majumder, A.K.; Jain, R.; Banerjee, P.; Barnwal, J.P. Development of a New Proximate Analysis Based Correlation to Predict Calorific Value of Coal. Fuel 2008, 87, 3077–3081. [Google Scholar] [CrossRef]
  43. Krieger Filho, G.C.; Costa, F.; Torraga Maria, G.F.; Bufacchi, P.; Trubachev, S.; Shundrina, I.; Korobeinichev, O. Kinetic Parameters and Heat of Reaction for Forest Fuels Based on Genetic Algorithm Optimization. Thermochim. Acta 2022, 713, 179228. [Google Scholar] [CrossRef]
  44. Saccani, A.; Sisti, L.; Manzi, S.; Fiorini, M. PLA Composites Formulated Recycling Residuals of the Winery Industry. Polym. Compos. 2019, 40, 1378–1383. [Google Scholar] [CrossRef]
  45. Gulsunoglu-Konuskan, Z.; Kilic-Akyilmaz, M. Microbial Bioconversion of Phenolic Compounds in Agro-Industrial Wastes: A Review of Mechanisms and Effective Factors. J. Agric. Food Chem. 2022, 70, 6901–6910. [Google Scholar] [CrossRef]
  46. El-Ramady, H.; Brevik, E.C.; Bayoumi, Y.; Shalaby, T.A.; El-Mahrouk, M.E.; Taha, N.; Elbasiouny, H.; Elbehiry, F.; Amer, M.; Abdalla, N.; et al. An Overview of Agro-Waste Management in Light of the Water-Energy-Waste Nexus. Sustainability 2022, 14, 15717. [Google Scholar] [CrossRef]
  47. Grandis, A.; Leite, D.C.C.; Tavares, E.Q.P.; Arenque-Musa, B.C.; Gaiarsa, J.W.; Martins, M.C.M.; de Souza, A.P.; Gomez, L.D.; Fabbri, C.; Mattei, B.; et al. Cell Wall Hydrolases Act in Concert during Aerenchyma Development in Sugarcane Roots. Ann. Bot. 2019, 124, 1067–1089. [Google Scholar] [CrossRef] [PubMed]
  48. van Maris, A.J.A.A.; Abbott, D.A.; Bellissimi, E.; van den Brink, J.; Kuyper, M.; Luttik, M.A.H.H.; Wisselink, H.W.; Scheffers, W.A.; van Dijken, J.P.; Pronk, J.T. Alcoholic Fermentation of Carbon Sources in Biomass Hydrolysates by Saccharomyces Cerevisiae: Current Status. Antonie Leeuwenhoek 2006, 90, 391–418. [Google Scholar] [CrossRef]
  49. Moysés, D.N.; Reis, V.C.B.; de Almeida, J.R.M.; de Moraes, L.M.P.; Torres, F.A.G. Xylose Fermentation by Saccharomyces Cerevisiae: Challenges and Prospects. Int. J. Mol. Sci. 2016, 17, 207. [Google Scholar] [CrossRef]
  50. Cunha, J.T.; Soares, P.O.; Romaní, A.; Thevelein, J.M.; Domingues, L. Xylose Fermentation Efficiency of Industrial Saccharomyces Cerevisiae Yeast with Separate or Combined Xylose Reductase/Xylitol Dehydrogenase and Xylose Isomerase Pathways. Biotechnol. Biofuels 2019, 12, 20. [Google Scholar] [CrossRef] [PubMed]
  51. Saxena, I.M.; Brown, R.M. Cellulose Biosynthesis: Current Views and Evolving Concepts. Ann. Bot. 2005, 96, 9–21. [Google Scholar] [CrossRef]
  52. Ge, X.; Zhang, N.; Phillips, G.C.; Xu, J. Growing Lemna Minor in Agricultural Wastewater and Converting the Duckweed Biomass to Ethanol. Bioresour. Technol. 2012, 124, 485–488. [Google Scholar] [CrossRef]
  53. Liu, J.; Willför, S.; Xu, C. A Review of Bioactive Plant Polysaccharides: Biological Activities, Functionalization, and Biomedical Applications. Bioact. Carbohydr. Diet. Fibre 2015, 5, 31–61. [Google Scholar] [CrossRef]
  54. Palantöken, S.; Bethke, K.; Zivanovic, V.; Kalinka, G.; Kneipp, J.; Rademann, K. Cellulose Hydrogels Physically Crosslinked by Glycine: Synthesis, Characterization, Thermal and Mechanical Properties. J. Appl. Polym. Sci. 2020, 137, 48380. [Google Scholar] [CrossRef]
  55. Seddiqi, H.; Oliaei, E.; Honarkar, H.; Jin, J.; Geonzon, L.C.; Bacabac, R.G.; Klein-Nulend, J. Cellulose and Its Derivatives: Towards Biomedical Applications. Cellulose 2021, 28, 1893–1931. [Google Scholar] [CrossRef]
  56. Liu, Q.; Luo, L.; Zheng, L. Lignins: Biosynthesis and Biological Functions in Plants. Int. J. Mol. Sci. 2018, 19, 335. [Google Scholar] [CrossRef] [PubMed]
  57. Ma, C.; Kim, T.H.; Liu, K.; Ma, M.G.; Choi, S.E.; Si, C. Multifunctional Lignin-Based Composite Materials for Emerging Applications. Front. Bioeng. Biotechnol. 2021, 9, 708976. [Google Scholar] [CrossRef] [PubMed]
  58. Aro, T.; Fatehi, P. Production and Application of Lignosulfonates and Sulfonated Lignin. ChemSusChem 2017, 10, 1861–1877. [Google Scholar] [CrossRef]
  59. Fabbri, F.; Bischof, S.; Mayr, S.; Gritsch, S.; Jimenez Bartolome, M.; Schwaiger, N.; Guebitz, G.M.; Weiss, R. The Biomodified Lignin Platform: A Review. Polymers 2023, 15, 1694. [Google Scholar] [CrossRef]
  60. Schutyser, W.; Renders, T.; Van Den Bossche, G.; Van Den Bosch, S.; Koelewijn, S.-F.; Ennaert, T.; Sels, B.F. Catalysis in Lignocellulosic Biorefineries: The Case of Lignin Conversion. In Nanotechnology Catalysis; Wiley-VCH Verlag GmbH & Co.: Weinheim, Germany, 2017; pp. 537–584. [Google Scholar]
  61. Esquena-Moret, J. A Review of Xyloglucan: Self-Aggregation, Hydrogel Formation, Mucoadhesion and Uses in Medical Devices. Macromol 2022, 2, 562–590. [Google Scholar] [CrossRef]
  62. Mishra, A.; Malhotra, A.V. Tamarind Xyloglucan: A Polysaccharide with Versatile Application Potential. J. Mater. Chem. 2009, 19, 8528–8536. [Google Scholar] [CrossRef]
  63. Yan, J.; Jia, X.; Feng, L.; Yadav, M.; Li, X.; Yin, L. Rheological and Emulsifying Properties of Arabinoxylans from Various Cereal Brans. J. Cereal Sci. 2019, 90, 102844. [Google Scholar] [CrossRef]
  64. González-Estrada, R.; Calderón-Santoyo, M.; Carvajal-Millan, E.; De Jesús Ascencio Valle, F.; Ragazzo-Sánchez, J.A.; Brown-Bojorquez, F.; Rascón-Chu, A. Covalently Cross-Linked Arabinoxylans Films for Debaryomyces hansenii Entrapment. Molecules 2015, 20, 11373–11386. [Google Scholar] [CrossRef]
  65. He, H.J.; Qiao, J.; Liu, Y.; Guo, Q.; Ou, X.; Wang, X. Isolation, Structural, Functional, and Bioactive Properties of Cereal Arabinoxylan—A Critical Review. J. Agric. Food Chem. 2021, 69, 15437–15457. [Google Scholar] [CrossRef]
  66. Singh, S.; Singh, G.; Arya, S.K. Mannans: An Overview of Properties and Application in Food Products. Int. J. Biol. Macromol. 2018, 119, 79–95. [Google Scholar] [CrossRef] [PubMed]
  67. Yoo, H.-D.; Kim, D.; Paek, S.-H.; Oh, S.-E. Plant Cell Wall Polysaccharides as Potential Resources for the Development of Novel Prebiotics. Biomol. Ther. 2012, 20, 371–379. [Google Scholar] [CrossRef]
  68. Singla, A.; Gupta, O.P.; Sagwal, V.; Kumar, A.; Patwa, N.; Mohan, N.; Ankush; Kumar, D.; Vir, O.; Singh, J.; et al. Beta-Glucan as a Soluble Dietary Fiber Source: Origins, Biosynthesis, Extraction, Purification, Structural Characteristics, Bioavailability, Biofunctional Attributes, Industrial Utilization, and Global Trade. Nutrients 2024, 16, 900. [Google Scholar] [CrossRef] [PubMed]
  69. Beck, E.; Hopf, H. Branched-Chain Sugars and Sugar Alcohols. Methods Plant Biochem. 1990, 2, 235–289. [Google Scholar] [CrossRef]
  70. Eckey-Kaltenbach, H.; Heller, W.; Sonnenbichler, J.; Zetl, I.; Schäfer, W.; Ernst, D.; Sandermann, H. Oxidative Stress and Plant Secondary Metabolism: 6″-O-Malonylapiin in Parsley. Phytochemistry 1993, 34, 687–691. [Google Scholar] [CrossRef]
  71. Mølhøj, M.; Verma, R.; Reiter, W.D. The Biostnthesis of the Branched-Chain Sugar D-Apiose in Plants: Functional Cloning and Characterization of a UDP-D-Apiose/UDP-D-Xylose Synthase from Arabidopsis. Plant J. 2003, 35, 1781–1791. [Google Scholar] [CrossRef]
  72. Pičmanová, M.; Møller, B.L. Apiose: One of Nature’s Witty Games. Glycobiology 2016, 26, 430–442. [Google Scholar] [CrossRef]
  73. Zanutto, F.V.; Boldrin, P.K.; Varanda, E.A.; De Souza, S.F.; Sano, P.T.; Vilegas, W.; Dos Santos, L.C. Characterization of Flavonoids and Naphthopyranones in Methanol Extracts of Paepalanthus chiquitensis Herzog by HPLC-ESI-IT-MSn and Their Mutagenic Activity. Molecules 2012, 18, 244–262. [Google Scholar] [CrossRef]
  74. Freitas, C.M.P.; Coimbra, J.S.R.; Souza, V.G.L.; Sousa, R.C.S. Structure and Applications of Pectin in Food, Biomedical, and Pharmaceutical Industry: A Review. Coatings 2021, 11, 922. [Google Scholar] [CrossRef]
  75. Buckeridge, M.S.; de Souza, A.P. Breaking the “Glycomic Code” of Cell Wall Polysaccharides May Improve Second-Generation Bioenergy Production from Biomass. Bioenergy Res. 2014, 7, 1065–1073. [Google Scholar] [CrossRef]
Figure 1. Infrared spectra of different agro-industrial wastes.
Sustainability 17 06362 g001
Figure 2. TGA of thermal degradation and its mass derivatives of different agro-waste products’ cell walls: (A) TGA of non-grasses cell walls. (B) TGA of grasses’ cell walls. (C) Mass fraction derivative over the temperature of non-grass cell walls. (D) Mass fraction derivative over the temperature of grass cell walls. The TGA of thermal degradation was normalized by mass over the temperature of the oxidative atmosphere.
Sustainability 17 06362 g002
Figure 3. Saccharification capacity of different agro-waste products’ cell walls: Data represented by the percentage average ± std error (n = 5). Different letters are statistically significant among biomasses according to ANOVA one-way with Tukey’s test (p < 0.05). Water-blue represents the data from non-grasses walls, and brownish-green represents the data from grass walls. The sugarcane residues levels are highlighted in orange.
Sustainability 17 06362 g003
Figure 4. Relative percentages of cell wall composition: (A) Data summary from the non-grasses’ walls. (B) Data summary from the grasses’ walls (Type II). (C) Cell wall composition of sugarcane cell walls. (D) Cell wall composition of different agro-wastes. Data represented by the percentage average ± std error (n = 5). The pectins fraction represents the results obtained from ammonium oxalate extraction, pectins + soluble hemicelluloses represent the results obtained from the sodium chlorite extraction, hemicelluloses represent those obtained from the sodium hydroxide extraction, and cellulose represents the residue from the fractionation process. The values and statistics can be found in Supplementary Table S1.
Sustainability 17 06362 g004
Figure 5. Uronic acid levels in 19 distinct agro-wastes. Data represented by the percentage average ± std error (n = 5). Different letters are statistically significant among biomasses compared according to ANOVA, one-way with Tukey’s post hoc test (p < 0.05). Water-blue represents the data from Type I cell walls and brownish-green and orange represents the data from Type II cell walls. The sugarcane residues levels are highlighted in orange.
Sustainability 17 06362 g005
Figure 6. Non-cellulosic monosaccharides composition from the intact cell walls. Data represented by percentage the average ± std error (n = 5). The values (μg sugar·mg cell wall−1) and statistics can be found in Supplementary Table S1.
Sustainability 17 06362 g006
Figure 7. Cell wall fractions’ monosaccharides: (A) Monosaccharides composition from the pectin (ammonium oxalate) fraction. (B) Monosaccharides composition from the pectins + soluble hemicelluloses (sodium chloride) fraction. (C) Monosaccharides composition from hemicelluloses (sodium hydroxide) fraction. (D) Monosaccharides composition strongly attached to the cellulose (residue) fraction. Data represented by the percentage average ± std error (n = 5). The absolute values (μg sugar·mg) and statistics can be found in Supplementary Table S2.
Sustainability 17 06362 g007
Figure 8. Principal component analysis of different biomasses’ cell wall characterization: (A) The centroid separation corresponds to the cell wall characterization of 19 biomasses in the plane by the first and second main components (PC1 and PC2). Percentage values in parentheses show the proportion of the variance explained by each axis. (B) Plot of PC1 and PC2 loading vectors, describing the relationship between the variables of the cell wall compounds. The variables analyzed were lignin, saccharification percentage, and monosaccharide composition of the cell walls (fucose, arabinose, galactose, glucose, xylose, and mannose), fractions (ammonium oxalate—AmnOX, sodium chlorite—Chlo, 4M NaOH—4M, and residue—R), and uronic acids.
Sustainability 17 06362 g008
Table 1. Selected agro-wastes that were characterized in terms of their cell wall composition.
Agro-WasteSpeciesLocation
Non-grassesSoybean residuesGlycine max var IAC Foscarin 31Instituto Agrônomico de Campinas
Soybean huskGlycine maxRibeirão Preto-SP
Soybean strawGlycine maxMaringá, PR
Coffee huskCoffeaRibeirão Preto-SP
Bean strawPhaseolus vulgarisRibeirão Preto-SP
DuckweedLemna minor 8627Rutgers Duckweed Stock Cooperative
Prunning tree residues-University of São Paulo
Eucalyptus chipEucalyptusSuzano papel e celulose
Industry paper residues-Suzano papel e celulose
GrassesBarley bagasseHordeum vulgareBrewery Colorado, Ribeirão Preto-SP
Sorghum residuesSorghum bicolorEmbrapa
Corn cobZea maysRibeirão Preto-SP
Corn strawZea maysRibeirão Preto-SP
Wheat branTriticumRibeirão Preto-SP
Rice huskOryza sativaRibeirão Preto-SP
SugarcaneSaccharum sp 80-3280Piracicaba-SP
Energy cane V2SaccharumPiracicaba-SP
Energy cane V3SaccharumPiracicaba-SP
Sugarcane bagasseSaccharumGuarani-São Paulo-SP
Table 2. Elemental composition and higher heating value (HHV) of different agro-industrial waste products. Data represented by the average ± std error (n = 3). Different letters are statistically significant among biomasses compared according to ANOVA one-way with Tukey’s post hoc test (p < 0.05). Industrial paper residue was not evaluated, despite the composition of the residue being mainly cellulose.
C%H%N%O%Ashes %HHV [MJ·Kg−1]
Soybean residues39.87±0.21cd5.84±0.07be1.82±0.16ef43.68±0.26ac8.79±0.06cd16.07±0.04de
Soybean husk41.52±0.28efg6.43±0.08fgh2.11±0.03fg46.90±0.42bcd3.05±0.24ab17.12±0.22egi
Soybean straw43.22±0.19ghi6.12±0.08cdeg0.50±0.04bd45.93±0.22ad4.23±0.09abc17.45±0.15fgi
Coffee husk41.81±0.36efg6.00±0.07beg1.60±0.03e47.14±0.77bcd3.46±0.37abc16.69±0.28eg
Bean straw37.57±0.15bc5.59±0.06b1.87±0.02ef47.54±0.60cd7.44±0.51bd14.60±0.17bc
Duckweed36.33±0.38b5.64±0.07bc3.68±0.07i44.41±0.18ad9.94±0.33de14.47±0.16bc
Pruning tree residues42.95±0.12gh5.76±0.03bd0.83±0.05d47.37±1.07cd4.13±0.10abc16.80±0.11eg
Eucalyptus chip36.14±0.51b4.71±0.20a0.38±0.02bc41.12±3.96a17.65±4.35fg13.54±0.39b
Industrial paper residues32.33±0.06a4.41±0.02a0.00±0.00a41.26±0.16a21.99±0.21g11.76±0.05a
Barley bagasse45.74±0.83j6.69±0.10h3.01±0.12h41.40±0.36a3.17±0.75ab19.46±0.42j
Sorghum residues39.03±0.38cd5.67±0.11bd1.99±0.13fg49.20±0.25d4.12±0.31abc15.10±0.26cd
Corn cob43.01±0.05gh5.96±0.13bef0.39±0.04bc48.53±0.95cd2.11±0.78ab16.97±0.24egh
Corn straw41.95±0.34fg6.04±0.12beg0.72±0.04cd49.32±0.77d1.98±0.81ab16.60±0.27ef
Wheat bran40.54±0.16df6.49±0.02gh2.32±0.03g47.48±0.20cd3.18±0.35ab16.79±0.05eg
Rice husk37.61±0.31bc5.58±0.03b0.40±0.05bc41.82±0.29ab14.60±0.37ef15.06±0.14cd
Sugarcane44.98±0.68hj6.29±0.20eh0.38±0.05bc47.49±0.34cd1.35±0.14a18.17±0.09i
Energy cane V245.20±0.17ij6.14±0.04cdeg0.23±0.04ab47.78±0.19cd0.66±0.26a18.05±0.09hi
Energy cane V344.36±0.78hj6.16±0.09deg0.24±0.05ab48.51±0.49cd0.73±0.18a17.71±0.22gi
Sugarcane bagasse44.63±0.11hj6.28±0.05eh0.34±0.01ab47.37±0.14cd1.39±0.06a18.04±0.07hi
p-value0.0000.0000.0000.0000.0000.000
Disclaimer/Publisher’s Note: The statements, opinions and data contained in all publications are solely those of the individual author(s) and contributor(s) and not of MDPI and/or the editor(s). MDPI and/or the editor(s) disclaim responsibility for any injury to people or property resulting from any ideas, methods, instructions or products referred to in the content.

