1. Introduction
The term ‘ecosystem services’ refers to the various beneficial functions that humans derive from ecosystems [
1]. These include provisioning services, such as the provision of food and water resources; regulating services, such as climate regulation; cultural services, such as spirituality and cultural values; and supporting services, such as nutrient cycling. These services are fundamental to human survival and development and are at the core of global sustainable development. However, as the processes of globalization accelerate and industrialization and population growth continue, ecosystems are under unprecedented pressure. The prevalence of environmental issues, including biodiversity loss, climate change, and land degradation, is escalating at an alarming rate [
2]. These issues pose a grave threat to the stability and functional integrity of ecosystems, consequently impacting pivotal ecosystem services such as food security, water supply, and climate regulation. This, in turn, has profound ramifications for the sustainable development of human society [
3,
4]. Arid and semi-arid regions represent a significant component of terrestrial ecosystems, encompassing approximately 41% of the global land area [
5]. The scarcity of water resources and the presence of sandy soil in these regions render the ecosystems therein extremely fragile and vulnerable to the impacts of climate change and human activities. As a typical arid and semi-arid region in northern China, Inner Mongolia is characterized by significant ecosystem vulnerability, and the stability of ecosystem functions is facing unprecedented challenges under the dual impacts of climate change and human activities. Research has indicated that the challenges posed by the degradation of grasslands, the expansion of desertification, and the diminution of water conservation capacity within the region have resulted in a systematic threat to ecological security [
6]. It is important to note that in the context of natural conditions characterized by low vegetation cover, scarce precipitation, and frequent droughts, wind erosion has emerged as a pivotal factor endangering the ecological security of the region, with its repercussions extending even to neighboring regions.
In order to address the issue of ecosystem degradation, the government has systematically promoted a number of major ecological restoration projects in Inner Mongolia over the past two decades [
7]. The implementation of ecological restoration initiatives has been demonstrated to exert a direct or indirect influence on the functioning of ecosystem services. This influence is characterized by the long-term or cyclical utilization and management of land. On the one hand, the implementation of ecological projects such as “Returning Farmland to Forests and Grasslands (RFFG)” has promoted a shift in land use towards higher vegetation productivity. Since the year 2000, the government has widely implemented the policy of returning farmland to forest and grassland in areas such as the Jungar Banner and the Maowusu desert [
8] in Inner Mongolia and has carried out measures such as fly-seeding afforestation and artificial afforestation. These initiatives have led to a substantial increase in the area covered by grasslands and forests in the region, thereby effectively enhancing vegetation cover and ecosystem productivity. Conversely, the government has proactively implemented a series of management measures designed to rectify damaged or degraded ecosystems and facilitate their reconstruction or restoration to their original state. Since 2011, the government has adopted a series of policies in the northern foothills of the Yinshan Mountains with the objective of optimizing the carrying capacity of grasslands and livestock and enhancing the productivity of grassland ecosystems [
9]. Specific measures have been implemented to enhance the ecological and economic sustainability of the eight grassland pastoral areas. These measures include the implementation of grazing bans and no-tillage replanting policies, and the provision of grazing ban subsidies and related subsidies to enhance herders’ production capacity [
10]. Furthermore, the effects of these measures demonstrate significant spatial and temporal heterogeneity, which is contingent on regional characteristics and the time course of the measures [
11].
The majority of contemporary assessments of ecological restoration initiatives concentrate on a solitary ecosystem type (e.g., forests), which frequently results in regional biases in the outcomes. Indeed, enhancements in one ecosystem type are frequently accompanied by deterioration in others. For instance, research has demonstrated that large-scale afforestation in water-scarce arid zones may intensify the pressure on available water resources, resulting in low survival rates of planted trees and the degradation of surrounding grassland vegetation [
12]. Consequently, over-reliance on afforestation as a means of restoring ecosystem services in arid and semi-arid regions is a potentially hazardous strategy. In this context, a quantitative analysis of the impacts of climate change and human activities, especially different modes of human activities (e.g., land conversion and enhanced management) on ecosystem services can help to clarify the driving mechanisms [
13], provide a basis for scientific layout, strategy optimization and effect assessment of ecological restoration, and provide support for enhancing ecosystem climate resilience and achieving precise governance, which has important application value.
The principal methods employed for the quantification of the impacts of climate change and human activities on ecosystem services are the indicator system method, the model difference method, the scenario simulation method, the economic value assessment method, and the residual trend method. The indicator system method is predicated on the acquisition of indicator data through field monitoring and remote sensing interpretation [
14]. This is a static assessment, and dynamic changes and long-term effects are difficult to capture. The model difference method is a scientific approach that aims to distinguish between climate change and human activities. This is achieved by establishing differences between ecosystem services simulated by identifying climate models and those simulated by ecological remote sensing models [
15]. This method is more suitable for large-scale studies, and at the regional scale, there is greater uncertainty in the assessment results [
16]. The scenario modeling approach is predicated on the premise that there exists a distinction between climate change and anthropogenic contributions [
17], and this is achieved by assuming differences between actual and modeled services under different scenarios (constant human activity, considering only climate change impacts, or constant climatic conditions, considering only human activity). The method is contingent on physical models with climate and anthropogenic factors present, and its applicability is somewhat limited. It is evident that economic valuation methods are typically utilized to monetize ecosystem services. However, it should be noted that these methods have the potential to underestimate long-term or hidden benefits and are subject to spatial and temporal heterogeneity in value transformations [
18]. The residual trend method is a scientific approach that quantifies the relative contributions of climate change and human activities to ecosystem change. This method establishes a linear relationship between the indicator and the meteorological factor and calculates the residuals (i.e., the actual value minus the predicted value) between the observed value and the value fitted to the model [
19]. The climate change contribution is the part explained by the fitted trend of the meteorological factors, and the anthropogenic contribution is reflected by the trend of the residual series. This method is characterized by its computational simplicity and consistent performance, and it has been extensively employed in studies across various regions and scales [
20,
21].
This study aims to quantitatively disentangle the relative effects of climate change, land conversion, and ecological management on four key ecosystem services in Inner Mongolia from 2001 to 2020. The primary contributions are outlined as follows: Firstly, the contributions of climate change and human activities to four ecosystem service factors (carbon sequestration, hydrological regulation, soil and water conservation, and windbreak and sand fixation) in Inner Mongolia were quantified for each year from 2001 to 2020 using residual trend analysis. Secondly, with regard to the eventual changes in ecosystem services over the entire study period, the anthropogenic contribution component was further decomposed into two categories: land conversion (defined as a change in land cover type) and management measures (characterized as no change in land cover type). This approach was utilized to quantify the impacts of these two types of activities on ecosystem services in Inner Mongolia. Finally, the responses of the various ecosystem types to land conversion and management measures were analyzed. The results of the study are of considerable theoretical value and practical significance for the advancement of regional ecological management and restoration and the realization of sustainable development of regional ecosystems.
3. Results
3.1. Contribution of Climate Change and Human Activities to Annual Ecosystem Services
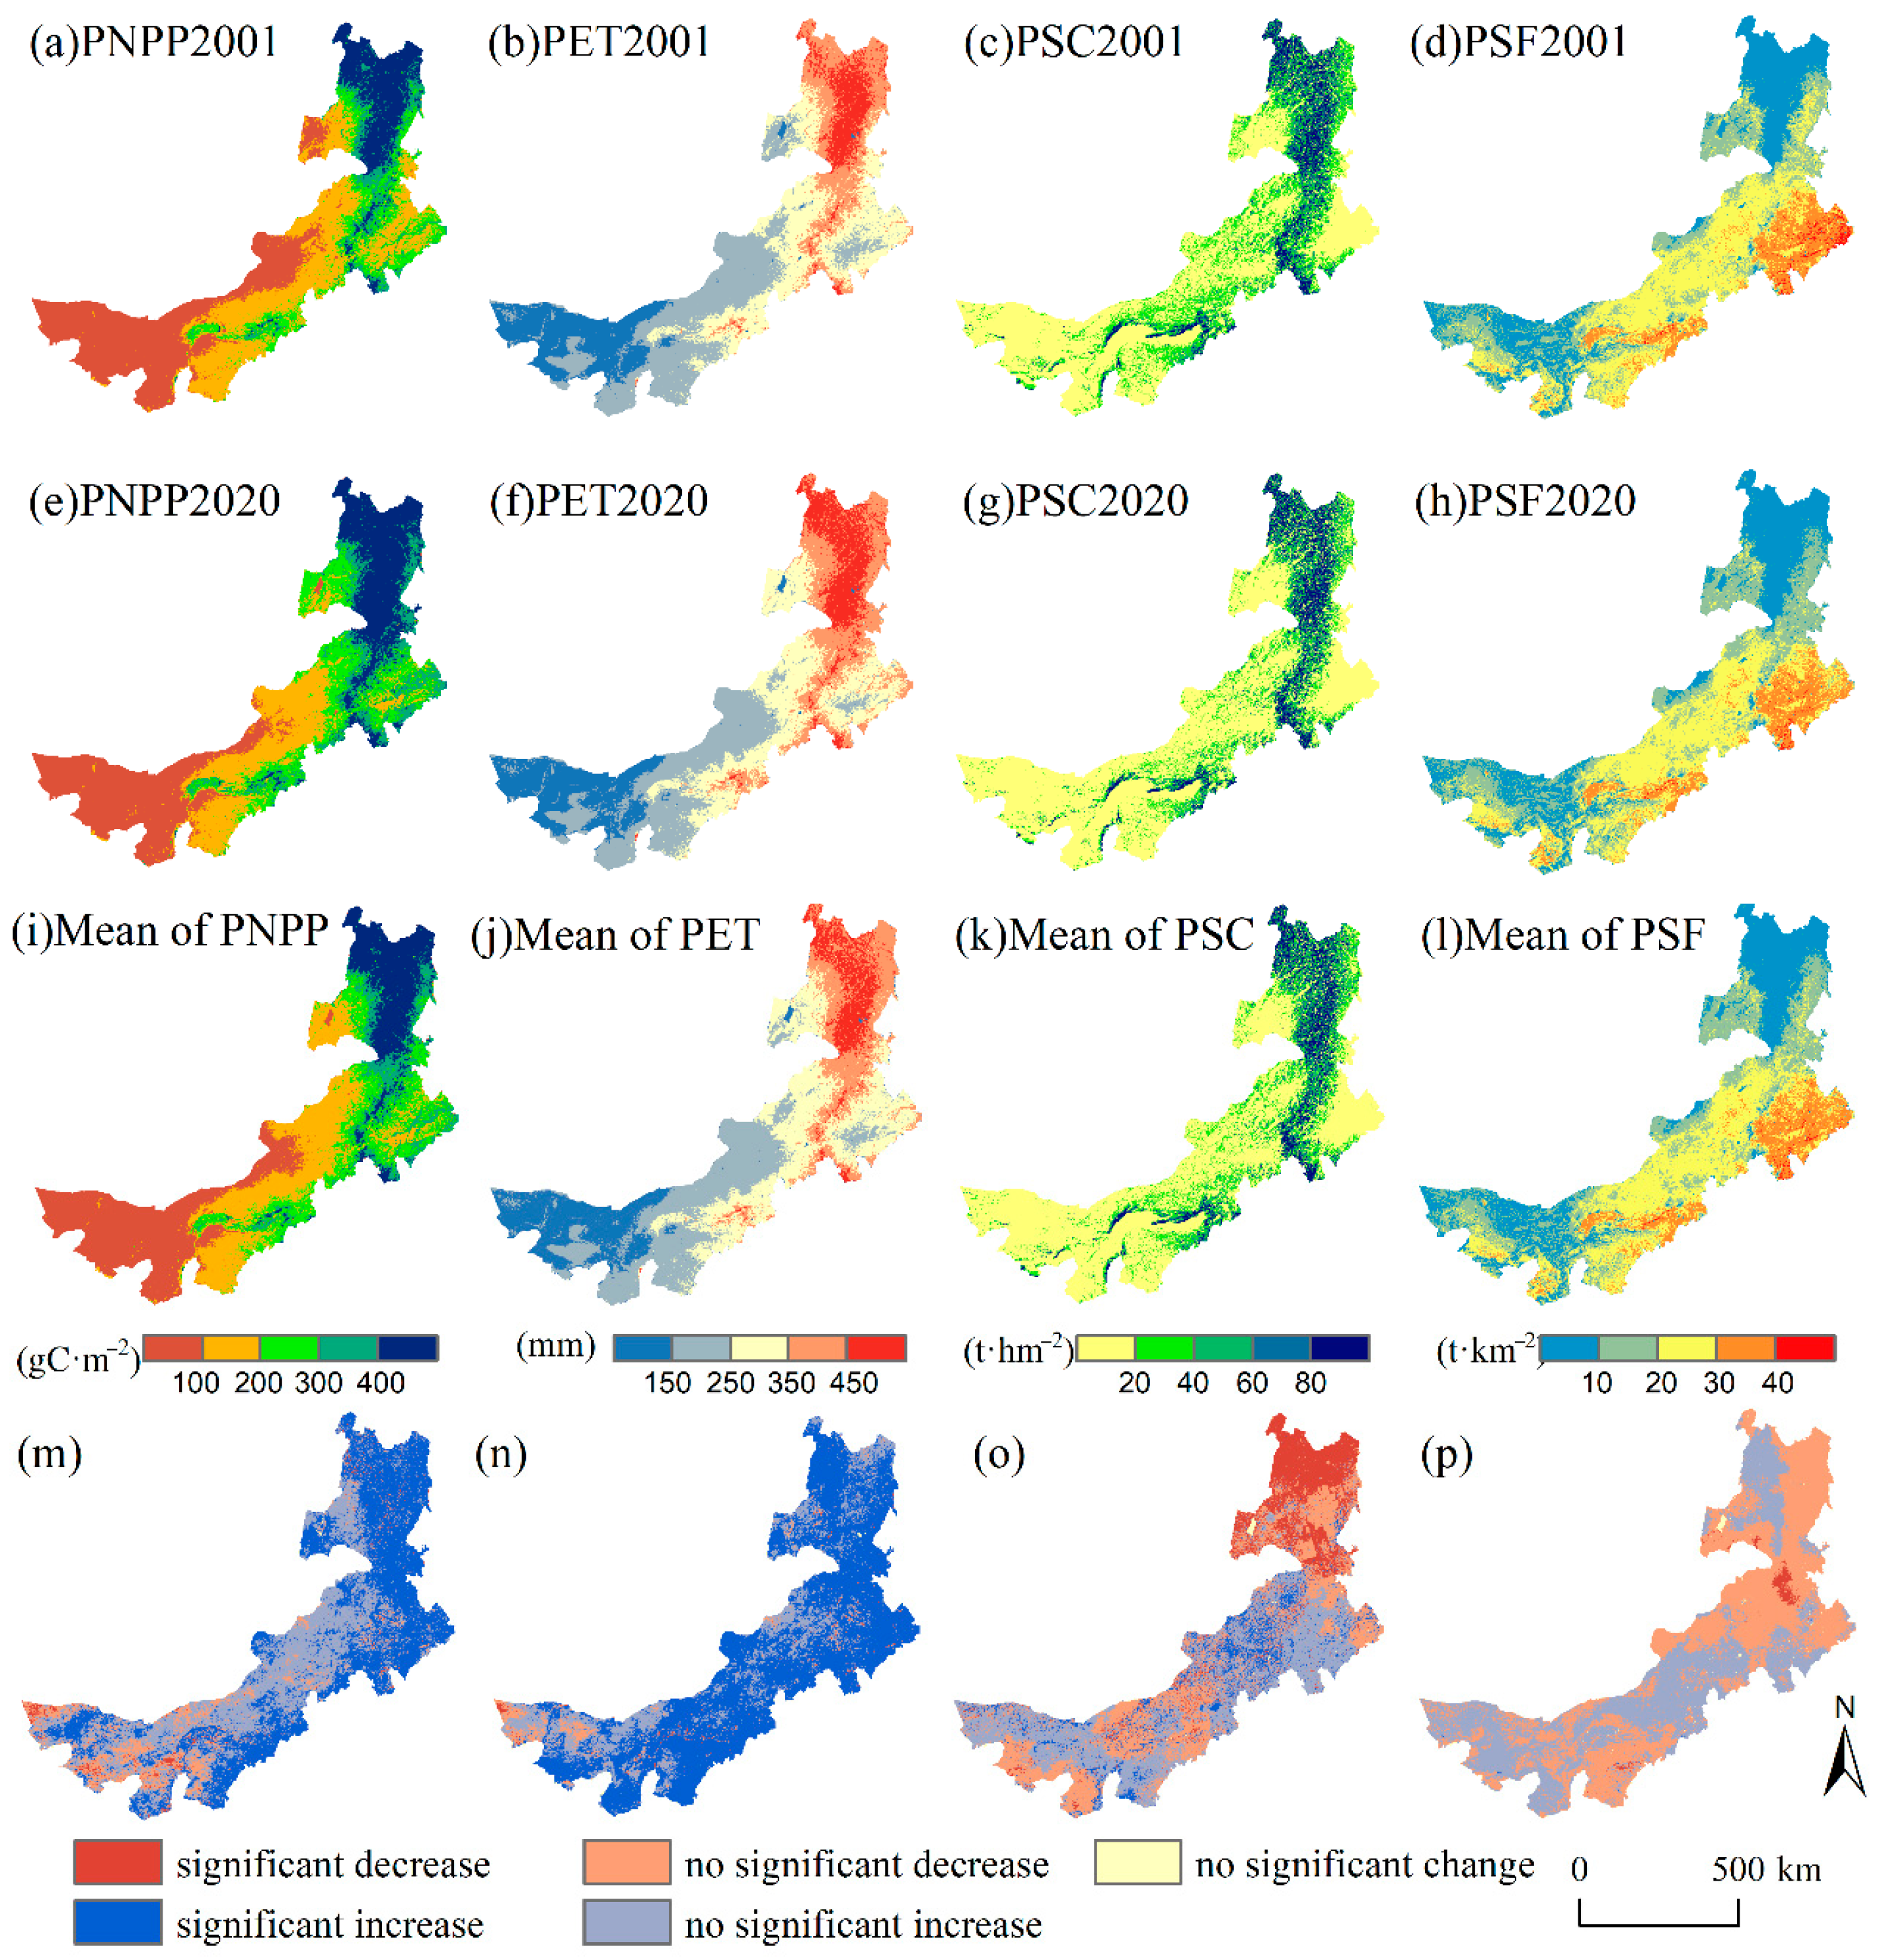
Figure 3 illustrates the spatial distribution patterns of four ecosystem service indicators—carbon sequestration (PNPP), hydrological regulation (PET), soil conservation (PSC), and sand fixation (PSF)—under the influence of climate change. These include the values for the years 2001 (
Figure 3a–d) and 2020 (
Figure 3e–h), the 20-year mean (
Figure 3i–l), and the trends over the study period (
Figure 3m–p). Overall, the spatial distribution of climate-induced ecosystem service contributions remained relatively stable over time. Both single-year observations and long-term averages consistently revealed similar geographical patterns. Specifically, PNPP, PET, and PSC generally exhibited a decreasing gradient from the northeast to the southwest, whereas PSF demonstrated a decline from the southeast to the northwest. These spatial gradients appear to be influenced by underlying environmental and land cover heterogeneity, with particularly marked variability in ecotonal regions such as the forest–grassland transition zones in the northeast.
Based on interannual data from 2001 to 2020, the average values of the four services driven by climate change were calculated as follows: PNPP at 218.09 gC·m
−2, PET at 276.65 mm, PSC at 32.72 t·hm
−2, and PSF at 18.19 t·km
−2. The interannual trends (
Figure 3m–p) demonstrate notable spatial heterogeneity across the study region. During the two-decade period, climate change significantly enhanced carbon sequestration and hydrological regulation services, while it exerted a predominantly negative impact on soil conservation and sand fixation capacities. More specifically, areas experiencing an increase in PNPP accounted for 87.85% of the total region, indicating a widespread enhancement of carbon uptake, particularly pronounced in the northeastern regions. For PET, climate-driven increases were observed in the vast majority of the study area, with only small, scattered patches in the western region showing a decreasing trend—these accounted for less than 5% of the total area. In contrast, although increases and decreases in PSC were relatively balanced in terms of areal extent, the declines were predominantly significant, resulting in an overall downward trend. Similarly, PSF exhibited a net decline during the study period, with areas of significant reduction (53.58%) exceeding those of increase (45.66%). These results underscore the spatially divergent effects of climate change on different ecosystem services and highlight the need for region-specific management strategies to mitigate adverse impacts and promote service sustainability.
Figure 4 illustrates the spatial distribution patterns of four ecosystem service indicators—carbon sequestration (HNPP), hydrological regulation (HET), soil conservation (HSC), and sand fixation (HSF)—under the influence of human activities. The maps include values for the years 2001 (
Figure 4a–d) and 2020 (
Figure 4e–h), 20-year averages (
Figure 4i–l), and interannual trends over the study period (
Figure 4m–p). Overall, the influence of human activities on ecosystem services exhibits pronounced spatial heterogeneity. In contrast to the relatively stable distribution patterns induced by climate change, the effects of anthropogenic disturbances vary significantly across years, with some areas even showing opposite trends. For instance, in 2001, human activities increased NPP by 13.43 gC·m
−2, whereas by 2020, they resulted in a net reduction of 5.45 gC·m
−2. In comparison, the impacts on the other three services demonstrated relatively consistent directional trends between the two years: HET increased by 6.98 mm in 2001 and 0.34 mm in 2020, and HSF increased by 0.50 t·km
−2 and 0.96 t·km
−2, while HSC decreased by 0.11 t·hm
−2 and 0.35 t·hm
−2, respectively. Nevertheless, regional disparities were still evident, particularly in the central grassland areas where contrasting patterns emerged.
Over the entire period from 2001 to 2020, the average net effects of human activities on the four services were relatively limited: 0.08 gC·m
−2 for HNPP, −0.03 mm for HET, 0.01 t·hm
−2 for HSC, and 0.02 t·km
−2 for HSF. These findings suggest that while human activities can exert substantial short-term effects on ecosystem services, such effects tend to be transient and unstable in the long term. The interannual trends (
Figure 4m–p) further reveal substantial spatial variability, with most areas experiencing a non-significant downward trend. Specifically, declining trends were observed across 70.77% of the study area for HNPP, 75.98% for HET, 64.97% for HSC, and 75.98% for HSF. In contrast, the proportion of areas with increasing trends was relatively low, accounting for 29.23%, 24.02%, 34.03%, and 23.68%, respectively. These results highlight the episodic and localized nature of anthropogenic impacts on ecosystem services as well as the challenges in attributing long-term net effects solely to human activities.
To further disentangle the drivers of ecosystem service dynamics, the relative contributions of climate change and human activities were quantified for NPP, ET, SC, and SF from 2001 to 2020 (
Table 2). Overall, climate change was identified as the dominant factor influencing ecosystem services across all years and service types, while the contribution of human activities remained relatively minor but varied temporally and spatially. The 20-year average contributions of climate change to the four services were 97.01%, 98.66%, 99.55%, and 95.40%, respectively, while the corresponding contributions of human activities were 2.99%, 1.34%, 0.45%, and 4.60%, respectively. Specifically, the contribution of climate change to NPP exceeded 90% in most years, with the highest in 2003 (99.92%) and a relative low in 2008 (93.31%), indicating some fluctuation in anthropogenic influence. For ET, the dominance of climate change was more consistent, often exceeding 98%, except for 2003 and 2018 when human activity contributions rose slightly (3.31% and 3.08%, respectively). Soil conservation (SC) exhibited the highest climate-driven proportion among all services, with values consistently above 97.9% across the entire period and reaching nearly complete dominance (>99.9%) in certain years (e.g., 2006, 2010, and 2011). This suggests that soil conservation was the least sensitive to human-induced changes over the past two decades. Sand fixation (SF), on the other hand, demonstrated relatively higher and more variable human activity influence. In particular, anthropogenic contributions peaked in 2010 (14.28%), 2014 (10.86%), and 2012 (8.34%), likely reflecting land use or vegetation management changes during those years. Nevertheless, climate change still accounted for the majority of the variation in SF, with an average contribution above 95% over the study period. In summary, while climate change has consistently been the primary driver of changes in ecosystem services, the role of human activities—though secondary—should not be overlooked, especially in specific years and regions where its impact was more pronounced.
3.2. Contribution of Management Measures and Land Conversion to Changes in Ecosystem Services
3.2.1. Land Use/Cover Change in IM
As demonstrated in
Table 3, this study examined the spatial dynamics of major land use/cover types in Inner Mongolia during the period 2001–2020. It is evident that the extent of grassland, forest land, and cropland has increased, whilst the area of desert has decreased to a considerable extent. This is indicative of significant alterations in the regional land use structure over the past two decades. A comparison of the various land use types reveals that the most significant change was in cropland, which exhibited a net increase of 9355.25 km
2. The total area of expansion of cropland was 21,150.75 km
2, the majority of which was attributable to the conversion of grassland, which accounted for 21,014.75 km
2 of this total. Simultaneously, the area of arable land diminished by 11,795.50 km
2, predominantly attributable to the reversion of arable land to grassland (10,550.75 km
2). This finding indicates the presence of a two-way conversion relationship between grassland and cropland.
During the study period, the area of grassland increased by 6649.50 km2, with the additional area of 41,292.50 km2 being primarily converted from desert (54.58%) and cropland (25.55%). The total area of grassland underwent a decrease of 34,643 km2, primarily due to its conversion from cropland (60.66%) and woodland (35.89%). This observation underscores the pivotal regulatory function of grassland in mediating the interplay between ecological restoration and agricultural development within the region. The area of forest land increased by 5318.75 km2 with an additional area of 13,644.50 km2, primarily from grassland. Simultaneously, the forest area diminished by 8325.75 km2. Conversely, the area of deserts has undergone significant contraction, with a total area reduction of 21,323.50 km2, primarily attributable to the transformation of desert regions into grasslands. This development signifies a substantial advancement in the region with regard to sand fixation and ecological restoration. Inner Mongolia has witnessed a land use change characterized by the continuous expansion of arable land, the gradual recovery of grassland and woodland, and the significant reduction of desert area over the past two decades. This change is indicative of the comprehensive driving effect of regional ecological management, agricultural development, and land resource restructuring.
3.2.2. Impacts of Management Measures and Land Conversion on Ecosystem Services
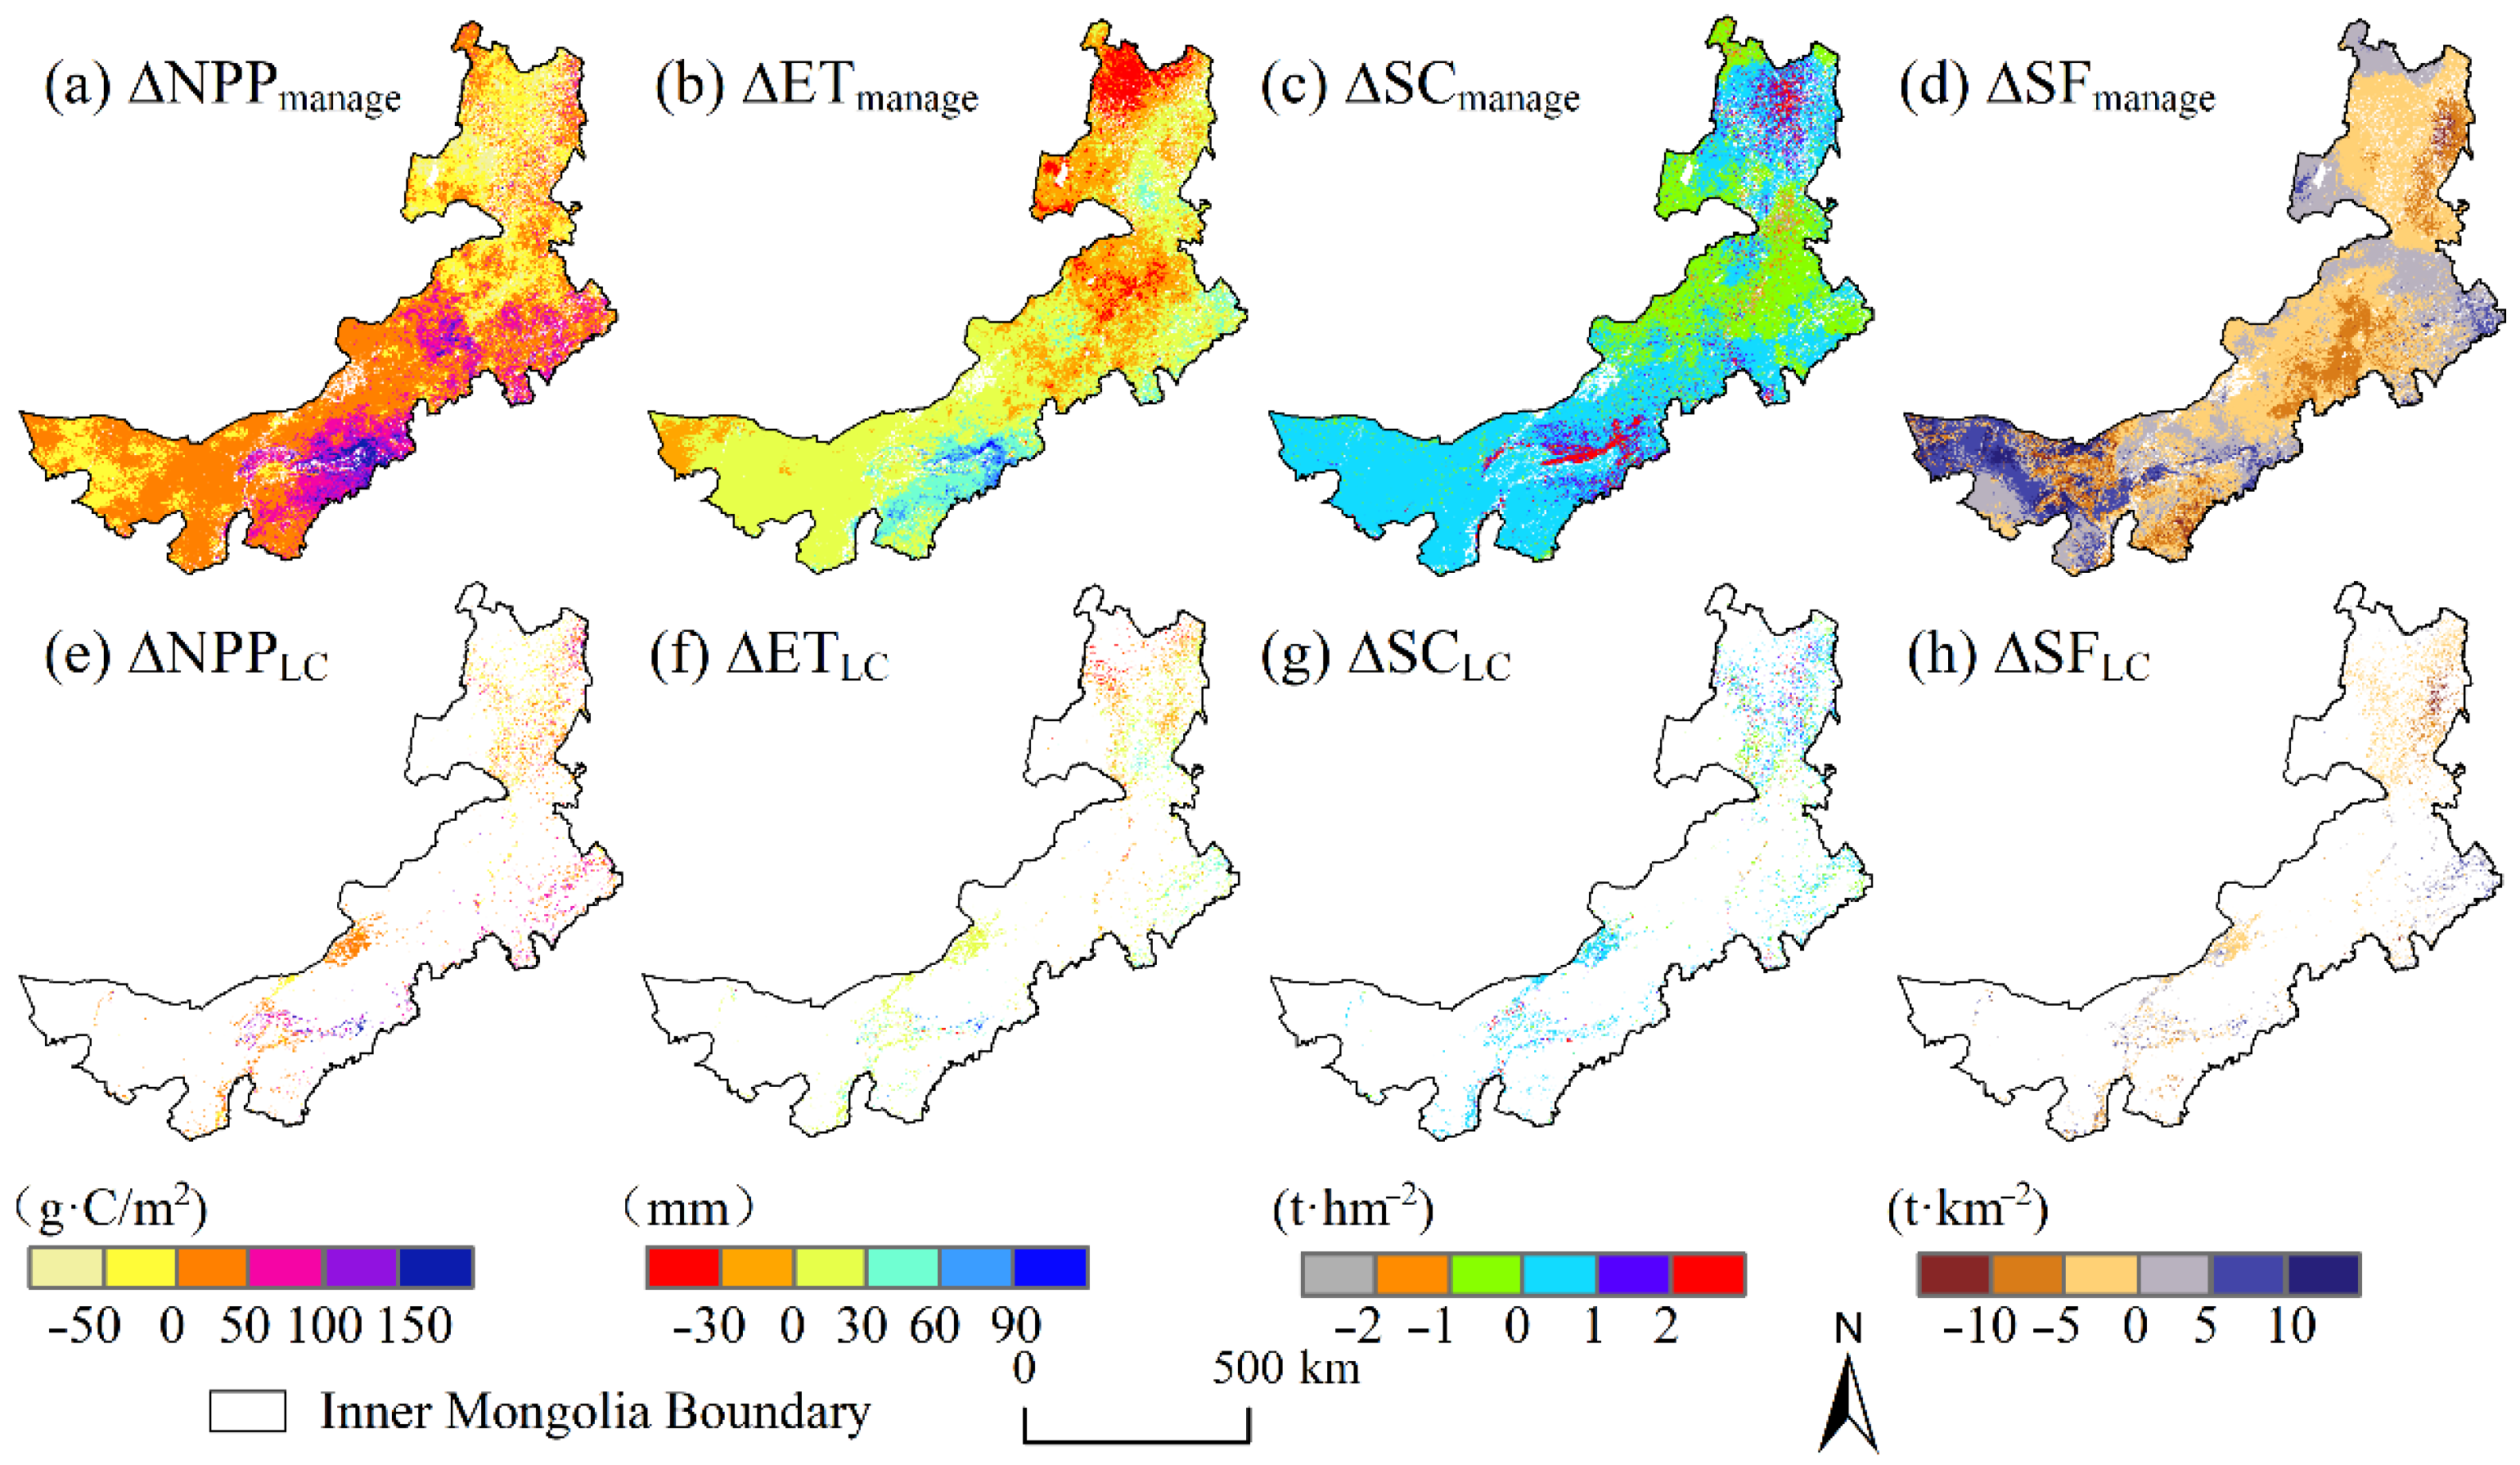
The spatial distribution of changes in the four ecosystem service factors brought about by management measures and land conversion in Inner Mongolia between 2001 and 2020 is shown in
Figure 5. The implementation of both management measures and land conversion resulted in enhancements in carbon sequestration, hydrological regulation, and soil and water conservation services. However, concomitantly, these measures also led to a weakening of windbreak and sand fixation services.
On average, NPP, ET, and SC services increased by 17.63 gC·m−2, 5.48 mm, and 0.24 t·hm−2 in the study area driven by the management measures, but SF services were negatively changed, i.e., decreased by 0.47 t·km−2. The management measures were most effective in the south-central grassland area, where the three services, including carbon sequestration, hydrological regulation and soil and water conservation, resulted in improvements in 70.09%, 67.74%, and 71.71% of the area with no land use change. Despite the overall increase in these three ecosystem services, localized decreases were observed, including in the eastern forest–grassland interspersed areas. The windbreak and sand fixation services exhibited a generalized degradation trend, with 58.56% of the area exhibiting no land use change and exhibiting signs of degradation. Of this, 74.57% were classified as lightly degraded areas (−5 to 0 t·km−2), primarily located in the central and northeastern regions of the country, and 25.43% were categorized as heavily degraded areas (<−5 t·km−2), predominantly situated in the central and western regions.
The impact of land conversion on ecosystem services was found to be more pronounced than the effect of management measures. The mean changes of the ecosystem services driven by land conversion were 18.09 g C·m−2, 10.21 mm, 0.32 t·hm−2, and −1.76 t·km−2, respectively. In the areas where land conversion took place, the percentage of areas where the three services (carbon sequestration, hydrological regulation, and soil and water conservation) were enhanced was found to be 68.75%, 75.08%, and 78.66%, respectively. In contrast to the substantial enhancement of the ecosystem services, land conversion served to exacerbate the risk associated with windbreak and sand fixation services. A total of 74.08% of the areas subjected to land conversion exhibited a decline in windbreak and sand fixation services, a phenomenon that was particularly pronounced in the forest–grass intertwined zone in the northeast and the grass–cropland intertwined zone in the west-central region.
3.3. Response of the Various Ecosystem Types to Management Measures and Land Conversion
Between 2001 and 2020, the impacts of management measures and land conversion on the total ecosystem services varied significantly across different ecosystem types (
Figure 6). In the case of grassland, management practices substantially enhanced carbon sequestration and hydrological regulation services, while land conversion was more effective in improving soil and water conservation and windbreak and sand-fixation functions.
In terms of NPP, human-induced changes led to an increase of 18,454.56 Gg C attributable to management measures, whereas land conversion caused a reduction of 662.29 Gg C. Regarding ET, management measures contributed 6140.16 mm (67.56%), while land conversion accounted for 2947.89 mm (32.43%) of the total increase. SC in grasslands improved by 41.30 × 10⁶ t, with land conversion contributing 26.26 × 10⁶ t (63.58%) and management measures 15.04 × 10⁶ t (36.42%). Although the total SF capacity decreased by 851.06 × 10³ t, areas affected by land conversion experienced a localized gain of 98.06 × 10³ t, highlighting its positive impact on this service.
In contrast, both forest and cropland ecosystems demonstrated a greater dependence on land conversion for enhancing ecosystem services, with higher contribution levels than those from management measures. For forest ecosystems, land conversion contributed to increases of 2232.68 Gg C in NPP, 2366.63 mm in ET, and 47.28 × 10⁶ t in SC while resulting in a minor reduction of 2.64 × 10³ t in SF. In comparison, management measures led to decreases in all four services: −1341.86 Gg C, −1684.58 mm, 6.01 × 10⁶ t, and −93.93 × 10³ t, respectively. Similarly, for croplands, land conversion contributed significantly more than management measures, with increases of 1746.04 Gg C, 3658.04 mm, 43.34 × 10⁶ t, and 106.95 × 10³ t across the four services. The corresponding values from management measures were 1514.28 Gg C, 575.28 mm, 0.78 × 10⁶ t, and −114.09 × 10³ t, respectively.
Desert ecosystems presented a markedly different pattern. Management measures played a dominant role in enhancing ecosystem services, whereas land conversion exhibited a suppressive effect. From 2001 to 2020, land conversion in desert areas resulted in reductions of 1751.27 Gg C in NPP, 3405.15 mm in ET, 34.81 × 10⁶ t in SC, and 404.22 × 10³ t in SF. In contrast, management measures led to notable increases across the same services: 1487.79 Gg C, 1750.82 mm, 1.84 × 10⁶ t, and 773.98 × 10³ t, respectively. These results underscore the critical role of management measures in improving ecosystem service in arid and semi-arid regions.
In summary, grassland and desert ecosystems are more sensitive to management measures, with the latter benefiting significantly from ecosystem restoration programs. Conversely, forest and cropland ecosystems rely more heavily on land conversion to achieve multifunctional improvements in ecosystem services.
4. Discussion
4.1. Impacts of Climate Change on Ecosystem Services
Temperature, precipitation, and solar radiation have been widely recognized as dominant climatic factors influencing ecosystem dynamics in Inner Mongolia (IM) [
32,
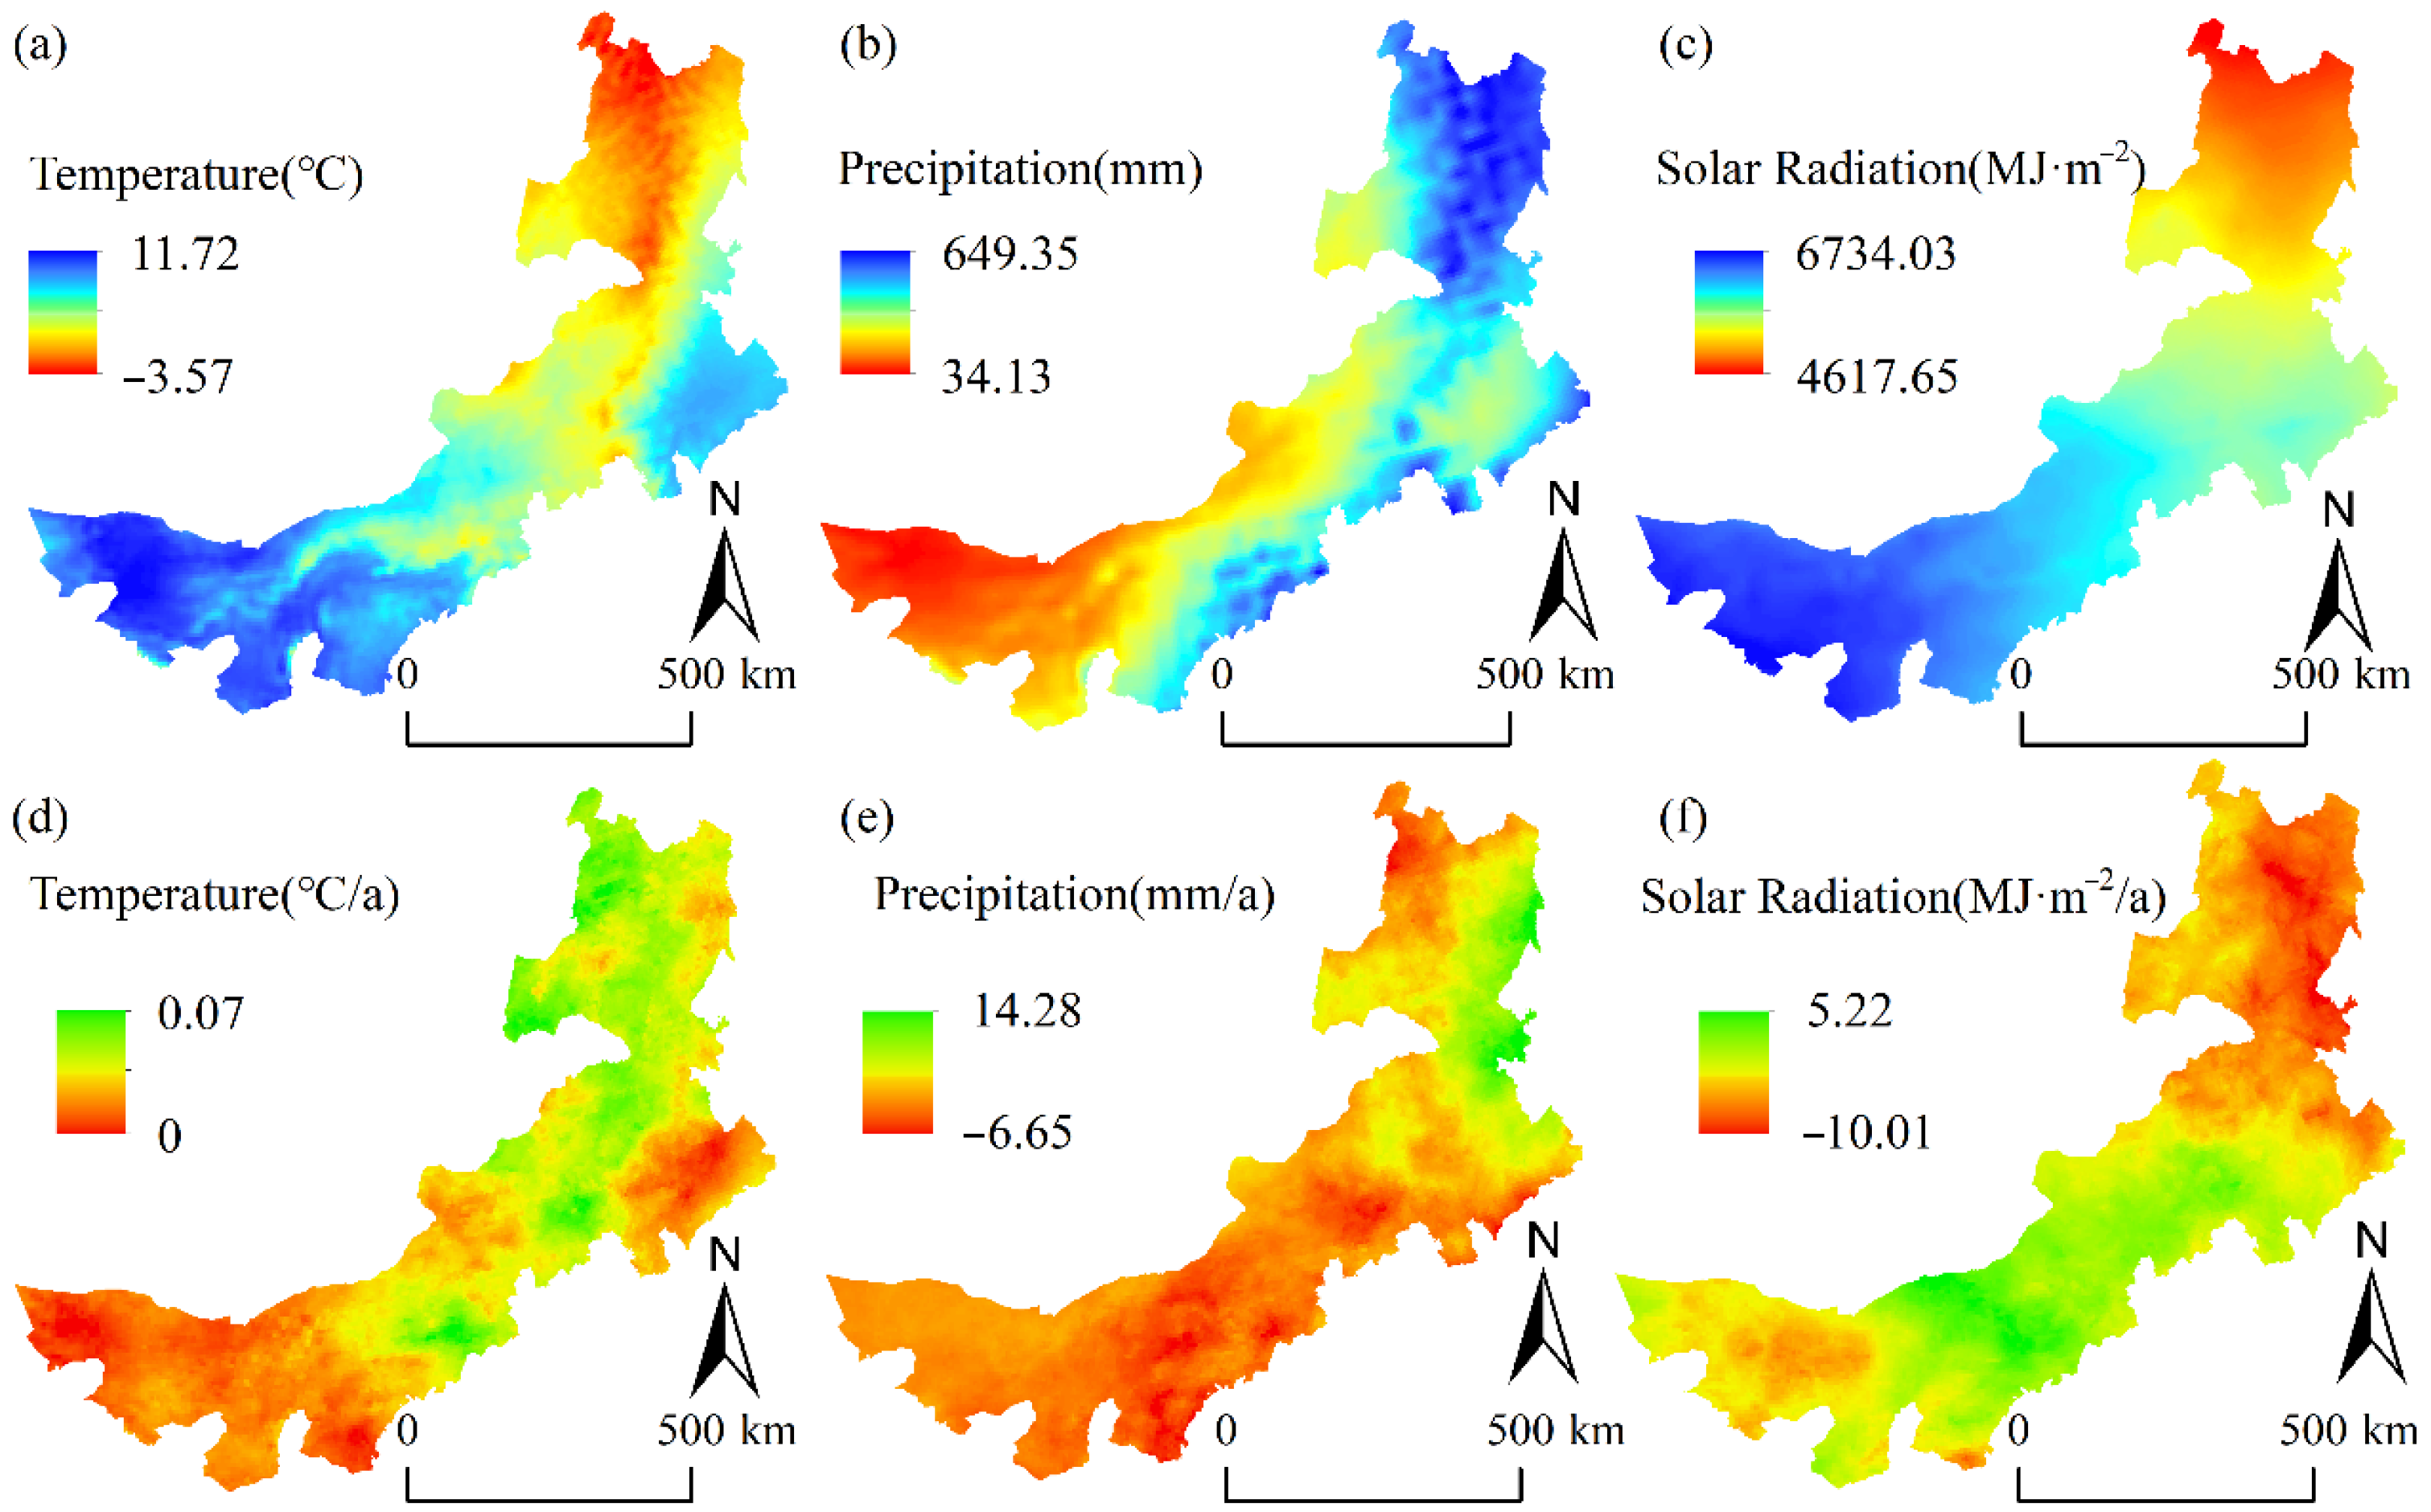
33]. To better understand the potential impact of climate change on ecosystem services, we analyzed the spatial patterns and interannual variation rates of mean annual temperature, total annual precipitation, and solar radiation from 2001 to 2020 (
Figure 7). The results reveal pronounced spatial gradients: both temperature and solar radiation generally increased from northeast to southwest, while precipitation showed a decreasing trend along the same gradient. These spatial heterogeneities are largely shaped by the combined effects of latitudinal zonation and topographic variation. Our findings are consistent with previous studies [
34], which identified a regional climatic pattern characterized by “enhanced radiation and warming accompanied by increased precipitation in the south and decreased precipitation in the north.” Overall, IM experienced a warming and wetting trend over the past two decades, with significant increases in temperature and precipitation and a west-to-east decreasing pattern in solar radiation. These shifts in climatic conditions have had profound implications for ecosystem service functions.
Under changing climate conditions, the four evaluated ecosystem services—carbon sequestration (PNPP), hydrological regulation (PET), soil conservation (PSC), and wind erosion control (PSF)—exhibited distinct spatial responses. Specifically, PNPP, PET, and PSC showed a general decline from northeast to southwest, whereas PSF displayed a decreasing pattern from southeast to northwest. This spatial differentiation likely reflects the complex interactions among climate variables, vegetation types, soil properties, and topographical factors.
More concretely, climate change has notably enhanced the region’s carbon sequestration capacity. Rising temperatures within a certain range can accelerate vegetation photosynthesis, while increased precipitation—especially in arid zones—can exert a significant positive effect on NPP [
35]. Our results support this view, particularly in the humid northeastern region with dense forest coverage, where the positive influence of climate change on NPP was most pronounced. Similarly, hydrological regulation capacity showed an increasing trend across much of the study area, likely due to higher evapotranspiration driven by warming along with enhanced vegetation growth promoted by increased rainfall. This observation aligns with [
36], who reported that warming climate conditions tend to increase ET in arid ecosystems.
In contrast, soil conservation and wind erosion control exhibited signs of degradation under climate change. The decline in soil conservation capacity was most evident in the eastern region and may be attributed to the spatiotemporal unevenness of precipitation and more frequent extreme climate events, which intensify surface disturbances and increase soil erosion risks. These factors include the uneven temporal distribution of precipitation events (e.g., more concentrated and intense rainfall), reduced soil moisture retention capacity, and increased surface runoff. Together, they contribute to the degradation of vegetation structure and root system stability, leading to decreased ground cover and an increased risk of soil erosion. Likewise, PSF showed an overall declining trend, particularly in areas prone to frequent aeolian activity. These trends are closely linked to climate-induced changes, such as rising temperatures and uneven rainfall distribution [
37].
4.2. Impacts of Land Conversion on Ecosystem Services
To further visualize the characteristics of land use/land cover change (LUCC) in Inner Mongolia during the study period, spatial overlay analysis and raster statistics were conducted using ArcGIS10.8 to process the land use transition data from 2001 to 2020. As shown in
Figure 8, Inner Mongolia underwent substantial LUCC over the two decades, with the most prominent transitions including desert to grassland, cropland to grassland, grassland to forest, and grassland to cropland. The first three types of transitions were primarily concentrated in areas where national ecological restoration programs such as the “Three-North Shelter Forest Program,” “Grazing Prohibition and Grassland Restoration,” and “Conversion of Cropland to Forest” were implemented. These spatial patterns highlight the significant influence of ecological projects on regional land system restructuring [
38]. In contrast, the expansion of cropland at the expense of grassland in the eastern region reflects the intensification of agricultural activities.
As revealed in
Section 3.2, such land transitions generally enhanced the provisioning of carbon sequestration, hydrological regulation, and soil conservation services, with average increases of 18.09 g C·m
−2, 10.21 mm, and 0.32 t·hm
−2, respectively. Notably, more than 65% of the region exhibited improvements in these services. However, land transitions posed increased risks to wind erosion control services. For instance, 74.08% of areas undergoing cropland-to-forest conversion experienced a decline in windbreak and sand-fixation capacity, especially in the ecotones of forest and grassland in the northeast and the cropland–grassland transition zones in the central and western regions. This decline may be attributed to mismatches between the species composition of afforested vegetation and their effectiveness in surface wind erosion protection, echoing earlier concerns regarding the ecological suitability of artificial shelterbelts [
39].
Moreover, the ecological responses to LUCC varied among vegetation types. Grassland ecosystems exhibited considerable potential for ecological recovery and service enhancement, particularly in terms of soil and wind erosion control. Adaptive land use measures such as cropland retirement and grassland enclosure significantly improved soil structural stability and surface cover, thereby reducing erosion risks and strengthening ecological regulation functions. In contrast, forest and cropland ecosystems demonstrated a higher dependency on land use transitions to realize ecosystem service improvements, reflecting the complexity of achieving multi-functional service synergies. These findings underscore the need for type-specific and precision-oriented land use policies that align with the ecological attributes of different systems [
40].
4.3. Impact of Management Measures on Ecosystem Services
This study demonstrates that between 2001 and 2020, ecological management measures have played a significant role in enhancing the ecosystem service functions of the study area. Overall, carbon sequestration, hydrological regulation, and soil conservation services have generally improved, particularly in the central and southern regions where no significant land use changes occurred. The improvement rates of these three services were 70.09%, 67.74%, and 71.71%, respectively, indicating that even in areas with relatively stable land use patterns, ecological management measures can significantly enhance the ecosystem’s regulatory capacity and service performance. This result further confirms the positive contribution of ecological management to ecosystem services, particularly in areas where land use practices have remained stable, suggesting that these management measures can yield long-term ecological benefits. However, the sand fixation service showed an overall degradation trend. Although some areas with no land use change also benefited from management measures, regions highly sensitive to wind erosion, such as the central-western and northeastern parts of the study area, exhibited varying degrees of functional degradation. This phenomenon may be attributed to the limited effectiveness of management measures in improving surface structure, optimizing planting patterns, and restoring shelterbelt functions [
41]. Particularly in areas prone to wind erosion, individual management practices, such as grazing prohibition, reforestation, or grassland restoration, may not be sufficient to effectively prevent the occurrence of wind erosion. More comprehensive and region-specific protective measures are needed. For instance, constructing directional windbreaks and building mixed shelterbelts of grassland and forest could be more effective in such areas [
42].
It is also noteworthy that different ecosystem types exhibit varying sensitivities and response rates to management measures. In grassland ecosystems, ecological management measures, such as grazing prohibition, fenced enclosures, and ecological compensation, significantly enhanced carbon sequestration and hydrological regulation services. This is consistent with existing research, which shows that moderate interventions can help improve the carbon sink function and water use efficiency of grassland ecosystems [
43]. Specifically, measures like grazing prohibition and grassland fencing help reduce the negative impacts of overgrazing on soil quality and vegetation cover, promoting grassland recovery and stability, thereby enhancing carbon storage and water retention capacities [
44]. Compared to grassland ecosystems, forest and cropland ecosystems tend to exhibit slower or more limited short-term responses to newly implemented ecological management measures due to their structural characteristics and higher existing levels of management. In desert ecosystems, management measures have had a significantly positive effect on ecosystem services. Sand dune control, conservation, and the planting of drought-resistant shrubs have, to some extent, reversed ecological degradation trends, increasing vegetation cover and enhancing ecosystem service levels. This finding aligns with current research advocating the “priority management of ecologically fragile zones” [
45]. In these areas, targeted interventions, such as sand dune fixation and desert greening projects, can significantly improve vegetation conditions and ecosystem service functions. Implementing integrated management strategies that combine natural recovery with artificial interventions will help enhance the comprehensive service functions of desert ecosystems.
Additionally, policy support plays a crucial role in enhancing ecosystem service functions. China’s recent policies, such as the “Grain for Green” program, “Grazing Prohibition”, and “Ecological Compensation”, have been instrumental in mitigating ecological degradation and restoring ecosystem functions. These policies not only provide financial support for management measures but also promote widespread participation from local governments and farmers, creating a collaborative ecological management model [
46]. However, in some regions, imbalances in the implementation of ecological compensation mechanisms and funding distribution may lead to unstable effects of management measures. In particular, in some ecologically fragile areas, the enforcement of these policies still requires improvement [
47].
Overall, while ecological management measures have made significant progress in enhancing carbon sequestration, hydrological regulation, and soil conservation services, challenges remain in improving sand fixation services. Future ecological management strategies need to focus more on specificity, systematization, and multi-level approaches, particularly in wind erosion-sensitive and ecologically fragile areas. Strengthening cross-regional coordination and joint management is crucial to maximize the enhancement of ecosystem service functions. Further policy support, especially improvements in funding, technology, and policy implementation, will help increase the sustainability and effectiveness of ecological management measures.
4.4. Limitations and Future Research Directions
The data used to quantify the four ecosystem services in this study were derived from multiple datasets. In practice, discrepancies in the spatial and temporal resolution among these datasets are common. For instance, the MODIS NDVI (MOD13A1 product) used in this study has a spatial resolution of 500 m, while the meteorological data may have a resolution of up to 10 km. Such differences can potentially influence the assessment results of ecosystem service dynamics. Therefore, acquiring or generating remote sensing and meteorological data with consistent spatial and temporal resolutions represents a potential direction for future research to reduce associated uncertainties.
Although this study employed the Theil–Sen slope estimator and the Mann–Kendall test to detect monotonic trends, these methods assume linear trends and do not account for parameter uncertainty. Future work could incorporate Monte Carlo simulations or Bayesian approaches to assess the influence of model parameters and input data on the results, thereby quantifying the range of uncertainty. Additionally, non-linear or threshold-based analytical methods such as piecewise regression and generalized additive models (GAMs) could be applied in future studies to capture more complex temporal responses of ecosystems to climate variability and management interventions.
5. Conclusions
This study presents a comprehensive quantitative analysis of the impacts of climate change, land conversion, and management measures on four key ecosystem services—carbon sequestration, hydrological regulation, soil and water conservation, and windbreak and sand fixation—in Inner Mongolia from 2001 to 2020. The results indicate that climate change has been the dominant driver influencing the long-term dynamics of ecosystem services in the region, contributing over 90% to the variations in carbon sequestration and hydrological regulation services. In particular, warming and increased precipitation have significantly enhanced vegetation productivity and evapotranspiration. However, climate change exerted a negative impact on soil and wind erosion control functions, particularly in areas sensitive to extreme weather events and surface disturbance.
Human activities exhibit spatially and temporally heterogeneous effects on ecosystem services. Although their overall contribution is limited compared to climate change, localized and episodic impacts—especially from land use interventions—can be significant. Among these, land conversion generally contributed more to improvements in ecosystem services than management measures but also aggravated the decline of sand fixation capacity in ecotonal and wind-sensitive zones. Under the influence of management measures, the average increases in NPP, ET, and SC services in the study area were 17.63 g C·m−2, 5.48 mm, and 0.24 t·hm−2, respectively, while the SF service showed an average decrease of 0.47 t·km−2. The average changes in ecosystem service functions caused by land use were 18.09 g C·m−2, 10.21 mm, 0.32 t·hm−2, and −1.76 t·km−2, respectively. The responses of different ecosystem types vary markedly. Grasslands and deserts are more responsive to ecological management measures, whereas forests and croplands benefit more from land conversion. Notably, ecological management significantly enhanced carbon sequestration and water regulation in grasslands, while land conversion was critical for improving soil conservation across all ecosystem types. Overall, this study provides robust evidence supporting differentiated, ecosystem-type-specific restoration strategies. It underscores the importance of balancing land conversion and ecological management, optimizing restoration layouts, and aligning interventions with local environmental characteristics. These findings are critical for enhancing regional ecological resilience and advancing sustainable ecosystem governance under changing climate conditions.


