
Comparative Review of ICAO and EUROCONTROL Flight Carbon Emission Approximators


Abstract
1. Introduction
2. Research Background
3. Flight Carbon Emission Approximators
3.1. ICAO Carbon Emission Calculator
3.2. ICAO CORSIA CO2 Estimation and Reporting Tool
3.3. Advanced Emission Model
3.4. Small Emitters Tool
4. Main Research Determinants
5. Main Research Findings
6. Discussion
7. Conclusions
Author Contributions
Funding
Institutional Review Board Statement
Informed Consent Statement
Data Availability Statement
Conflicts of Interest
References
- Air Transport Action Group. Aviation and Climate Change; Fact Sheet #2; ATAG: Geneva, Switzerland, 2020. [Google Scholar]
- International Air Transport Association. Remarks of Alexandre de Juniac at Wings of Change Americas 2019; IATA: Chicago, IL, USA, 2019. [Google Scholar]
- Mkono, M. Eco-anxiety and the flight shaming movement: Implications for tourism. J. Tour. Futures 2020, 6, 223–226. [Google Scholar] [CrossRef]
- Chiambaretto, P.; Mayenc, E.; Chappert, H.; Engsig, J.; Fernandez, A.S.; Le Roy, F. Where does flygskam come from? The role of citizens’ lack of knowledge of the environmental impact of air transport in explaining the development of flight shame. J. Air Transp. Manag. 2021, 93, 102049. [Google Scholar] [CrossRef]
- Hares, A.; Dickinson, J.; Wilkes, K. Climate change and the air travel decisions of UK tourists. J. Transp. Geogr. 2010, 18, 466–473. [Google Scholar] [CrossRef]
- Intergovernmental Panel on Climate Change. IPCC Special Report Aviation and the Global Atmosphere; Summary for Policymakers; Cambridge University Press: Cambridge, UK, 1999. [Google Scholar]
- Kollmuss, A.; Myers Crimmins, A. Carbon Offsetting & Air Travel Part 2: Non-CO2 Emissions Calculations; Stockholm Environment Institute: Somerville, MA, USA, 2009. [Google Scholar]
- Ren, D.; Leslie, L.M. Climate Warming and Effects on Aviation. In Environmental Impact of Aviation and Sustainable Solutions; Agarwal, R., Ed.; IntechOpen Limited: London, UK, 2020. [Google Scholar] [CrossRef]
- Klöwer, M.; Allen, M.R.; Lee, D.S.; Proud, S.R.; Gallagher, L.; Skowron, A. Quantifying aviation’s contribution to global warming. Environ. Res. Lett. 2021, 16, 104027. [Google Scholar] [CrossRef]
- Jardine, C. Calculating the Carbon Dioxide Emissions of Flights; Environmental Change Institute, Oxford University Centre for the Environment: Oxford, UK, 2009. [Google Scholar]
- Royal Netherlands Aerospace Centre. Destination 2050—A Route to Net Zero EUROPEAN Aviation; SEO Amsterdam Economics: Amsterdam, The Netherlands, 2021. [Google Scholar]
- Olsthoorn, X. Carbon dioxide emissions from international aviation: 1950–2050. J. Air Transp. Manag. 2001, 7, 87–93. [Google Scholar] [CrossRef]
- Air Transport Action Group. Waypoint 2050; ATAG: Geneva, Switzerland, 2021. [Google Scholar]
- Capoccitti, S.; Khare, A.; Mildenberger, U. Aviation Industry—Mitigating Climate Change Impacts through Technology and Policy. J. Technol. Manag. Innov. 2010, 5, 66–75. [Google Scholar] [CrossRef]
- Behrens, C.; Pels, E. Intermodal competition in the London–Paris passenger market: High-Speed Rail and air transport. J. Urban Econ. 2012, 71, 278–288. [Google Scholar] [CrossRef]
- Cames, M.; Graichen, J.; Siemons, A.; Cook, V. Emission Reduction Targets for International Aviation and Shipping; Study for the ENVI Committee; Directorate General for Internal Policies Policy Department A: Economic and Scientific Policy; European Parliament: Brussels, Belgium, 2015. [Google Scholar]
- Mora, C.; Rollins, R.L.; Taladay, K.; Kantar, M.B.; Chock, M.K.; Shimada, M.; Franklin, E.C. Bitcoin emissions alone could push global warming above 2 °C. Nat. Clim. Chang. 2018, 8, 931–933. [Google Scholar] [CrossRef]
- SESAR Joint Undertaking. SESAR Environment Assessment Process; PJ19.4.2; EUROCONTROL: Brussels, Belgium, 2019. [Google Scholar]
- International Air Transport Association. Aircraft Technology Roadmap to 2050; IATA: Montréal, QC, Canada, 2019. [Google Scholar]
- Bezos-O’Connor, G.; Mangelsdorf, M.; Nickol, C.; Maliska, H.; Washburn, A.; Wahls, R. Fuel Efficiencies Through Airframe Improvements. In Proceedings of the 3rd AIAA Atmospheric Space Environments Conference, Honolulu, HI, USA, 27–30 June 2011; pp. 1–13. [Google Scholar]
- Maniatis, K.; Weitz, M.; Zschocke, A. 2 Million Tons Per Year: A Performing Biofuels Supply Chain for EU Aviation; European Commission: Brussels, Belgium, 2011. [Google Scholar]
- Scheelhaase, J.; Maertens, S.; Grimme, W.; Jung, M. EU ETS versus CORSIA—A critical assessment of two approaches to limit air transport’s CO2 emissions by market-based measures. J. Air Transp. Manag. 2018, 67, 55–62. [Google Scholar] [CrossRef]
- European Commission. Regulation (EU) 2017/2392 of the European Parliament and of the Council of 13 December 2017 Amending Directive 2003/87/EC to Continue Current Limitations of Scope for Aviation Activities and to Prepare to Implement a Global Market-Based Measure from 2021; European Commission: Brussels, Belgium, 2017. [Google Scholar]
- Scheelhaase, J.; Maertens, S.; Grimme, W. Options for improving the EU Emissions Trading Scheme (EU ETS) for aviation. Transp. Res. Procedia 2021, 59, 193–202. [Google Scholar] [CrossRef]
- International Air Transport Association. An Airline Handbook on CORSIA; IATA: Montréal, QC, Canada, 2019. [Google Scholar]
- Air Transport Action Group. Voluntary Carbon Offsetting; Fact Sheet #11; ATAG: Geneva, Switzerland, 2020. [Google Scholar]
- International Civil Aviation Organization. Assembly—41st Session; Report of the Executive Committee on Agenda Item 17; Environmental Protection—International Aviation and Climate Change; ICAO: Montréal, QC, Canada, 2022. [Google Scholar]
- Manvitha, M.S.; Vani Pujitha, M.; Prasad, N.H.; Yashitha Anju, B. A Predictive Analysis on CO2 Emissions in Automobiles using Machine Learning Techniques. In Proceedings of the 2023 International Conference on Intelligent Data Communication Technologies and Internet of Things (IDCIoT), Bengaluru, India, 5–7 January 2023; pp. 394–401. [Google Scholar]
- Khajavi, H.; Rastgoo, A. Predicting the carbon dioxide emission caused by road transport using a Random Forest (RF) model combined by Meta-Heuristic Algorithms. Sustain. Cities Soc. 2023, 93, 104503. [Google Scholar] [CrossRef]
- Cansiz, O.F.; Unsalan, K.; Unes, F. Prediction of CO2 emission in transportation sector by computational intelligence techniques. Int. J. Glob. Warm. 2022, 27, 271–283. [Google Scholar] [CrossRef]
- Li, G.; Yang, Z.; Yang, H. A new hybrid short-term carbon emissions prediction model for aviation industry in China. Alex. Eng. J. 2023, 68, 93–110. [Google Scholar] [CrossRef]
- Yang, H.; O’Connell, J.F. Short-Term Carbon Emissions Forecast for Aviation Industry in Shanghai. J. Clean. Prod. 2020, 275, 122734. [Google Scholar] [CrossRef]
- Masood, A.; Ahmad, K. A review on emerging artificial intelligence (AI) techniques for air pollution forecasting: Fundamentals, application and performance. J. Clean. Prod. 2021, 322, 129072. [Google Scholar] [CrossRef]
- Tesfai, M.H.; Tsegai, M.; Kiflay, R.; Misghina, R. AI Driven Carbon Emission Estimation and Forecasting with Recommended Solution. In Intelligent Computing Systems, Proceedings of the Intelligent Computing Systems; Proceedings of the 5th International Symposium, ISICS 2024, Sharjah, United Arab Emirates, 6–7 November 2024; Safi, A., Martin-Gonzalez, A., Brito-Loeza, C., Castañeda-Zeman, V., Eds.; Communications in Computer and Information Science, 2381; Springer: Cham, Switzerland, 2025; pp. 146–150. [Google Scholar]
- Subramaniam, S.; Raju, N.; Ganesan, A.; Rajavel, N.; Chenniappan, M.; Prakash, C.; Pramanik, A.; Basak, A.K.; Dixit, S. Artificial Intelligence Technologies for Forecasting Air Pollution and Human Health: A Narrative Review. Sustainability 2022, 14, 9951. [Google Scholar] [CrossRef]
- Nassef, A.M.; Olabi, A.G.; Rezk, H.; Abdelkareem, M.A. Application of Artificial Intelligence to Predict CO2 Emissions: Critical Step towards Sustainable Environment. Sustainability 2023, 15, 7648. [Google Scholar] [CrossRef]
- Alam, G.M.I.; Arfin Tanim, S.; Sarker, S.K.; Watanobe, Y.; Islam, R.; Mridha, M.F.; Nur, K. Deep learning model based prediction of vehicle CO2 emissions with eXplainable AI integration for sustainable environment. Sci. Rep. 2025, 15, 3655. [Google Scholar] [CrossRef]
- Cabaneros, S.M.; Calautit, J.K.; Hughes, B.R. A Review of Artificial Neural Network Models for Ambient Air Pollution Prediction. Environ. Model. Softw. 2019, 119, 285–304. [Google Scholar] [CrossRef]
- Lee, G.Y.; Yoo, K.E.; Kim, K.W.; Kim, B.M. A Modified Carbon Calculator for Enhanced Accuracy, Reliability and Understandability. In Computer Science and its Applications: Lecture Notes in Electrical Engineering; Yeo, S.S., Pan, Y., Lee, Y., Chang, H., Eds.; Springer: Dordrecht, The Netherlands, 2012. [Google Scholar]
- Cambridge English Dictionary. Approximation; Cambridge University Press: Cambridge, UK, 2020. [Google Scholar]
- International Civil Aviation Organization. ICAO Carbon Emissions Calculator; ICAO: Montréal, QC, Canada, 2022. [Google Scholar]
- International Civil Aviation Organization. ICAO Carbon Calculator; ICAO News release: Montréal, QC, Canada, 2008. [Google Scholar]
- International Civil Aviation Organization. ICAO Tools to Support the State Action Plan Process; ICAO: Montréal, QC, Canada, 2019. [Google Scholar]
- Montlaur, A.; Delgado, L.; Trapote-Barreira, C. Analytical Models for CO2 Emissions and Travel Time for Short-to-Medium-Haul Flights Considering Available Seats. Sustainability 2021, 13, 10401. [Google Scholar] [CrossRef]
- International Civil Aviation Organization. ICAO Carbon Emissions Calculator Methodology, version 11; ICAO: Montréal, QC, Canada, 2018. [Google Scholar]
- International Civil Aviation Organization. ICAO Carbon Emissions Calculator Methodology, version 10; ICAO: Montréal, QC, Canada, 2017. [Google Scholar]
- Johnson, M.; Gonzalez, A. Effects of a Carbon Emissions Trading System on Aviation Financial Decisions. J. Aviat. Technol. Eng. 2013, 2, 24–31. [Google Scholar] [CrossRef]
- International Civil Aviation Organization. ICAO Carbon Emissions Calculator Methodology, version 9; ICAO: Montréal, QC, Canada, 2016. [Google Scholar]
- Miller, A. Savings in per-passenger CO2 emissions using rail rather than air travel in the northeastern U.S. J. Air Waste Manag. Assoc. 2021, 71, 1458–1471. [Google Scholar] [CrossRef] [PubMed]
- Baumeister, S. “Each flight is different”: Carbon emissions of selected flights in three geographical markets. Transp. Res. Part D Transp. Environ. 2017, 57, 1–9. [Google Scholar] [CrossRef]
- International Civil Aviation Organization. CORSIA-CERT, version 2021; Tutorial; ICAO: Montréal, QC, Canada, 2021. [Google Scholar]
- International Civil Aviation Organization. Annex 16 to the Convention on International Civil Aviation; Environmental Protection; ICAO: Montréal, QC, Canada, 2018. [Google Scholar]
- International Civil Aviation Organization. ICAO CORSIA CO2 Estimation and Reporting Tool (CERT): 2021 Version—Design, Development and Validation; ICAO: Montréal, QC, Canada, 2021. [Google Scholar]
- International Civil Aviation Organization. Climate Change Mitigation: CORSIA; ICAO: Montréal, QC, Canada, 2019. [Google Scholar]
- International Civil Aviation Organization. ICAO CORSIA CO2 Estimation and Reporting Tool (CERT): 2019 Version—Design, Development and Validation; ICAO: Montréal, QC, Canada, 2019. [Google Scholar]
- International Civil Aviation Organization. Resolution A40-19: Consolidated Statement of Continuing ICAO Policies and Practices Related to Environmental Protection—Carbon Offsetting and Reduction Scheme for International Aviation (CORSIA); ICAO: Montréal, QC, Canada, 2019. [Google Scholar]
- International Civil Aviation Organization. Carbon Offsetting and Reduction Scheme for International Aviation (CORSIA); ICAO: Montréal, QC, Canada, 2022. [Google Scholar]
- Marsh, D.; De Lépinay, I.; Cavadini, L.; Box, L. European models strengthen interoperability in support of CAEP. In ICAO Environmental Report 2016; ICAO: Montréal, QC, Canada; pp. 23–25.
- EUROCONTROL. Advance Emission Model (AEM3) v1.5 Validation Report; EUROCONTROL: Brussels, Belgium, 2004. [Google Scholar]
- ENVISA. Advanced Emissions Model (AEM3) v1.5 Validation Exercise #4; ENVISA: Paris, France, 2007. [Google Scholar]
- EUROCONTROL. Advanced Emission Model. Available online: https://www.eurocontrol.int/model/advanced-emission-model (accessed on 3 April 2025).
- EUROCONTROL. Forecasting Civil Aviation Fuel Burn and Emissions in Europe; EUROCONTROL: Brussels, Belgium, 2001. [Google Scholar]
- Cavadini, L.; de Lépinay, I. Assessing trends in aviation noise and emissions in Europe using advanced modelling capabilities. In Proceedings of the 2nd ECATS Conference Making Aviation Environmentally Sustainable, Athens, Greece, 7–9 November 2016; pp. 62–66. [Google Scholar]
- SAE International. Procedure for the Calculation of Aircraft Emissions AIR 5715; SAE: Pennsylvania, PA, USA, 2009. [Google Scholar]
- European Commission. Commission Regulation (EU) No 606/2010 of 9 July 2010 on the Approval of a Simplified Tool Developed by the European Organisation for Air Safety Navigation (Eurocontrol) to Estimate the Fuel Consumption of Certain Small Emitting Aircraft Operators; European Commission: Brussels, Belgium, 2010. [Google Scholar]
- European Commission. The Monitoring and Reporting Regulation—General guidance for Aircraft Operators; Guidance Document; European Commission: Brussels, Belgium, 2022. [Google Scholar]
- European Commission. Directive 2003/87/EC of the European Parliament and of the Council of 13 October 2003 Establishing a Scheme for Greenhouse Gas Emission Allowance Trading Within the Community and Amending Council Directive 96/61/EC; European Commission: Brussels, Belgium, 2003. [Google Scholar]
- European Commission. Commission Implementing Regulation (EU) 2018/2066 of 19 December 2018 on the Monitoring and Reporting of Greenhouse Gas Emissions Pursuant to Directive 2003/87/EC of the European Parliament and of the Council and Amending Commission Regulation (EU) No 601/2012; European Commission: Brussels, Belgium, 2018. [Google Scholar]
- Small Emitters Tool. Available online: https://www.eurocontrol.int/tool/small-emitters-tool (accessed on 1 October 2022).
- Bernardo, V.; Fageda, X.; Teixido, J. Flight Ticket Taxes in Europe: Environmental and Economic Impact. Transp. Res. Part A Policy Pract. 2024, 179, 103892. [Google Scholar] [CrossRef]
- Small Emitters Tool. Available online: https://www.eurocontrol.int/publication/small-emitters-tool-set-2021 (accessed on 25 June 2025).
- Astorino, A. EUROCONTROL ETS Support Facilities and Fuel Estimator Tool; EUROCONTROL: Brussels, Belgium, 2009. [Google Scholar]
- EcoTransIT World. Environmental Methodology and Data; Update 2020; EcoTransIT World: Hanover, Germany, 2021. [Google Scholar]
- Hill, N.; Watson, R.; James, K. 2016 Government GHG Conversion Factors for Company Reporting: Methodology Paper for Emission Factors; Department for Business, Energy & Industrial Strategy: London, UK, 2016. [Google Scholar]
- Network Strategic Tool. Available online: https://www.eurocontrol.int/model/network-strategic-modelling-tool (accessed on 1 October 2022).
- Reynolds, T.G. Development of flight inefficiency metrics for environmental performance assessment of ATM. In Proceedings of the Proceedings of the 8th USA/Europe Air Traffic Management Research and Development Seminar, Napa, CA, USA, 29 June–2 July 2009. [Google Scholar]
- EUROCONTROL. Standard Inputs for EUROCONTROL Cost-Benefit Analyses; EUROCONTROL: Brussels, Belgium, 2015. [Google Scholar]
- EUROCONTROL. Standard Inputs for Economic Analysis; EUROCONTROL: Brussels, Belgium, 2024. [Google Scholar]
- EUROCONTROL. Standard Inputs for Economic Analyses; EUROCONTROL: Brussels, Belgium, 2020. [Google Scholar]
- Becken, S.; Pant, P. Airline Initiatives to Reduce Climate Impact; Griffith University: Queensland, Australia, 2018. [Google Scholar]
- International Air Transport Association. Airspace Users’ Key Points on Network Performance: 95th Meeting of the Route Network Development Sub-Group; IATA: Brussels, Belgium, 2018. [Google Scholar]
- Cui, Q.; Li, X.; Li, Y. Accounting for the carbon emissions from domestic air routes in China. Heliyon 2022, 8, e08716. [Google Scholar] [CrossRef]
- Cui, Q.; Li, Y. Carbon emissions of Provincial Administrative Regions from the airlines in China. Res. Sq. 2021, 1–15. [Google Scholar] [CrossRef]
- Braun-Unkhoff, M.; Riedel, U. Alternative fuels in aviation. CEAS Aeronaut. J. 2015, 6, 83–93. [Google Scholar] [CrossRef]
- Barnard, G.A. Statistical Inference. J. R. Stat. Soc. Ser. B (Methodol.) 1949, 11, 115–149. [Google Scholar] [CrossRef]
- International Civil Aviation Organization. Air Transport Statistics—Appendix 1. In Tables Relating to the World of Air Transport in 2015; ICAO: Montréal, QC, Canada, 2016. [Google Scholar]
- International Energy Agency. CO2 Emissions in Aviation in the Net Zero Scenario, 2000–2030. Available online: https://www.iea.org/data-and-statistics/charts/co2-emissions-in-aviation-in-the-net-zero-scenario-2000-2030 (accessed on 4 March 2025).
- Department for Transport. Technical Note: A comparison of Aviation Emissions Methodologies; United Kingdom Government: London, UK, 2024.
- European Commission. Regulation (EU) 2023/2405 of the European Parliament and of the Council of 18 October 2023 on Ensuring a Level Playing Field for Sustainable Air Transport (ReFuelEU Aviation); European Commission: Brussels, Belgium, 2024. [Google Scholar]

| Emission Approximators’ Elements | ICEC | CERT | AEM | SET | NEST | |
|---|---|---|---|---|---|---|
| Operational data of actual flights | Horizontal flight profile | ☓ | ☓ | ✓ | ☓ | ✓ |
| Vertical flight profile | ☓ | ☓ | ✓ | ☓ | ✓ | |
| Meteorological conditions | ☓ | ☓ | ☓ | ☓ | ✓ | |
| Air Traffic Control restrictions | ☓ | ☓ | ✓ | ☓ | ✓ | |
| Aircraft Maximum Take-Off Mass | ☓ | ☓ | ☓ | ☓ | ✓ | |
| Aircraft subtype differences | ☓ | ☓ | ✓ | ☓ | ✓ | |
| Aircraft fuel type loaded | ☓ | ✓ | ✓ | ☓ | ☓ | |
| Airspace (sector) availability | ☓ | ☓ | ✓ | ☓ | ✓ | |
| Number of passengers onboard | ✓ | ☓ | ☓ | ☓ | ☓ | |
| Flight classes differentiations | ✓ | ☓ | ☓ | ☓ | ☓ | |
| Technical features | Integrated exporting option | ☓ | ✓ | ✓ | ☓ | ✓ |
| Manual user input required | ✓ | ☓ | ✓ | ✓ | ☓ | |
| Integrated database | ☓ | ☓ | ✓ | ☓ | ✓ | |
| Geospatial visualizations | ✓ | ✓ | ☓ | ☓ | ✓ | |
| Modular framework | ☓ | ☓ | ✓ | ☓ | ✓ | |
| Web-based application | ✓ | ☓ | ☓ | ☓ | ☓ | |
| Reporting interoperability | ☓ | ✓ | ✓ | ☓ | ✓ | |
| Fuel Burn Approximator | ICEC | CERT | AEM | SET | |
|---|---|---|---|---|---|
| Absolute Differences | |||||
| ICEC | Relative differences | 77,909.68 kg | 62,047.42 kg | 74,281.40 kg | |
| CERT | 27.95% | 15,862.26 kg | 3628.28 kg | ||
| AEM | 22.26% | 7.90% | 12,233.98 kg | ||
| SET | 26.65% | 1.77% | 5.99% | ||
| Fuel Burn Estimation Discrepancies | ICEC | CERT | AEM | SET | |
|---|---|---|---|---|---|
| Emission Effects | |||||
| ICEC | financial effects | 243,407.61 kg of CO2 | 193,282.86 kg of CO2 | 233,986.41 kg of CO2 | |
| CERT | 33,501.16 EUR | 50,124.74 kg of CO2 | 9421.20 kg of CO2 | ||
| AEM | 26,680.39 EUR | 6820.77 EUR | 40,703.54 kg of CO2 | ||
| SET | 31,941.00 EUR | 1560.16 EUR | 5260.61 EUR | ||
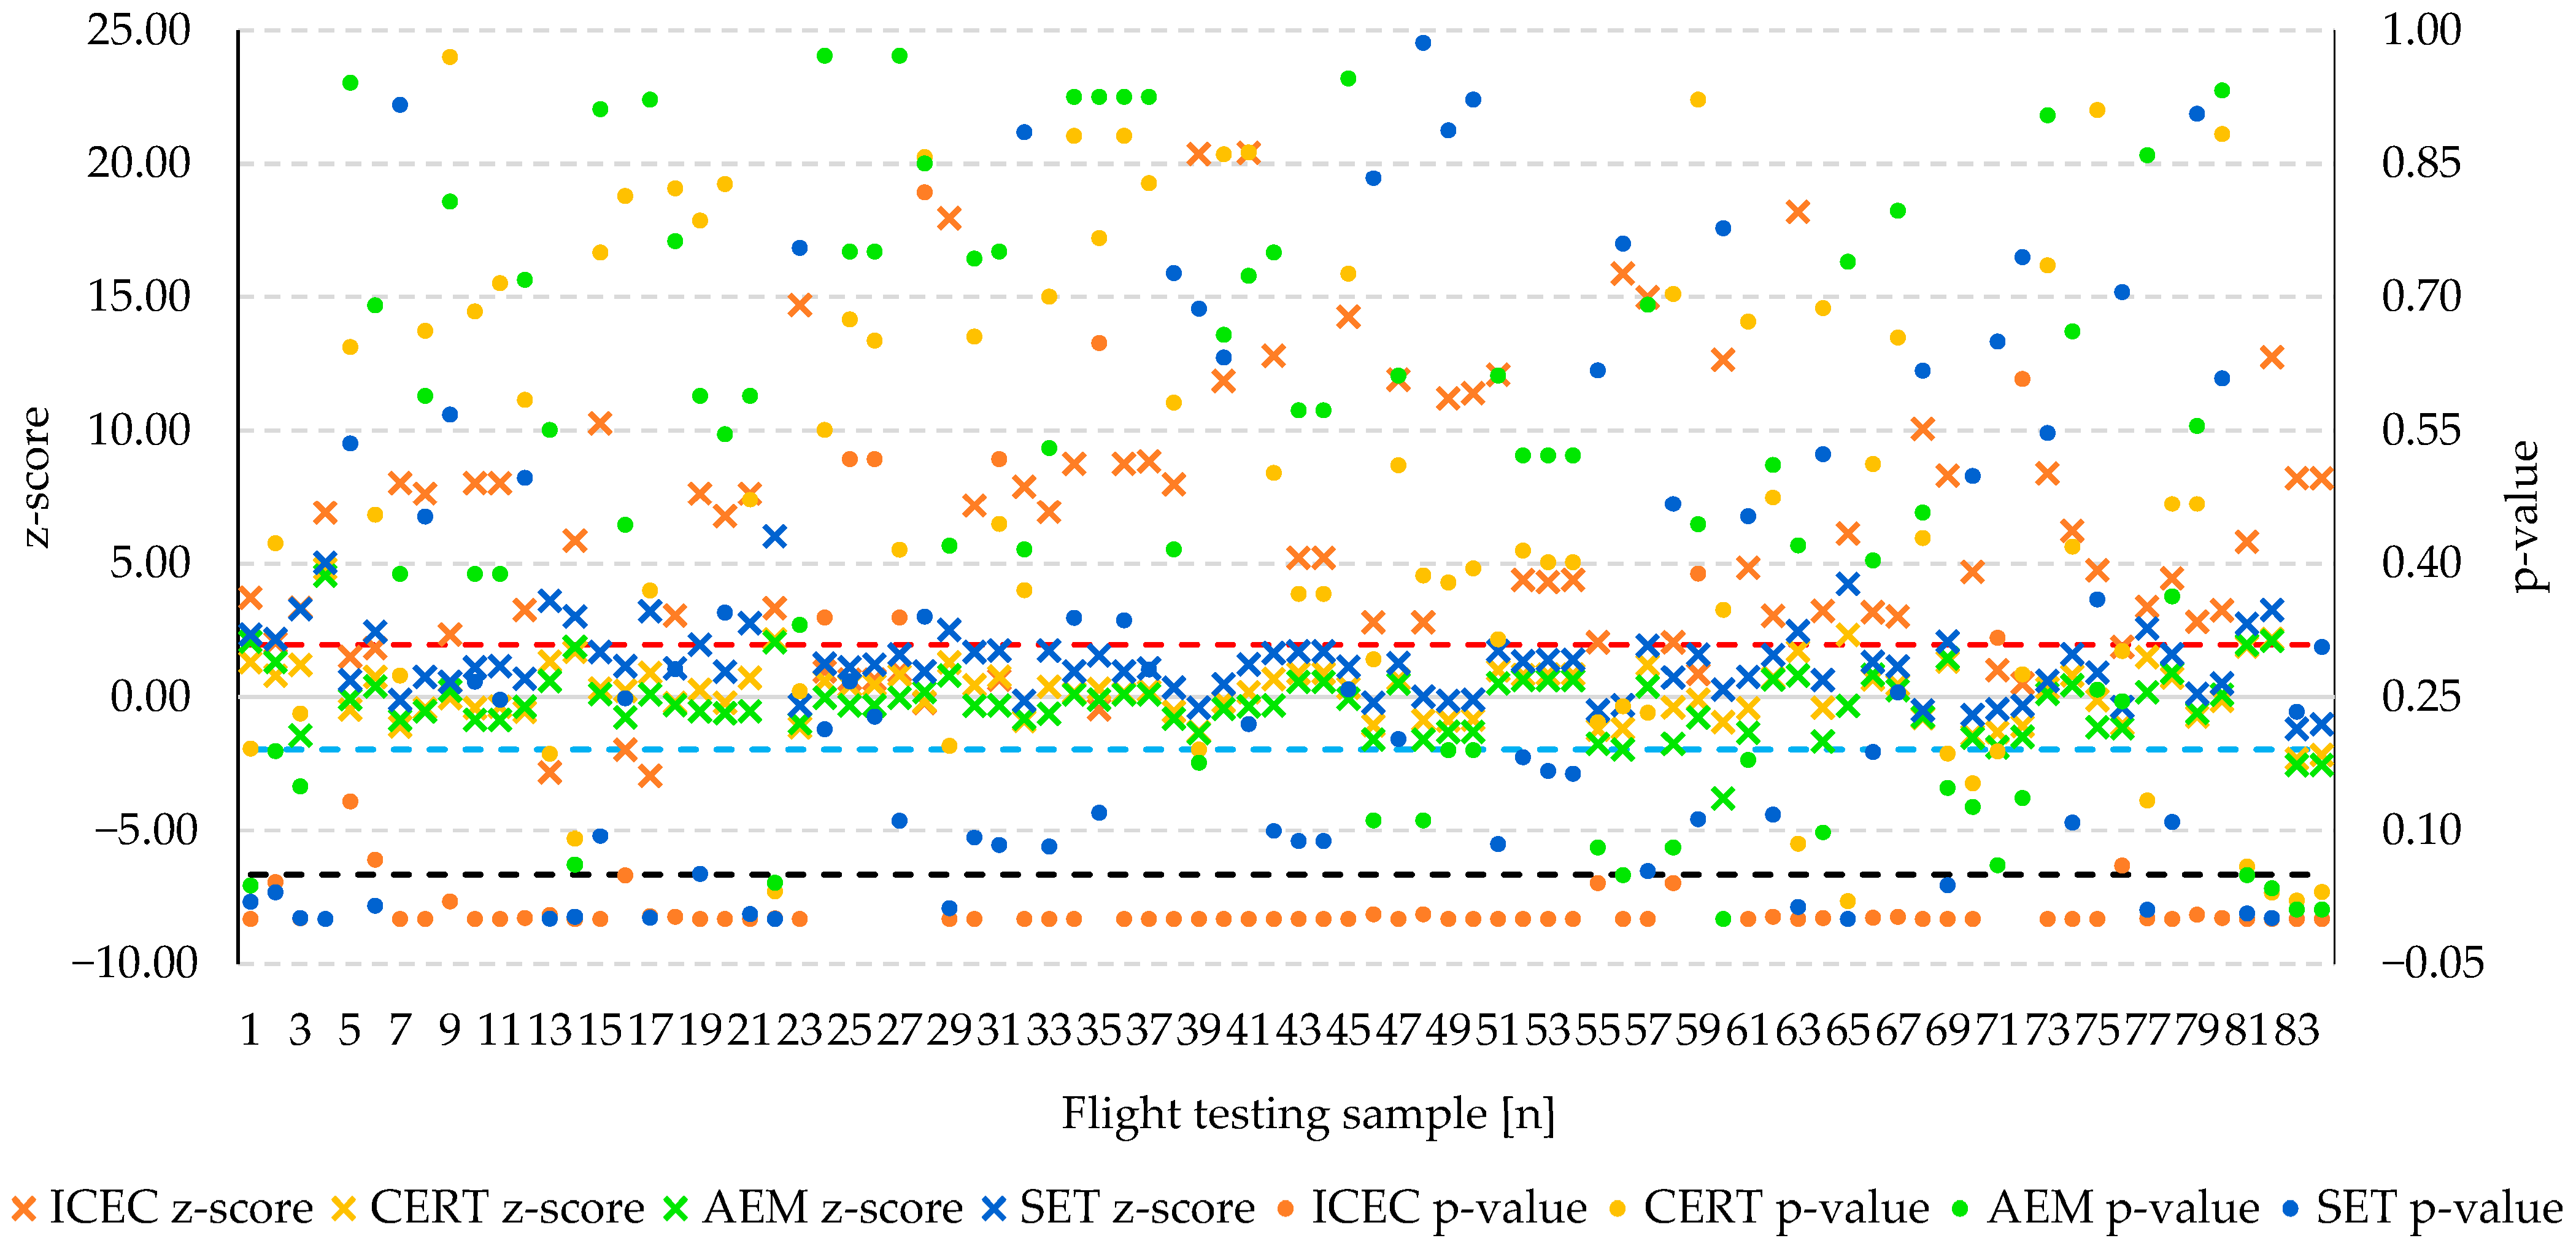
| z-Score | μ | M | σ | ∧ | ∨ | [∧, ∨] |
|---|---|---|---|---|---|---|
| ICEC | 6.25493 | 5.20704 | 5.14136 | −2.94756 | 20.40253 | 23.35010 |
| CERT | 0.21417 | 0.28498 | 1.09913 | −2.31372 | 4.80971 | 7.12342 |
| AEM | −0.22499 | −0.31785 | 1.21140 | −3.79927 | 4.54503 | 8.34429 |
| SET | 1.25096 | 1.15621 | 1.29167 | −1.19127 | 6.01357 | 7.20484 |
| p-Value | μ | M | σ | ∧ | ∨ | [∧, ∨] |
|---|---|---|---|---|---|---|
| ICEC | 0.06545 | 0.00000 | 0.17063 | 0.00000 | 0.81729 | 0.81729 |
| CERT | 0.47043 | 0.43653 | 0.26765 | 1.51152 × 10⁻⁶ | 0.96991 | 0.96991 |
| AEM | 0.48093 | 0.52192 | 0.30820 | 5.49281 × 10⁻⁶ | 0.97148 | 0.97148 |
| SET | 0.31833 | 0.24016 | 0.29153 | 1.81478 × 10⁻⁹ | 0.98564 | 0.98564 |
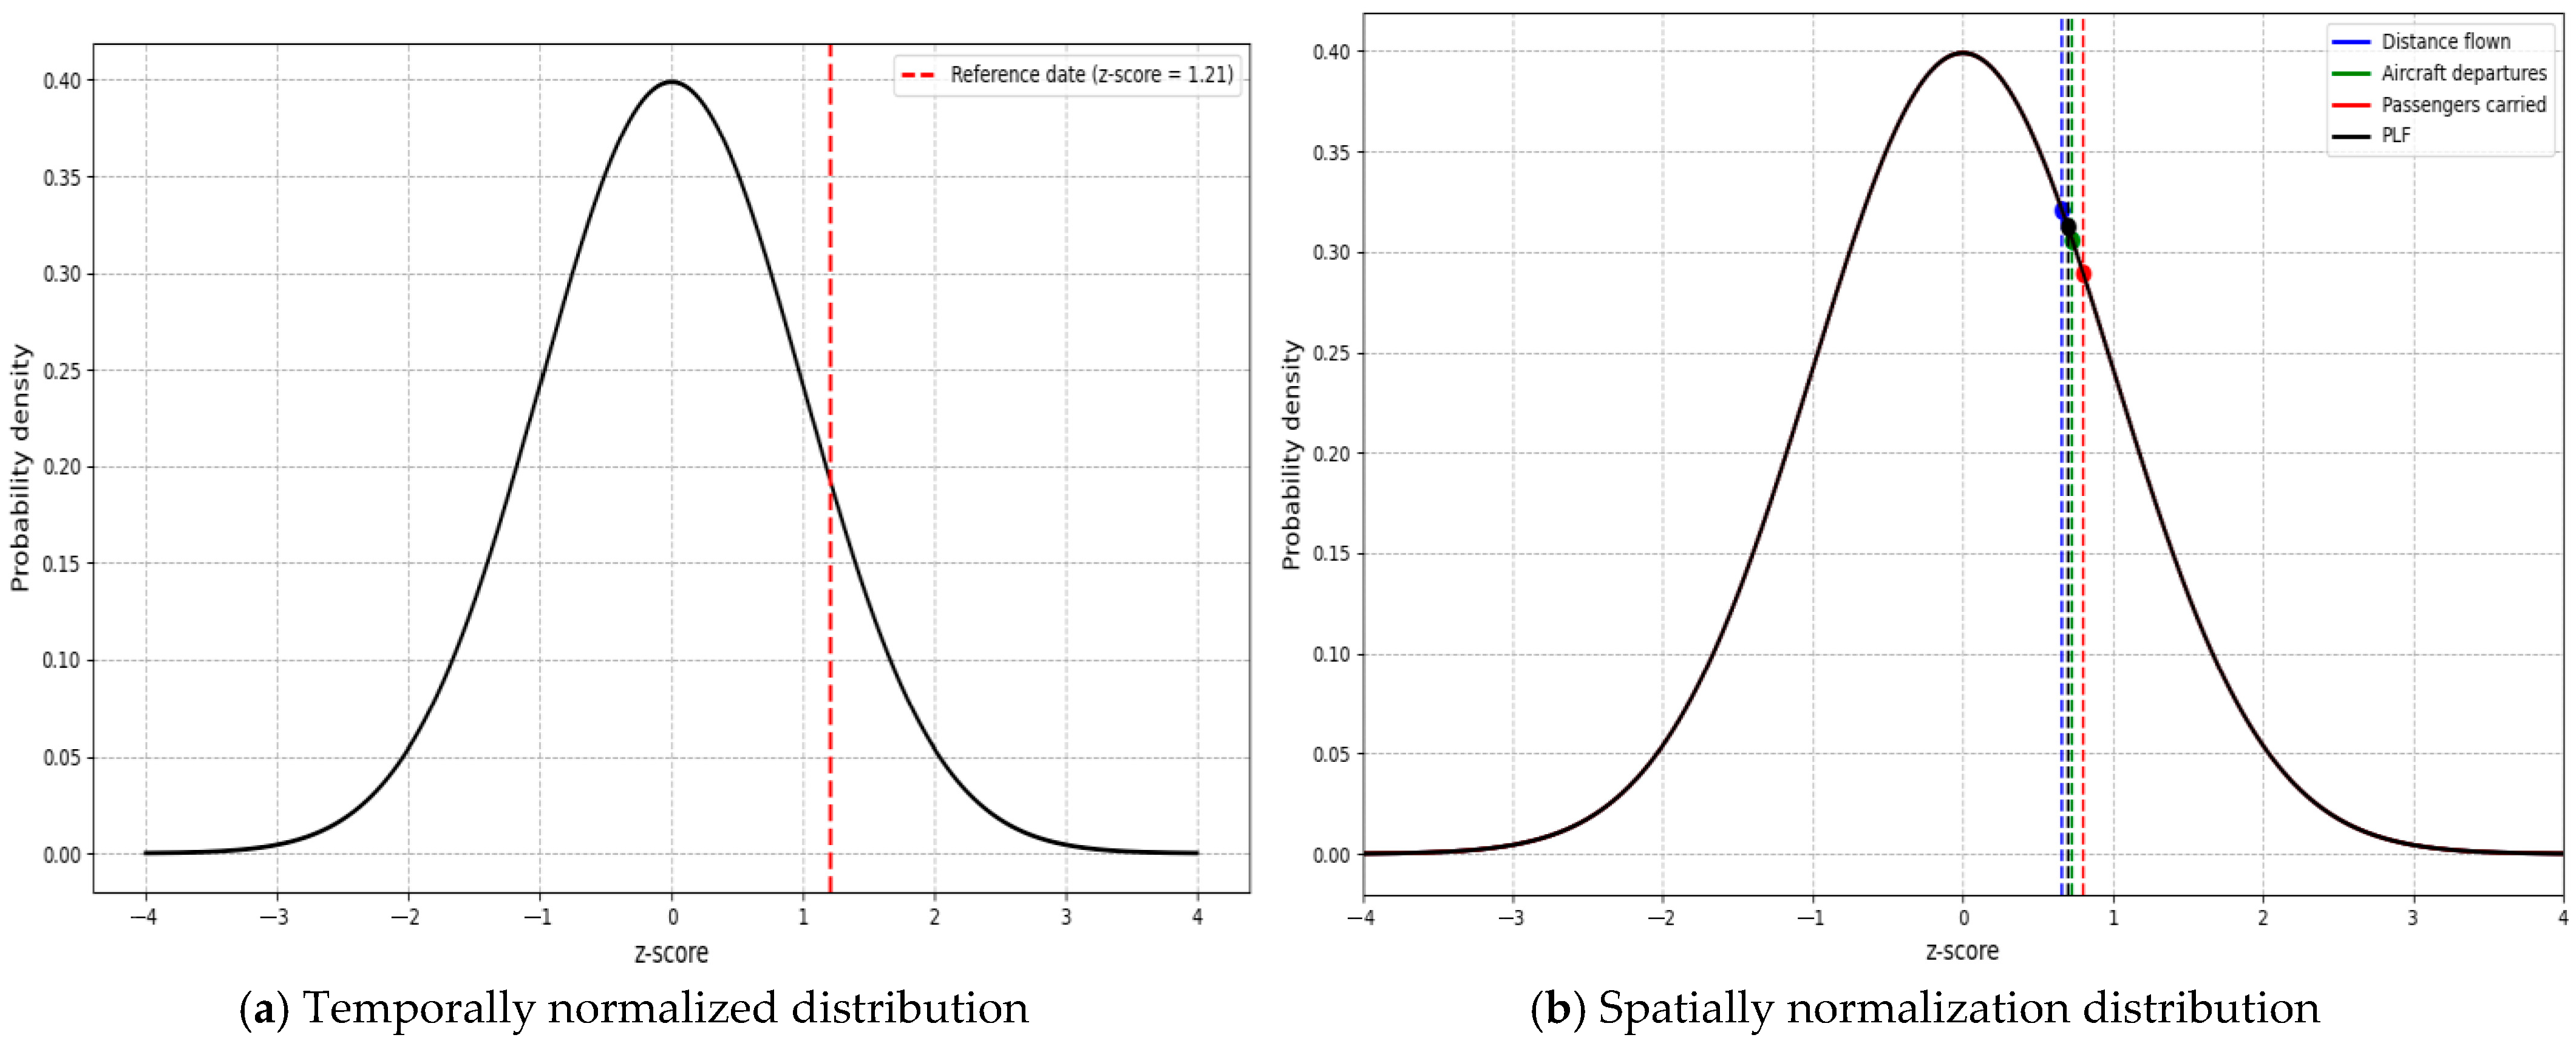
| ICAO Region | Distance Flown [NM] | Aircraft Departures | Passengers Carried | PLF [%] |
|---|---|---|---|---|
| Europe | 6,172,000,000 | 8,308,000 | 927,757,000 | 82.00 |
| Africa | 673,000,000 | 1,016,000 | 73,979,000 | 68.00 |
| Middle East | 1,651,000,000 | 1,228,000 | 186,705,000 | 76.00 |
| Asia and Pacific | 7,532,000,000 | 9,788,000 | 1,205,703,000 | 79.00 |
| North America | 7,370,000,000 | 10,817,000 | 878,458,000 | 84.00 |
| Latin America and the Caribbean | 1,557,000,000 | 2,859,000 | 260,172,000 | 79.00 |
| Total | 24,955,000,000 | 34,017,000 | 3,532,774,000 | 80.00 |
| ICEC | CERT | AEM | SET | |
|---|---|---|---|---|
| Operational cost (bn EUR) | 85.84 | 61.84 | 66.73 | 62.96 |
| Fuel burn (Mt) | 199.63 | 143.82 | 155.19 | 146.42 |
| Carbon dioxide (Mt) | 630.23 | 454.04 | 489.93 | 462.25 |
| Carbon monoxide (Mt) | 0.12 | 0.09 | 0.10 | 0.09 |
| Hydrocarbons (Mt) | 0.06 | 0.04 | 0.05 | 0.04 |
| Water vapour (Mt) | 245.74 | 177.04 | 191.97 | 180.24 |
| Nitrogen oxides (Mt) | 3.02 | 2.18 | 2.30 | 2.22 |
| Nitrous oxide (Mt) | 0.02 | 0.01 | 0.01 | 0.01 |
| Sulphur oxides (Mt) | 0.24 | 0.17 | 0.13 | 0.18 |
| Sulphur dioxide (Mt) | 0.17 | 0.12 | 0.13 | 0.12 |
| Particulate matter (Mt) | 0.01 | 0.01 | 0.01 | 0.01 |
| Black carbon (Mt) | 0.01 | ~ 0 | ~ 0 | ~ 0 |
| NMVOCs (Mt) | 0.23 | 0.17 | 0.18 | 0.17 |
| TOGs (Mt) | 0.20 | 0.15 | 0.16 | 0.15 |
Disclaimer/Publisher’s Note: The statements, opinions and data contained in all publications are solely those of the individual author(s) and contributor(s) and not of MDPI and/or the editor(s). MDPI and/or the editor(s) disclaim responsibility for any injury to people or property resulting from any ideas, methods, instructions or products referred to in the content. |
© 2025 by the authors. Licensee MDPI, Basel, Switzerland. This article is an open access article distributed under the terms and conditions of the Creative Commons Attribution (CC BY) license (https://creativecommons.org/licenses/by/4.0/).
Share and Cite
Rezo, Z.; Steiner, S.; Škurla Babić, R. Comparative Review of ICAO and EUROCONTROL Flight Carbon Emission Approximators. Sustainability 2025, 17, 6329. https://doi.org/10.3390/su17146329
Rezo Z, Steiner S, Škurla Babić R. Comparative Review of ICAO and EUROCONTROL Flight Carbon Emission Approximators. Sustainability. 2025; 17(14):6329. https://doi.org/10.3390/su17146329
Chicago/Turabian StyleRezo, Zvonimir, Sanja Steiner, and Ružica Škurla Babić. 2025. "Comparative Review of ICAO and EUROCONTROL Flight Carbon Emission Approximators" Sustainability 17, no. 14: 6329. https://doi.org/10.3390/su17146329
APA StyleRezo, Z., Steiner, S., & Škurla Babić, R. (2025). Comparative Review of ICAO and EUROCONTROL Flight Carbon Emission Approximators. Sustainability, 17(14), 6329. https://doi.org/10.3390/su17146329