Article

Optimal Strategies in a Manufacturer-Led Supply Chain Under Hybrid Carbon Policies and Retailer’s Fairness Concerns

1
School of Economics and Management, Hubei University of Technology, No. 28, Nanli Road, Hongshan District, Wuhan 430068, China
2
Hubei Development Research Center of Agricultural Equipment Manufacturing Industry, Wuhan 430068, China
*
Author to whom correspondence should be addressed.
Sustainability 2025, 17(14), 6309; https://doi.org/10.3390/su17146309
Submission received: 29 April 2025 / Revised: 15 June 2025 / Accepted: 7 July 2025 / Published: 9 July 2025

Abstract

Implementing hybrid carbon policies is crucial for supply chains’ low-carbon transition. However, the downstream retailer is often passive in low-carbon strategies, leading to fair issues that may influence the decision-making of channel members. Therefore, this study integrates green technology, remanufacturing, retailer’s fairness concerns, low-carbon preference, and hybrid carbon policies into a manufacturer-led supply chain through differential game theory. Then, the equilibrium solutions for each member are analyzed under the centralized case and decentralized case involving a cost-sharing contract for low-carbon promotion. Our results show that centralized decision-making can optimize both the economic and environmental performances of channel members; retailer’s fairness concerns can enhance low-carbon promotional efforts and the cost-sharing ratio for such initiatives, but do not impact low-carbon production efforts. Additionally, a threshold exists on the relationship between retailer’s fairness concerns and the cost-sharing ratio; increased low-carbon preference motivates more efforts in low-carbon production and promotion. Moreover, stricter carbon policies motivate the manufacturer to increase low-carbon efforts, but the retailer tailors its low-carbon promotional strategy according to the unit carbon emissions of products to maintain an adequate level of low-carbon goodwill.

1. Introduction

The environment and ecological stability are facing a significant threat from global warming. A primary contributor to global warming is the significant greenhouse gas (GHG) emissions from human activities, especially CO2 [1]. Since the industrial and transportation sectors are the biggest emitters of GHG emissions, major global carbon emissions stem from supply chain operations including manufacturing, inventory storage, freight transportation, logistics, and warehousing [2]. Therefore, it is urgent to promote the low-carbon transformation of supply chains.
Consequently, governments worldwide have implemented carbon-control policies such as carbon taxes and cap-and-trade systems. As a market-driven approach to reducing industrial and supply chain emissions, cap-and-trade systems have been widely adopted by major economies, including the European Union (EU Emissions Trading System), China (national ETS), and select U.S. states (e.g., California’s CAT program). Specifically, the cap-and-trade mechanism sets a cap on carbon emissions for different industries and allocates allowances to designated firms. Firms that emit less than their allocated allowances can sell surplus credits to those exceeding their limits [3,4]. Therefore, firms are spurred to reduce emissions through the market-driven pricing of carbon allowances that link environmental performance with financial outcomes [5]. Moreover, the government can adjust the cap and the price of carbon permits to influence corporate behavior, helping to effectively control and reduce overall emissions [6,7]. However, since the cap is fixed rather than the price, enterprises may encounter disruptions to their consistent operations owing to fluctuations in the carbon permit market influenced by weather and economic factors [8,9]. In contrast, a carbon tax would set a fixed price for carbon emissions, reducing uncertainty and encouraging operational adjustments [10]. Therefore, a mix of a carbon tax mechanism and a carbon emissions trading system would further incentivize companies to cut emissions [11]. In fact, hybrid carbon policies that concurrently implement cap-and-trade systems and carbon taxes have been adopted by several jurisdictions in the world, such as Switzerland, France, and Canada [12]. These empirical cases collectively demonstrate a unified policy paradigm: under well-designed regulatory boundaries, carbon markets and carbon taxes can function as complementary instruments, generating synergistic effects to optimize emission mitigation outcomes.
Green products tend to command a premium price from consumers with a low-carbon preference [13,14]. The “2024 China Sustainable Consumption Report” reveals that over 87% of respondents have incorporated low-carbon practices into their daily lives, prioritizing product performance, including responsible sourcing, low-carbon features, recycling systems, and resource circulation (Source: https://www.jiemian.com/article/12138572.html, accessed on 23 December 2024). As demand for low-carbon products rises, firms’ profits, production methods, and low-carbon strategies are increasingly impacted [15]. Additionally, improving products’ low-carbon goodwill (the reputation of products among consumers with a low-carbon preference) relies on the effectiveness of minimizing carbon emissions and mitigating environmental pollution [16]. To meet carbon regulations and market demand, channel members have to implement low-carbon operations, including green technology and eco-friendly materials [17]. Additionally, recycling and remanufacturing are crucial for a circular economy, reducing pressure on resources, the environment, and economic benefits [18,19]. Specifically, a potential method to reduce emissions is to implement the “resource–production–consumption–recycling–reproduction–reconsumption” mode in the supply chain [20]. Therefore, green technology and remanufacturing must be integrated into manufacturing for supply chains to undergo a low-carbon transition. For example, JD.com is committed to becoming a leader in energy conservation and emissions reduction by using eco-friendly technologies in its logistics and warehouse operations, such as automation and smart delivery systems. Additionally, its Green Logistics initiative also promotes the recycling and reuse of packaging in e-commerce and express delivery (Source: https://www.jdl.com/green, accessed on 25 December 2024). Similarly, BYD, a leading Chinese automaker specializing in electric vehicles (EVs) and hybrid cars, focuses on minimizing carbon emissions and energy consumption. The company also emphasizes battery recycling and repurposing, reducing waste by reusing valuable components in new products or processes (Source: https://www.bydglobal.com/cn/OurFuture.html, accessed on 5 January 2025). Retailers, too, can influence profitability through effective promotional strategies [21]. JD.com, for instance, has launched “Green Shopping Festivals” to promote energy-efficient products from brands like Haier, Midea, and BYD, offering discounts and trade-in programs to encourage consumers to buy sustainable products (Source: https://sw.wuhan.gov.cn/xwdt/gzdt/202407/t20240722_2431644.shtml, accessed on 5 January 2025).
While collaboration between partners can drive environmental improvements within the supply chain [22], retailers are often hesitant to engage in low-carbon marketing due to their general exemption from emissions regulation. As a result, a low-carbon promotion cost-sharing contract is commonly used for coordination [23]. In reality, manufacturers with market dominance often influence the low-carbon practices of businesses [24]. For example, the first “fluorine-free variable-frequency air conditioning low-carbon industrial chain” was created in 2010 by Haier in collaboration with eight vendors. Similarly, Coca-Cola collaborates with upstream companies to promote eco-friendly technologies and materials that reduce carbon emissions. Manufacturers, especially those in dominant positions, typically make decisions that favor their interests. Conversely, downstream retailers, as followers, often accept these decisions passively. In some cases, manufacturers may increase the wholesale prices of green products or impose high costs on retailers for carbon emissions reduction, leading to perceptions of unfairness that can negatively affect the development of manufacturers in the long term. Therefore, addressing fairness concerns in decision-making helps equitably distribute the benefits of channel members and promotes a successful low-carbon transition [25]. Consequently, the following retailer, at a disadvantaged position, should consider the fairness of its own profit compared to the leading manufacturer in the decision-making.
Many existing studies focus on the emissions reduction strategies in the supply chain under cap-and-trade regulation or carbon tax policy. There is some literature that has investigated how hybrid carbon policies influence the supply chain members’ emissions reduction decisions [26,27,28]. Additionally, there are also some studies about the impact of fairness concerns on the decisions and coordination in the supply chain [23,29,30,31]. However, none of them have considered fairness concerns and hybrid carbon policies within a common framework to analyze the decision-making in the supply chain.
Based on the above factors, this study integrates green technology, remanufacturing, retailer’s fairness concerns, low-carbon preference, and hybrid carbon policies into a manufacturer-led supply chain through differential game theory (given that the formation of low-carbon goodwill is a dynamic and long-term process, it is practical to apply the differential game theory). Then, two-stage Stackelberg models are established to answer the following questions:
(1)
What is the optimal strategy for the manufacturer’s efforts in green technology and remanufacturing, as well as the retailer’s effort in low-carbon promotion, considering low-carbon preference, hybrid carbon policies, and retailer’s fairness concerns?
(2)
How do hybrid carbon policies, retailer’s fairness concerns, and low-carbon preference influence the optimal strategies utilized by supply chain participants?
(3)
How can the downstream retailer with fairness concerns collaborate more effectively with the leading manufacturer to promote low-carbon initiatives?
The key contributions of this study comprise three points. First, we originally employ the differential game theory to analyze the optimal strategies on low-carbon operations, including green technology, remanufacturing, and promotion under hybrid carbon policies and retailer’s fairness concerns. Second, we analyze the influence of hybrid carbon policies, retailer’s fairness concerns, and low-carbon preference on the decision-making in the supply chain. Third, we propose a cost-sharing contract for promoting low-carbon products to better coordinate a manufacturer-led supply chain and analyze effective collaboration between channel members. The conclusions and research idea of this paper can provide a supplement and expand the prior research and lay a basis for the low-carbon transformation of the supply chain. Additionally, the managerial insights give feasible suggestions for the government and supply chain businesses to achieve the goal of emissions reduction.
The subsequent outline delineates the structure of this study: Section 2 reviews the literature on green technology and remanufacturing under carbon policies, as well as fairness concerns. Section 3 outlines the real problem that we study and presents the key assumptions. Section 4 introduces the differential game model and analyzes the equilibrium solutions in both decentralized and centralized scenarios. Section 5 conducts the comparative and sensitivity analyses. Section 6 presents a numerical analysis that highlights the main findings. Finally, Section 7 concludes the study, offering managerial insights and discussing research limitations. All proofs of the proposition and corollary are offered in Appendix A.

2. Literature Review

Carbon tax and cap-and-trade policies are the subject of this research, and the key literature on them are reviewed. First, we examine the relevant research on low-carbon operations, including green technology and remanufacturing, as well as fairness concerns. We then compare our study with previous research to highlight its necessity and significance.
The implementation of carbon policies requires channel members to adjust their operations to meet emission standards and significantly affects their decision-making [26]. Due to carbon regulations, the companies’ emissions reduction objectives rely on low-carbon operations, including green technology and remanufacturing [6,27,32,33,34]. For instance, Krass et al. [35] developed a profit-maximizing model for a monopolistic enterprise that selects green technologies based on price-dependent demand under environmental taxes. They found that while an initial increase in carbon taxes can encourage firms to adopt more sustainable technologies, further increases beyond a certain threshold may push firms to implement less sustainable options. Luo et al. [36] examined optimal manufacturing and remanufacturing strategies in a closed-loop supply chain under carbon tax, using four game-theoretic models. Their findings suggest that while carbon taxes effectively motivate the application of low-carbon technology and remanufacturing, excessively high taxes hinder remanufacturing unless carefully designed. Other studies have also investigated these strategies under cap-and-trade policy. For example, Yang et al. [37] analyzed the optimal collection mode for remanufacturing under cap-and-trade policy, evaluating how cost savings from remanufacturing, carbon emission factors, and collection mode choices impact emissions reduction and profits. Under cap-and-trade policy, Li et al. [23] investigated impacts that government subsidies have on investments in green technology and marketing strategies for supply chains and found that, although the effectiveness of fixed-cost and emission-reduction subsidies vary, both types improve supply chain coordination and incentive investments in green technologies. Moreover, Cheng et al. [27] established an optimization model for an economically constrained closed-loop supply chain network involving both low- and high-emission manufacturers under a mix of carbon tax and cap-and-trade regulation, and indicate that emission constraints can incentivize green investment, and reverse channels enhance resource utilization but reduce profits. Zhu et al. [26] examined the influences of different coordination contracts on collaborative emissions reduction strategies considering mixed carbon policies. They found that noncooperation results in inefficiency, and improving coordination and reducing carbon emissions can be attained most effectively through a bilateral cost-sharing contract.
Most studies rely on the “homo economicus” assumption, which asserts that individuals making decisions are rational and driven by self-interest. However, this assumption often leads to a gap between the optimal theoretical decisions of a company and its actual decisions [38]. Additionally, research has shown that decision-makers also consider fairness concerns [39,40,41]. Fairness concerns across the supply chain have been extensively researched, including pricing strategies [29] and green product production [30,42]. Recent research has focused on supply chain coordination to promote low-carbon transition, with particular emphasis on fairness in cost-sharing contracts [24,31,43]. Zhou et al. [24] showed that under certain cases, retailers’ fairness concerns affect the efficacy of promotions and cost-sharing collaborations for emissions reduction. Wang et al. [31] investigated coordination in a low-carbon supply chain led by a retailer with altruistic preferences and proposed that cost-sharing contracts considering altruistic preferences are conducible to fostering collaboration in emissions reduction. Yang et al. [43] evaluated the impact of retailer’s fairness concerns on strategies for green products in a pre-sale model, emphasizing the importance of fairness concerns and the pre-sale model for effective green product promotion and coordination.
Table 1 positions our study within the current literature and highlights existing research gaps. First, most studies focused on the effects of individual carbon policy on the low-carbon strategies of channel members. While some research considered fairness concerns, remanufacturing or carbon policies for emissions reduction were not included. In contrast, our study integrates hybrid carbon policies and retailer’s fairness concerns, as well as remanufacturing, into a differential game model. Second, we propose that consumers with a low-carbon preference motivate low-carbon production, and the leading manufacturer is prepared to use a cost-sharing contract for low-carbon marketing. Third, we investigate the optimal strategies for green technology, remanufacturing, and promotion in a long-term dynamic way. Additionally, we examine the impact of hybrid carbon policies, retailer’s fairness concerns, and low-carbon preferences on the optimal strategies of channel members.

3. Problem Description

This study identifies the manufacturer as the leader, responsible for key decisions such as low-carbon operations and wholesale pricing. Then, the downstream retailer determines promotion efforts and sales strategies according to the manufacturer’s strategies [43,44]. Under hybrid carbon policies, there is a carbon tax (s) on unit carbon emissions of the manufacturer’s products. Additionally, if the allocated carbon emissions rights (E) for the manufacturer are in surplus or deficit, they can be traded at the market price (g) for sale or purchase. Driven by these policies, the manufacturer has to use green technology in production and recycle discarded products for remanufacturing. As consumers’ demand for low-carbon products rises, the manufacturer is incentivized to enhance efforts in low-carbon production. Then, the downstream retailer purchases these products at a wholesale price. During sales, the retailer can enhance product demand by marketing its low-carbon products through promotional strategies. Therefore, the manufacturer has an incentive to subsidize part of the retailer’s low-carbon promotional costs for securing a large market share. However, the low-carbon marketing and cost-sharing strategies are influenced by the retailer’s concerns on the fairness of its own profit compared to the manufacturer. Figure 1 illustrates the framework of the supply chain.
To develop a differential game model, we define notations for the variables and clarify important assumptions. Specifically, the decision variables for the manufacturer involve the emissions reduction from the green technology effort and recycling effort for remanufacturing, while the retailer’s decision variable includes the low-carbon promotional effort. Then, we treat the low-carbon goodwill as a state variable. Table 2 summarizes the relevant parameters and variables.
Five key assumptions are given below.
Assumption 1.
For the manufacturer, costs are incurred from utilizing green technology and recycling used products for remanufacturing. For the retailer, the primary cost is the low-carbon promotion effort. Following previous research [45,46], the cost functions at time t, which include these costs, can be expressed as follows:
C e m ( t ) = k e m 2 ( t ) 2 , C τ ( t ) = l τ 2 ( t ) 2 , C u ( t ) = f u 2 ( t ) 2
where k > 0 means the investment cost coefficient of green technology; l > 0 means the investment cost coefficient of recycling; and f > 0 means the investment cost coefficient of low-carbon promotion.
Assumption 2.
Recycled products can be remanufactured into new products. Similar to Cheng et al. [27], as new and remanufactured products are considered the same quality, they share the same prices in the market demand. Since remanufactured products save significant energy and new materials [47], we have Cm > Cr and Em > Er. Moreover, the unit production costs, involving the carbon tax for new or remanufactured products, are defined as follows:
C m + s E m   a n d   C r + s E r
where Cm represents the unit production cost of new products; Cr represents the unit production cost of remanufactured products; sEm represents the unit carbon tax cost of new products; and sEr represents the unit carbon tax cost of remanufactured products. For calculation, the Cm and Cr are assigned as 0, because the unit production cost of brand-new products and remanufactured products still satisfies sEm > sEr which can represent the cost-saving characteristics of remanufacturing [26]. Furthermore, following the framework established by Govindan and Popiuc [48], the recycling function is defined as follows:
D r ( t ) = A 0 + h τ ( t )
where A0 is the initial value of recycling, and the influence coefficient of the recycling effort is represented by h, where h > 0. In order to simplify the calculation, we assume that A0 = 0 and the new product demand quantity is much greater than the remanufactured product demand quantity.
Assumption 3.
Since the rise in product demand correlates directly with the total growth in carbon emissions [49], the carbon emissions surplus through efforts in green technology and remanufacturing can be defined as follows:
E S ( t ) = E a l l o c a t e d   c a r b o n   e m i s s i o n   r i g h t s E m D ( t ) t o t a l   e m i s s i o n s   w i t h o u t e m i s s i o n   r e d u c t i o n e m ( t ) e m i s s i o n   r e d u c t i o n f r o m   g r e e n   t e c h n o l o g y Δ D r ( t ) e m i s s i o n   r e d u c t i o n f r o m   r e m a n u f a c t u r i n g
where ES(t) means the carbon emissions surplus; E means the allocated carbon emissions rights for the manufacturer; D(t) represents the product demand in the market; and  Δ = E m E r > 0  denotes the amount of carbon emissions saved per product through remanufacturing. To simplify the calculation, em(t) is treated as a decision variable, representing the emissions reduction from the green technology effort [28]. Additionally, the low-carbon reputation of products is positively influenced by promotions [50,51]. According to Nerlove and Arrow [52], the evolution of low-carbon goodwill can be described as follows:
G ( t ) · = μ E S ( t ) + γ u ( t ) δ G ( t ) = μ E E m D ( t ) + e m ( t ) + Δ D r ( t ) + γ u ( t ) δ G ( t )
where μ > 0 means the impact coefficient of the carbon emissions surplus; γ > 0 means the impact coefficient of low-carbon promotion; δ > 0 means the decay rate of low-carbon goodwill; and G ( 0 ) = G 0 > 0 means the initial value of low-carbon goodwill.
Assumption 4.
Due to the complexity of the equilibrium solution, we adopt the assumption from prior research that the wholesale price and sale price of products are fixed parameters [24,26,30,31,53,54]. Additionally, consumer purchasing decisions are influenced by sales prices and the low-carbon goodwill of products. According to Ouardighi and Pasin [55], the product demand function is defined as follows:
D ( t ) = b G ( t ) ( Q a P )
where a means the influence coefficient of the sale price of products; b means the influence coefficient of the low-carbon goodwill of products; and Q denotesthe market size of products. Additionally, b reflects the level of low-carbon preference.
Assumption 5.
To improve product demand, the manufacturer chooses to cover a share of the retailer’s expenses on low-carbon promotion, denoted by θ, where 0 < θ < 1. In addition, the downstream retailer always considers the fairness of its own profit compared to the upstream manufacturer in decision-making.
Letting JM be the profit function of the manufacturer, letting JR be the profit function of the retailer, letting UR be the retailer’s fair utility function, and σ be the coefficient of fairness concerns, the retailer’s utility function is expressed as follows:
U R = J R σ ( J M J R ) , w h e r e   σ 0 .
The manufacturer and the retailer’s profit functions are outlined below:
J M = D ( t ) W D ( t ) s E m + s e m ( t ) + Δ D r ( t ) + g E S ( t ) C e m ( t ) C τ ( t ) θ C u ( t )
J R = D ( t ) ( P W ) ( 1 θ ) C u ( t )

4. Model and Results

4.1. Case D: Decentralized Decision-Making

In Case D, which incorporates a cost-sharing contract for low-carbon promotion, each channel member collaborates in emissions reduction. Specifically, the manufacturer initially establishes optimal strategies in green technology and remanufacturing, along with the cost-sharing for low-carbon marketing. Then, the retailer evaluates the fairness of its own profit compared to the manufacturer and decides the level of promotional efforts to optimize its utility. Assuming ρ represents the discount factor, the objective functions for the manufacturer and the retailer over an infinite time horizon are expressed below:
m a x e m , τ , θ J M * = 0 e ρ t D ( t ) W D ( t ) s E m + s e m ( t ) + Δ D r ( t ) + g E S ( t ) C e m ( t ) C τ ( t ) θ C u ( t ) d t
m a x u U R * = 0 e ρ t J R σ ( J M J R ) d t
Substituting Equation (8) and Equation (9) into Equation (11) and arranging them yields the following:
m a x u U R * = 0 e ρ t D ( t ) ( P W ) ( 1 θ ) C u ( t ) σ D ( t ) ( 2 W P ) D ( t ) s E m + s e m ( t ) + s Δ D r ( t ) + g E S ( t ) C e m ( t ) C τ ( t ) + ( 1 2 θ ) C u ( t ) d t
According to optimal control theory, each member in the game encounters the same situation at any given period in an infinite time horizon. Because deriving the equilibrium solution of dynamic parameters is complex, we omit the time variable t when writing the relevant parameters below. For convenience, we denote VM and VR as the value functions of the manufacturer and the retailer, respectively. Therefore, the corresponding Hamiltonian–Jacobi–Bellman (HJB) equations can be expressed as follows:
ρ V M = m a x e m , τ , θ b G ( Q a P ) ( W s E m ) + s ( e m + Δ h τ ) + g E S ( t ) k e m 2 2 l τ 2 2 θ f u 2 2 + V M G μ ( E T ) + γ u δ G
ρ V R = m a x u b G ( Q a P ) ( P W ) ( 1 θ ) f u 2 2 σ b G ( Q a P ) ( 2 W P s E m ) + s ( e m + Δ h τ ) + g E S ( t ) k e m 2 2 l τ 2 2 + ( 1 2 θ ) f u 2 2 ] + V R G μ ( E T ) + γ u δ G
We use the inverse induction method to obtain the optimal strategies of channel members in Case D, which are presented in Proposition 1 (proofs are listed in Appendix A).
Proposition 1.
The equilibrium solutions of channel members in Case D, with a low-carbon promotion cost-sharing contract, are delineated from a long-term and dynamic viewpoint as follows:
(1) The equilibrium solution for channel members is outlined below:
τ * = Δ h ( ρ + δ ) ( g + s ) + b μ W ( Q a P ) l ( ρ + δ + Q b μ E m a P b μ E m )
θ * = ( σ + 1 ) 3 W P ( 2 + 5 σ ) ( g + s ) E m + ( 6 W P ) σ ( 2 σ + 1 ) P + W ( 2 + 3 σ ) ( g + s ) E m + ( P + 2 W ) σ
u * = b γ ( Q a P ) P + W ( 2 + 3 σ ) ( g + s ) E m + ( P + 2 W ) σ 2 f ( σ + 1 ) ( ρ + δ + Q b μ E m a p b μ E m )
(2) The trajectory of the optimal low-carbon goodwill state can be outlined below:
G ( t ) = G * + e A t ( G 0 G * )
where A = Q b μ E m a P b μ E m + δ > 0 , and G * = μ ( E + e m * + Δ h τ * ) + γ u * A ;
(3) The channel members’ optimal utilities are as follows:
J M * = m 1 G + n 1 , U R * = m 2 G * + n 2
The values of m1, m2, n1, and n2 are as follows:
m 1 = b ( Q a P ) W ( g + s ) E m δ + ρ + ( Q a P ) b μ E m
m 2 = b ( Q a P ) P W + ( P 2 W ) σ + ( g + s ) σ E m δ + ρ + ( Q a P ) b μ E m
n 1 = ( l + k Δ 2 h 2 ) ( μ m 1 + g + s ) 2 2 k l ρ + ( g + μ m 1 ) E ρ + γ 2 m 2 + m 1 ( 2 + 4 σ ) 2 8 f ρ ( σ + 1 ) ( 2 σ + 1 )
n 2 = μ ( σ m 1 + 2 m 2 ) ( g + s ) σ ( l + k Δ 2 h 2 ) ( μ m 1 + g + s ) 2 k l ρ + ( μ m 2 g σ ) E ρ + γ 2 m 2 m 2 + m 1 ( 4 σ + 2 ) 4 f ρ ( σ + 1 )
Specific conditions must be satisfied for θ * ( 0 , σ + 1 2 σ + 1 ) , specifically: σ < P W 2 W P ( g + s ) E m , 2 W > P + ( g + s ) E m , and P > W > ( g + s ) E m . The significance of these conditions will be further discussed in the inference section.

4.2. Case C: Centralized Decision-Making

In Case C, the entire chain’s enhancements in environmental and economic outcomes can be realized via the amalgamation of channel members. Additionally, retailer’s fairness concerns do not influence decisions made by channel members in Case C, because only decisions involving the distribution of income among channel members are subject to fairness concerns [30]. According to Equation (8) and Equation (9), to maximize the chain’s long-term and dynamic profits, the manufacturer focuses on green technology and remanufacturing, while the retailer put efforts in promoting low-carbon products. Assuming uniformity in the discount factor ρ (where ρ > 0) for each channel member, the entire chain’s objective function over an infinite time horizon can be expressed below:
m a x e m , τ , u J S C C * = 0 e ρ t D ( t ) P D ( t ) s E m + s e m ( t ) + Δ D r ( t ) + g E S ( t ) C e m ( t ) C τ ( t ) C u ( t ) d t
The time variable t is omitted for simplicity, aligning with Case C. The variable VSC represents the entire chain’s value function in Case C, indicating the profits generated during the planned period. Therefore, the corresponding HJB equation can be expressed below:
ρ V S C = m a x e m , τ , u b G ( Q a P ) ( P s E m ) + s ( e m + Δ h τ ) + g E S ( t ) k e m 2 2 l τ 2 2 f u 2 2 + V S C G [ μ E S ( t ) + γ u δ G ]
The inverse induction approach is employed to solve the optimal strategies of channel members in Case C, which are outlined in Proposition 2 (see proofs in Appendix A).
Proposition 2.
The equilibrium solutions of channel members from a long-term and dynamic viewpoint in Case C can be delineated as follows:
(1) The optimal solution of channel members is listed below:
e m C * = ( ρ + δ ) ( g + s ) + b μ P ( Q a P ) k ( ρ + δ + Q b μ E m a P b μ E m )
τ C * = Δ h ( ρ + δ ) ( g + s ) + b μ P ( Q a P ) l ( ρ + δ + Q b μ E m a P b μ E m )
u C * = b γ ( Q a P ) P ( g + s ) E m f ( ρ + δ + Q b μ E m a P b μ E m )
(2) The trajectory of the optimal low-carbon goodwill state can be listed below:
G C ( t ) = G C * + e A t ( G 0 G C * )
where A = Q b μ E m a P b μ E m + δ > 0 , and G C * = μ ( E + e m C * + Δ h τ C * ) + γ u C * A ;
(3) The supply chain’s optimal profit is as follows:
J S C C * = m 3 G C * + n 3
The values of m3 and n3 are as follows:
m 3 = b ( Q a P ) P ( g + s ) E m δ + ρ + ( Q a P ) b μ E m
n 3 = ( l + k Δ 2 h 2 ) ( μ m 3 + g + s ) 2 2 k l ρ + ( g + μ m 3 ) E ρ + ( γ m 3 ) 2 2 f ρ

5. Comparative Analysis

First, the cost-sharing ratio for promoting low-carbon products and the correlation between it and retailer’s fairness concerns are both analyzed. Then, we compare the equilibrium solutions in Propositions 1 and 2 and examine the influences of hybrid carbon policies and low-carbon preference (denoted as s, g, and b) on green technology, remanufacturing, and low-carbon goodwill. Finally, we analyze and compare the profits in Case D and Case C.
Corollary 1.
Cost-sharing ratio for low-carbon promotion
(1) The equilibrium solution for the cost-sharing ratio for low-carbon promotion shows that, as the wholesale marginal profit increases, the manufacturer will be responsible for a larger portion of the low-carbon advertising expenses. In contrast, the cost-sharing ratio for low-carbon promotion will decrease as the retail price increases. Specifically, when W > ( σ + 1 ) P + ( 2 + 5 σ ) ( g + s ) E m 3 ( 2 σ + 1 ) , θ * > 0 , the manufacturer is prepared to bear the expenses of retailer’s low-carbon initiatives.
(2) The prior equilibrium solution demonstrates that manufacturer’s low-carbon endeavors remain uninfluenced by retailer’s fairness concerns. However, the retailer’s efforts in low-carbon promotional initiatives and the cost-sharing ratio for such initiatives are affected by its fairness concerns. Additionally, the relationship between the cost-sharing ratio for low-carbon promotion and retailer’s fairness concerns depends on specific values: P 2 ( σ + 1 ) 2 + 2 P W ( σ + 1 ) ( 2 σ + 1 ) and 3 W 2 ( 2 σ + 1 ) 2 + E m 2 ( g + s ) 2 ( 7 σ 2 + 4 σ ) + 2 E m ( g + s ) · P ( σ + 1 ) ( 3 σ + 2 ) + W ( 2 σ + 1 ) ( 5 σ + 2 )  If the former value is higher, the ratio of cost-sharing for low-carbon marketing will persist in increasing due to retailer’s growing fairness concerns. It occurs as the retailer seeks to enhance profits, hence expressing greater concerns over fairness to the upstream manufacturer and increasing the cost-sharing ratio. Conversely, if the former value is lower, the cost-sharing ratio for low-carbon initiatives will remain constant, even as the retailer’s fairness concerns rise.
Corollary 2.
Comparison of the equilibrium solutions in Cases D and C
(1) The total decrease in carbon emissions through green technology and recycling efforts is detailed as follows: e m * < e m C * τ * < τ C * ;
(2) The downstream retailer’s low-carbon promotional effort is satisfied as follows: u * < u C * , when ( σ + 1 ) P > ( 2 σ + 1 ) W + ( g + s ) σ E m ;
(3) The low-carbon goodwill obtained from low-carbon operations by both the manufacturer and retailer is satisfied as follows: G * < G C * ;
(4) The product demand is satisfied as follows: D * < D C * .
This corollary indicates that in Case C, the manufacturer makes more effort to allocate resources towards environmentally friendly production practices and low-carbon initiatives, in contrast to Case D. Additionally, the level of the retailer’s low-carbon promotional effort depends on the values of ( σ + 1 ) P and ( 2 σ + 1 ) W + ( g + s ) σ E m . When the former is larger, the retailer will be incentivized to implement low-carbon initiatives in Case C. Conversely, if the latter is larger, the retailer will have less of an incentive to promote low-carbon products in Case C. Moreover, the increased low-carbon goodwill results in a higher demand for products as a whole because of the positive correlation between the two variables. Therefore, centralized decision-making is more effective to promote the achievement of emissions reduction objectives and support the supply chain towards low-carbon transition.
Corollary 3.
Sensitivity analysis of major parameters
In Case D, we have e m * s = e m * g > 0 τ * s = τ * g > 0 u * s = u * g < 0 θ * s = θ * g < 0 e m * b > 0 τ * b > 0 u * b > 0 u * σ > 0 ;
In Case C, we have e m C * s = e m C * g > 0 τ C * s = τ C * g > 0 u C * s = u C * g < 0 e m C * b > 0 τ C * b > 0 u C * b > 0 .
Corollary 3 demonstrates that the retailer’s fairness concerns are a driving force of its low-carbon promotional efforts in Case D. Specifically, with retailer’s fairness concerns rising, a more proactive stance will be adopted to promote low-carbon products and increase consumers’ low-carbon preference. Subsequently, demand for such products will increase. However, this increased demand requires the manufacturer to put more efforts in low-carbon operations, which negatively impacts its profits but creates a chance to satisfy the retailer’s perspective on an acceptable revenue.
Both Case D and Case C reveal that the increased s or g motivates the manufacturer to intensify efforts in low-carbon operations, including green technology and remanufacturing. However, the retailer is expected to reduce its low-carbon promotional efforts in response to stricter hybrid carbon policies. If the retailer persists in increasing its low-carbon promotion efforts, the manufacturer will face substantial costs due to carbon emissions rights trading and carbon taxes resulting from the increased demand, leading to a decrease in the entire chain’s profits. Therefore, as hybrid carbon policies tighten, the retailer decreases low-carbon promotional efforts to maintain an adequate level of low-carbon goodwill and sustain product demand. Additionally, the increased b related to low-carbon goodwill will encourage the manufacturer to intensify low-carbon efforts and the retailer to actively engage in promoting low-carbon products. Therefore, collaborative decision-making on emissions reduction to increase low-carbon goodwill is essential for every member of the channel to achieve the goal of boosting overall profits.
Corollary 4.
Impacts of major parameters on low-carbon goodwill
In Case D, if 0 < E m < 2 f μ ( Δ 2 h 2 k + l ) ( δ + ρ ) ( σ + 1 ) b k l γ 2 ( Q a P ) ( 3 σ + 2 ) , we have G * s = G * g > 0 G C * s = G C * g > 0 ; If E m > 2 f μ ( Δ 2 h 2 k + l ) ( δ + ρ ) ( σ + 1 ) b k l γ 2 ( Q a P ) ( 3 σ + 2 ) , we have G * s = G * g < 0 G C * s = G C * g < 0 .
In Case C, if 0 < E m < f μ ( Δ 2 h 2 k + l ) ( δ + ρ ) b k l γ 2 ( Q a P ) , we have G * s = G * g > 0 G * s = G * g > 0 ; If E m > f μ ( Δ 2 h 2 k + l ) ( δ + ρ ) b k l γ 2 ( Q a P ) , we have G * s = G * g < 0 G C * s = G C * g < 0 .
Corollary 4 demonstrates that carbon emissions per unit of product (Em) determine how hybrid carbon regulations affect low-carbon goodwill. Specifically, when Em is low, an increase in either s or g will enhance the product’s low-carbon goodwill. When Em is high, an increase in s or g will decrease the product’s low-carbon goodwill. For products with high carbon emissions, because of the declined low-carbon goodwill, the decrease in demand for low-carbon goods allows the producer to save money on carbon emissions rights and cut down on carbon taxes. However, if there is no decline in low-carbon goodwill, the manufacturer will encounter challenges in effectively managing the rising expenses of carbon tax and carbon emissions rights trading.
Consistent with Corollary 3, the retailer uniformly implements identical adjustment strategies in response to the stricter carbon policies in Cases D and C. Therefore, low-carbon promotion by the retailer is the principal factor influencing the varying trends in low-carbon goodwill. Consistent with Zhu et al. [26], this discovery emphasizes the importance of the retailer as a moderator in a product’s low-carbon goodwill. Moreover, the manufacturer is supposed to attach great importance to the unit carbon emissions of products when planning strategies, and the retailer should tailor its low-carbon promotional strategies in accordance with Em to maintain an adequate level of low-carbon goodwill.
Corollary 5.
Comparison of profits in two cases
From the standpoint of the complete supply chain, J S C C * > J M * + J R * .
This corollary demonstrates that the aggregate profits in the supply chain of Case C surpass those of Case D. Additionally, the allocation of augmented profits is influenced by the position and bargaining power of each channel member; in Case C, the revenue gains of channel members surpass those in Case D. Therefore, it is essential to establish appropriate constraint mechanisms to encourage the producer and the retailer to accept centralized decision-making.
In summary, the manufacturer’s efforts in low-carbon operations in Case C surpass those in Case D, leading to higher profits in Case C. Specifically, improved carbon emissions reduction and better low-carbon goodwill can be achieved through the manufacturer’s low-carbon efforts in Case C, leading to optimization from both the economic and environmental viewpoints. Moreover, implementing certain constraints is essential to guarantee that both the manufacturer and the retailer are equipped to engage. These constraints can be represented as follows: Δ J R * = J R C * J R * > 0 .

6. Numerical Analysis

This part employs MATLAB R2021b to simulate the system, with an emphasis on the Case C and Case D products’ low-carbon goodwill trajectories. Our next step is to analyze how hybrid carbon policies and low-carbon preference affect low-carbon goodwill. Finally, we investigate the influence of retailer’s fairness concerns on low-carbon promotional efforts and the cost-sharing ratio for these initiatives. Data for this study were obtained from a survey conducted by an air conditioning manufacturer, as referenced in Zhu et al. [26]. The parameters used in the simulation include the following: P = 10, W = 6, Em = 0.2, Er = 0.05, h = 10, k = 40, l = 20, f = 13, a = 0.9, Q = 10, μ = 0.7, γ = 10, ρ = 0.8, b = 0.4, δ = 0.5, Δ = 0.15, s = 1, E = 20, and g = 6. Under the decentralized decision-making, we set σ = 0.7.

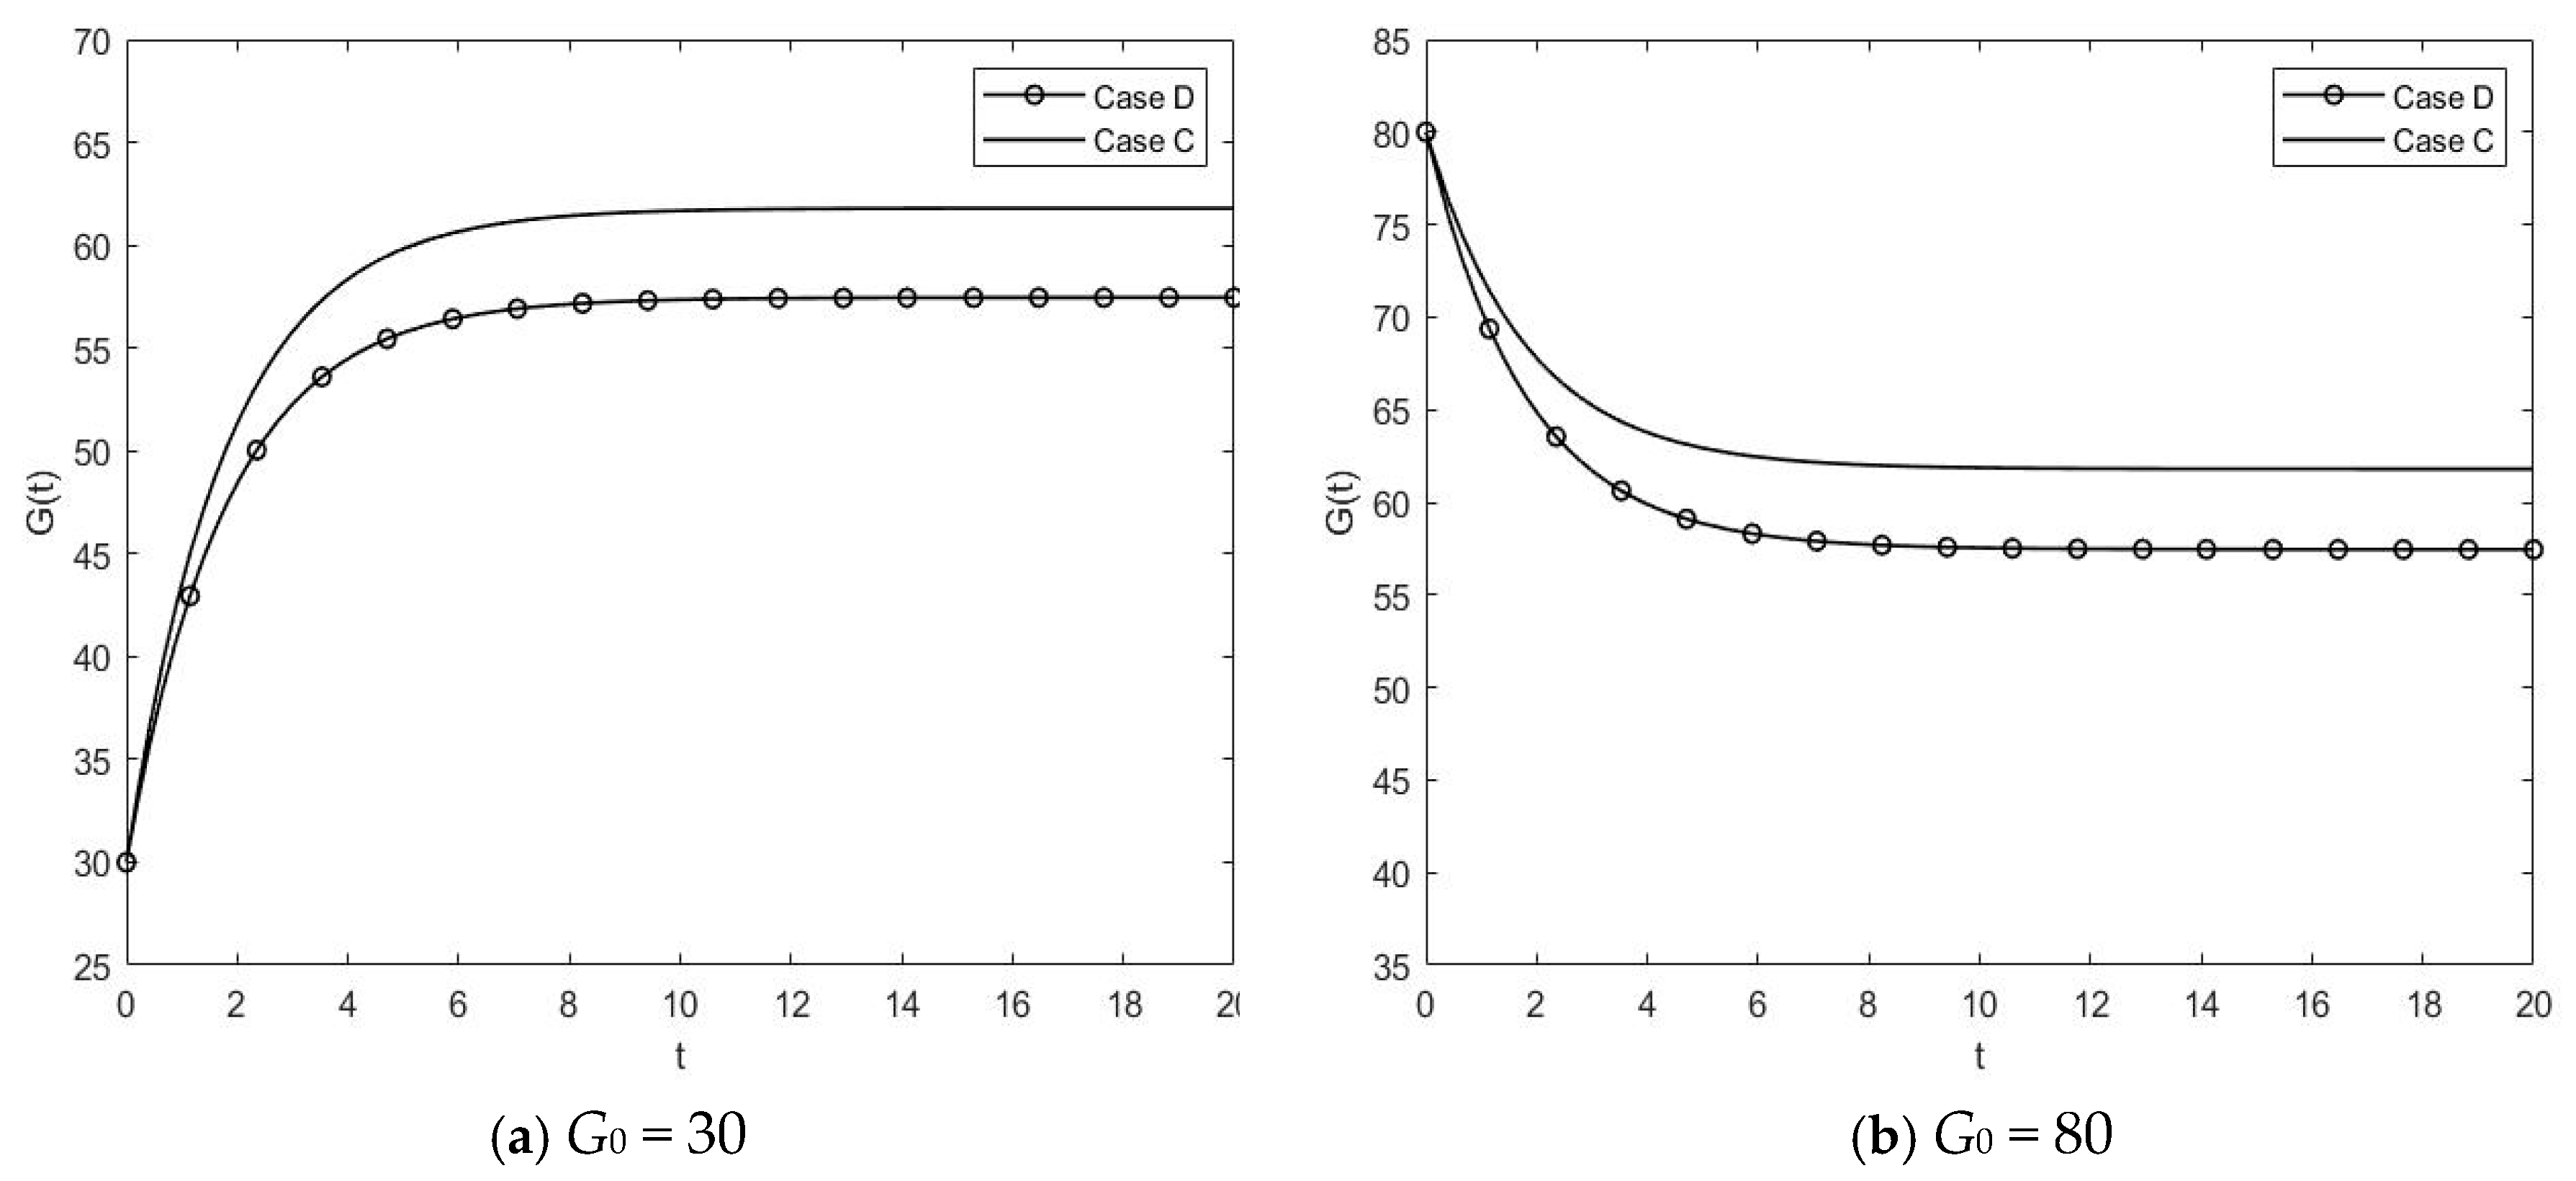
6.1. Trajectories of Low-Carbon Goodwill

Figure 2 depicts the trajectories of low-carbon goodwill, represented as G(t). In each scenario, G(t) is dictated by the beginning value G0. At a lower G0 level, low-carbon goodwill will increase and stabilize over time, as seen in Figure 2a. In contrast, when G0 is high, a considerable decline in low-carbon goodwill occurs, as seen in Figure 2b. As is illustrated by the relationship G C * > G * , a higher level of low-carbon goodwill occurs in Case C than Case D. Thus, the stable-condition value of low-carbon goodwill is contingent upon the specific decision-making case rather than the initial condition.

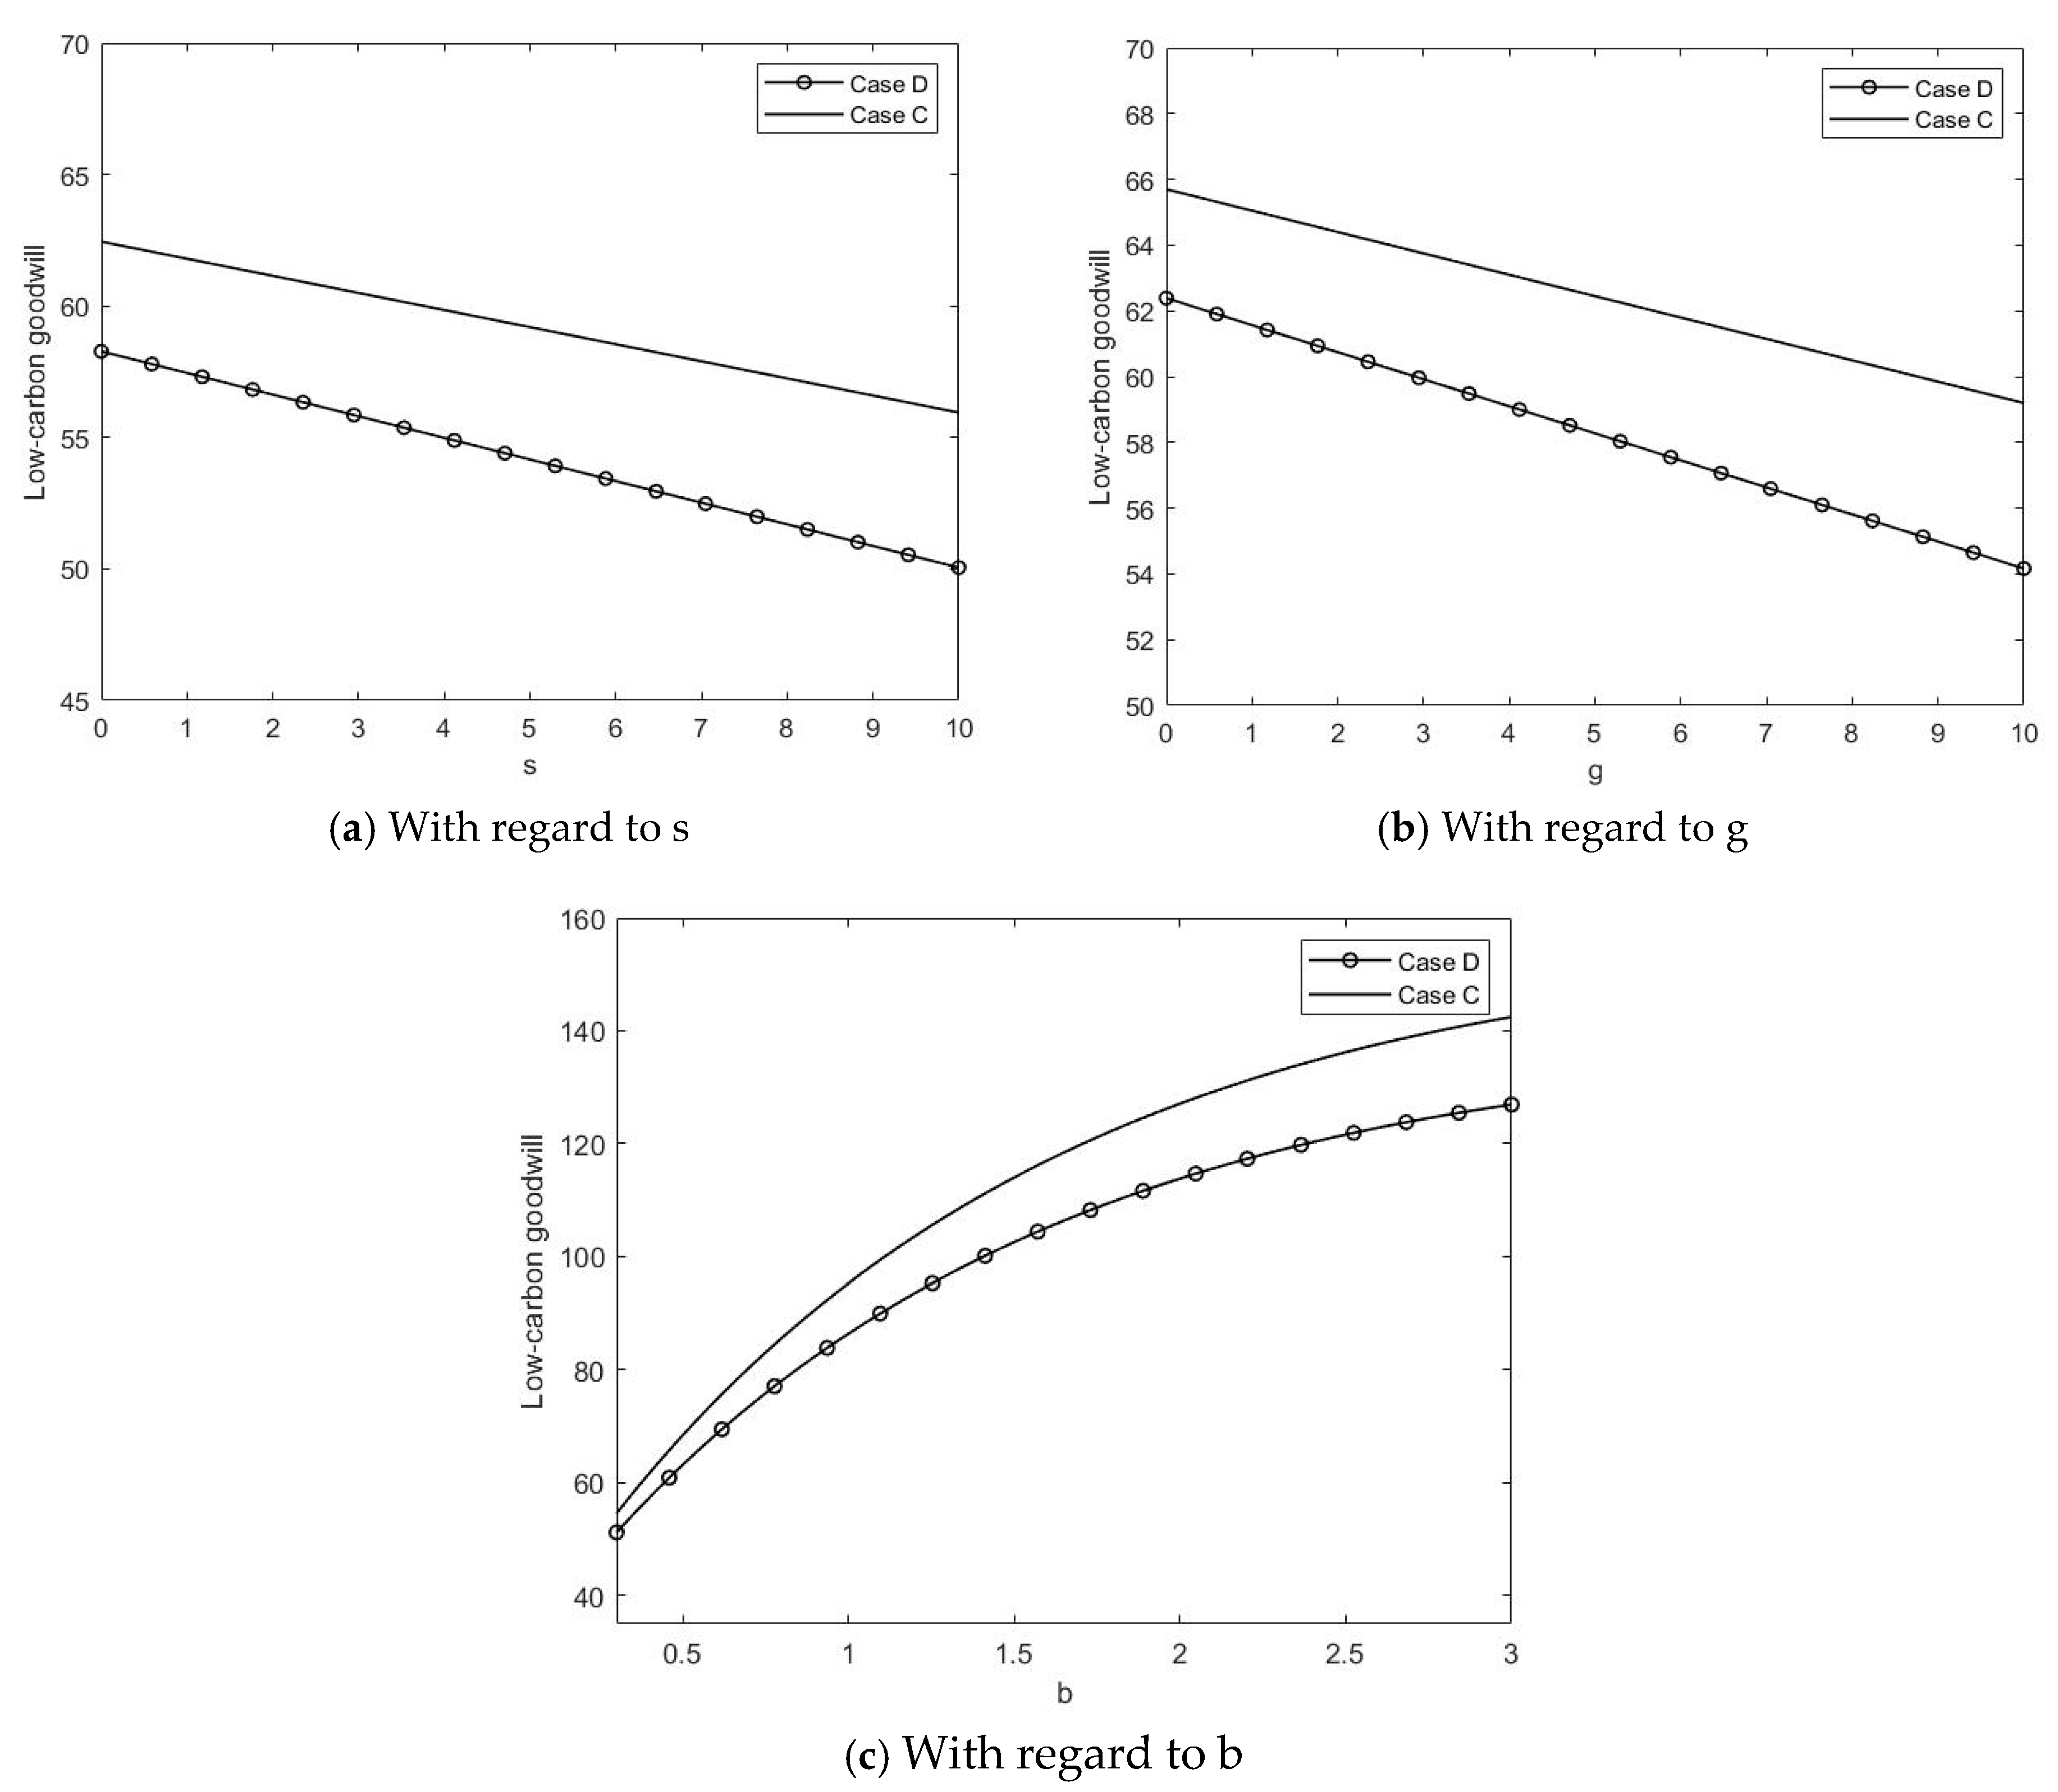
6.2. Impacts of Major Parameters on Low-Carbon Goodwill

Figure 3 demonstrates that the value of low-carbon goodwill in a stable condition is affected by hybrid carbon policies and low-carbon preference. First, we calculate the value of Em from the dataset. Because of E m > f μ ( Δ 2 h 2 k + l ) ( δ + ρ ) b k l γ 2 ( Q a P ) , Figure 3a,b indicates that low-carbon goodwill decreases as s or g rises in both Case D and Case C. Meanwhile, the retailer as a moderator has an important impact on managing low-carbon goodwill. Then, as Figure 3c indicates, an increased low-carbon preference encourages channel members to put more efforts in low-carbon production and promotion, fostering strong low-carbon goodwill. Therefore, these results valid the findings in Corollary 4 and underscore the importance of collaboration between supply chain members to improve low-carbon goodwill.

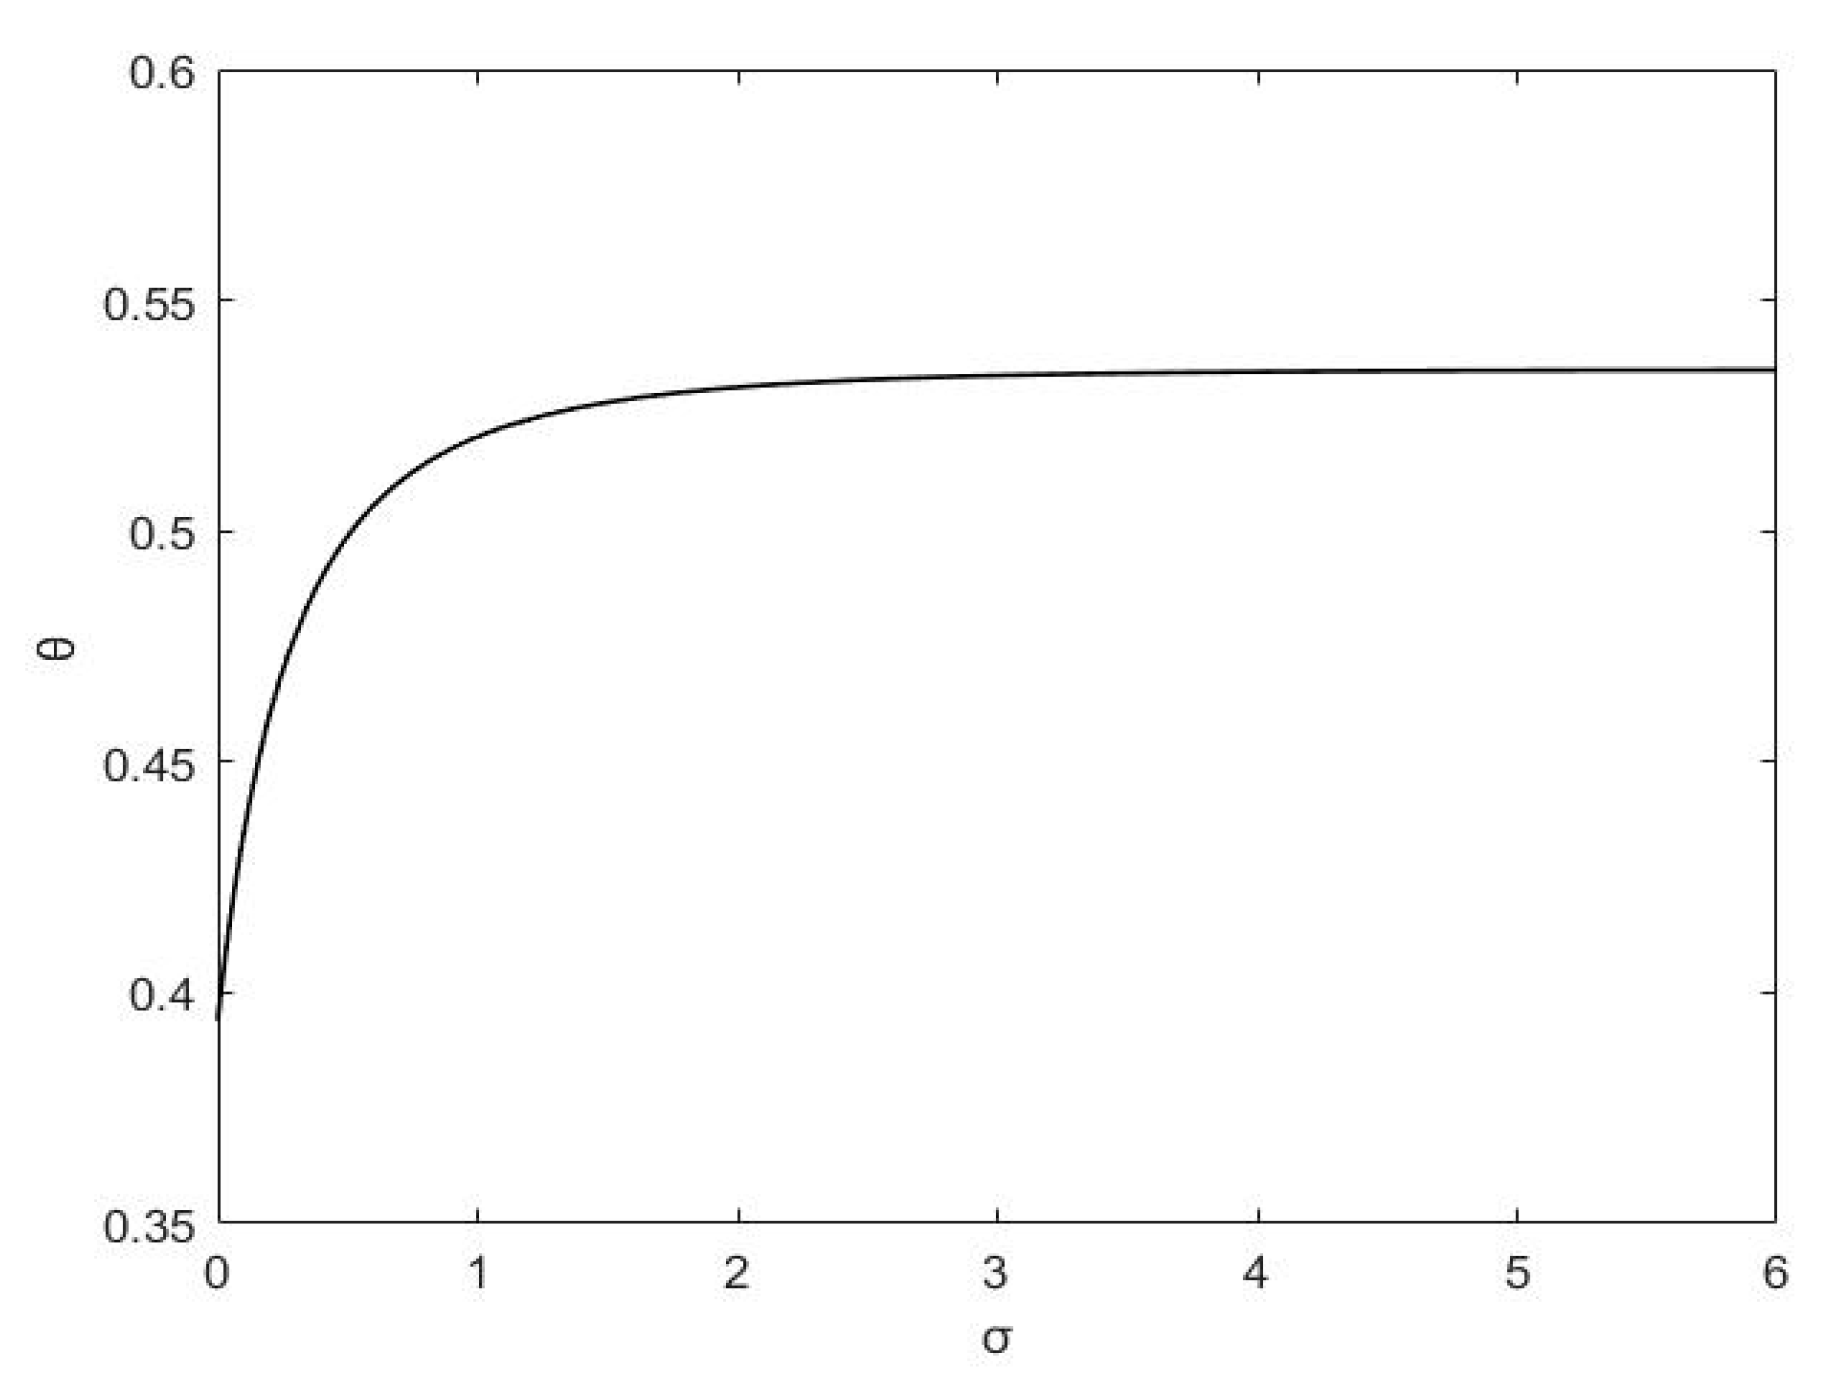
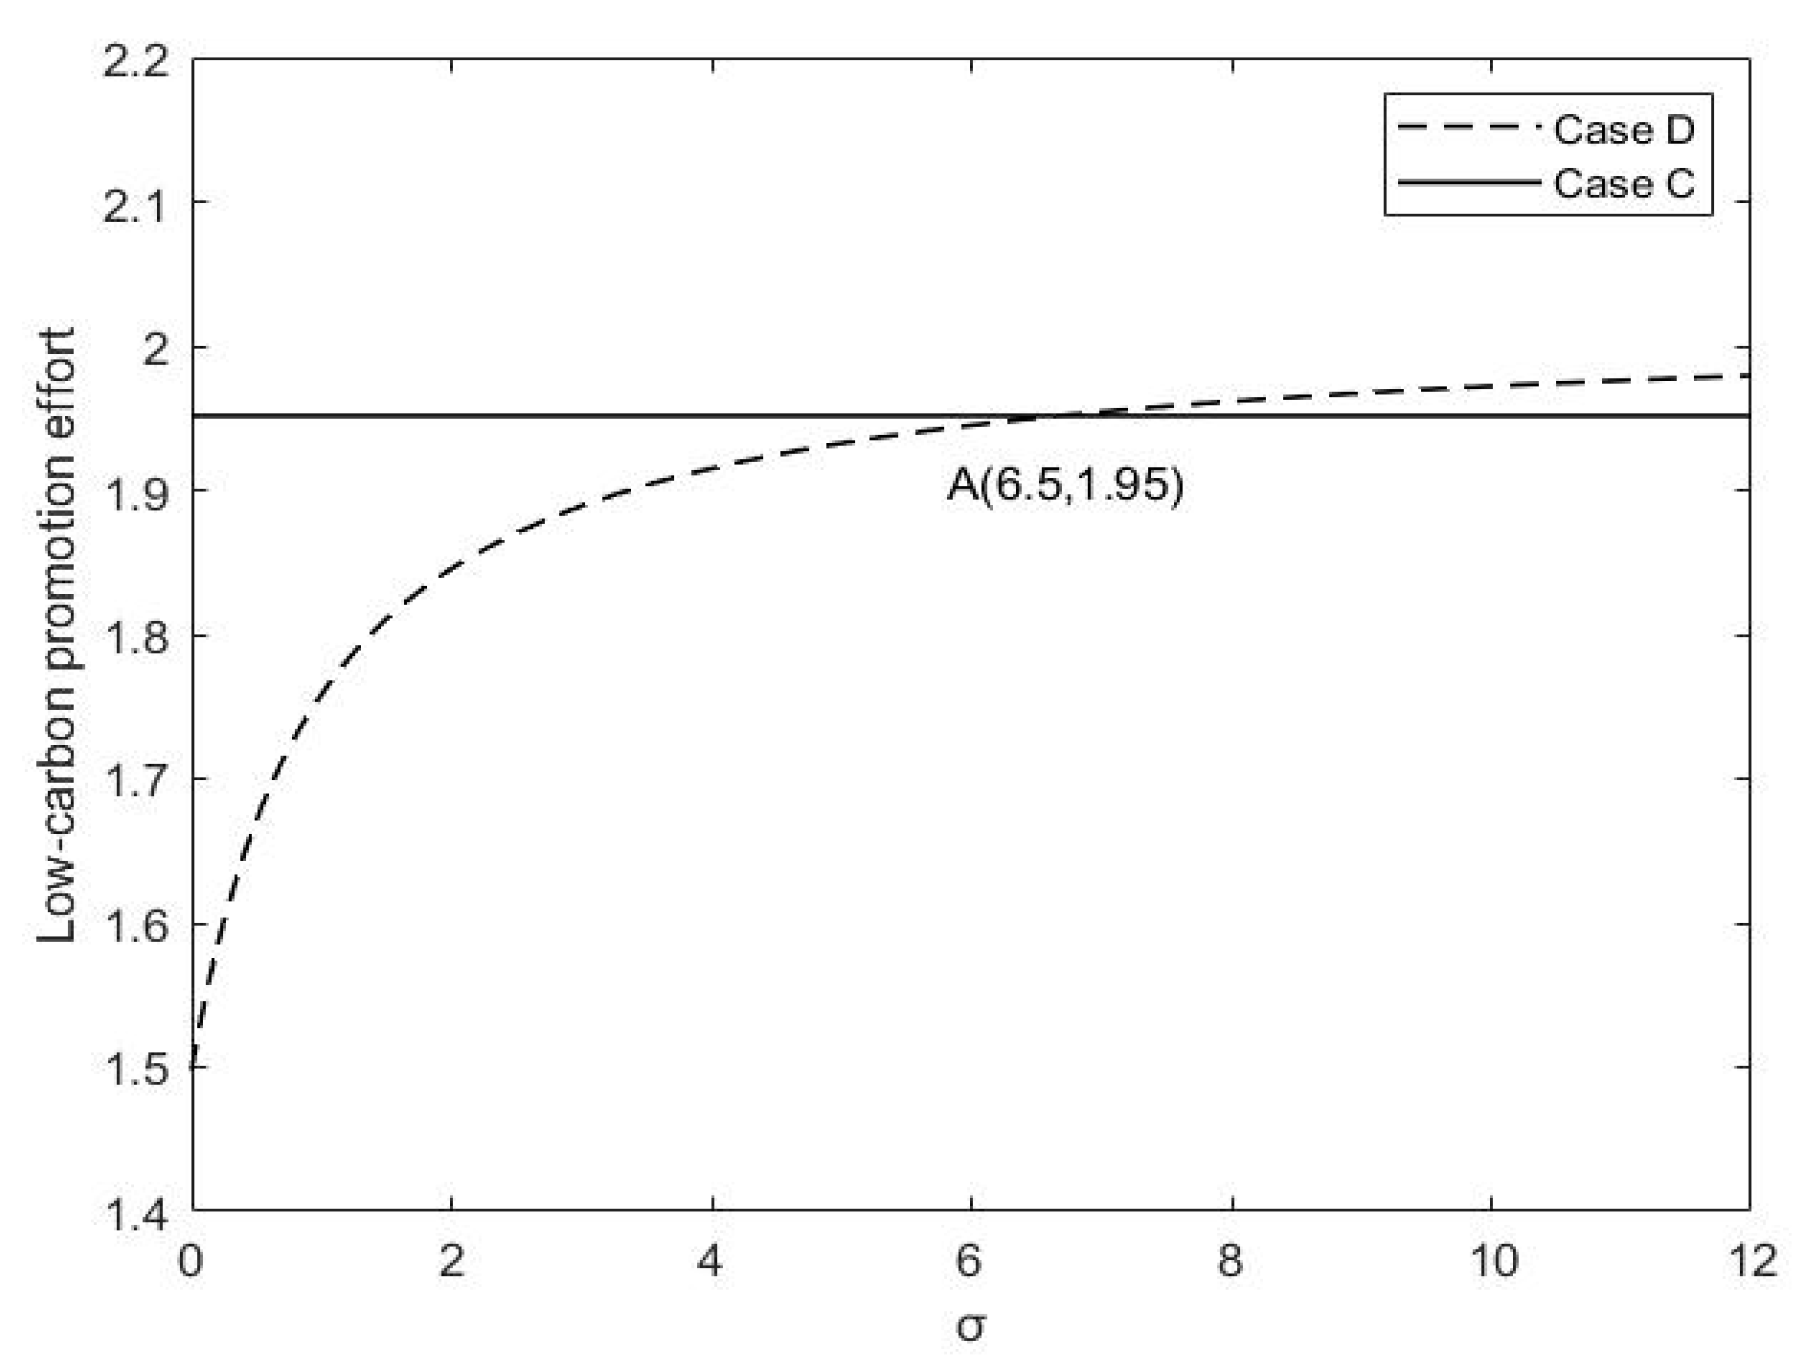
6.3. Influences of Retailer’s Fairness Concerns on Promotion and Cost-Sharing

This analysis examines the influences of retailer’s fairness concerns on retailer’s low-carbon promotional efforts and the cost-sharing ratio for such initiatives. From Figure 4 and Figure 5, the following findings are listed below:
(1) When retailer’s fairness concerns fall below three, there is a rapid increase in the cost-sharing ratio for low-carbon promotions as the retailer’s fairness concerns rise. Specifically, the retailer conveys this information to the upstream manufacturer, prompting it to contribute to low-carbon promotion costs. Additionally, this results in higher profits for each channel member. However, the cost-sharing ratio for low-carbon marketing remains constant after retailer’s fairness concerns surpass three. Consequently, excessive concerns about fairness do not substantially influence the manufacturer’s willingness to share costs for low-carbon activities.
(2) In Case C, the retailer’s low-carbon promotional effort is uninfluenced by fairness concerns. In contrast, in Case D, the retailer’s low-carbon promotional effort increases as its fairness concerns grow. Specifically, if the retailer’s concerns over fairness are below 6.5, Case C will exhibit a greater number of low-carbon promotional activities compared to Case D. Conversely, if the retailer’s fairness concerns surpass 6.5, Case D will exhibit a greater number of low-carbon promotional activities compared to Case C.

7. Discussion

7.1. Main Conclusions

This study analyzes the equilibrium solutions of each manufacturer-led supply chain member through a differential game method. Specifically, the analysis incorporates hybrid carbon policies, low-carbon operations including green technology and remanufacturing, retailer’s fairness concerns, and low-carbon preference under the centralized method and decentralized method, involving a cost-sharing contract for low-carbon promotional initiatives. Based on comparative and numerical analyses, the primary conclusions derived from the differential game approach are outlined below:
(1)
Under the centralized case, the chain’s overall profits and low-carbon goodwill are higher than those under the decentralized case. Therefore, adopting centralized decision-making can optimize both the economic and environmental performances of channel members.
(2)
The manufacturer’s low-carbon efforts remain uninfluenced by retailer’s fairness concerns, but they do augment the retailer’s initiatives in low-carbon advocacy. Additionally, when retailer’s fairness concerns fall below three, the cost-sharing ratio for low-carbon marketing will rise swiftly in response to an increase in fairness concerns. However, when retailer’s fairness concerns surpass three, the cost-sharing ratio stabilizes. Therefore, in order to raise the low-carbon advertising cost-sharing ratio, the retailer should address fairness issues within an ideal range and express these concerns effectively to the manufacturer.
(3)
The increased low-carbon preference is driving supply chain participants to put more efforts in low-carbon operations and marketing. Moreover, regardless of the decentralized or centralized method, the producer persists in intensifying efforts towards low-carbon operations as hybrid carbon policies become increasingly stringent. However, the retailer is expected to reduce its low-carbon promotional efforts in response to stricter hybrid carbon policies and serve as a moderator in maintaining an adequate low-carbon goodwill and sustain the supply chain’s low-carbon transition. Therefore, this partnership is essential for cultivating increased low-carbon goodwill, boosting product demand, and ultimately improving profits in the supply chain.

7.2. Managerial Insights

Our findings yield the following significant managerial insights:
(1)
Improve low-carbon awareness: Governments and corporations should intensify efforts to promote education on low-carbon knowledge. Specifically, governments can institute inclusive finance policies to incentivize the purchasing of low-carbon products. Additionally, a well-targeted low-carbon promotion subsidy policy can significantly contribute to low-carbon initiatives, thereby increasing consumer awareness about low-carbon options.
(2)
Pay attention to fairness concerns in promotion cost-sharing: Downstream retailers ought to evaluate the implications of fairness concerns and proactively convey this information to upstream manufacturers during negotiations. Moreover, formulating and establishing open and equitable cost-sharing agreements that balance the interests of manufacturers and retailers can incentivize retailers to participate more actively in low-carbon marketing initiatives.
(3)
Leverage different carbon policies effectively: Governments should take proactive steps to enhance existing carbon policies and leverage the complementary aspects of various carbon strategies to accelerate the transition to low-carbon operations. A coordinated approach can amplify the impacts of these policies on environmental and economic outcomes.

7.3. Research Limitations

This study has certain limitations that warrant further investigation.
First, it examines a limited scope of carbon policies. This study only examines a mix of carbon tax and cap-and-trade policies. Future research could explore the synergies between these policies and other existing carbon reduction strategies to provide a more comprehensive understanding of policy effectiveness.
Second, it does not consider the influence of recycling policies. While this study considers remanufacturing operations, it does not investigate the influence of recycling policies on low-carbon operations. Future studies could investigate the effects of recycling rules and incentives on supply chain sustainability as a whole.
Third, the effect of retailer rivalry on low-carbon promotion was not considered. Although we investigate the consequences of retailers’ fairness concerns in a manufacturer-led supply chain, the influence of retailer competition on low-carbon promotional initiatives is not taken into account in this study. Therefore, investigating how competition between retailers influences their low-carbon promotional initiatives could provide further insights into optimizing promotional strategies in competitive markets.

Author Contributions

P.L.: Conceptualization, Methodology, Project administration, Funding acquisition, Writing—review and editing. S.A.: Investigation, Data curation, Formal analysis, Visualization, Writing—original draft, Writing—review and editing. Y.Z.: Formal analysis, Writing—review and editing, Supervision. All authors have read and agreed to the published version of the manuscript.

Funding

This research was supported by the Knowledge Innovation Special Project of Wuhan Municipal Bureau of Science and Technology (Basic Research Project, No. 2023010201010120).

Institutional Review Board Statement

Not applicable.

Informed Consent Statement

Not applicable.

Data Availability Statement

The original contributions presented in this study are included in this article; further inquiries can be directed to the corresponding author.

Conflicts of Interest

The authors declare no conflicts of interest.

Appendix A

Proof of Proposition 1.
Following the decision sequence, since the second derivative of Equation (14) is 2 ρ V R u 2 = f 2 σ + 1 θ σ 1 , when 0 < θ < σ + 1 2 σ + 1 , 2 ρ V R u 2 < 0 , the response function of the retailer can be obtained by solving ρ V R u = 0 to get u = γ V R G f σ ( 2 σ + 1 ) θ + 1 . Submitting u and Equation (4) into Equation (13), the HJB equation of the manufacturer can be rewritten as follows:
ρ V M = m a x e m , τ , θ b G ( Q a P ) ( W s E m ) + s ( e m + Δ h τ ) + g E E m b G ( Q a P ) + e m + Δ h τ k e m 2 2 l τ 2 2 θ f 2 γ V R G f σ ( 2 σ + 1 ) θ + 1 2 + V M G μ E μ E m b G ( Q a P ) + μ ( e m + Δ h τ ) + γ 2 V R G f σ ( 2 σ + 1 ) θ + 1 δ G
By solving the second derivative of (A1), the corresponding Hessian matrix is easy to prove to be negative definite. Therefore, em, τ, and θ can be obtained by solving ρ V M e m = 0 , ρ V M τ = 0 , and ρ V M θ = 0 . Then, we can get e m = g + s + μ V M G k , τ = Δ h ( g + s + μ V M G ) l , and θ = ( σ + 1 ) ( 4 σ + 2 ) V M G V R G ( 2 σ + 1 ) ( 4 σ + 2 ) V M G + V R G .
Submitting (em, τ, θ, u) into Equation (13) and Equation (14), we have the following:
ρ V M = b ( Q a P ) W g E m s E m μ E m V M G δ V M G G + ( l + k Δ 2 h 2 ) μ V M G + g + s 2 2 k l + g + μ V M G E + γ 2 V E G + V M G ( 4 σ + 2 ) 8 f ( σ + 1 ) ( 2 σ + 1 ) 2
ρ V R = b ( Q a P ) σ ( P 2 W + g E m + s E m ) μ E m V R G + P W δ V R G G + μ σ V M G + 2 V R G ( g + s ) σ ( l + k Δ 2 h 2 ) μ V M G + g + s 2 k l + μ V R G g σ E + γ 2 V R G V R G + V M G ( 4 σ + 2 ) 4 f ( σ + 1 )
Based on the structural features of (A2) and (A3), the value functions VM and VR can be deduced as V M = m 1 G + n 1 and V R = m 2 G + n 2 . Then, (A2) and (A3) can be rewritten as follows:
ρ ( m 1 G + n 1 ) = b ( Q a P ) ( W g E m s E m μ E m m 1 ) δ m 1 G + ( l + k Δ 2 h 2 ) ( μ m 1 + g + s ) 2 2 k l + ( g + μ m 1 ) E + γ 2 m 2 + m 1 ( 4 σ + 2 ) 2 8 f ( σ + 1 ) ( 2 σ + 1 )
ρ ( m 2 G + n 2 ) = b ( Q a P ) σ ( P 2 W + g E m + s E m ) μ E m m 2 + P W δ m 2 G + μ ( σ m 1 + 2 m 2 ) ( g + s ) σ ( l + k Δ 2 h 2 ) ( μ m 1 + g + s ) 2 k l + ( μ m 2 g σ ) E + γ 2 m 2 m 2 + m 1 ( 4 σ + 2 ) 4 f ( σ + 1 )
Contrasting the two sides of (A4) and (A5), m1, n1, m2, and n2 are given as follows:
m 1 = b ( Q a P ) W ( g + s ) E m δ + ρ + ( Q a P ) b μ E m m 2 = b ( Q a P ) P W + ( P 2 W ) σ + ( g + s ) σ E m δ + ρ + ( Q a P ) b μ E m n 1 = ( l + k Δ 2 h 2 ) ( μ m 1 + g + s ) 2 2 k l ρ + ( g + μ m 1 ) E ρ + γ 2 m 2 + m 1 ( 2 + 4 σ ) 2 8 f ρ ( σ + 1 ) ( 2 σ + 1 ) n 2 = μ ( σ m 1 + 2 m 2 ) ( g + s ) σ ( l + k Δ 2 h 2 ) ( μ m 1 + g + s ) 2 k l ρ + ( μ m 2 g σ ) E ρ + γ 2 m 2 m 2 + m 1 ( 4 σ + 2 ) 4 f ρ ( σ + 1 )
Substituting (A6) into (em, τ, θ, u), members’ equilibrium decisions are as follows:
e m * = ( ρ + δ ) ( g + s ) + b μ W ( Q a P ) k ( ρ + δ + Q b μ E m a P b μ E m ) τ * = Δ h ( ρ + δ ) ( g + s ) + b μ W ( Q a P ) l ( ρ + δ + Q b μ E m a P b μ E m ) θ * = ( σ + 1 ) 3 W P ( 2 + 5 σ ) ( g + s ) E m + ( 6 W P ) σ ( 2 σ + 1 ) P + W 2 + 3 σ ( g + s ) E m + ( P + 2 W ) σ u * = b γ ( Q a P ) P + W ( 2 + 3 σ ) ( g + s ) E m + ( P + 2 W ) σ 2 f ( σ + 1 ) ( ρ + δ + Q b μ E m a P b μ E m )
Substituting (A7) into Equation (5), according to the bounded condition G(0) = G0, we derive G(t) as follows:
G ( t ) = G * + e A t ( G 0 G * )
where  A = Q b μ E m a P b μ E m + δ > 0 and G * = μ ( E + e m * + Δ h τ * ) + γ u * A Since A > 0, G *  is the steady-state of G when t . Submitting G * into J M *  and  J R * , the optimal profits are  J M * = m 1 G * + n 1 , J R * = m 2 G * + n 2 , respectively. □
Proof of Proposition 2.
Combining Equation (4), Equation (25) can be unfolded as follows:
ρ V s c = m a x e m , τ , u b G ( Q a P ) ( P s E m ) + s ( e m + Δ h τ ) + g E E m b G ( Q a P ) + e m + Δ h τ k e m 2 2 l τ 2 2 f u 2 2 + V S C G μ E μ E m b G ( Q a P ) + μ ( e m + Δ h τ ) + γ u δ G
By solving the second derivative of (A9), the relevant Hessian matrix is calculated as follows:
H = k 0 0 0 l 0 0 0 f
Since k > 0, l > 0, and f > 0, the matrix (A10) is negative definite, indicating that (A9) is joint concave on em, τ and u. Therefore, the necessary conditions are given as follows:
ρ V S C e m = 0 , ρ V S C τ = 0 ,   a n d   ρ V S C u = 0
By solving (A11), we have the following:
e m C = g + s + μ V S C G k , τ C = Δ h g + s + μ V S C G l , u C = γ V S C G f
Submitting (A12) into (A9), we get the following:
ρ V S C = b ( Q a P ) P g E m s E m μ E m V S C G δ V S C G G + ( l + k Δ 2 h 2 ) μ V S C G + g + s 2 2 k l + g + μ V S C G E + γ V S C G 2 2 f
Based on the structural features of (A13), the value function VSC can be deduced as V S C = m 3 G + n 3 . Then, we obtain V S C G = m 3 , and (A13) can be rewritten as follows:
ρ ( m 3 G + n 3 ) = b ( Q a P ) ( P g E m s E m μ E m m 3 ) δ m 3 G + ( l + k Δ 2 h 2 ) ( μ m 3 + g + s ) 2 2 k l + ( g + μ m 3 ) E + ( γ m 3 ) 2 2 f
Contrasting the two sides of (A14), we derive m3 and n3 as follows:
m 3 = b ( Q a P ) P ( g + s ) E m δ + ρ + ( Q a P ) b μ E m n 3 = ( l + k Δ 2 h 2 ) ( μ m 3 + g + s ) 2 2 k l ρ + ( g + μ m 3 ) E ρ + ( γ m 3 ) 2 2 f ρ
Substituting (A15) into (A12), the equilibrium decisions are as follows:
e m C * = ( ρ + δ ) ( g + s ) + b μ P ( Q a P ) k ( ρ + δ + Q b μ E m a P b μ E m ) τ C * = Δ h ( ρ + δ ) ( g + s ) + b μ P ( Q a P ) l ( ρ + δ + Q b μ E m a P b μ E m ) u C * = b γ ( Q a P ) P ( g + s ) E m f ( ρ + δ + Q b μ E m a P b μ E m )
Substituting (A16) into Equation (5), according to the bounded condition G(0) = G0, we derive G(t) as follows:
G C ( t ) = G C * + e A t ( G 0 G C * )
where A = Q b μ E m a P b μ E m + δ > 0  and  G C * = μ ( E + e m C * + Δ h τ C * ) + γ u C * A . Since  A > 0 , G C *  is the steady-state of G when  t . Submitting  G C *  into  J S C C * , the optimal profits are  J S C C * = m 3 G C * + n 3 . □
Proof of Corollary 1.
In case D, we have θ * = ( σ + 1 ) 3 W P ( 2 + 5 σ ) ( g + s ) E m + ( 6 W P ) σ ( 2 σ + 1 ) P + W 2 + 3 σ ( g + s ) E m + ( P + 2 W ) σ and u * = b γ ( Q a P ) P + W ( 2 + 3 σ ) ( g + s ) E m + ( P + 2 W ) σ 2 f ( σ + 1 ) ( ρ + δ + Q b μ E m a P b μ E m ) , when W > ( σ + 1 ) P + ( 2 + 5 σ ) ( g + s ) E m 3 ( 2 σ + 1 ) , θ * > 0 . In addition, we have the following:
θ * σ = P 2 ( σ + 1 ) 2 + 2 P W ( σ + 1 ) ( 2 σ + 1 ) 3 W 2 ( 2 σ + 1 ) 2 E m 2 ( g + s ) 2 ( 7 σ 2 + 4 σ ) 2 E m ( g + s ) P ( σ + 1 ) ( 3 σ + 2 ) W ( 2 σ + 1 ) ( 5 σ + 2 ) ( 2 σ + 1 ) 2 P + W ( 2 + 3 σ ) ( g + s ) E m + ( P + 2 W ) σ 2
When
P 2 ( σ + 1 ) 2 + 2 P W ( σ + 1 ) ( 2 σ + 1 ) > 3 W 2 ( 2 σ + 1 ) 2 + E m 2 ( g + s ) 2 ( 7 σ 2 + 4 σ ) + 2 E m ( g + s ) P ( σ + 1 ) ( 3 σ + 2 ) + W ( 2 σ + 1 ) ( 5 σ + 2 ) , θ * σ > 0 ;
When
P 2 ( σ + 1 ) 2 + 2 P W ( σ + 1 ) ( 2 σ + 1 ) < 3 W 2 ( 2 σ + 1 ) 2 + E m 2 ( g + s ) 2 ( 7 σ 2 + 4 σ ) + 2 E m ( g + s ) [ P ( σ + 1 ) ( 3 σ + 2 ) + W ( 2 σ + 1 ) 5 σ + 2 ] , θ * σ < 0
u * σ = b γ ( ρ + δ ) ( Q a P ) ( W g E m s E m ) 2 f ( ρ + δ + Q b μ E m a P b μ E m ) ( σ + 1 ) 2 > 0
Proof of Corollary 2.
We have e m C * e m * = b μ ( P W ) ( Q a P ) k ( ρ + δ + Q b μ E m a P b μ E m ) , τ C * τ * = Δ h b μ ( P W ) ( Q a P ) l ( ρ + δ + Q b μ E m a P b μ E m ) , and u C * u * = b γ ( Q a P ) P W + σ P 2 W + ( g + s ) E m 2 f ( σ + 1 ) ( ρ + δ + Q b μ E m a P b μ E m ) . Since  Q a P > 0 , P > W and ( σ + 1 ) P > ( 2 σ + 1 ) W ( g + s ) σ E m , we obtain e m C * > e m * , τ C * > τ * and u C * > u * .
In each case, the steady-state of G has the same structure, i.e., G * = μ ( E + e m * + Δ h τ * ) + γ u * A . Therefore, there is a positive relationship between G * and members’ optimal decisions. Since P is fixed and D * = b G * ( Q a P ) , we can obtain G * < G C * and D * < D C * . □
Proof of Corollary 3.
In Case D, we have the following:
e m * s = e m * g = ρ + δ k ( ρ + δ + Q b μ E m a P b μ E m ) > 0 , τ * s = τ * g = Δ h ( ρ + δ ) l ( ρ + δ + Q b μ E m a P b μ E m ) > 0 u * s = u * g = b γ ( Q a P ) ( 2 + 3 σ ) E m 2 f ( σ + 1 ) ( ρ + δ + + Q b μ E m a P b μ E m ) < 0 , θ * s = θ * g = 4 E m ( W P ) ( σ + 1 ) 2 P + W ( 2 + 3 σ ) ( g + s ) E m + ( P + 2 W ) σ 2 < 0
e m * b = μ ( ρ + δ ) ( Q a P ) ( W g E m s E m ) k ( ρ + δ + Q b μ E m a P b μ E m ) 2 > 0 , τ * b = Δ h μ ( ρ + δ ) ( Q a P ) ( W g E m s E m ) l ( ρ + δ + Q b μ E m a P b μ E m ) 2 > 0 u * b = γ ( ρ + δ ) ( Q a P ) ( P + W 2 g E m 2 s E m + P σ + 2 W σ 3 σ g E m 3 σ s E m ) 2 f ( σ + 1 ) ( ρ + δ + Q b μ E m a P b μ E m ) 2 > 0
Similarly, in Case C, we have the following:
e m c * s = e m c * g = ρ + δ k ρ + δ + Q b μ E m a P b μ E m > 0 , τ c * s = τ c * g = Δ h ρ + δ l ρ + δ + Q b μ E m a P b μ E m > 0 u c * s = u c * g = b γ Q a P E m f ρ + δ + Q b μ E m a P b μ E m < 0 , e m c * b = μ ρ + δ Q a P P g E m s E m k ρ + δ + Q b μ E m a P b μ E m 2 > 0 τ c * b = Δ h μ ρ + δ Q a P P g E m s E m l ρ + δ + Q b μ E m a P b μ E m 2 > 0 , u c * b = γ ρ + δ Q a P P g E m s E m f ρ + δ + Q b μ E m a P b μ E m 2 > 0
Proof of Corollary 4.
This proof can be found in the paper. □
Proof of Corollary 5.
In Case D, we have J * = J M * + J R * = ( m 1 + m 2 ) G * + n 1 + n 2 . Then we obtain J S C C * J * = m 3 G C * ( m 1 + m 2 ) G * + n 3 n 1 n 2 . Since ( m 1 + m 2 ) m 3 = b ( Q a P ) σ P 2 W + ( g + s ) E m δ + ρ + ( Q a P ) b μ E m < 0 , n 3 > n 1 + n 2 and G C * > G * , we can get J S C C * > J * . □

References

  1. IPCC. Climate Change 2023: Synthesis Report; IPCC: Geneva, Switzerland, 2023; pp. 35–115. [Google Scholar]
  2. Konur, D.; Campbell, J.F.; Monfared, S.A. Economic and environmental considerations in a stochastic inventory control model with order splitting under different delivery schedules among suppliers. Omega 2017, 71, 46–65. [Google Scholar]
  3. Xu, S.; Govindan, K.; Wang, W.; Yang, W. Supply chain management under cap-and-trade regulation: A literature review and research opportunities. Int. J. Prod. Econ. 2024, 271, 109199. [Google Scholar]
  4. Wang, J.; Peng, W.; Ke, C.; Wang, Z.; Zhang, S.; Rui, Z.; Shi, X. Renewable energy investment under carbon trading mechanism: The impact of green financing and carbon emission quota. Environ. Dev. Sustain. 2025. [Google Scholar] [CrossRef]
  5. Liao, H.; Wu, D.; Wang, Y.; Lyu, Z.; Sun, H.; Nie, Y.; He, H. Impacts of carbon trading mechanism on closed-loop supply chain: A case study of stringer pallet remanufacturing. Soc. Econ. Plann. Sci. 2022, 81, 101209. [Google Scholar]
  6. Cai, J.; Jiang, F. Decision models of pricing and carbon emission reduction for low-carbon supply chain under cap-and-trade regulation. Int. J. Prod. Econ. 2023, 264, 108964. [Google Scholar]
  7. Jiang, K.; Wang, D.; Xu, L.; Wang, F. Assessing the impact of carbon quota allocation in enhancing supply chain members emission reduction and advertising efforts. Soc. Econ. Plann. Sci. 2024, 95, 102033. [Google Scholar]
  8. Zhou, X.; Wei, X.; Lin, J.; Tian, X.; Lev, B.; Wang, S. Supply chain management under carbon taxes: A review and bibliometric analysis. Omega 2021, 98, 102295. [Google Scholar]
  9. Wang, L.; Peng, K. Carbon reduction decision-making in supply chain under the pledge financing of carbon emission rights. J. Clean. Prod. 2023, 428, 139381. [Google Scholar]
  10. Palsule-Desai, O.D.; Tirupati, D.; Chandra, P. Stability issues in supply chain networks: Implications for coordination mechanisms. Int. J. Prod. Econ. 2013, 142, 179–193. [Google Scholar]
  11. Cao, J.; Ho, M.S.; Jorgenson, D.W.; Nielsen, C.P. China’s emissions trading system and an ETS-carbon tax hybrid. Energy Econ. 2019, 81, 741–753. [Google Scholar]
  12. World Bank Group. State and Trends of Carbon Pricing 2019 (English); World Bank Group: Washington, DC, USA, 2019. [Google Scholar]
  13. Liu, Z.; Anderson, T.D.; Cruz, J.M. Consumer environmental awareness and competition in two-stage supply chains. Eur. J. Oper. Res. 2012, 218, 602–613. [Google Scholar]
  14. Du, S.; Hu, L.; Wang, L. Low-carbon supply policies and supply chain performance with carbon concerned demand. Ann. Oper. Res. 2017, 255, 569–590. [Google Scholar]
  15. Wen, W.; Zhou, P.; Zhang, F. Carbon emissions abatement: Emissions trading vs consumer awareness. Energy Econ. 2018, 76, 34–47. [Google Scholar]
  16. Yao, F.; Parilina, E.; Zaccour, G.; Gao, H. Accounting for consumers’ environmental concern in supply chain contracts. Eur. J. Oper. Res. 2022, 301, 987–1006. [Google Scholar]
  17. De Angelis, T.; Tankov, P.; Zerbib, O.D. Climate impact investing. Manag. Sci. 2022, 69, 7669–7692. [Google Scholar]
  18. Xing, E.; Shi, C.; Zhang, J.; Cheng, S.; Lin, J.; Ni, S. Double third-party recycling closed-loop supply chain decision under the perspective of carbon trading. J. Clean. Prod. 2020, 259, 120651. [Google Scholar]
  19. Lv, X.; Zhang, S.; Zhang, T. Subsidy or not? Research on remanufacturing strategy under the influence of consumers’ preferences. Environ. Dev. Sustain. 2024. [Google Scholar] [CrossRef]
  20. Govindan, K.; Soleimani, H.; Kannan, D. Reverse logistics and closed-loop supply chain: A comprehensive review to explore the future. Eur. J. Oper. Res. 2015, 240, 603–626. [Google Scholar]
  21. Dye, C.Y.; Hsieh, T.P. A sustainable dynamic optimization model of pricing and advertising in the presence of green innovation investment. Eur. J. Oper. Res. 2024, 315, 654–667. [Google Scholar]
  22. Hong, Z.; Guo, X. Green product supply chain contracts considering environmental responsibilities. Omega 2019, 83, 155–166. [Google Scholar]
  23. Li, Z.; Pan, Y.; Yang, W.; Ma, J.; Zhou, M. Effects of government subsidies on green technology investment and green marketing coordination of supply chain under the cap-and-trade mechanism. Energy Econ. 2021, 101, 105426. [Google Scholar]
  24. Zhou, Y.; Bao, M.; Chen, X.; Xu, X. Co-op advertising and emission reduction cost sharing contracts and coordination in low-carbon supply chain based on fairness concerns. J. Clean. Prod. 2016, 133, 402–413. [Google Scholar]
  25. Gong, Y.; Kai, J.; Wang, Z. Research on closed loop supply chain strategy considering fair preference and green innovation. Chin. J. Manag. Sci. 2024, 1–14. (In Chinese) [Google Scholar] [CrossRef]
  26. Zhu, C.; Xi, X.; Goh, M. Differential game analysis of joint emission reduction decisions under mixed carbon policies and CEA. J. Environ. Manag. 2024, 358, 120913. [Google Scholar]
  27. Cheng, P.; Ji, G.; Zhang, G.; Shi, Y. A closed-loop supply chain network considering consumer’s low carbon preference and carbon tax under the cap-and-trade regulation. Sustain. Prod. Consum. 2022, 29, 614–635. [Google Scholar]
  28. Zhu, C.; Ma, J.; Li, J. Dynamic production and carbon emission reduction adjustment strategies of the brand-new and the remanufactured product under hybrid carbon regulations. Comput. Ind. Eng. 2022, 172, 108517. [Google Scholar]
  29. Li, Q.; Xiao, T.; Qiu, Y. Price and carbon emission reduction decisions and revenue-sharing contract considering fairness concerns. J. Clean. Prod. 2018, 190, 303–314. [Google Scholar]
  30. Xia, L.; Bai, Y.; Ghose, S.; Qin, J. Differential game analysis of carbon emissions reduction and promotion in a sustainable supply chain considering social preferences. Ann. Oper. Res. 2022, 310, 257–292. [Google Scholar]
  31. Wang, Y.; Yu, Z.; Jin, M.; Mao, J. Decisions and coordination of retailer-led low-carbon supply chain under altruistic preference. Eur. J. Oper. Res. 2021, 293, 910–925. [Google Scholar]
  32. Du, K.; Cheng, Y.; Yao, X. Environmental regulation, green technology innovation, and industrial structure upgrading: The road to the green transformation of Chinese cities. Energy Econ. 2021, 98, 105247. [Google Scholar]
  33. Qi, X.; Wu, Z.; Xu, J.; Shan, B. Environmental justice and green innovation: A quasi-natural experiment based on the establishment of environmental courts in China. Ecol. Econ. 2023, 205, 107700. [Google Scholar]
  34. Xu, X.; He, P.; Xu, H.; Zhang, Q. Supply chain coordination with green technology under cap-and-trade regulation. Int. J. Prod. Econ. 2017, 183, 433–442. [Google Scholar]
  35. Krass, D.; Nedorezov, T.; Ovchinnikov, A. Environmental taxes and the choice of green technology. Prod. Oper. Manag. 2013, 22, 1035–1055. [Google Scholar]
  36. Luo, R.; Zhou, L.; Song, Y.; Fan, T. Evaluating the impact of carbon tax policy on manufacturing and remanufacturing decisions in a closed-loop supply chain. Int. J. Prod. Econ. 2022, 245, 108408. [Google Scholar]
  37. Yang, L.; Hu, Y.; Huang, L. Collecting mode selection in a remanufacturing supply chain under cap-and-trade regulation. Eur. J. Oper. Res. 2020, 287, 480–496. [Google Scholar]
  38. Bendoly, E. Incorporating behavioral theory in OM empirical models. J. Oper. Manag. 2006, 24, 735–736. [Google Scholar]
  39. Haitao Cui, T.; Raju, J.S.; Zhang, Z.J. Fairness and channel coordination. Manag. Sci. 2007, 53, 1303–1314. [Google Scholar]
  40. Ho, T.-H.; Zhang, J. Designing pricing contracts for boundedly rational customers: Does the framing of the fixed fee matter? Manag. Sci. 2008, 54, 686–700. [Google Scholar]
  41. Loch, C.H.; Wu, Y. Social preferences and supply chain performance: An experimental study. Manag. Sci. 2008, 54, 1835–1849. [Google Scholar]
  42. Wang, K.; Zeng, H.; Yuan, Y.; Zhang, C.; Liu, L. Green or non-green: A game to introduce decision making under fairness concerns. Technol. Forecast. Soc. Change. 2022, 185, 122050. [Google Scholar]
  43. Yang, H.; Chen, X.; Li, L.; Sun, Y. Supply chain decision-making of green products considering a retailer’s fairness concerns under a pre-sale model. J. Clean. Prod. 2023, 414, 137457. [Google Scholar]
  44. Luan, X.; Kang, K.; Yin, J. Research on selection of manufacturer’s sales mode considering product greenness. Comput. Eng. App. 2023, 59, 280–288. (In Chinese) [Google Scholar]
  45. Zu, Y.; Chen, L.; Fan, Y. Research on low-carbon strategies in supply chain with environmental regulations based on differential game. J. Clean. Prod. 2018, 177, 527–546. [Google Scholar]
  46. Gui, L. Recycling infrastructure development under extended producer responsibility in developing economies. Prod. Oper. Manag. 2020, 29, 1858–1877. [Google Scholar]
  47. Ilgin, M.A.; Gupta, S.M. Environmentally conscious manufacturing and product recovery (ECMPRO): A review of the state of the art. J. Environ. Manag. 2010, 91, 563–591. [Google Scholar]
  48. Govindan, K.; Popiuc, M.N. Reverse supply chain coordination by revenue sharing contract: A case for the personal computers industry. Eur. J. Oper. Res. 2014, 233, 326–336. [Google Scholar]
  49. Jørgensen, S.; Martín-Herrán, G.; Zaccour, G. Dynamic games in the economics and management of pollution. Environ. Model. Assess. 2010, 15, 433–467. [Google Scholar]
  50. André, F.J.; Sokri, A.; Zaccour, G. Public Disclosure Programs vs. traditional approaches for environmental regulation: Green goodwill and the policies of the firm. Eur. J. Oper. Res. 2011, 212, 199–212. [Google Scholar]
  51. Liang, L.; Futou, L. Differential game modelling of joint carbon reduction strategy and contract coordination based on low-carbon reference of consumers. J. Clean. Prod. 2020, 277, 123798. [Google Scholar]
  52. Marc, N.; Kenneth, J.A. Optimal Advertising Policy under Dynamic Conditions. Economica 1962, 29, 129–142. [Google Scholar]
  53. He, L.; Yuan, B.; Bian, J.; Lai, K.K. Differential game theoretic analysis of the dynamic emission abatement in low-carbon supply chains. Ann. Oper. Res. 2023, 324, 355–393. [Google Scholar]
  54. Kang, Y.; Dong, P.; Ju, Y.; Zhang, T. Differential game theoretic analysis of the blockchain technology investment and carbon reduction strategy in digital supply chain with government intervention. Comput. Ind. Eng. 2024, 189, 109953. [Google Scholar]
  55. El Ouardighi, F.; Pasin, F. Quality improvement and goodwill accumulation in a dynamic duopoly. Eur. J. Oper. Res. 2006, 175, 1021–1032. [Google Scholar]
Figure 1. Framework of the supply chain.
Sustainability 17 06309 g001
Figure 2. Trajectories of G(t) in two cases.
Sustainability 17 06309 g002
Figure 3. Impacts of s, g and b on low-carbon goodwill.
Sustainability 17 06309 g003
Figure 4. The influence of fairness concerns on the cost-sharing ratio.
Sustainability 17 06309 g004
Figure 5. The influence of fairness concerns on the retailer’s promotion effort.
Sustainability 17 06309 g005
Table 1. Summary of some relevant research.
AuthorsType of Carbon PolicyStructure of the
Supply Chain
Fairness
Concerns
RemanufacturingDifferential Game
Cap-and-TradeCarbon Tax
Zhou et al. [24]××a manufacturer, a retailer××
Xu et al. [34]×a manufacturer, a retailer×××
Li et al. [29]×a manufacturer, a supplier×
Yang et al. [37]×a manufacturer, a retailer or a third party××
Li et al. [23]×a manufacturer, a retailer××
Luo et al. [36]×a manufacturer, a retailer××
Cheng et al. [27]a manufacturer, a retailer××
Xia et al. [30]××a manufacturer, a retailer×
Yang et al. [43]××a manufacturer, a retailer××
Cai et al. [6]×a manufacturer, a supplier××
Zhu et al. [26]a manufacturer, a retailer×
This papera manufacturer, a retailer
Table 2. Variables and their descriptions.
ParametersImplication
D(t)Market demand of products
Dr(t)Recycling quantity of products
ES(t)Carbon emission surplus
Cm, CrUnit production cost of new/remanufactured product
PRetail price per unit of products
WWholesale price per unit of products
s, gUnit carbon tax price/carbon emissions rights trading price
Em, ErUnit carbon emissions of new/remanufactured products
EAllocated carbon emissions rights
QMarket size of products
k, l, fInvestment cost coefficient of green technology/recycling/low-carbon promotion
a, bInfluence coefficient of retail price/low-carbon good will
hInfluence coefficient of recycling effort
μ, γInfluence coefficient of carbon emissions surplus/low-carbon promotional effort
δDecay rate of low-carbon goodwill
ρDiscount factor
σFairness concerns of the retailer
θCost-sharing ratio for low-carbon promotion
Decision Variables
em(t)Emissions reduction from green technology effort
τ(t)Recycling effort for remanufacturing
u(t)Low-carbon promotional effort
State Variable
G(t)Low-carbon goodwill
Notations
Jm, Jr, JscObjective function of the manufacturer/retailer/entire supply chain
Vm, Vr, VscValue function of the manufacturer/retailer/entire supply chain
Superscripts
DDecentralized decision-making
CCentralized decision-making
Disclaimer/Publisher’s Note: The statements, opinions and data contained in all publications are solely those of the individual author(s) and contributor(s) and not of MDPI and/or the editor(s). MDPI and/or the editor(s) disclaim responsibility for any injury to people or property resulting from any ideas, methods, instructions or products referred to in the content.

