
Biodiversity Offset Schemes for Indonesia: Pro et Contra


Abstract
1. Introduction
2. Literature Review
2.1. Institutions
2.2. Data
2.3. Ecology
2.4. Economics
2.5. Society
3. Analysis of the State of the Environment in Indonesia
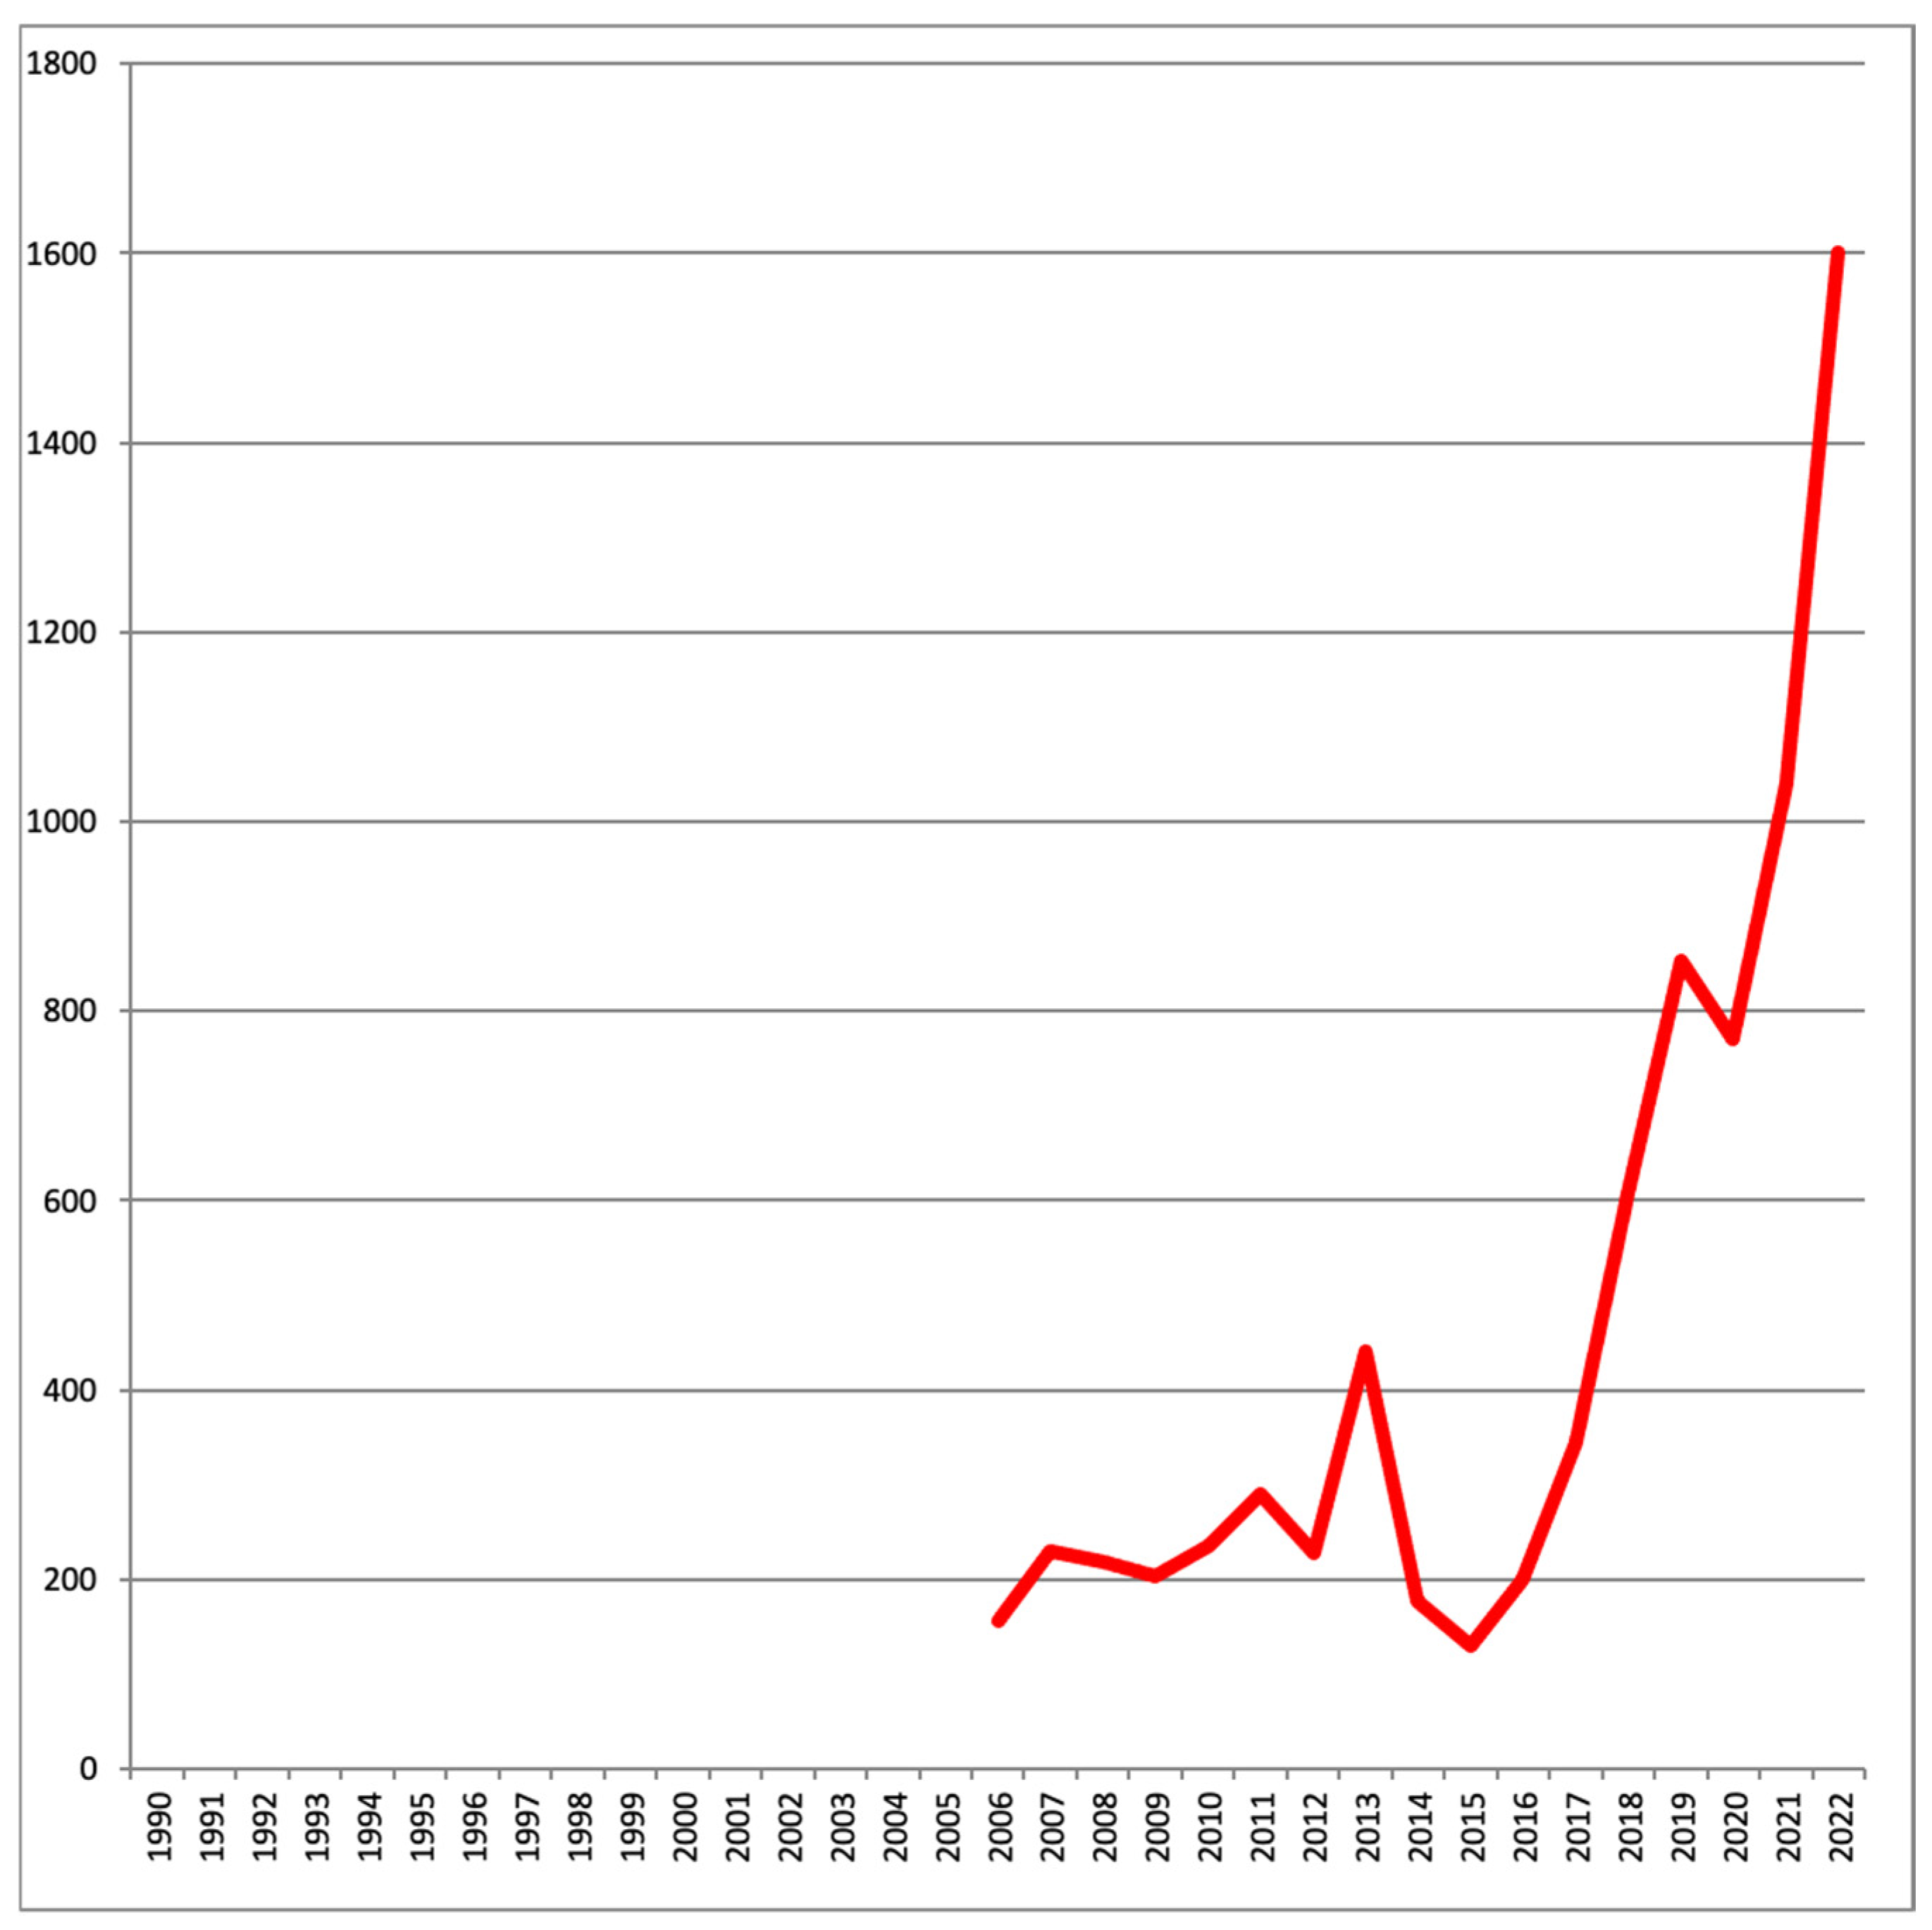
3.1. Mining
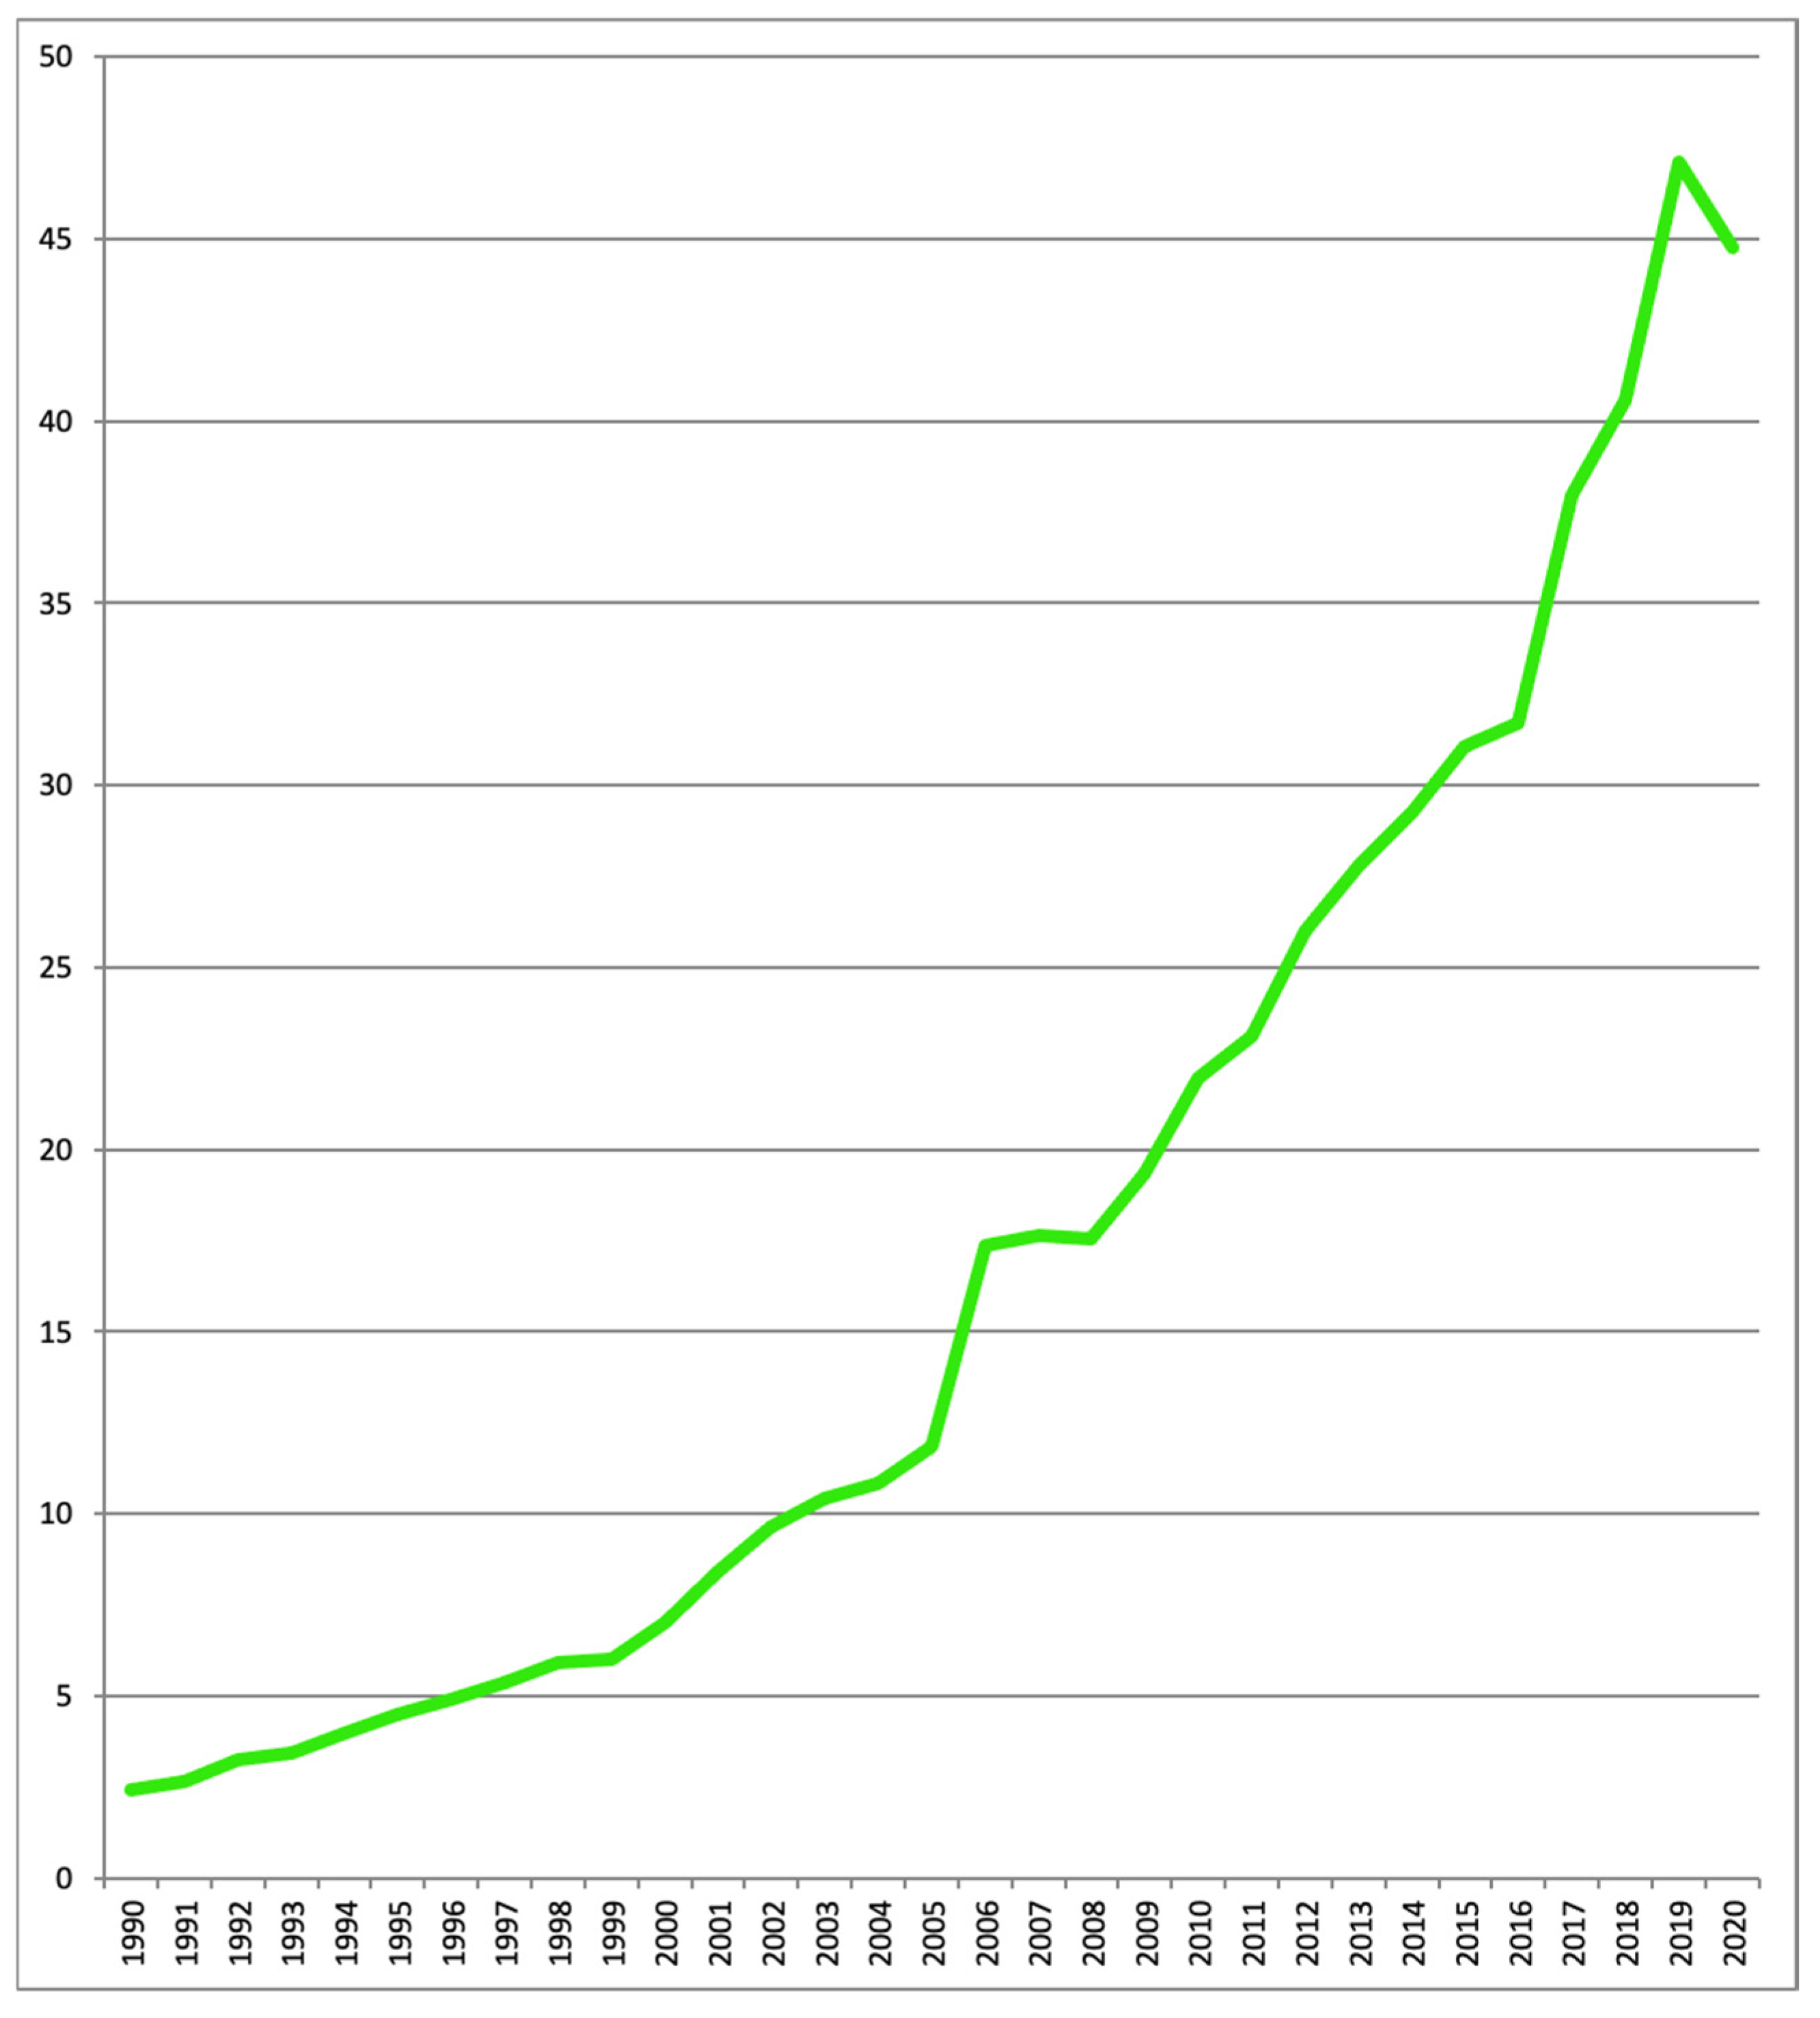
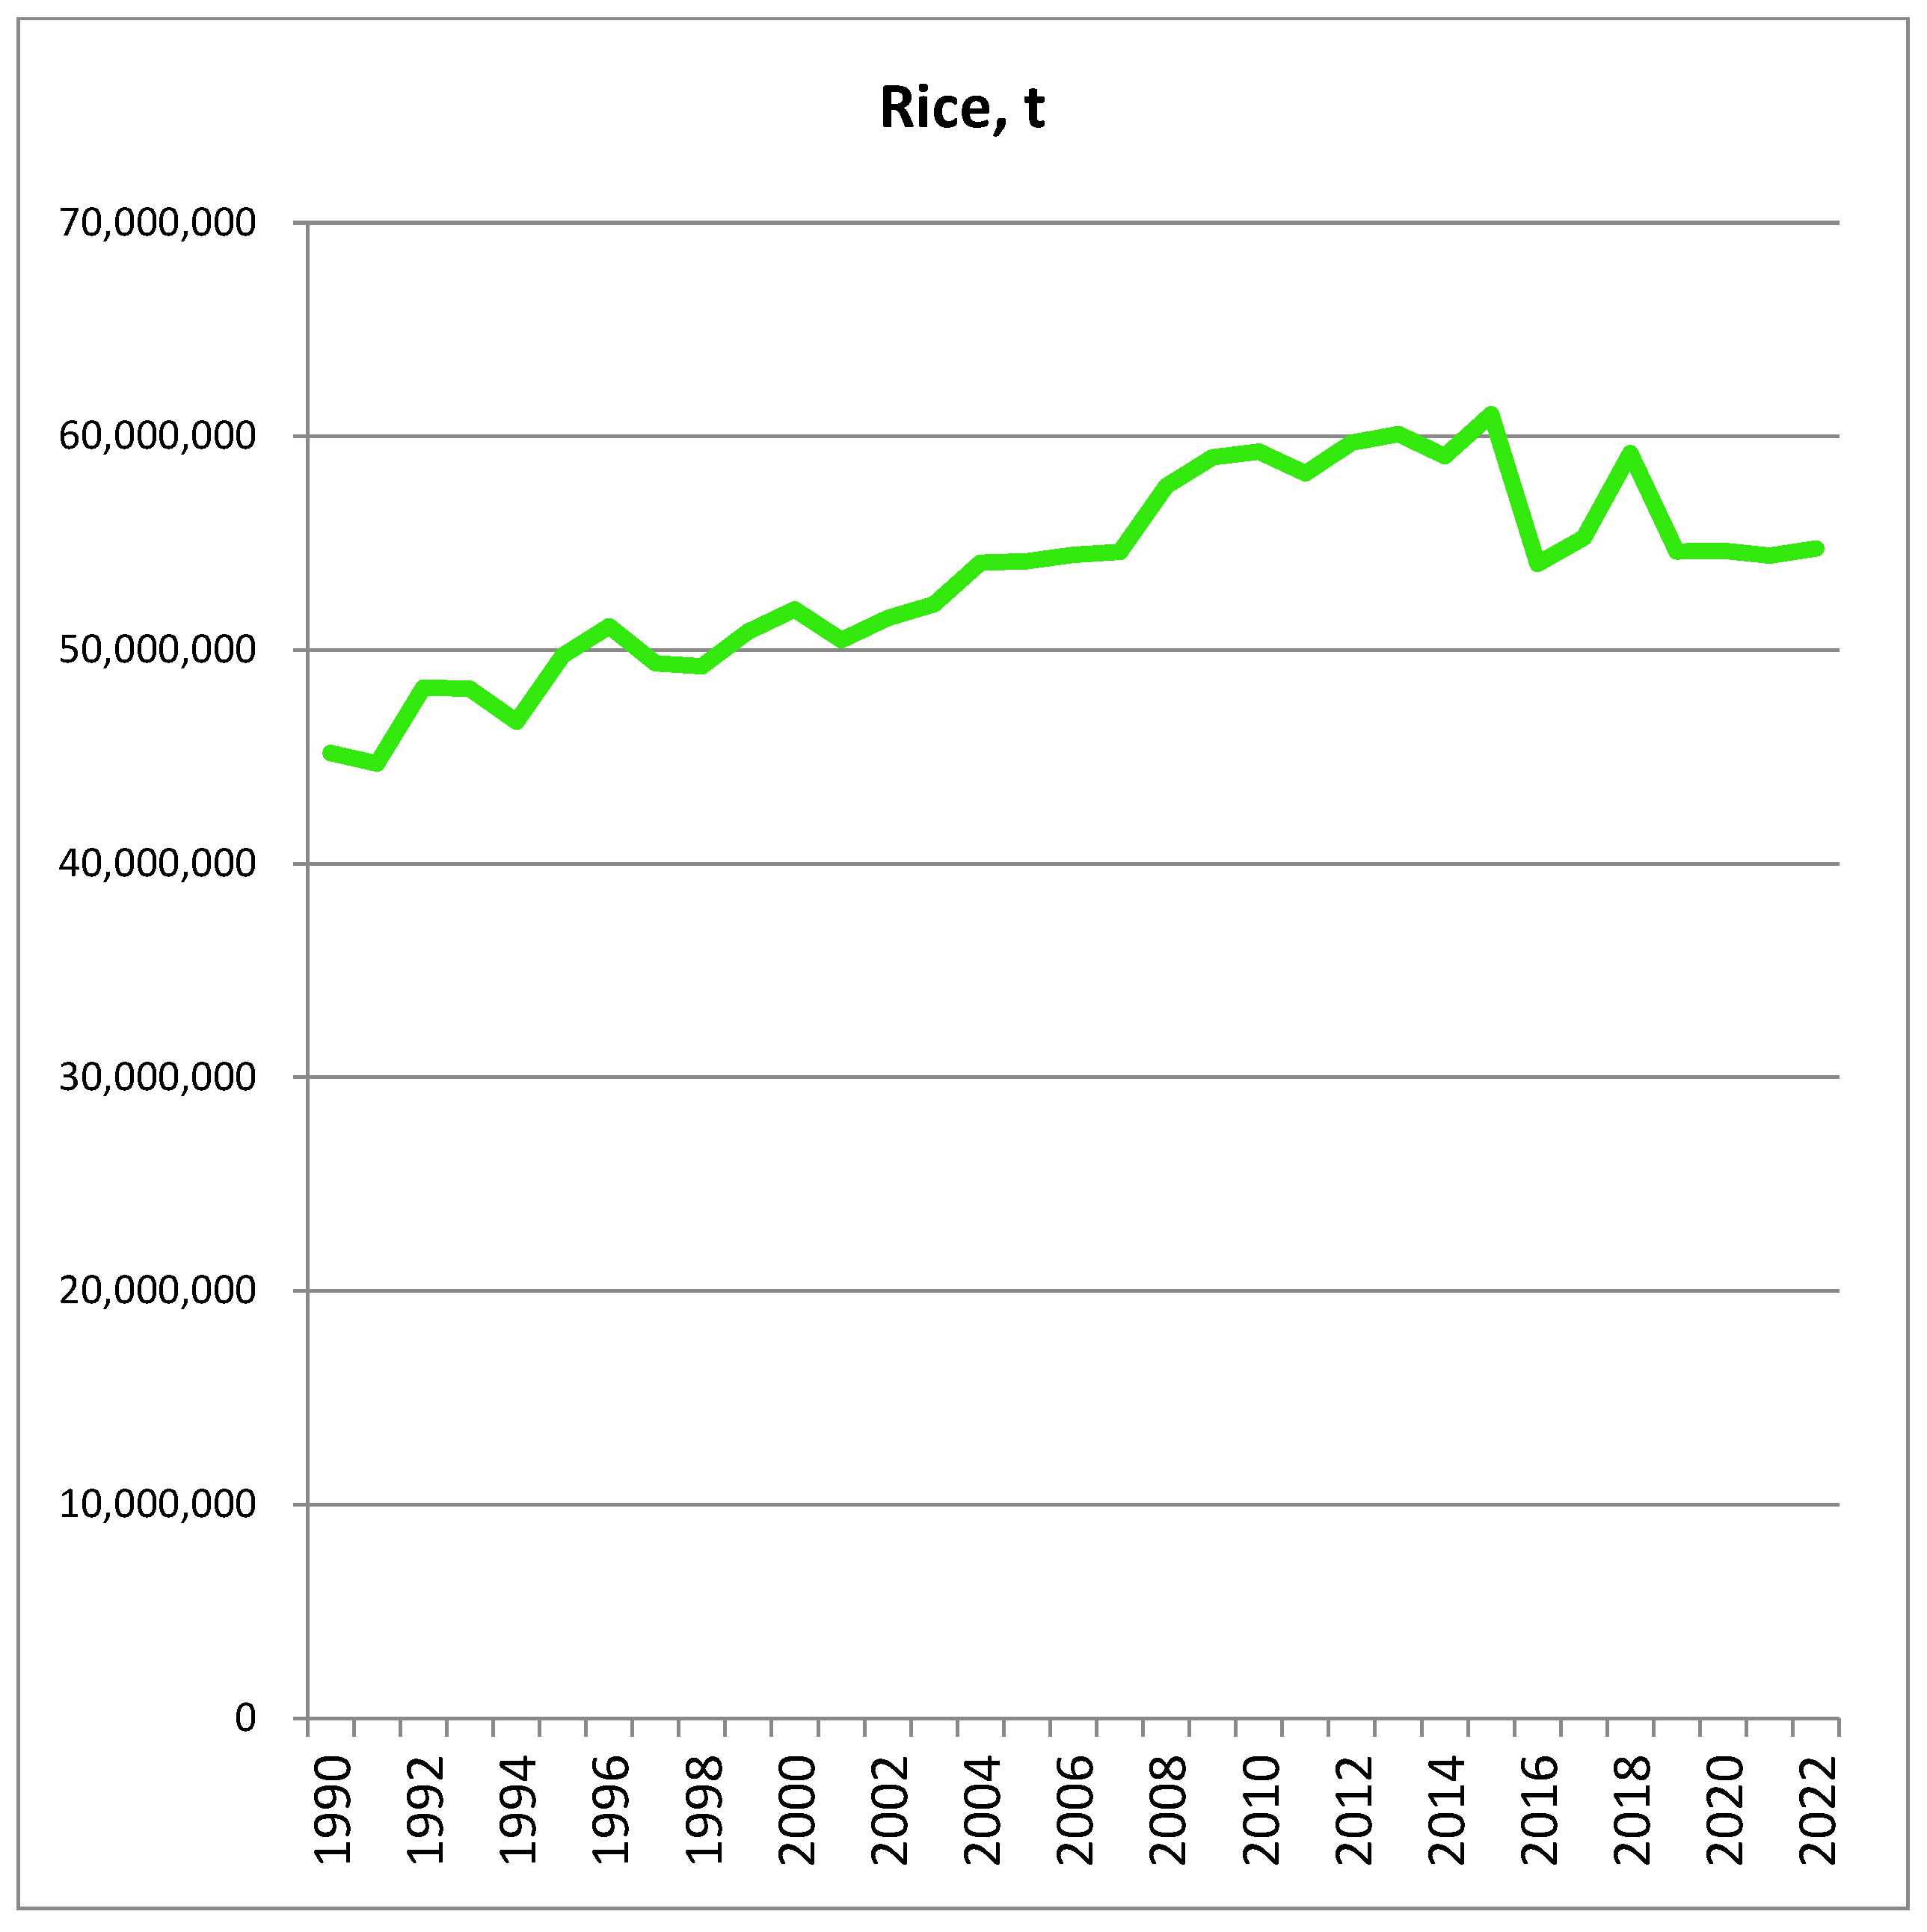
3.2. Agriculture
3.3. Infrastructure
3.4. Transport
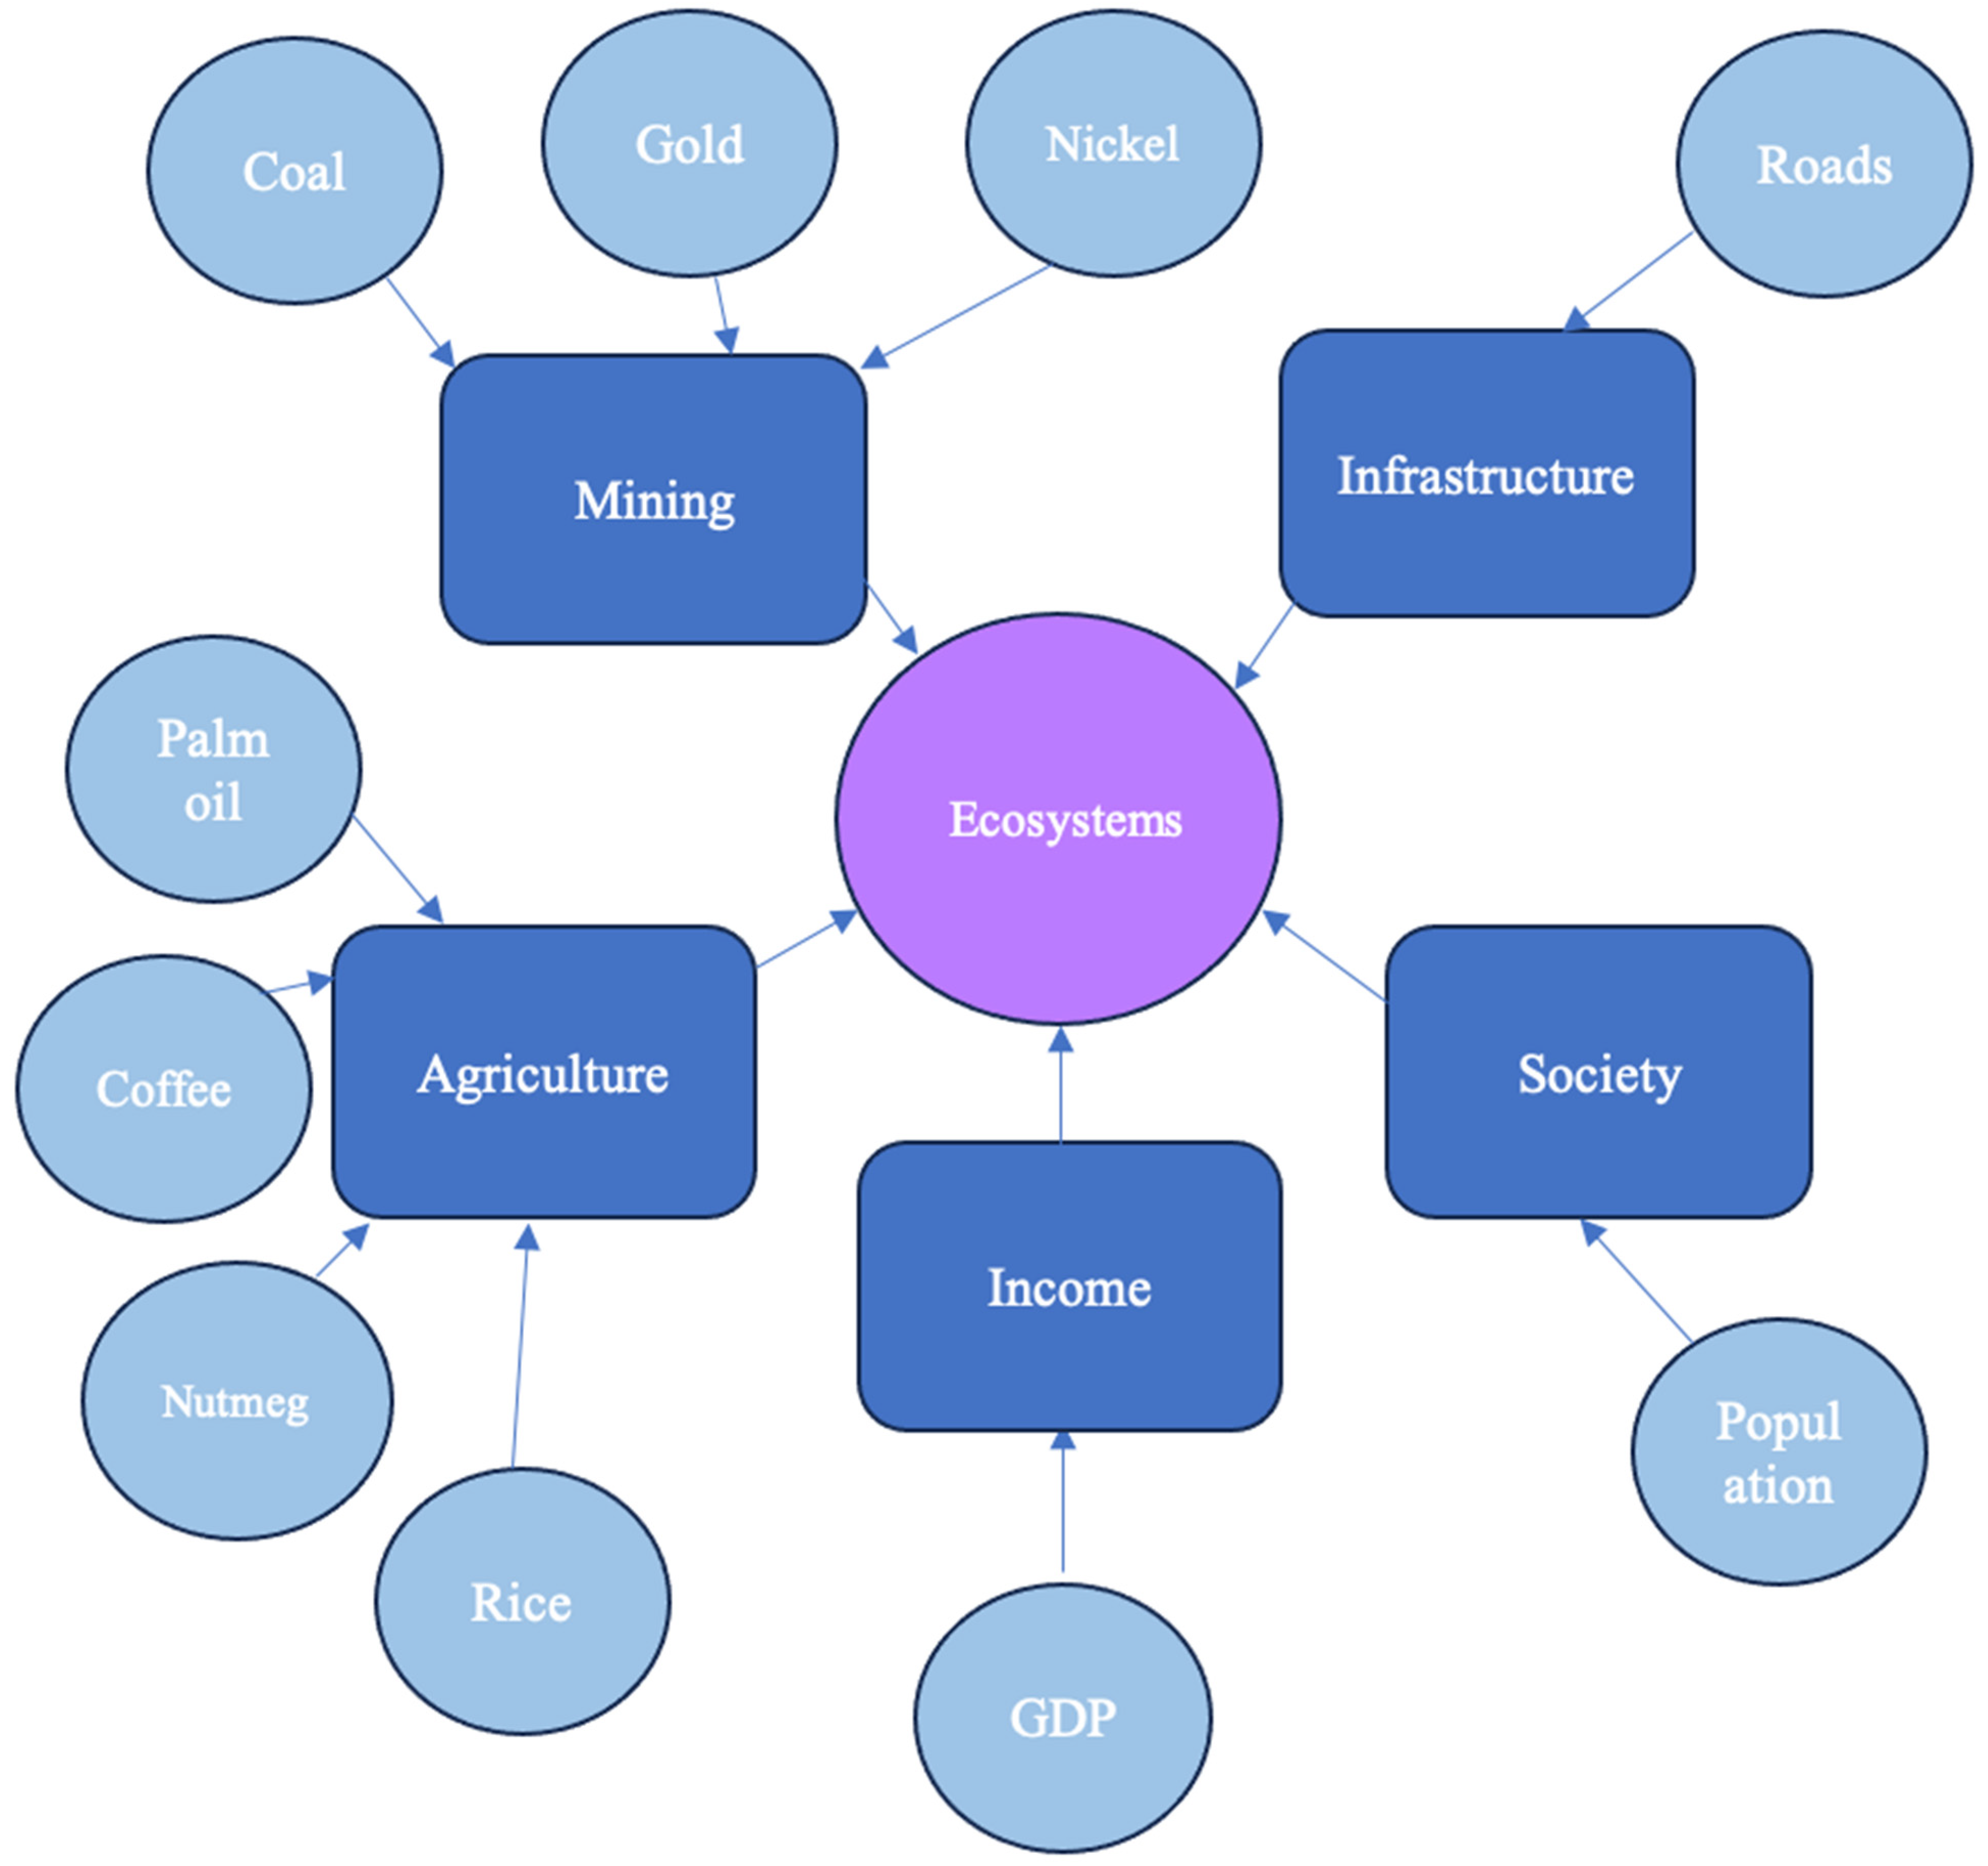
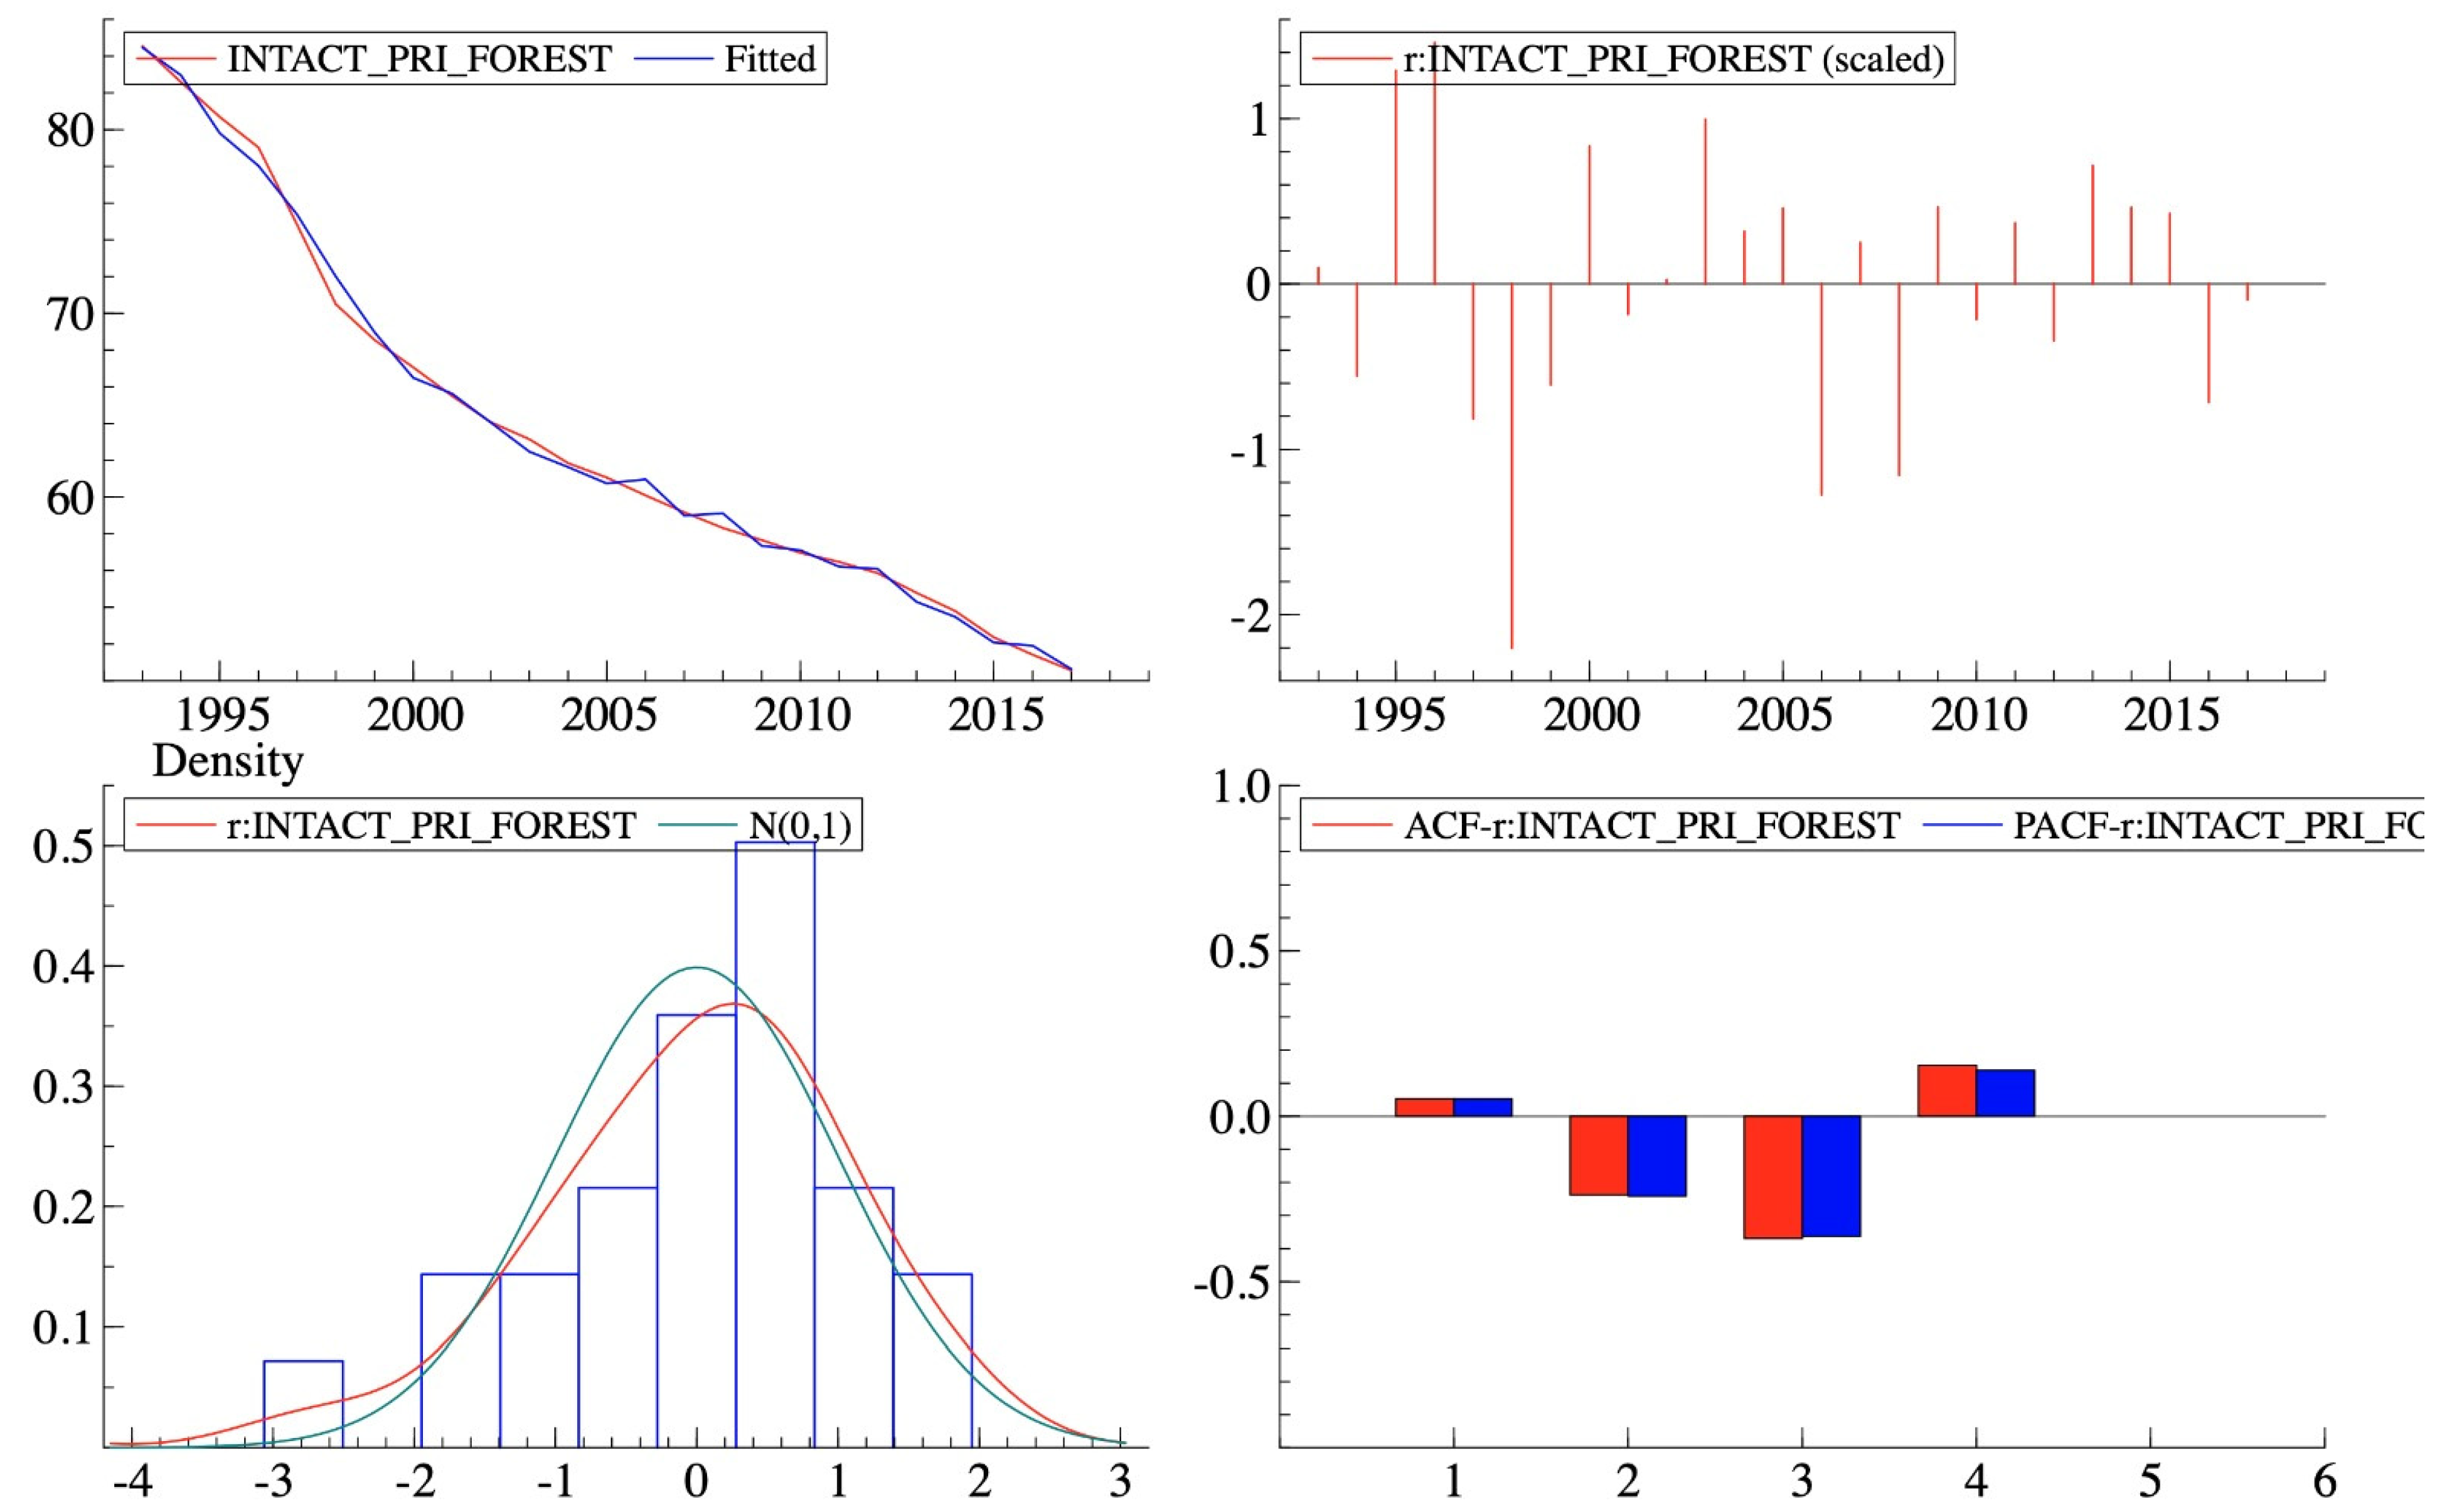
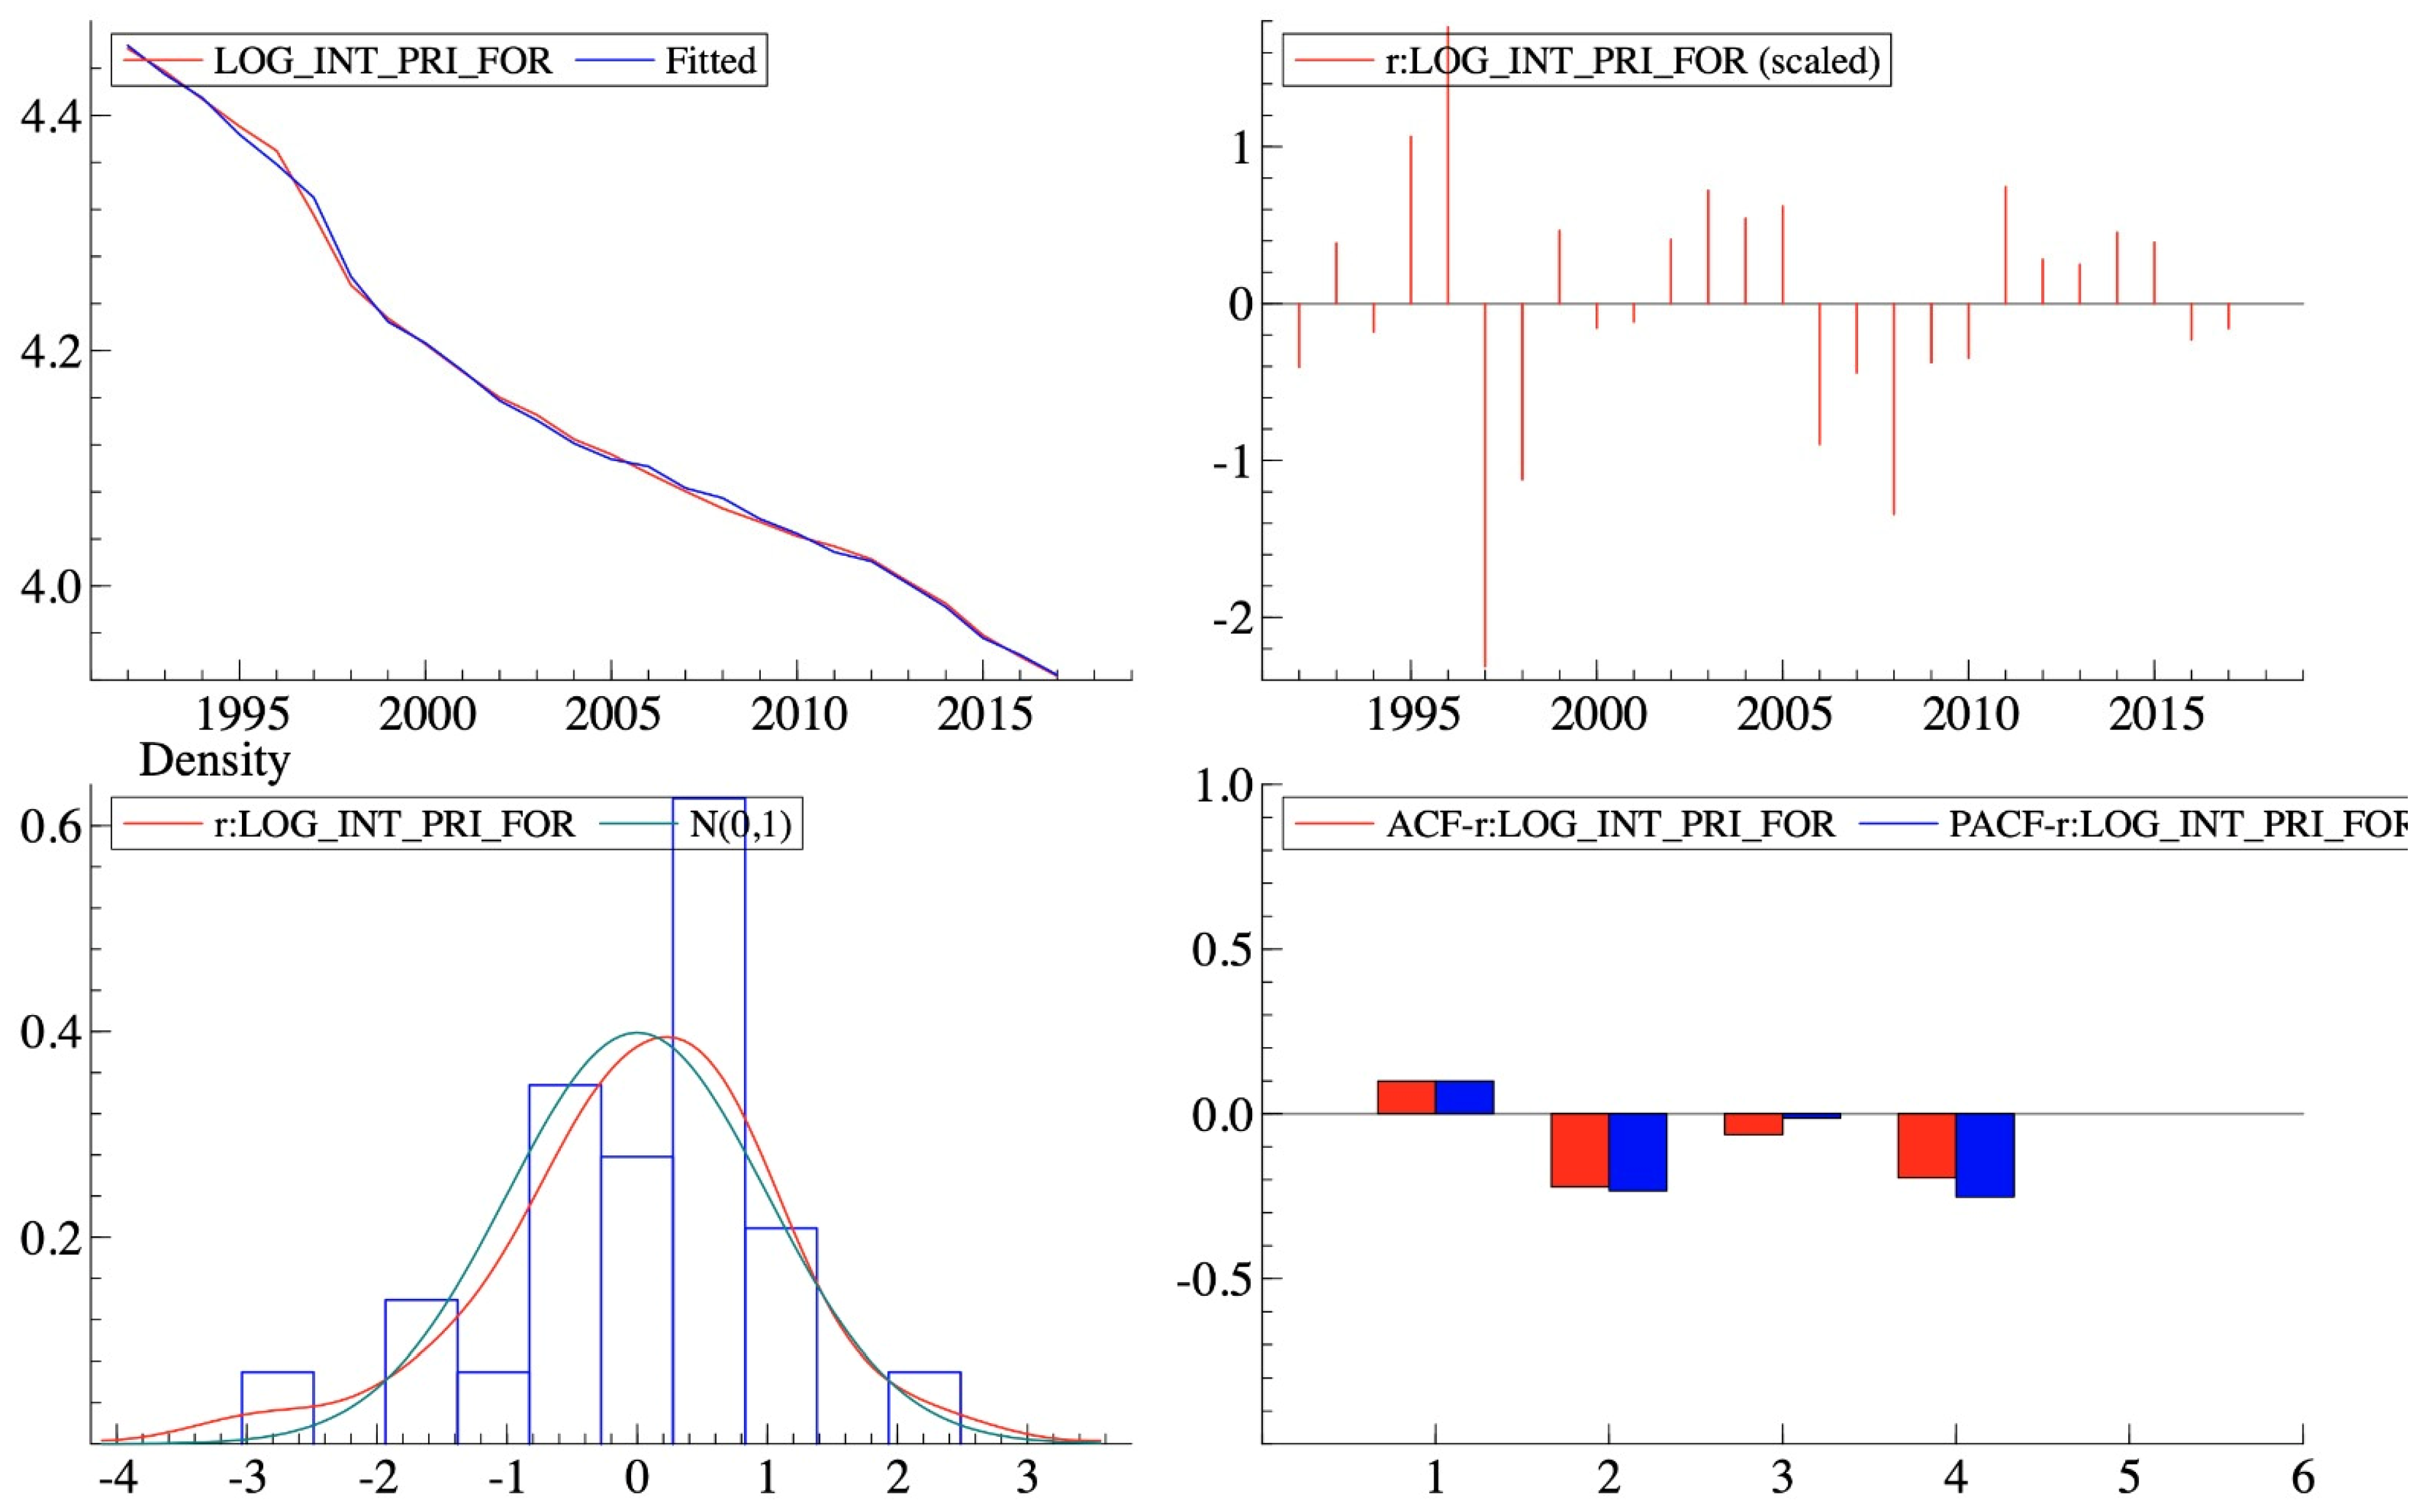
4. Multi-Factor Econometric Model of Ecosystem Deterioration in Indonesia
5. Discussion
- Acknowledge Indonesia’s Global Significance for Biodiversity: Indonesia is one of the most important biodiversity hubs globally, and preserving its ecosystems must be a national and international priority.
- Address the Drivers of Deforestation: Palm oil production, coal mining, and population pressures have been major contributors to forest loss. Effective policies to curb these pressures are urgently needed to reverse the trend of deforestation.
- Implement Comprehensive Ecosystem Services Mapping: Conduct nationwide mapping of ecosystem services at a resolution of 1 × 1 km or finer to identify critical biodiversity hotspots.
- Protect High-Value Areas: Exclude the top 25% of areas with the highest multidimensional biodiversity value from all economic and infrastructure development activities.
- Redefine the Economic Framework: Adopt a framework of ecological economics, placing the economic system firmly within environmental boundaries. Recognize ecosystems as holistic systems with intrinsic and instrumental value.
- Foster Transparency and Accountability: Establish robust monitoring systems in collaboration with Indonesia’s Statistical Office, Geospatial Information Agency, and Space Agency to ensure transparency and long-term tracking of biodiversity offset outcomes.
- Develop Centers of Green Economic Growth: Focus on low-resource, high-value industries such as software development, education, health, eco-tourism, and financial services. Actively pursue ecosystem restoration and regeneration alongside economic development.
- Strengthen Research and Capacity Building: Expand research centers focused on satellite imagery and ecosystem modeling, fostering local expertise in sustainable development and ecological management.
- Position Indonesia as a Global Conservation Leader: By adopting an innovative, data-driven approach, Indonesia can lead mega-diverse nations in developing conservation strategies that align with global biodiversity goals.
6. Conclusions
Funding
Institutional Review Board Statement
Informed Consent Statement
Data Availability Statement
Acknowledgments
Conflicts of Interest
Glossary
| Akaike Information Criterion (AIC) | A measure used to compare the relative quality of statistical models for a given dataset. AIC balances model fit with complexity, penalizing models with more parameters. Lower AIC values indicate a better model. |
| Backloading | Backloading refers to the practice of deferring biodiversity offset requirements until after a development project has been approved or commenced. Commonly observed in Australia, this tactic allows developers to proceed with land clearing before committing to specific offset actions, thereby weakening regulatory oversight and environmental safeguards. It undermines the mitigation hierarchy by prioritizing economic development over biodiversity protection and often results in inadequate, poorly matched, or symbolic offset measures. Backloading reduces transparency, shifts negotiating power to developers, and has been widely criticized for enabling biodiversity loss under the guise of compliance. |
| Biodiversity | The variability among living organisms from all sources including terrestrial, marine and other aquatic ecosystems and the ecological complexes of which they are a part; this includes diversity within species, between species and of ecosystems. (UN, 1992) [3]. |
| CBD Kunming Montreal Biodiversity Framework | The Kunming-Montreal Global Biodiversity Framework (GBF) was adopted during the fifteenth meeting of the Conference of the Parties (COP 15) following a four-year consultation and negotiation process. This historic Framework, which supports the achievement of the Sustainable Development Goals and builds on the Convention’s previous Strategic Plans, sets out an ambitious pathway to reach the global vision of a world living in harmony with nature by 2050. Among the Framework’s key elements are 4 goals for 2050 and 23 targets for 2030 (UN CBD, 2022) [4]. |
| Common International Classification of Ecosystem Services | CICES aims to classify the contributions that ecosystems make to human well-being that arise from living processes (Potschin et al., 2016) [81]. |
| Ecosystem | A dynamic complex of plant, animal and micro-organism communities and their non-living environment interacting as a functional unit (UN, 1992) [3] |
| Ecosystem services | The benefits people obtain from ecosystems. These include provisioning services such as food and water; regulating services such as flood and disease control; cultural services such as spiritual, recreational, and cultural benefits; and supporting services such as nutrient cycling that maintain the conditions for life on Earth. The concept ‘‘ecosystem goods and services’’ is synonymous with ecosystem services (IPBES). |
| Environmental Impact Assessment | Environmental Impact Assessment (EIA) is a systematic process for identifying, predicting, evaluating, and mitigating the potential environmental effects of proposed projects, plans, or policies before they are implemented. The primary objective of EIA is to ensure that environmental considerations are integrated into decision-making processes to minimize adverse impacts on the environment and enhance sustainable development (UNEP, 2002) [82]. |
| Gross Domestic Product (GDP) | The total monetary value of all goods and services produced within a country over a specific period. It is commonly used as an indicator of a nation’s economic performance. |
| Mitigation hierarchy | The mitigation hierarchy is a tool designed to help users limit, as far as possible, the negative impacts of development projects on biodiversity and ecosystem services. It involves a sequence of four key actions—‘avoid’, ‘minimize’, ‘restore’ and ‘offset’—and provides a best practice approach to aid in the sustainable management of living, natural resources by establishing a mechanism to balance conservation needs with development priorities (Ekstrom et al., 2015) [83]. |
| Multicollinearity | A statistical phenomenon in which two or more independent variables in a regression model are highly correlated, making it difficult to isolate the individual effect of each variable. Severe multicollinearity can inflate standard errors and reduce model reliability. |
| Multi-criteria decision aid | The Multi-Criteria Decision Aid (MCDA) is a branch of the operational research discipline that addresses complex decision-making problems featuring high uncertainty and conflicting objectives (Wang et al., 2009) [84]. |
| Econometrics | Econometrics concerns itself with the application of mathematical statistics and the tools of statistical inference to the empirical measurement of relationships postulated by an underlying theory (Greene, 2018) [85]. |
| ELECTRE TRI | ELECTRE TRI is the multi-criteria decision aid tool based on the outranking approach representing the group of multicriteria sorting methods. It is one of the most frequently used methods of its kind (Emamat et al., 2022) [86]. |
| No Net Loss | The situation where negative biodiversity impacts caused by the project are balanced by the mitigation measures (IUCN). |
| Net Positive Impact | A net gain to biodiversity features measured in quality hectares (for habitats), number or percentage of individuals (for species), or other metrics appropriate to the feature (IPBES). |
| Nature-based Solutions | Actions to protect, conserve, restore, sustainably use and manage natural or modified terrestrial, freshwater, coastal and marine ecosystems, which address social, economic and environmental challenges effectively and adaptively, while simultaneously providing human well-being, ecosystem services and resilience and biodiversity benefits (United Nations Environmental Assembly). |
| PRISMA | PRISMA is a method for evidence-based reporting for systematic reviews and meta-analyses. It primarily focuses on the reporting of reviews evaluating the effects of policy interventions or medical research (Page et al., 2021) [13]. |
| R2 (Coefficient of Determination) | A statistical measure that indicates how well the independent variables explain the variability of the dependent variable in a regression model. Values range from 0 to 1, with higher values indicating a better fit. |
Appendix A


References
- IPBES. Global Assessment Report on Biodiversity and Ecosystem Services of the Intergovernmental Science-Policy Platform on Biodiversity and Ecosystem Services (Version 1); Zenodo: Geneva, Switzerland, 2019. [Google Scholar] [CrossRef]
- Brondízio, E.S.; Settele, J.; Díaz, S.; Ngo, H.T. (Eds.) The Global Assessment Report of the Intergovernmental Science-Policy Platform on Biodiversity and Ecosystem Services; Intergovernmental Science-Policy Platform on Biodiversity and Ecosystem Services (IPBES): Bonn, Germany, 2019. [Google Scholar]
- UN. Convention on Biological Diversity. United Nations. 1992. Available online: https://treaties.un.org/doc/Treaties/1992/06/19920605%2008-44%20PM/Ch_XXVII_08p.pdf (accessed on 1 June 2025).
- UN CBD. Kunming-Montreal Global Biodiversity Framework, CBD/COP/DEC/15/4 19 December 2022. UNEP. 2022. Available online: https://www.cbd.int/doc/decisions/cop-15/cop-15-dec-04-en.pdf (accessed on 1 June 2025).
- Anonymous. The United Nations must get its new biodiversity targets right. Nature 2020, 578, 337–338. [Google Scholar] [CrossRef] [PubMed]
- BBOP. Guidance Notes to the Standard on Biodiversity Offsets. Business and Biodiversity Offsets Programme. 2012. Available online: https://www.forest-trends.org/wp-content/uploads/imported/BBOP_Standard_Guidance_Notes_20_Mar_2012_Final_WEB.pdf (accessed on 1 June 2025).
- Shmelev, S.E.; Agbleze, L.; Spangenberg, J.H. Multidimensional Ecosystem Mapping: Towards a More Comprehensive Spatial Assessment of Nature’s Contributions to People in France. Sustainability 2023, 15, 7557. [Google Scholar] [CrossRef]
- TNFD. Recommendations of the Taskforce on Nature-Related Financial Disclosures. 2023. Available online: https://tnfd.global/wp-content/uploads/2023/08/Recommendations_of_the_Taskforce_on_Nature-related_Financial_Disclosures_September_2023.pdf?v=1695118661 (accessed on 1 June 2025).
- Shmelev, S.E.; Speck, S.U. Green fiscal reform in Sweden: Econometric assessment of the carbon and energy taxation scheme. Renew. Sustain. Energy Rev. 2018, 90, 969–981. [Google Scholar] [CrossRef]
- Shmelev, S.E.; Gilardi, E. Corporate Environmental, Social, and Governance Performance: The Impacts on Financial Returns, Business Model Innovation, and Social Transformation. Sustainability 2025, 17, 1286. [Google Scholar] [CrossRef]
- Shmelev, S.E.; Gilardi, E. Sustainable Business as a Force for Good in the Context of Climate Change: An Econometric Modelling Approach. Sustainability 2025, 17, 1530. [Google Scholar] [CrossRef]
- Shmelev, S. Ecological Economics: Sustainability in Practice; Springer: Berlin/Heidelberg, Germany, 2012. [Google Scholar]
- Page, M.J.; McKenzie, J.E.; Bossuyt, P.M.; Boutron, I.; Hoffmann, T.C.; Mulrow, C.D.; Shamseer, L.; Tetzlaff, J.M.; Akl, E.A.; Brennan, S.E.; et al. The PRISMA 2020 statement: An updated guideline for reporting systematic reviews. Syst. Rev. 2021, 10, 89. [Google Scholar] [CrossRef]
- Abdo, L.; Griffin, S.; Kemp, A.; Coupland, G. Disparity in biodiversity offset regulation across Australia may reduce effectiveness. Australas. J. Environ. Manag. 2021, 28, 81–103. [Google Scholar] [CrossRef]
- Maron, M.; Gordon, A.; Mackey, B.G.; Possingham, H.P.; Watson, J.E.M. Interactions Between Biodiversity Offsets and Protected Area Commitments: Avoiding Perverse Outcomes. Conserv. Lett. 2016, 9, 384–389. [Google Scholar] [CrossRef]
- Lodhia, S.; Martin, N.; Rice, J. Appraising offsets as a tool for integrated environmental planning and management. J. Clean. Prod. 2018, 178, 34–44. [Google Scholar] [CrossRef]
- Gordon, A.; Bull, J.W.; Wilcox, C.; Maron, M. FORUM: Perverse incentives risk undermining biodiversity offset policies. J. Appl. Ecol. 2015, 52, 532–537. [Google Scholar] [CrossRef]
- Bezombes, L.; Kerbiriou, C.; Spiegelberger, T. Do biodiversity offsets achieve No Net Loss? An evaluation of offsets in a French department. Biol. Conserv. 2019, 231, 24–29. [Google Scholar] [CrossRef]
- Bull, J.W.; Gordon, A.; Milner-Gulland, E.J.; Singh, N.J.; Suttle, K.B. Biodiversity offsets in theory and practice. Oryx 2013, 47, 369–380. [Google Scholar] [CrossRef]
- Evans, M.C. Backloading to extinction: Coping with values conflict in the administration of Australia’s federal biodiversity offset policy. Aust. J. Public Adm. 2023, 82, 228–247. [Google Scholar] [CrossRef]
- Jacob, C.; Vaissiere, A.-C.; Bas, A.; Calvet, C. Investigating the inclusion of ecosystem services in biodiversity offsetting. Ecosyst. Serv. 2016, 21, 92–102. [Google Scholar] [CrossRef]
- Narain, D.; Maron, M. Cost shifting and other perverse incentives in biodiversity offsetting in India. Conserv. Biol. 2018, 32, 782–788. [Google Scholar] [CrossRef]
- Gibbons, P.; Macintosh, A.; Constable, A.L.; Hayashi, K. Outcomes from 10 years of biodiversity offsetting. Glob. Change Biol. 2018, 24, e643–e654. [Google Scholar] [CrossRef]
- Bigard, C.; Pioch, S.; Thompson, J.D. The inclusion of biodiversity in environmental impact assessment: Policy-related progress limited by gaps and semantic confusion. J. Environ. Manag. 2017, 200, 35–45. [Google Scholar] [CrossRef]
- Niner, H.J.; Jones, P.J.S.; Milligan, B.; Styan, C. Exploring the practical implementation of marine biodiversity offsetting in Australia. J. Environ. Manag. 2021, 295, 113062. [Google Scholar] [CrossRef]
- Hubert Ta, L.; Campbell, B. Environmental protection in Madagascar: Biodiversity offsetting in the mining sector as a corporate social responsibility strategy. Extr. Ind. Soc. 2023, 15, 101305. [Google Scholar] [CrossRef]
- Levrel, H.; Scemama, P.; Vaissière, A.-C. Should We Be Wary of Mitigation Banking? Evidence Regarding the Risks Associated with this Wetland Offset Arrangement in Florida. Ecol. Econ. 2017, 135, 136–149. [Google Scholar] [CrossRef]
- Stone, R.; Callaway, R.; Bull, J.C. Are biodiversity offsetting targets of ecological equivalence feasible for biogenic reef habitats? Ocean. Coast. Manag. 2019, 177, 97–111. [Google Scholar] [CrossRef]
- Sales Rosa, J.C.; Campos, P.B.R.; Nascimento, C.B.; Souza, B.A.; Valetich, R.; Sánchez, L.E. Enhancing ecological connectivity through biodiversity offsets to mitigate impacts on habitats of large mammals in tropical forest environments. Impact Assess. Proj. Apprais. 2023, 41, 333–348. [Google Scholar] [CrossRef]
- Budiharta, S.; Meijaard, E.; Gaveau, D.L.A.; Struebig, M.J.; Wilting, A.; Kramer-Schadt, S.; Niedballa, J.; Raes, N.; Maron, M.; Wilson, K.A. Restoration to offset the impacts of developments at a landscape scale reveals opportunities, challenges and tough choices. Glob. Environ. Change 2018, 52, 152–161. [Google Scholar] [CrossRef]
- Apostolopoulou, E. Biodiversity offsetting in England: Governance rescaling, socio-spatial injustices, and the \hack\break neoliberalization of nature. Web Ecol. 2016, 16, 67–71. [Google Scholar] [CrossRef]
- Lindenmayer, D.B.; Crane, M.; Evans, M.C.; Maron, M.; Gibbons, P.; Bekessy, S.; Blanchard, W. The anatomy of a failed offset. Biol. Conserv. 2017, 210, 286–292. [Google Scholar] [CrossRef]
- Kalliolevo, H.; Gordon, A.; Sharma, R.; Bull, J.W.; Bekessy, S.A. Biodiversity offsetting can relocate nature away from people: An empirical case study in Western Australia. Conserv. Sci. Pract. 2021, 3, e512. [Google Scholar] [CrossRef]
- Bidaud, C.; Schreckenberg, K.; Jones, J.P.G. The local costs of biodiversity offsets: Comparing standards, policy and practice. Land Use Policy 2018, 77, 43–50. [Google Scholar] [CrossRef]
- Souza, B.A.; Rosa, J.C.S.; Siqueira-Gay, J.; Sánchez, L.E. Mitigating impacts on ecosystem services requires more than biodiversity offsets. Land Use Policy 2021, 105, 105393. [Google Scholar] [CrossRef]
- Bull, J.W.; Strange, N. The global extent of biodiversity offset implementation under no net loss policies. Nat. Sustain. 2018, 1, 790–798. [Google Scholar] [CrossRef]
- Vatn, A. Markets in environmental governance. From theory to practice. Ecol. Econ. 2015, 117, 225–233. [Google Scholar] [CrossRef]
- Muradian, R.; Arsel, M.; Pellegrini, L.; Adaman, F.; Aguilar, B.; Agarwal, B.; Corbera, E.; Ezzine de Blas, D.; Farley, J.; Froger, G.; et al. Payments for ecosystem services and the fatal attraction of win-win solutions. Conserv. Lett. 2013, 6, 274–279. [Google Scholar] [CrossRef]
- Filoche, G. Playing musical chairs with land use obligations: Market-based instruments and environmental public policies in Brazil. Land Use Policy 2017, 63, 20–29. [Google Scholar] [CrossRef]
- Maron, M.; Hobbs, R.J.; Moilanen, A.; Matthews, J.W.; Christie, K.; Gardner, T.A.; Keith, D.A.; Lindenmayer, D.B.; McAlpine, C.A. Faustian bargains? Restoration realities in the context of biodiversity offset policies. Biol. Conserv. 2012, 155, 141–148. [Google Scholar] [CrossRef]
- Carreras Gamarra, M.J.; Toombs, T.P. Thirty years of species conservation banking in the U.S.: Comparing policy to practice. Biol. Conserv. 2017, 214, 6–12. [Google Scholar] [CrossRef]
- zu Ermgassen, S.O.S.E.; Baker, J.; Griffiths, R.A.; Strange, N.; Struebig, M.J.; Bull, J.W. The ecological outcomes of biodiversity offsets under “no net loss” policies: A global review. Conserv. Lett. 2019, 12, e12664. [Google Scholar] [CrossRef]
- Costana, R.; de Groot, R.; Sutton, P.; van der Ploeg, S.; Anderson, S.J.; Kubisewski, I.; Farber, S.; Turner, R.K. Changes in the global value of ecosystem services. Glob. Environ. Change 2014, 26, 152–158. [Google Scholar] [CrossRef]
- Boentoro, M.R.B.; Wherrett, T. Limits of acceptable change for sustainable management of the Pelawan Biodiversity Park, Bangka Belitung Islands. IOP Conf. Ser. Earth Environ. Sci. 2021, 913, 012056. [Google Scholar] [CrossRef]
- Jati, A.S.; Samejima, H.; Fujiki, S.; Kurniawan, Y.; Aoyagi, R.; Kitayama, K. Effects of logging on wildlife communities in certified tropical rainforests in East Kalimantan, Indonesia. For. Ecol. Manag. 2018, 427, 124–134. [Google Scholar] [CrossRef]
- Cabernard, L.; Pfister, S. Hotspots of Mining-Related Biodiversity Loss in Global Supply Chains and the Potential for Reduction through Renewable Electricity. Environ. Sci. Technol. 2022, 56, 16357–16368. [Google Scholar] [CrossRef]
- Novianti, V.; Marrs, R.H.; Choesin, D.N.; Iskandar, D.T.; Suprayogo, D. Natural regeneration on land degraded by coal mining in a tropical climate: Lessons for ecological restoration from Indonesia. Land Degrad. Dev. 2018, 29, 4050–4060. [Google Scholar] [CrossRef]
- Woodbury, D.J.; Yassir, I.; Doroski, D.A.; Queenborough, S.A.; Ashton, M.S. Filling a void: Analysis of early tropical soil and vegetative recovery under leguminous, post-coal mine reforestation plantations in East Kalimantan, Indonesia. Land Degrad. Dev. 2020, 31, 473–487. [Google Scholar] [CrossRef]
- Isworo, S.; Oetari, P.S. Diversity of vegetation, birds, dragonflies and butterflies at coal mining reclamation sites in South Kalimantan, Indonesia. Biodiversitas 2023, 24, 5376–5390. [Google Scholar]
- PwC. Mining in Indonesia: Investment, Taxation and Regulatory Guide 2023. 2023. Available online: https://www.pwc.com/id/en/energy-utilities-mining/assets/mining/mining-guide-2023.pdf (accessed on 1 June 2025).
- Yu, L.; Cao, Y.; Cheng, Y.; Zhao, Q.; Xu, Y.; Kanniah, K.; Lu, H.; Yang, R.; Gong, P. A study of the serious conflicts between oil palm expansion and biodiversity conservation using high-resolution remote sensing. Remote Sens. Lett. 2023, 14, 654–668. [Google Scholar] [CrossRef]
- Zhao, J.; Lee, J.S.H.; Elmore, A.J.; Fatimah, Y.A.; Numata, I.; Zhang, X.; Cochrane, M.A. Spatial patterns and drivers of smallholder oil palm expansion within peat swamp forests of Riau, Indonesia. Environ. Res. Lett. 2022, 17, 044015. [Google Scholar] [CrossRef]
- Jong, H.N. Palm Oil Deforestation Makes Comeback in Indonesia After Decade-Long Slump; Mongabay: Menlo Park, CA, USA, 2024; Available online: https://news.mongabay.com/2024/02/palm-oil-deforestation-makes-comeback-in-indonesia-after-decade-long-slump/ (accessed on 1 June 2025).
- Spencer, K.L.; Deere, N.J.; Aini, M.; Avriandy, R.; Campbell-Smith, G.; Cheyne, S.M.; Gaveau, D.L.A.; Humle, T.; Hutabarat, J.; Loken, B.; et al. Implications of large-scale infrastructure development for biodiversity in Indonesian Borneo. Sci. Total Environ. 2023, 866, 161075. [Google Scholar] [CrossRef]
- UNDP. Indonesia: Sustainable Palm Oil. 2024. Available online: https://www.undp.org/facs/indonesia-sustainable-palm-oil (accessed on 1 June 2025).
- Ministerie van Landbouw, N. en V. SustainPalm: Indonesia and the Netherlands Cooperation on Sustainable Palm Oil-Nieuwsbericht—Agroberichten Buitenland [Nieuwsbericht]. Ministerie van Landbouw, Natuur en Voedselkwaliteit. 2023. Available online: https://www.agroberichtenbuitenland.nl/actueel/nieuws/2023/02/28/sustainpalm---indonesia-and-the-netherlands-cooperation-on-sustainable-palm-oil (accessed on 1 June 2025).
- Smith, G. Mapping a More Sustainable Palm Oil Future in Indonesia. CIFOR Forests News. 2023. Available online: https://forestsnews.cifor.org/83622/mapping-a-more-sustainable-palm-oil-future-in-indonesia?fnl= (accessed on 1 June 2025).
- Wageningen University. SustainPalm: Sustainable Oil Palm Indonesia. WUR. 2023. Available online: https://www.wur.nl/en/project/sustainpalm-sustainable-oil-palm-indonesia.htm (accessed on 1 June 2025).
- IDH. The National Initiative on Sustainable and Climate Smart Oil Palm Smallholders (NI SCOPS). IDH Sustainable Trade Inititative, Government of the The Netherlands. 2024. Available online: https://www.idhsustainabletrade.com/uploaded/2020/10/200930-NI-SCOPS_2-pager_Indonesia_Final.pdf (accessed on 1 June 2025).
- UNDP. The Indonesian Palm Oil Platform Palm and the National Action Plan. 2014. Available online: https://www.undp.org/sites/g/files/zskgke326/files/migration/gcp/UNDP_GCP_Indonesia---Palm-Oil-Platform-and-National-Action-Plan.pdf (accessed on 1 June 2025).
- Putri, E.I.K.; Dharmawan, A.H.; Hospes, O.; Yulian, B.E.; Amalia, R.; Mardiyaningsih, D.I.; Kinseng, R.A.; Tonny, F.; Pramudya, E.P.; Rahmadian, F.; et al. The Oil Palm Governance: Challenges of Sustainability Policy in Indonesia. Sustainability 2022, 14, 1820. [Google Scholar] [CrossRef]
- Ministry of National Development Planning. Public Private Partnership. Infrastructure Plan in Indonesia. 2023. Available online: https://perpustakaan.bappenas.go.id/e-library/file_upload/koleksi/migrasi-data-publikasi/file/Unit_Kerja/Direktorat%20Pengembangan%20Pendanaan%20Pembangunan/PPP%20Book%202023.pdf (accessed on 1 June 2025).
- Ernyasih, E.; Mallongi, A.; Daud, A.; Palutturi, S.; Stang, S.; Thaha, A.R.; Ibrahim, E.; Madhoun, W.A. Health risk assessment through probabilistic sensitivity analysis of carbon monoxide and fine particulate transportation exposure. Glob. J. Environ. Sci. Manag. 2023, 9, 933–950. [Google Scholar]
- WHO. WHO Global Air Quality Guidelines. Particulate Matter (PM2.5 and PM10), Ozone, Nitrogen Dioxide, Sulfur Dioxide and Carbon Monoxide. WHO. 2021. Available online: https://iris.who.int/bitstream/handle/10665/345329/9789240034228-eng.pdf (accessed on 1 June 2025).
- Listyarini, S.; Warlina, L.; Sambas, A. Air Quality Monitoring System in South Tangerang Based on Arduino Uno: From Analysis to Implementation. IOP Conf. Ser. Mater. Sci. Eng. 2021, 1115, 1. [Google Scholar] [CrossRef]
- Sulistyowati, L.; Yolanda, Y.; Andareswari, N. Harbor water pollution by heavy metal concentrations in sediments. Glob. J. Environ. Sci. Manag. 2023, 9, 885–898. [Google Scholar]
- Asih, A.S.; Zamroni, A.; Alwi, W.; Sagala, S.T.; Putra, A.S. Assessment of Heavy Metal Concentrations in Seawater in the Coastal Areas around Daerah Istimewa Yogyakarta Province, Indonesia. Iraqi Geol. J. 2022, 55, 14–22. [Google Scholar] [CrossRef]
- Hasibuan, H.S.; Mulyani, M. Transit-Oriented Development: Towards Achieving Sustainable Transport and Urban Development in Jakarta Metropolitan, Indonesia. Sustainability 2022, 14, 5244. [Google Scholar] [CrossRef]
- Alamgir, M.; Campbell, M.J.; Sloan, S.; Suhardiman, A.; Supriatna, J.; Laurance, W.F. High-risk infrastructure projects pose imminent threats to forests in Indonesian Borneo. Sci. Rep. 2019, 9, 140. [Google Scholar] [CrossRef]
- Parker, D.; Tosiani, A.; Yazid, M.; Sari, I.L.; Kartika, T.; Kustiyo; Firmansyah, R.; Said, Z.; Wijaya, A.; Potapov, P.; et al. Land in limbo: Nearly one third of Indonesia’s cleared old-growth forests left idle. Proc. Natl. Acad. Sci. USA 2024, 121, e2318029121. [Google Scholar] [CrossRef]
- Anderson, Z.R.; Kusters, K.; McCarthy, J.; Obidzinski, K. Green growth rhetoric versus reality: Insights from Indonesia. Glob. Environ. Change 2016, 38, 30–40. [Google Scholar] [CrossRef]
- Brockhaus, M.; Obidzinski, K.; Dermawan, A.; Laumonier, Y.; Luttrell, C. An overview of forest and land allocation policies in Indonesia: Is the current framework sufficient to meet the needs of REDD+? For. Policy Econ. 2012, 18, 30–37. [Google Scholar] [CrossRef]
- Damastuti, E.; De Groot, R. Participatory ecosystem service mapping to enhance community-based mangrove rehabilitation and management in Demak, Indonesia. Reg. Environ. Change 2019, 19, 65–78. [Google Scholar] [CrossRef]
- Nugroho, H.Y.S.H.; Nurfatriani, F.; Indrajaya, Y.; Yuwati, T.W.; Ekawati, S.; Salminah, M.; Gunawan, H.; Subarudi, S.; Sallata, M.K.; Allo, M.K.; et al. Mainstreaming Ecosystem Services from Indonesia’s Remaining Forests. Sustainability 2022, 14, 12124. [Google Scholar] [CrossRef]
- Mathys, A.S.; Van Vianen, J.; Rowland, D.; Narulita, S.; Palomo, I.; Pascual, U.; Sutherland, I.J.; Ahammad, R.; Sunderland, T. Participatory mapping of ecosystem services across a gradient of agricultural intensification in West Kalimantan, Indonesia. Ecosyst. People 2023, 19, 2174685. [Google Scholar] [CrossRef]
- Triana, K.; Wahyudi, A.J. GIS Developments for Ecosystem-based Marine Spatial Planning and the Challenges Faced in Indonesia. ASEAN J. Sci. Technol. Dev. 2020, 36, 4. [Google Scholar] [CrossRef]
- Fauzi, A.I.; Azizah, N.; Yati, E.; Atmojo, A.T.; Rohman, A.; Putra, R.; Rahadianto, M.A.E.; Ramadhanti, D.; Ardani, N.H.; Robbani, B.F.; et al. Potential Loss of Ecosystem Service Value Due to Vessel Activity Expansion in Indonesian Marine Protected Areas. ISPRS Int. J. Geo-Inf. 2023, 12, 75. [Google Scholar] [CrossRef]
- Tjahjono, R.E.P.; Infrawan, D.Y.D.; Aprilia, S.; Adi, R.F.; Basit, R.A.; Wibowo, A.; Wijanarko, K. Translation of international frameworks and national policies on climate change, land degradation, and biodiversity to develop integrated risk assessment for watershed management in Indonesia. Watershed Ecol. Environ. 2024, 6, 1–12. [Google Scholar] [CrossRef]
- Norgaard, R.B. Ecosystem services: From eye-opening metaphor to complexity blinder. Spec. Sect.-Paym. Environ. Serv. Reconciling Theory Pract. 2010, 69, 1219–1227. [Google Scholar] [CrossRef]
- IPBES. Methodological Assessment of the Diverse Values and Valuation of Nature of the Intergovernmental Science-Policy Platform on Biodiversity and Ecosystem Services; Zenodo: Geneva, Switzerland, 2022. [Google Scholar] [CrossRef]
- Potschin, M.; Haines-Young, R.H.; Fish, R.; Turner, R.K. (Eds.) Routledge Handbook of Ecosystem Services; Routledge, Taylor & Francis Group: London, UK, 2016. [Google Scholar]
- UNEP. Environmental Impact Assessment: Training Resource Manual. 2002. Available online: https://wedocs.unep.org/bitstream/handle/20.500.11822/26503/EIA_Training_Resource_Manual.pdf (accessed on 1 June 2025).
- Ekstrom, J.; Bennun, L.; Mitchell, R. A cross-sector guide for implementing the Mitigation Hierarchy. Cross Sector Biodiversity Initiative. 2015. Available online: https://www.ipieca.org/resources/a-cross-sector-guide-for-implementing-the-mitigation-hierarchy (accessed on 1 June 2025).
- Wang, J.-J.; Jing, Y.-Y.; Zhang, C.-F.; Zhao, J.-H. Review on multi-criteria decision analysis aid in sustainable energy decision-making. Renew. Sustain. Energy Rev. 2009, 13, 2263–2278. [Google Scholar] [CrossRef]
- Greene, W. Econometric Analysis, 8th ed.; Pearson: San Antonio, TX, USA, 2018. [Google Scholar]
- Emamat, M.S.M.M.; Mota, C.M.D.M.; Mehregan, M.R.; Sadeghi Moghadam, M.R.; Nemery, P. Using ELECTRE-TRI and FlowSort methods in a stock portfolio selection context. Financ. Innov. 2022, 8, 11. [Google Scholar] [CrossRef]


| Coefficient | Std. Error | t-Value | t-Prob | Part. R2 | |
|---|---|---|---|---|---|
| Constant | 73.6299 | 2.374 | 31.0 | 0.0000 | 0.9826 |
| Population | −0.000000116 | 0.00000001.41 | −8.20 | 0.0000 | 0.7981 |
| GDP | 0.00157451 | 0.0002517 | 6.26 | 0.0000 | 0.6972 |
| Palm | −0.161774 | 0.01914 | −8.45 | 0.0000 | 0.8078 |
| Coal | −0.00633069 | 0.002666 | −2.37 | 0.0296 | 0.2491 |
| POM | −0.724765 | 0.2578 | −2.81 | 0.0120 | 0.3173 |
| Coefficient | Std. Error | t-Value | t-Prob | Part. R2 | |
|---|---|---|---|---|---|
| Constant | 10.0121 | 3.506 | 2.86 | 0.0082 | 0.2320 |
| LOG_POP | −0.932304 | 0.3732 | −2.50 | 0.0189 | 0.1877 |
| LOG_COAL_POP | −0.049530 | 0.02411 | −2.05 | 0.0497 | 0.1352 |
| LOG_PALM_POP | 0.108156 | 0.05284 | 2.05 | 0.0505 | 0.1314 |
| Coefficient | Std. Error | t-Value | t-Prob | Part. R2 | |
|---|---|---|---|---|---|
| Constant | 12.2805 | 1.9630 | 6.26 | 0.0000 | 0.6298 |
| LOG_POP | −1.19527 | 0.2064 | −5.79 | 0.0000 | 0.5931 |
| LOG_COAL_POP | −0.02601 | 0.0183 | −1.42 | 0.1690 | 0.0806 |
| LOG_PALM_POP | 0.10349 | 0.0344 | 3.01 | 0.0063 | 0.2822 |
| LOG_GOLD_POP | −0.02841 | 0.0594 | −4.78 | 0.0001 | 0.4987 |
| LOG_ROAD_POP | 0.15526 | 0.0655 | 2.37 | 0.0266 | 0.1961 |
| LOG_COFFEE_POP | −0.09504 | 0.0311 | −3.05 | 0.0057 | 0.2882 |
| LOG_NUTMEG_POP | −0.01989 | 0.0094 | −2.10 | 0.0467 | 0.1611 |
| Coefficient | Std. Error | t-Value | t-Prob | Part. R2 | |
|---|---|---|---|---|---|
| Constant | 224.150 | 9.59 | 23.4 | 0.0000 | 0.9698 |
| GOLD | −0.0191076 | 0.007158 | −2.67 | 0.0162 | 0.2954 |
| ROAD | 0.0406448 | 0.01983 | 2.05 | 0.0562 | 0.1982 |
| COAL_3 | 0.0134467 | 0.005605 | 2.40 | 0.0282 | 0.2529 |
| COFFEE_3 | 0.0000152541 | 0.000003986 | 3.83 | 0.0013 | 0.4628 |
| COCOA_-3 | −0.00000772359 | 0.000002382 | −3.24 | 0.0048 | 0.3822 |
| POP_MLN | 0.776153 | 0.06361 | −12.2 | 0.0000 | 0.8975 |
| PALM | 0.327949 | 0.1078 | 3.04 | 0.0074 | 0.3523 |
| Coefficient | Std. Error | t-Value | t-Prob | Part. R2 | |
|---|---|---|---|---|---|
| Constant | 42.3105 | 4.145 | 10.2 | 0.0000 | 0.8597 |
| LOG_PPOP | −4.85222 | 0.4540 | −10.7 | 0.0162 | 0.8705 |
| LOG_ROAD_POP | 0.174791 | 0.09562 | 1.83 | 0.0852 | 0.1643 |
| LOG_GDP_CURR_INT | 0.523938 | 0.07128 | 7.35 | 0.0000 | 0.7607 |
| LOG_COAL_POP_-3 | −0.0693475 | 0.03570 | −1.94 | 0.0689 | 0.1816 |
| LOG_COFFEE_POP_-3 | −0.155286 | 0.05971 | −2.60 | 0.0187 | 0.2846 |
| LOG_PALM_POP_-3 | 0.109484 | 0.06213 | 1.76 | 0.0960 | 0.1545 |
| LOG_GOLD_POP_2 | −0.0170587 | 0.008597 | −1.98 | 0.0636 | 0.1880 |
| LOG_PALM_POP_1 | −0.107663 | 0.05881 | 1.83 | 0.0848 | 0.1647 |
| Metric/Variable | Linear Model (WB) | Log Model (WB) | Linear Model (UMD) | Log Model (UMD) |
|---|---|---|---|---|
| Years | 2000–2022 | 1990–2020 | 1993–2017 | 1992–2017 |
| Observations | 23 | 31 | 25 | 26 |
| R2 | 0.9893 | 0.9876 | 0.9967 | 0.9988 |
| Adj. R2 | 0.9862 | 0.9838 | 0.9954 | 0.9983 |
| Sigma | 0.2289 | 0.00462 | 0.6827 | 0.00651 |
| AIC | −2.73 | −10.54 | −0.51 | −9.8 |
| AR 1–2 | ✅ F(2,15) = 0.53, p = 0.60 | ✅ F(2,21) = 0.14, p = 0.14 | ✅ F(2,15) = 0.81, p = 0.46 | ✅ F(2,15) = 0.67, p = 0.53 |
| ARCH 1–1 | ✅ F(1,21) = 0.11, p = 0.75 | ✅ F(1,16) = 1.98, p = 0.18 | ✅ F(1,23) = 9.2 × 10⁻⁵, p = 0.99 | ❌ F(1,24) = 8.06, p = 0.009 |
| Normality | ✅ χ2(2) = 3.34, p = 0.188 | ❌ χ2(2) = 7.28, p = 0.026 | ✅ χ2(2) = 2.22, p = 0.33 | ❌ χ2(2) = 4.89, p = 0.009 |
| Hetero-scedasticity | ✅ F(9,13) = 0.61, p = 0.77 | ✅ F(14,16) = 1.66, p = 0.164 | ✅ F(14,10) = 0.96, p = 0.54 | ✅ F(16,9) = 2.18, p = 0.12 |
| RESET | ❌ F(2,15) = 11.92, p = 0.0008 | ❌ F(2,21) = 7.55, p = 0.0034 | ✅ F(2,15) = 3.65, p = 0.0509 | ✅ F(2,15) = 0.79, p = 0.4730 |
| GDP | 0.002 *** | 0.524 *** | ||
| Population | −0.00000012 *** | −1.195 *** | 0.776 *** | −4.852 * |
| Coal | −0.006 * | −0.026 | 0.013 * | −0.069 † |
| Road | 0.155 * | 0.041 † | 0.175 † | |
| Coffee | −0.095 ** | 0.0000153 *** | −0.155 * | |
| Palm | −0.162 *** | 0.103 ** | 0.328 † | 0.109 † |
| Cocoa | −0.0000772 ** | |||
| Gold | −0.028 *** | −0.019 * | −0.017 † | |
| POM | −0.724 * | |||
| Nutmeg | −0.020 * |
Disclaimer/Publisher’s Note: The statements, opinions and data contained in all publications are solely those of the individual author(s) and contributor(s) and not of MDPI and/or the editor(s). MDPI and/or the editor(s) disclaim responsibility for any injury to people or property resulting from any ideas, methods, instructions or products referred to in the content. |
© 2025 by the author. Licensee MDPI, Basel, Switzerland. This article is an open access article distributed under the terms and conditions of the Creative Commons Attribution (CC BY) license (https://creativecommons.org/licenses/by/4.0/).
Share and Cite
Shmelev, S.E. Biodiversity Offset Schemes for Indonesia: Pro et Contra. Sustainability 2025, 17, 6283. https://doi.org/10.3390/su17146283
Shmelev SE. Biodiversity Offset Schemes for Indonesia: Pro et Contra. Sustainability. 2025; 17(14):6283. https://doi.org/10.3390/su17146283
Chicago/Turabian StyleShmelev, Stanislav Edward. 2025. "Biodiversity Offset Schemes for Indonesia: Pro et Contra" Sustainability 17, no. 14: 6283. https://doi.org/10.3390/su17146283
APA StyleShmelev, S. E. (2025). Biodiversity Offset Schemes for Indonesia: Pro et Contra. Sustainability, 17(14), 6283. https://doi.org/10.3390/su17146283