
Multidimensional Educational Inequality in Italy: A Stacking-Based Approach for Gender and Territorial Analysis


Abstract
1. Introduction
2. Materials and Methods
- -
- is the default number of clusters;
- -
- is the i-th cluster;
- -
- is the feature vector of region j;
- -
- is the centroid of the cluster ;
- -
- is the Euclidean distance between a point and the cluster centroid.
3. Results
4. Discussion
5. Conclusions
Author Contributions
Funding
Institutional Review Board Statement
Informed Consent Statement
Data Availability Statement
Conflicts of Interest
References
- Alaimo, L.S.; Maggino, F. Sustainable development goals indicators at territorial level: Conceptual and methodological issues—The Italian perspective. Soc. Indic. Res. 2020, 147, 383–419. [Google Scholar] [CrossRef]
- Ivaldi, E.; Ciacci, A. Measuring Gender Gap in Education in Different Italian Regions under Sustainable Development Framework: Is GEI a Good Tool? In Social Sector Development and Governance; Routledge India: New Delhi, India, 2022; pp. 218–233. [Google Scholar]
- Bertolini, P.; Pagliacci, F. Quality of life and territorial imbalances. A focus on Italian inner and rural areas. Bio-Based Appl. Econ. 2017, 6, 183–208. [Google Scholar]
- Nardone, P.; Odoardi, I.; Liberatore, A.; D’Ingiullo, D. Where the north–south gap in human capital begins: An analysis of educational outcomes across the Italian regions. J. Urban Reg. Anal. 2023, 15, 191–219. [Google Scholar] [CrossRef]
- Montorsi, C.; Gigliarano, C. Spatial comprehensive well-being composite indicators based on Bayesian latent factor model: Evidence from Italian provinces. Soc. Indic. Res. 2024, 175, 347–383. [Google Scholar] [CrossRef]
- Alaimo, L.S. The complexity of social phenomena and the construction of indicators. In Measuring Gender Equality; Springer: Cham, Switzerland, 2023; p. 31. [Google Scholar]
- Mazziotta, M.; Pareto, A. Principal component analysis for constructing socio-economic composite indicators: Theoretical and empirical considerations. SN Soc. Sci. 2024, 4, 114. [Google Scholar] [CrossRef]
- Transforming Our World: The 2030 Agenda for Sustainable Development. Available online: https://sdgs.un.org/2030agenda (accessed on 30 May 2025).
- Alaimo, L.S. Complexity of Social Phenomena: Measurements, Analysis, Representations and Synthesis; Sapienza Università Editrice: Rome, Italy, 2022; Volume 127. [Google Scholar]
- Jolliffe, I.T.; Cadima, J. Principal component analysis: A review and recent developments. Philos. Trans. R. Soc. A Math. Phys. Eng. Sci. 2016, 374, 20150202. [Google Scholar] [CrossRef]
- Education and Culture. Available online: https://www.ine.es/dyngs/INEbase/en/categoria.htm?c=Estadistica_P&cid=1254735573113 (accessed on 20 June 2025).
- Bildung, Forschung und Kultur. Available online: https://www.destatis.de/DE/Themen/Gesellschaft-Umwelt/Bildung-Forschung-Kultur/Bildungsstand/_inhalt.html (accessed on 20 June 2025).
- Condition of Education 2022. Available online: https://nces.ed.gov/use-work/resource-library/report/compendium/condition-education-2022 (accessed on 20 June 2025).
- Ivaldi, E.; Parra Saiani, P.; Primosich, J.J.; Bruzzi, C. Health and deprivation: A new approach applied to 32 Argentinian urban areas. Soc. Indic. Res. 2020, 151, 155–179. [Google Scholar] [CrossRef]
- Pratesi, M.; Quattrociocchi, L.; Bertarelli, G.; Gemignani, A.; Giusti, C. Spatial distribution of multidimensional educational poverty in Italy using small area estimation. Soc. Indic. Res. 2021, 156, 563–586. [Google Scholar] [CrossRef]
- Gli Indicatori del BES. Available online: https://www.istat.it/statistiche-per-temi/focus/benessere-e-sostenibilita/la-misurazione-del-benessere-bes/gli-indicatori-del-bes/ (accessed on 30 May 2025).
- Khor, N.; Pang, L.; Liu, C.; Chang, F.; Mo, D.; Loyalka, P.; Rozelle, S. China’s looming human capital crisis: Upper secondary educational attainment rates and the middle-income trap. China Q. 2016, 228, 905–926. [Google Scholar] [CrossRef]
- Asif, M.; Searcy, C. A composite index for measuring performance in higher education institutions. Int. J. Qual. Reliab. Manag. 2014, 31, 983–1001. [Google Scholar] [CrossRef]
- Pagani, L.; Argentin, G.; Gui, M.; Stanca, L. The impact of digital skills on educational outcomes: Evidence from performance tests. Educ. Stud. 2016, 42, 137–162. [Google Scholar] [CrossRef]
- Rao, S.; Gupta, R.; Gupta, H.K.; Karia, D. Cultivating a Reading Culture: A Design Intervention to Inculcate Reading Habits. In Proceedings of the 2023 IEEE Global Humanitarian Technology Conference (GHTC), San Francisco, CA, USA, 12–15 October 2023; pp. 386–392. [Google Scholar]
- Mazziotta, M.; Pareto, A. On a generalized non-compensatory composite index for measuring socio-economic phenomena. Soc. Indic. Res. 2016, 127, 983–1003. [Google Scholar] [CrossRef]
- Mazziotta, M.; Pareto, A. A non-compensatory approach for the measurement of the quality of life. In Quality of Life in Italy: Researches and Reflections; Maggino, F., Nuvolati, P., Eds.; Social Indicators Research Series; Springer: Dordrecht, The Netherlands, 2012; pp. 27–40. [Google Scholar]
- Norman, P. Identifying change over time in small area socio-economic deprivation. Appl. Spat. Anal. Policy 2010, 3, 107–138. [Google Scholar] [CrossRef]
- Landi, S.; Ivaldi, E.; Testi, A. Measuring change over time in socio-economic deprivation and health in an urban context: The case study of Genoa. Soc. Indic. Res. 2017, 139, 745–785. [Google Scholar] [CrossRef]
- Bartiromo, M.; Ivaldi, E. The impact of COVID-19 on sustainable development in Europe: A temporal analysis. In COVID-19 Pandemic and Global Inequality: Reflections in Labour Market, Business and Social Sectors; Springer: Singapore, 2023; pp. 25–42. [Google Scholar]
- Bartiromo, M.; Ivaldi, E. A gender sustainable development index for Italian regions. In Gender Inequality and Its Implications on Education and Health: A Global Perspective; Emerald Publishing: Bingley, UK, 2023; pp. 247–258. [Google Scholar]
- The Climate Action Monitor 2023. Available online: https://www.oecd.org/en/publications/the-climate-action-monitor-2023_60e338a2-en.html (accessed on 20 June 2025).
- Hassan, S.T. Measuring Diversity, Equity, and Inclusivity in an Organisation: Scale Development for DEI Index. In Diversity, AI, and Sustainability for Financial Growth; IGI Global: Hershey, PA, USA, 2023. [Google Scholar]
- Fowler, P.R.; Boylan, H.R. Increasing student success and retention: A multidimensional approach. J. Dev. Educ. 2010, 34, 2. [Google Scholar]
- Wan, C.D. Student enrolment in Malaysian higher education: Is there gender disparity and what can we learn from the disparity? Comp. J. Comp. Int. Educ. 2018, 48, 244–261. [Google Scholar] [CrossRef]
- Cotter, D.A.; Hermsen, J.M.; Vanneman, R. Gender Inequality at Work; Russell Sage Foundation: New York, NY, USA, 2004; p. 110. [Google Scholar]
- Morris, L.V. Women in higher education: Access, success, and the future. Innov. High. Educ. 2011, 36, 145–147. [Google Scholar] [CrossRef]
- Parvazian, S.; Gill, J.; Chiera, B. Higher education, women, and sociocultural change: A closer look at the statistics. SAGE Open 2017, 7, 2158244017700230. [Google Scholar] [CrossRef]
- Van Bavel, J.; Schwartz, C.R.; Esteve, A. The reversal of the gender gap in education and its consequences for family life. Annu. Rev. Sociol. 2018, 44, 341–360. [Google Scholar] [CrossRef]
- DiPrete, T.A.; Buchmann, C. Gender disparities in educational attainment in the new century: Trends, causes and consequences. In US2010: America in the First Decade of the New Century; Russell Sage Foundation: New York, NY, USA, 2013. [Google Scholar]
- England, P.; Allison, P.; Li, S.; Mark, N.; Thompson, J.; Budig, M.J.; Sun, H. Why are some academic fields tipping toward female? The sex composition of US fields of doctoral degree receipt, 1971–2002. Sociol. Educ. 2007, 80, 23–42. [Google Scholar] [CrossRef]
- Buchmann, C.; DiPrete, T.A.; McDaniel, A. Gender inequalities in education. Annu. Rev. Sociol. 2008, 34, 319–337. [Google Scholar] [CrossRef]
- Vincent-Lancrin, S. The reversal of gender inequalities in higher education: An on-going trend. Higher Educ. Manag. Policy 2008, 20, 1–20. [Google Scholar]
- Global Education Monitoring Team. Gender Review: Meeting Our Commitments to Gender Equality in Education; UNESCO: Paris, France, 2018. [Google Scholar]
- Kricheli-Katz, T. Gender inequalities in markets. Annu. Rev. Law Soc. Sci. 2021, 17, 109–122. [Google Scholar] [CrossRef]
- England, P.; Budig, M.; Folbre, N. Wages of virtue: The relative pay of care work. Soc. Probl. 2002, 49, 455–473. [Google Scholar] [CrossRef]
- England, P.; Folbre, N. Gender and economic sociology. In The Handbook of Economic Sociology; Smelser, N.J., Swedberg, R., Eds.; Princeton University Press: Princeton, NJ, USA, 2010; p. 627. [Google Scholar]
- England, P. The gender revolution: Uneven and stalled. Gend. Soc. 2010, 24, 149–166. [Google Scholar] [CrossRef]
- England, P.; Levine, A.; Mishel, E. Progress toward gender equality in the United States has slowed or stalled. Proc. Natl. Acad. Sci. USA 2020, 117, 6990–6997. [Google Scholar] [CrossRef]
- Mandel, H. Up the down staircase: Women’s upward mobility and the wage penalty for occupational feminization, 1970–2007. Soc. Forces 2013, 91, 1183–1207. [Google Scholar] [CrossRef]
- Smith, R.A. Race, gender, and authority in the workplace: Theory and research. Annu. Rev. Sociol. 2002, 28, 509–542. [Google Scholar] [CrossRef]
- Charles, M.; Grusky, D.B. Occupational Ghettos: The Worldwide Segregation of Women and Men; Stanford University Press: Stanford, CA, USA, 2005; Volume 200. [Google Scholar]
- Saadat, Z.; Alam, S.; Rehman, M. Review of factors affecting gender disparity in higher education. Cogent Soc. Sci. 2022, 8, 2076794. [Google Scholar] [CrossRef]
- Terriquez, V.; Gurantz, O. Financial challenges in emerging adulthood and students’ decisions to stop out of college. Emerg. Adulthood 2015, 3, 204–214. [Google Scholar] [CrossRef]
- Britt, S.L.; Ammerman, D.A.; Barrett, S.F.; Jones, S. Student loans, financial stress, and college student retention. J. Stud. Financ. Aid 2017, 47, 3. [Google Scholar] [CrossRef]
- Naz, S.; Shah, S.A.; Qayum, A. Gender differences in motivation and academic achievement: A study of the university students of KP, Pakistan. Glob. Reg. Rev. 2020, V, 67–75. [Google Scholar] [CrossRef]
- Benner, A.D.; Boyle, A.E.; Sadler, S. Parental involvement and adolescents’ educational success: The roles of prior achievement and socioeconomic status. J. Youth Adolesc. 2016, 45, 1053–1064. [Google Scholar] [CrossRef]
- Alcaine, J.G. Factors Affecting Institutional Performance at High and Very High Research Universities: Policy Implications. Ph.D. Thesis, University of Southern California, Los Angeles, CA, USA, 2016. [Google Scholar]
- Ghazvini, S.D.; Khajehpour, M.; Cunningham, M. Gender differences in factors affecting academic performance of high school students. Procedia Soc. Behav. Sci. 2011, 15, 1040–1045. [Google Scholar] [CrossRef]
- Lim, H.; Kim, S.; Chung, K.-M.; Lee, K.; Kim, T.; Heo, J. Is college students’ trajectory associated with academic performance? Comput. Educ. 2022, 178, 104397. [Google Scholar] [CrossRef]

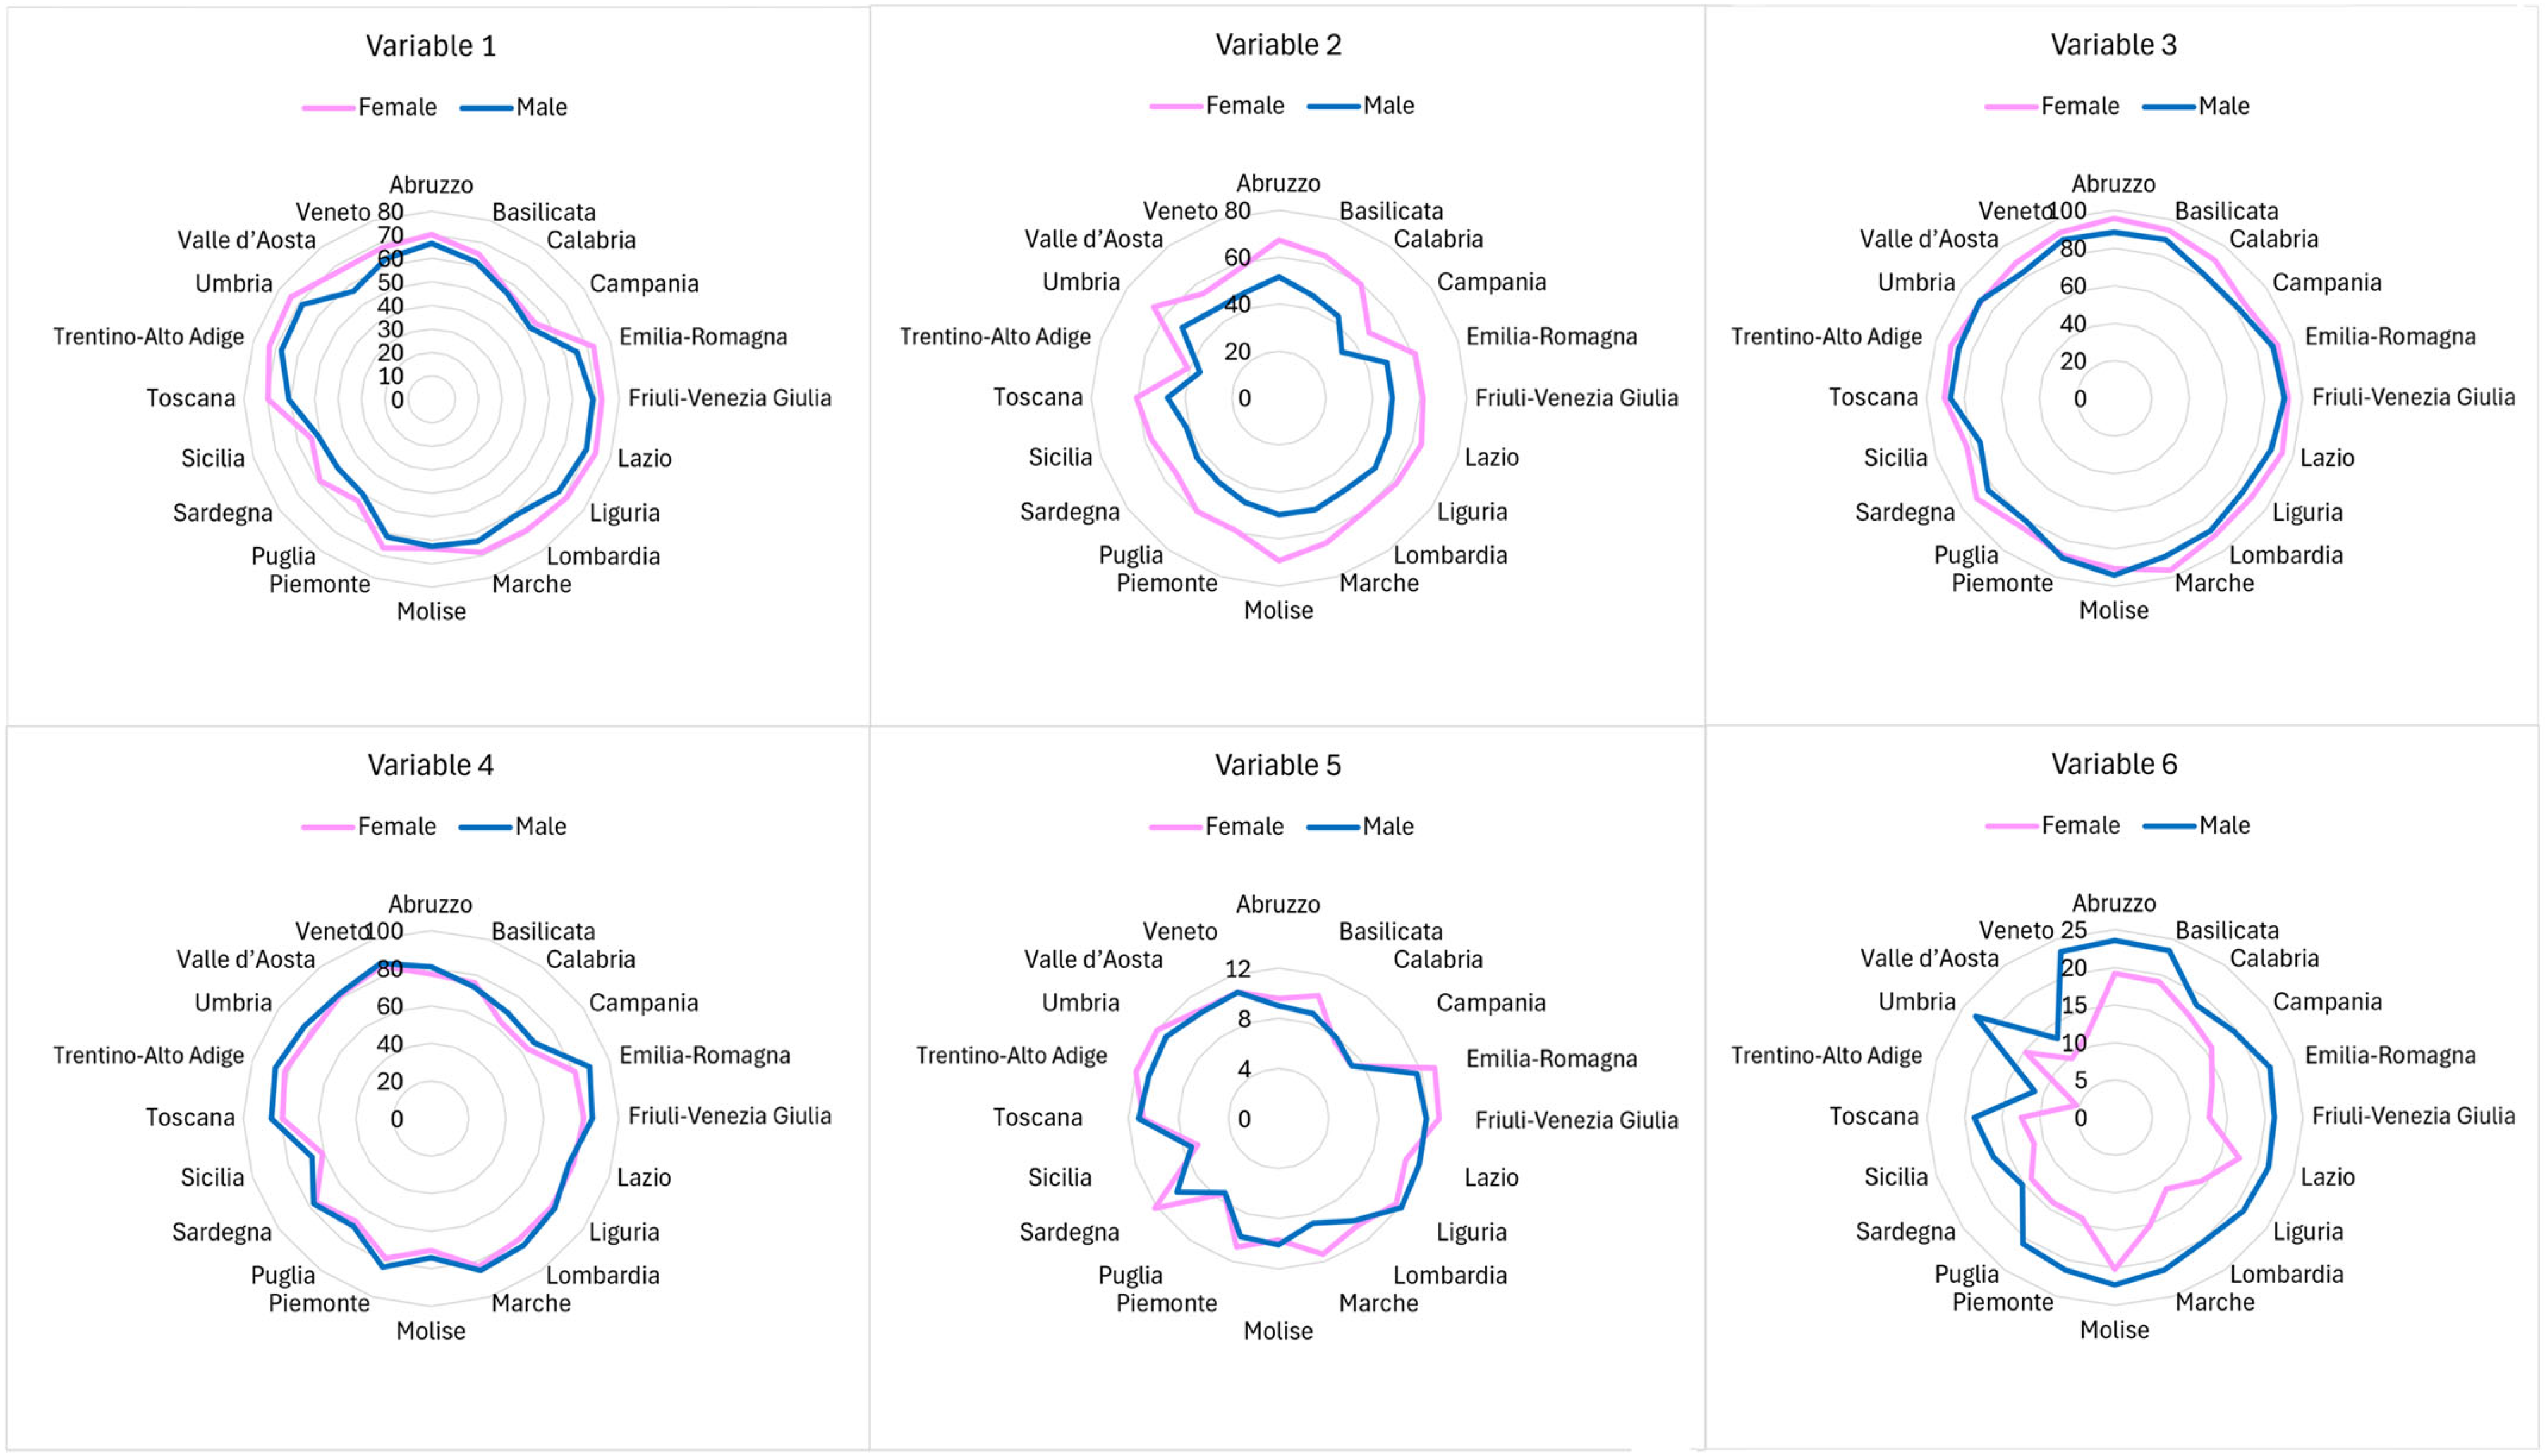
| Variable | Description | Units of Measure | Statistical Distributions | Sources |
|---|---|---|---|---|
| 1 | People with at least a high school diploma (25–64 years) | Percentage values | Percentage of population aged 25–64 | ISTAT—Labour Force Survey |
| 2 | Transition to university | Cohort-specific rate | Rate of high school graduates entering university | Ministry of Education; Ministry of University and Research |
| 3 | Not leaving education and training early | Percentage values | Percentage of 18- to 24-year-olds not in education/training | Re-elaborations on ISTAT data—Labour Force Survey |
| 4 | Young people in employment and education (NEET) | Percentage values | % of 15- to 29-year-olds not in employment, education, or training | Re-elaborations on ISTAT data—Labour Force Survey |
| 5 | Participation in continuing education | Percentage values | % of adults aged 25–64 in formal/non-formal education | ISTAT—Labour Force Survey |
| 6 | People who obtain a tertiary STEM qualification in the year | Per 1000 residents aged 20–29 | Absolute rate per 1000 of the population 20–29 | ISTAT—Ministry of University and Research data |
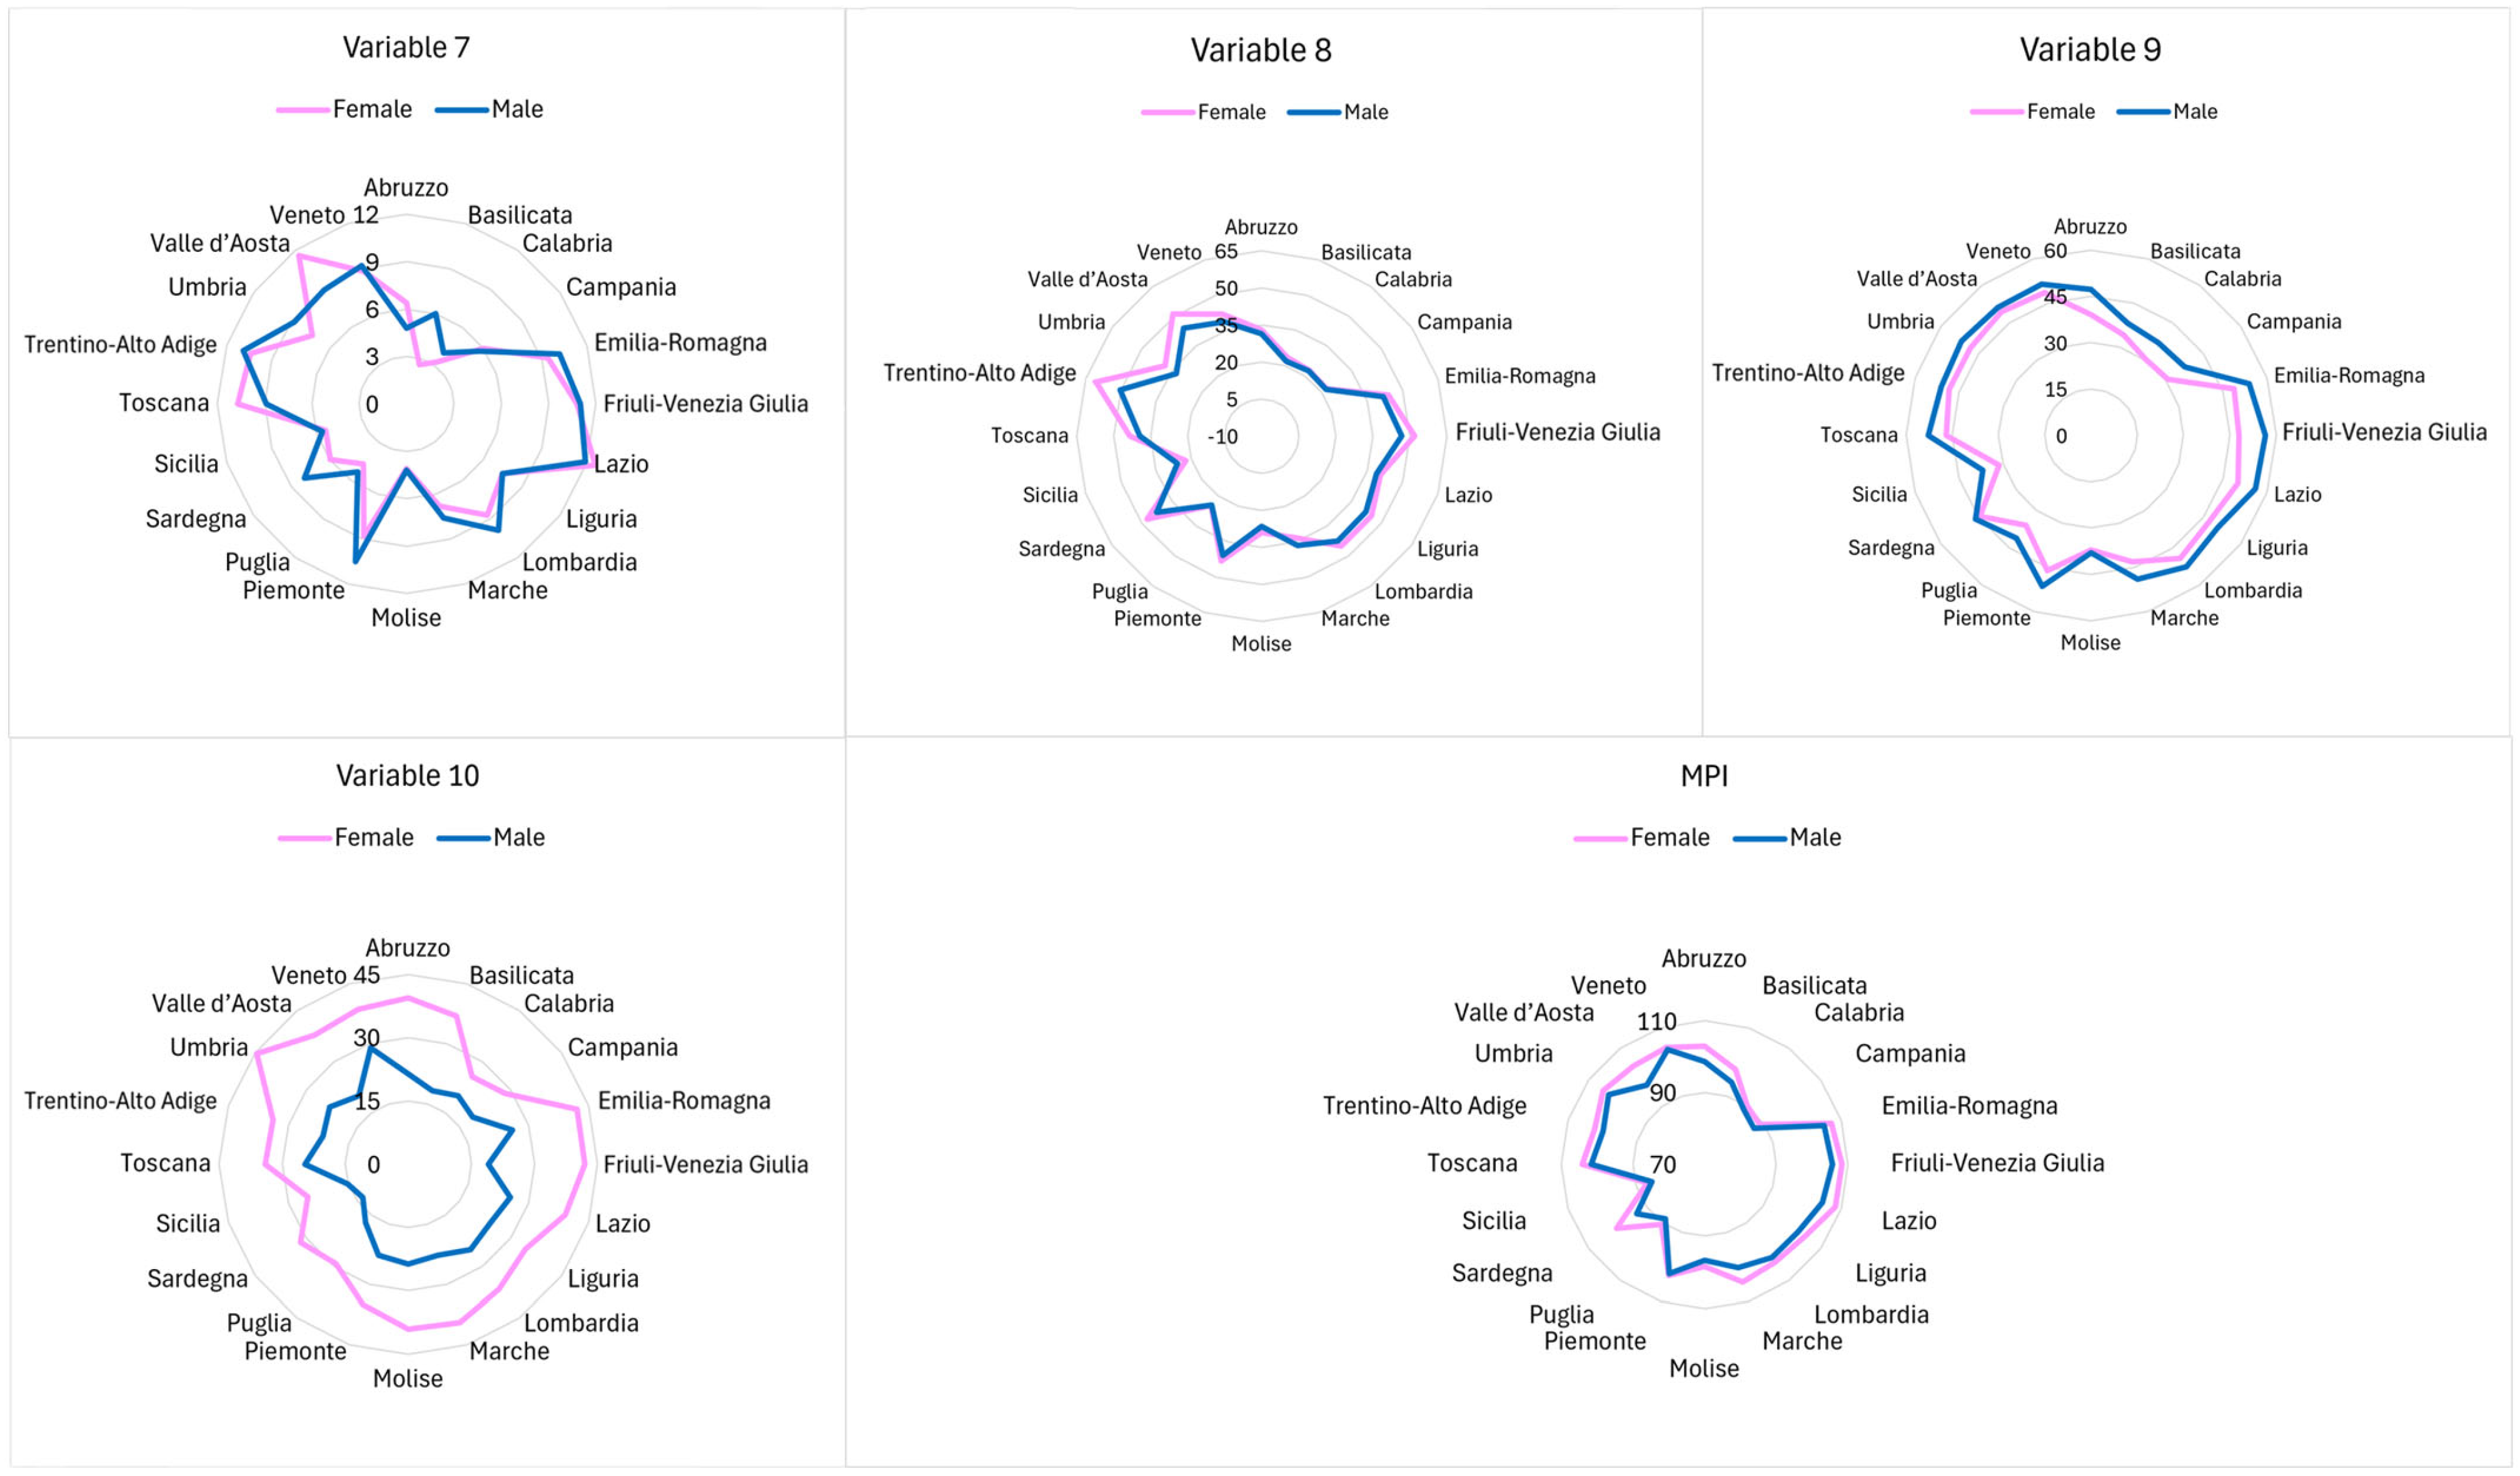
| 7 | Cultural participation outside the home | Percentage values | % of people participating in cultural activities | ISTAT—Survey Aspects of Daily Life |
| 8 | Reading books and newspapers | Percentage values | % of people who read at least one book or newspaper | ISTAT—Survey Aspects of Daily Life |
| 9 | At least basic digital skills | Percentage values | % of population with basic ICT skills | ISTAT—Survey Aspects of Daily Life |
| 10 | Graduates and other tertiary qualifications (25–34 years) | Percentage values | % of population aged 25–34 with a degree | ISTAT—Survey Aspects of Daily Life |
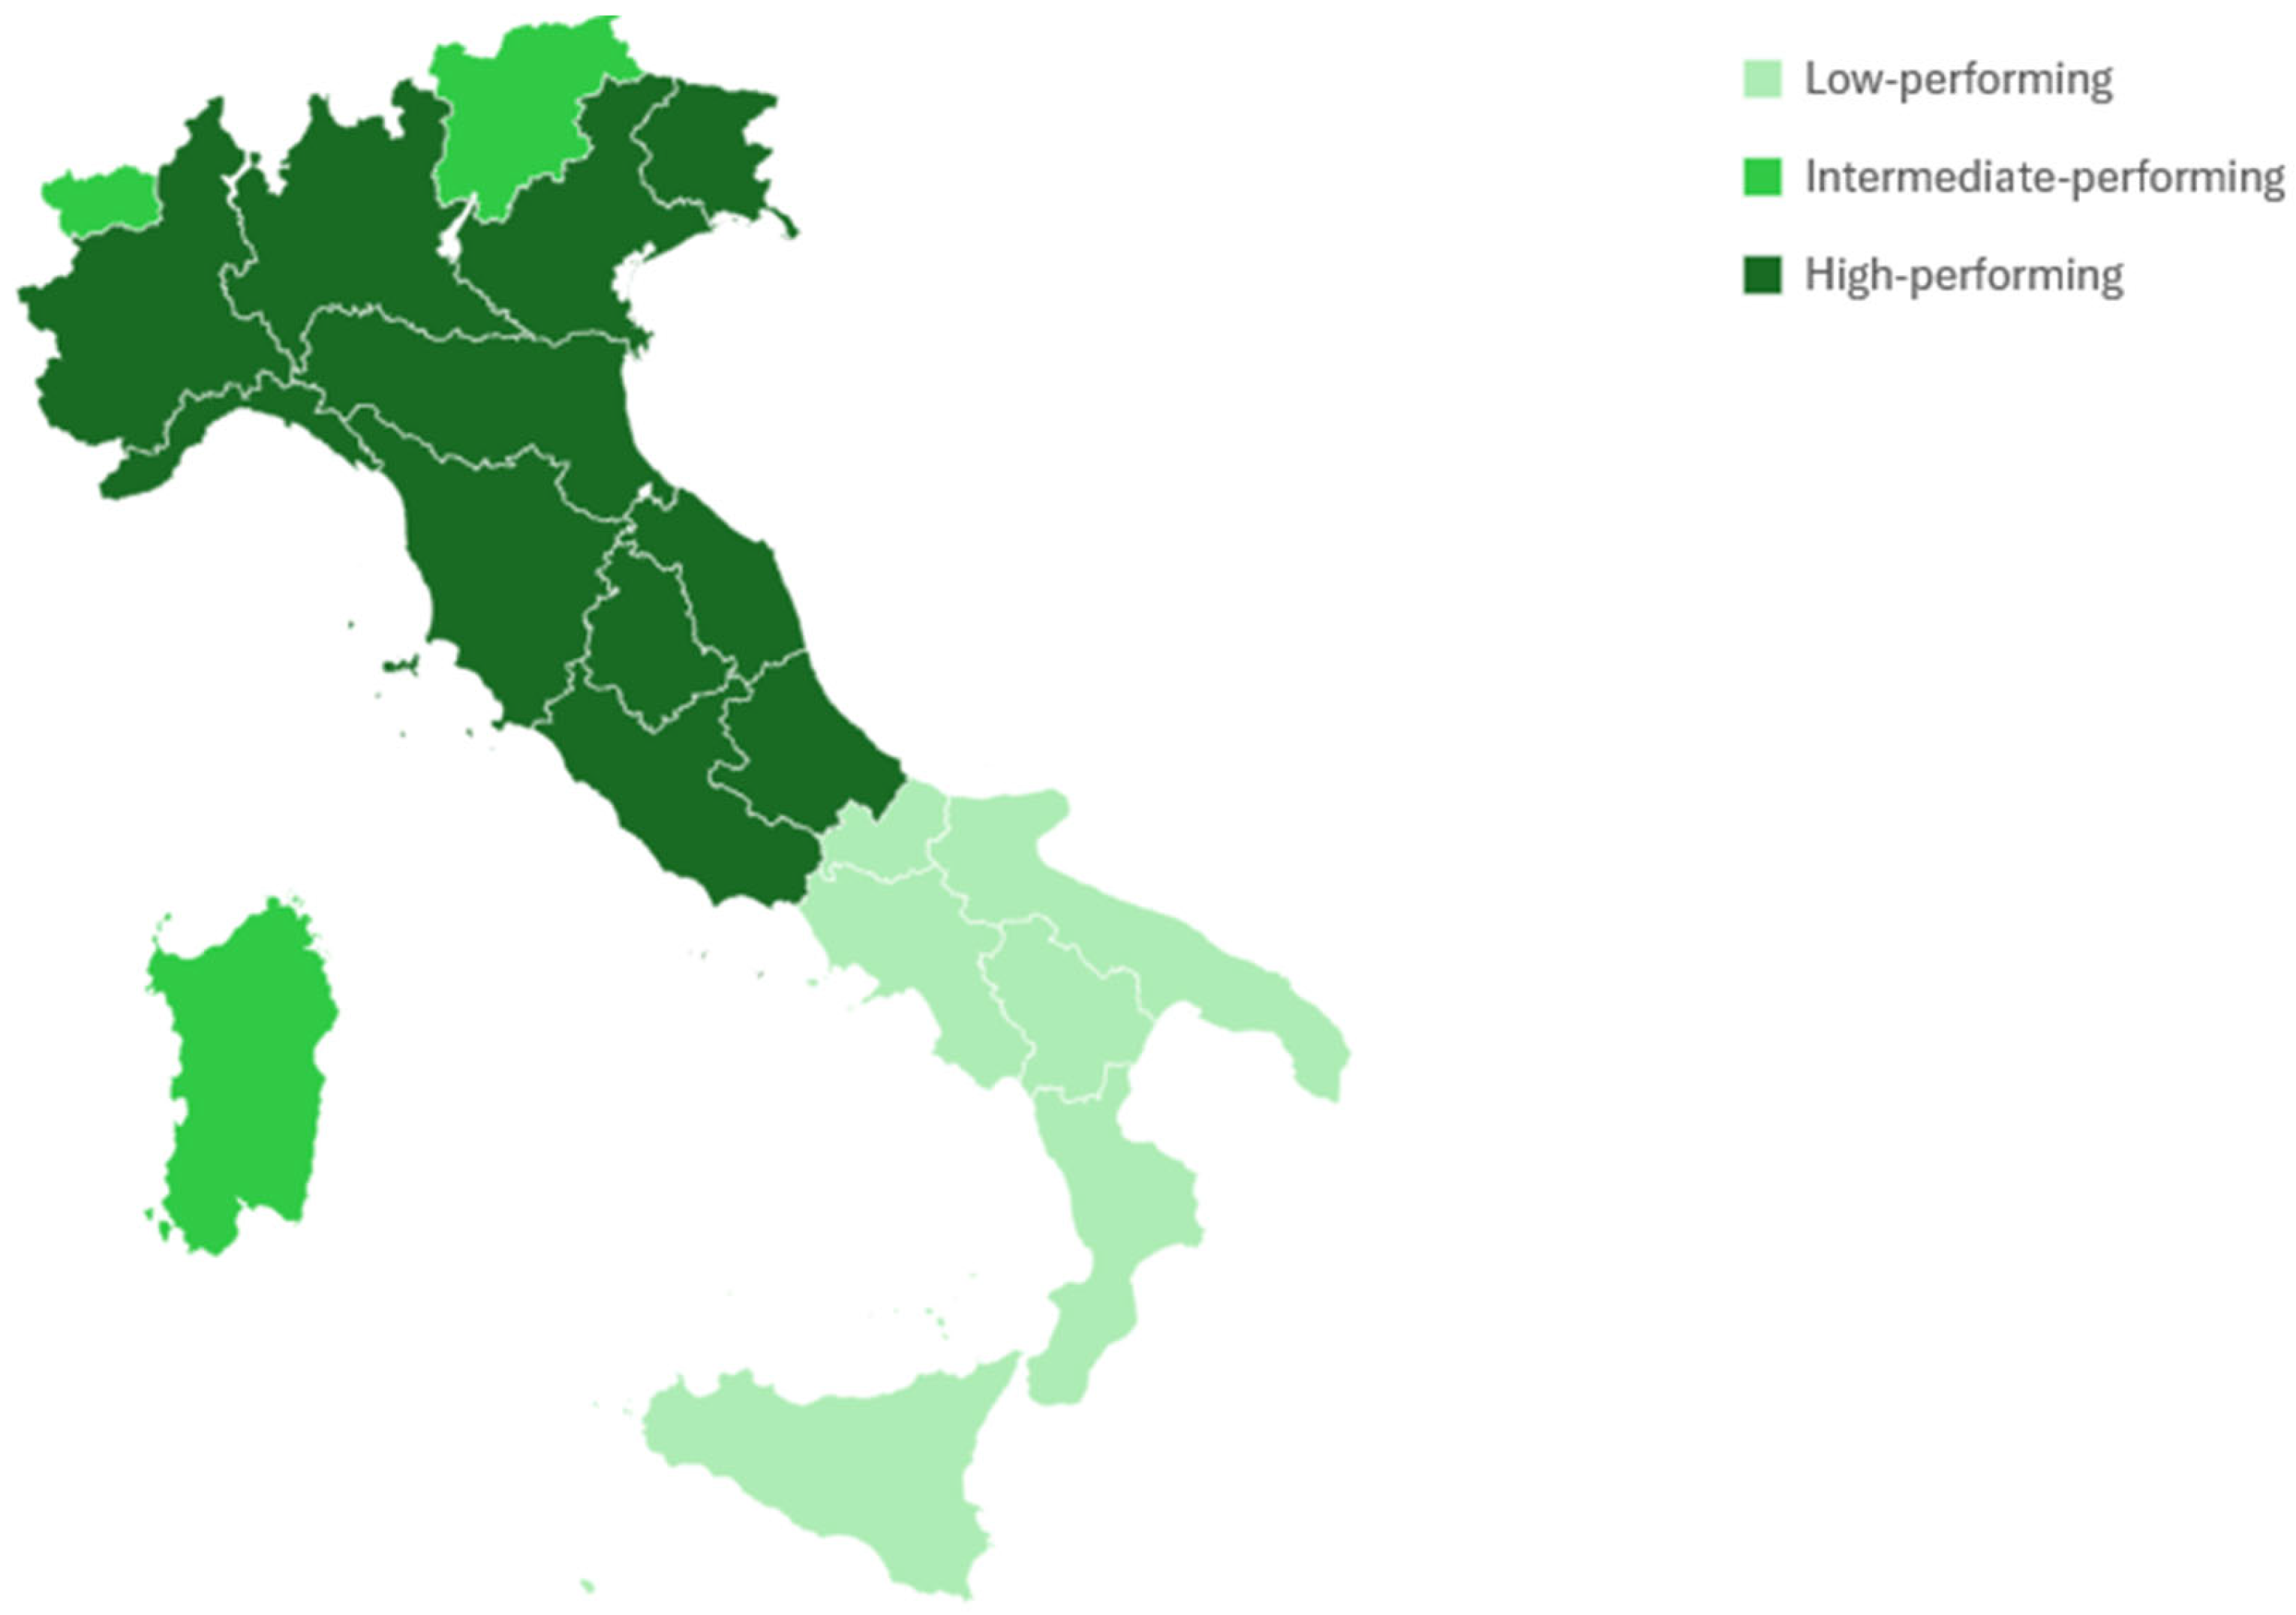
| Region | Cluster | Aggregate MPI |
|---|---|---|
| Abruzzo | High-performing | 100.79 |
| Basilicata | Low-performing | 95.92 |
| Calabria | Low-performing | 89.42 |
| Campania | Low-performing | 88.02 |
| Emilia-Romagna | High-performing | 106.16 |
| Friuli-Venezia Giulia | High-performing | 107.00 |
| Lazio | High-performing | 106.42 |
| Liguria | High-performing | 103.24 |
| Lombardia | High-performing | 102.84 |
| Marche | High-performing | 102.32 |
| Molise | Low-performing | 97.60 |
| Piemonte | High-performing | 102.31 |
| Puglia | Low-performing | 89.69 |
| Sardegna | Intermediate-performing | 96.90 |
| Sicilia | Low-performing | 86.07 |
| Toscana | High-performing | 102.90 |
| Trentino-Alto Adige | Intermediate-performing | 101.03 |
| Umbria | High-performing | 104.04 |
| Valle d’Aosta | Intermediate-performing | 100.64 |
| Veneto | High-performing | 103.97 |
| Region | MPI Female | MPI Male | Geometric Mean Female | Geometric Mean Male | Min-Max Female | Min-Max Male | Arithmetic Mean Female | Arithmetic Mean Male | PCA Female | PCA Male |
|---|---|---|---|---|---|---|---|---|---|---|
| Abruzzo | 97.76 | 94.08 | 29.17 | 28.46 | 0.63 | 0.49 | 42.52 | 38.65 | 0.35 | −1.10 |
| Basilicata | 90.11 | 88.73 | 26.08 | 25.82 | 0.27 | 0.23 | 37.69 | 35.91 | −1.16 | −2.08 |
| Calabria | 88.93 | 87.11 | 26.81 | 25.61 | 0.21 | 0.10 | 36.23 | 34.60 | −1.68 | −2.49 |
| Campania | 98.48 | 96.71 | 31.44 | 29.46 | 0.57 | 0.53 | 43.27 | 40.55 | 0.30 | −0.38 |
| Emilia-Romagna | 90.64 | 88.75 | 27.32 | 26.54 | 0.16 | 0.02 | 38.15 | 36.12 | −1.30 | −2.27 |
| Friuli-Venezia Giulia | 86.72 | 85.43 | 25.39 | 25.24 | 0.18 | 0.05 | 35.62 | 34.16 | −1.87 | −2.80 |
| Lazio | 100.36 | 93.44 | 32.88 | 29.13 | 0.38 | 0.00 | 43.50 | 38.84 | 0.31 | −1.42 |
| Liguria | 102.20 | 99.85 | 32.89 | 32.50 | 0.94 | 0.72 | 45.73 | 43.25 | 1.02 | 0.01 |
| Lombardia | 103.96 | 97.33 | 35.40 | 31.58 | 0.72 | 0.30 | 46.32 | 41.61 | 1.02 | −0.62 |
| Marche | 102.94 | 98.64 | 34.02 | 30.87 | 0.84 | 0.68 | 45.68 | 42.43 | 1.10 | −0.37 |
| Molise | 107.19 | 105.12 | 37.10 | 36.08 | 0.93 | 0.62 | 47.67 | 45.61 | 1.70 | 0.57 |
| Piemonte | 108.28 | 105.72 | 37.89 | 35.91 | 0.93 | 0.78 | 48.59 | 45.97 | 1.88 | 0.69 |
| Puglia | 108.35 | 104.49 | 38.15 | 36.20 | 0.97 | 0.80 | 48.13 | 44.89 | 1.72 | 0.53 |
| Sardegna | 104.37 | 102.11 | 35.16 | 34.36 | 0.88 | 0.70 | 46.29 | 44.10 | 1.08 | 0.12 |
| Sicilia | 103.66 | 102.03 | 34.81 | 34.59 | 0.78 | 0.47 | 46.09 | 44.07 | 1.01 | 0.01 |
| Toscana | 104.42 | 100.23 | 34.42 | 32.66 | 0.77 | 0.57 | 46.14 | 43.28 | 1.39 | −0.20 |
| Trentino-Alto Adige | 102.54 | 102.07 | 34.71 | 34.34 | 0.69 | 0.49 | 45.00 | 43.79 | 0.64 | 0.03 |
| Umbria | 104.12 | 101.67 | 35.34 | 33.95 | 0.81 | 0.46 | 45.85 | 43.60 | 1.04 | 0.04 |
| Valle d’Aosta | 105.04 | 103.04 | 35.96 | 34.32 | 1.00 | 0.76 | 47.12 | 44.19 | 1.39 | 0.30 |
| Veneto | 104.34 | 103.60 | 34.84 | 35.30 | 0.74 | 0.55 | 46.33 | 44.82 | 1.17 | 0.30 |
| Cluster | MPI Female | MPI Male | Geometric Mean Female | Geometric Mean Male | Min-Max Female | Min-Max Male | Arithmetic Mean Female | Arithmetic Mean Male | PCA Female | PCA Male |
|---|---|---|---|---|---|---|---|---|---|---|
| Low-performing | 92.11 | 90.13 | 27.70 | 26.86 | 0.34 | 0.24 | 38.91 | 36.67 | −0.89 | −1.85 |
| Intermediate-performing | 102.17 | 96.87 | 33.72 | 31.07 | 0.68 | 0.34 | 45.18 | 41.23 | 0.79 | −0.68 |
| High-performing | 105.02 | 102.61 | 35.67 | 34.42 | 0.85 | 0.63 | 46.63 | 44.25 | 1.28 | 0.18 |
| Geometric Mean Female | Min-Max Female | MPI Female | Arithmetic Mean Female | PCA Female | |
|---|---|---|---|---|---|
| Geometric mean female | 1.0000 | ||||
| Min-max female | 0.8206 | 1.0000 | |||
| MPI female | 0.9504 | 0.8447 | 1.0000 | ||
| Arithmetic mean female | 0.9609 | 0.8394 | 0.9729 | 1.0000 | |
| PCA female | 0.8977 | 0.8770 | 0.9684 | 0.9474 | 1.0000 |
| Geometric Mean Male | Min-Max Male | MPI Male | Arithmetic Mean Male | PCA Male | |
|---|---|---|---|---|---|
| Geometric mean male | 1.0000 | ||||
| Min-max male | 0.7248 | 1.0000 | |||
| MPI male | 0.9774 | 0.7925 | 1.0000 | ||
| Arithmetic mean male | 0.9820 | 0.7774 | 0.9970 | 1.0000 | |
| PCA male | 0.9624 | 0.8045 | 0.9910 | 0.9880 | 1.0000 |
Disclaimer/Publisher’s Note: The statements, opinions and data contained in all publications are solely those of the individual author(s) and contributor(s) and not of MDPI and/or the editor(s). MDPI and/or the editor(s) disclaim responsibility for any injury to people or property resulting from any ideas, methods, instructions or products referred to in the content. |
© 2025 by the authors. Licensee MDPI, Basel, Switzerland. This article is an open access article distributed under the terms and conditions of the Creative Commons Attribution (CC BY) license (https://creativecommons.org/licenses/by/4.0/).
Share and Cite
De Anna, M.; Ivaldi, E. Multidimensional Educational Inequality in Italy: A Stacking-Based Approach for Gender and Territorial Analysis. Sustainability 2025, 17, 6243. https://doi.org/10.3390/su17146243
De Anna M, Ivaldi E. Multidimensional Educational Inequality in Italy: A Stacking-Based Approach for Gender and Territorial Analysis. Sustainability. 2025; 17(14):6243. https://doi.org/10.3390/su17146243
Chicago/Turabian StyleDe Anna, Martina, and Enrico Ivaldi. 2025. "Multidimensional Educational Inequality in Italy: A Stacking-Based Approach for Gender and Territorial Analysis" Sustainability 17, no. 14: 6243. https://doi.org/10.3390/su17146243
APA StyleDe Anna, M., & Ivaldi, E. (2025). Multidimensional Educational Inequality in Italy: A Stacking-Based Approach for Gender and Territorial Analysis. Sustainability, 17(14), 6243. https://doi.org/10.3390/su17146243