
Integrating LCA and Multi-Criteria Tools for Eco-Design Approaches: A Case Study of Mountain Farming Systems


Abstract
1. Introduction
- (a)
- (b)
- Employing multi-factor assessments, where the impacts of the system are analyzed from diverse, often opposing and conflicting viewpoints, typical of complex socioeconomic systems.
2. Materials and Methods
2.1. Goal and Scope Definition
2.2. LCA and MCA Tools and General Approaches
- (1)
- Grouping the individual criteria within homogeneous groups, thus creating a macro-criterion (MCj) of a higher order and taking into account the relative weight of each single criterion within its own macro-criterion; the weight of each MCj is determined by the sum of the weights of the individual criteria that constitute it;
- (2)
- The overall weight of each j-th macro-criterion is then varied between 0% and 100% (with a 1% step) such that each combination always results in ; each combination, therefore, corresponds to a new Priority Matrix with respect to which a new respective Appraisal Matrix will then be generated;
- (3)
- The results of the various Appraisal Matrixes can then be mapped graphically, highlighting the best- or worst-ranked solutions with respect to the priority combination set by the macro-criteria; in the case of N = 3, the ranking mapping can be represented on triangular diagrams.
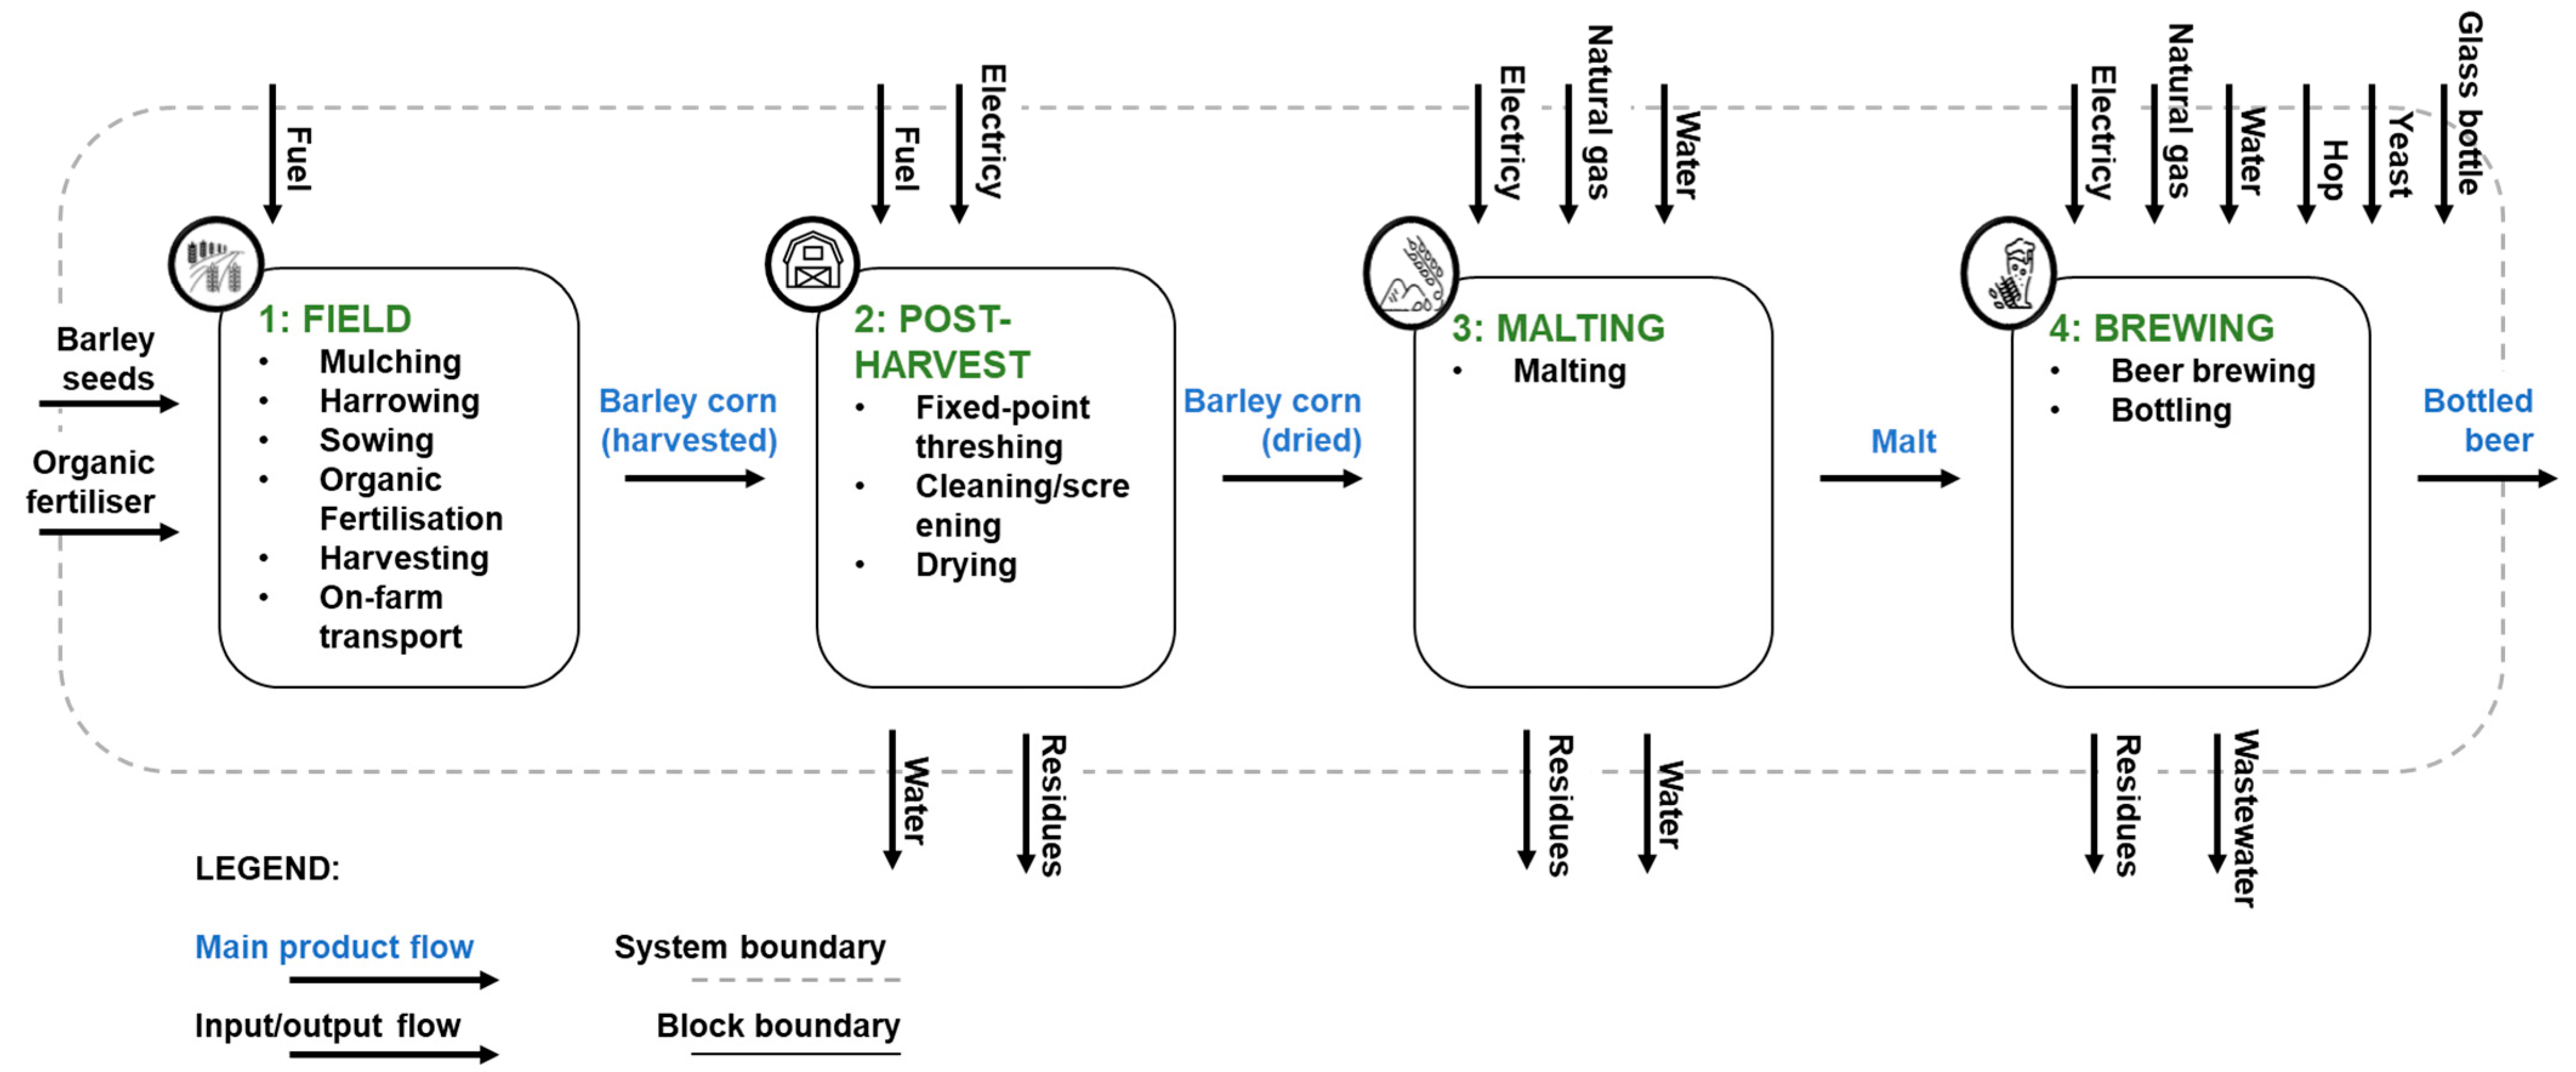
2.3. System Boundary and Functional Units
- 2095 kg of whole meal rye bread;
- 9600 L of barley craft beer;
- 458 kg of ripened cow cheese;
- 484 kg of ripened goat cheese.
2.4. Activity Data: Life Cycle Inventory and Impact Matrix
2.4.1. Inventory: Whole Meal Rye Bread (A)
2.4.2. Inventory: Craft Barley Beer (B)
2.4.3. Inventory: Ripened Cow Cheese (C)
2.4.4. Inventory: Ripened Goat Cheese (D)
2.4.5. Impact Matrix
2.5. Multi-Actor Approach: Decisionmakers’ Priorities
- (1)
- S_ECO: This profile places greater emphasis on the economic sustainability of their activities, assigning higher weights to criteria related to the economic and preservation aspects of their products;
- (2)
- S_ENV: This profile prioritizes criteria linked to the economic sustainability of the farm but also values alternative income sources from the potential valorization of byproducts. This farmer profile considers the environmental performance of its activities to be important;
- (3)
- S_OPE: This profile primarily considers the relevance of the work carried out on the farm in all the production steps, paying particular attention to product preservation and recovery;
- (4)
- Farmer No Risk: This profile focuses primarily on minimizing the risks of product and harvest loss, assigning almost 50% of the weight to this criterion. It also considers health and economic aspects crucial for the sustainability of business.
- (1)
- Traditionalist Politics: This approach focuses on managing the territory in a way that makes it attractive and usable for both tourism and agriculture. It also pays attention to economic aspects, intervening with potential support measures;
- (2)
- Innovative Politics: This approach emphasizes new criteria such as the valorization of byproducts, encouraging symbiosis and supply chains among multiple enterprises in the area, and promoting activities aimed at preserving environmental aspects and minimizing the environmental impacts of activities. This includes innovative forms of business management and operations.
- (a)
- In the original decision pool, a balanced relationship is maintained among the three macro-criteria as well as the individual criteria of the same cluster;
- (b)
- In the Farmer No Risk profile, which always attributes a very large importance to the criteria that consider aspects related to risks for the loss of primary production, from the analysis of Table 8 and the related Priority Matrix (Table 10), the criterion product loss is included in the macro-criterion ECO, together with the other criteria of investment, revenue, and byproducts; in the pool of this original decisionmaker, the ECO cluster covered 65.3% of the total priority, with an internal distribution of its aforementioned individual criteria of 47.8%, 2.6%, 14.6%, and 0.3% (corresponding to an internal relative incidence of 73.2%, 4.0%, 22.4%, and 0.5%, respectively); similar considerations can be taken into account as far as the criteria related to the difficulties of preserving primary and transformed products, both clustered into the OPE macro-criterion (together with the other three criteria, for a total priority of 28.2%) and covering more than 82% of internal relative incidence;
- (c)
- The Community profile, which tends to assign high priority to criteria that invoke aspects of environmental protection, is often reiterated in many social media networks; these are the criteria related to climate change, fossil depletion, land occupation, landscape preservation, and particulate matter, which are all grouped in the ENV cluster (which has a total priority for this decision profile of 60.8%), with internal relative incidences of 21.2%, 19.2%, 19.7%, 30.1%, and 9.7%, respectively, thus delineating a much smaller variability among the relevance of the criteria inside the same macro-criterion than that observed for the ECO cluster of the Farmer No Risk.
3. Results and Discussion
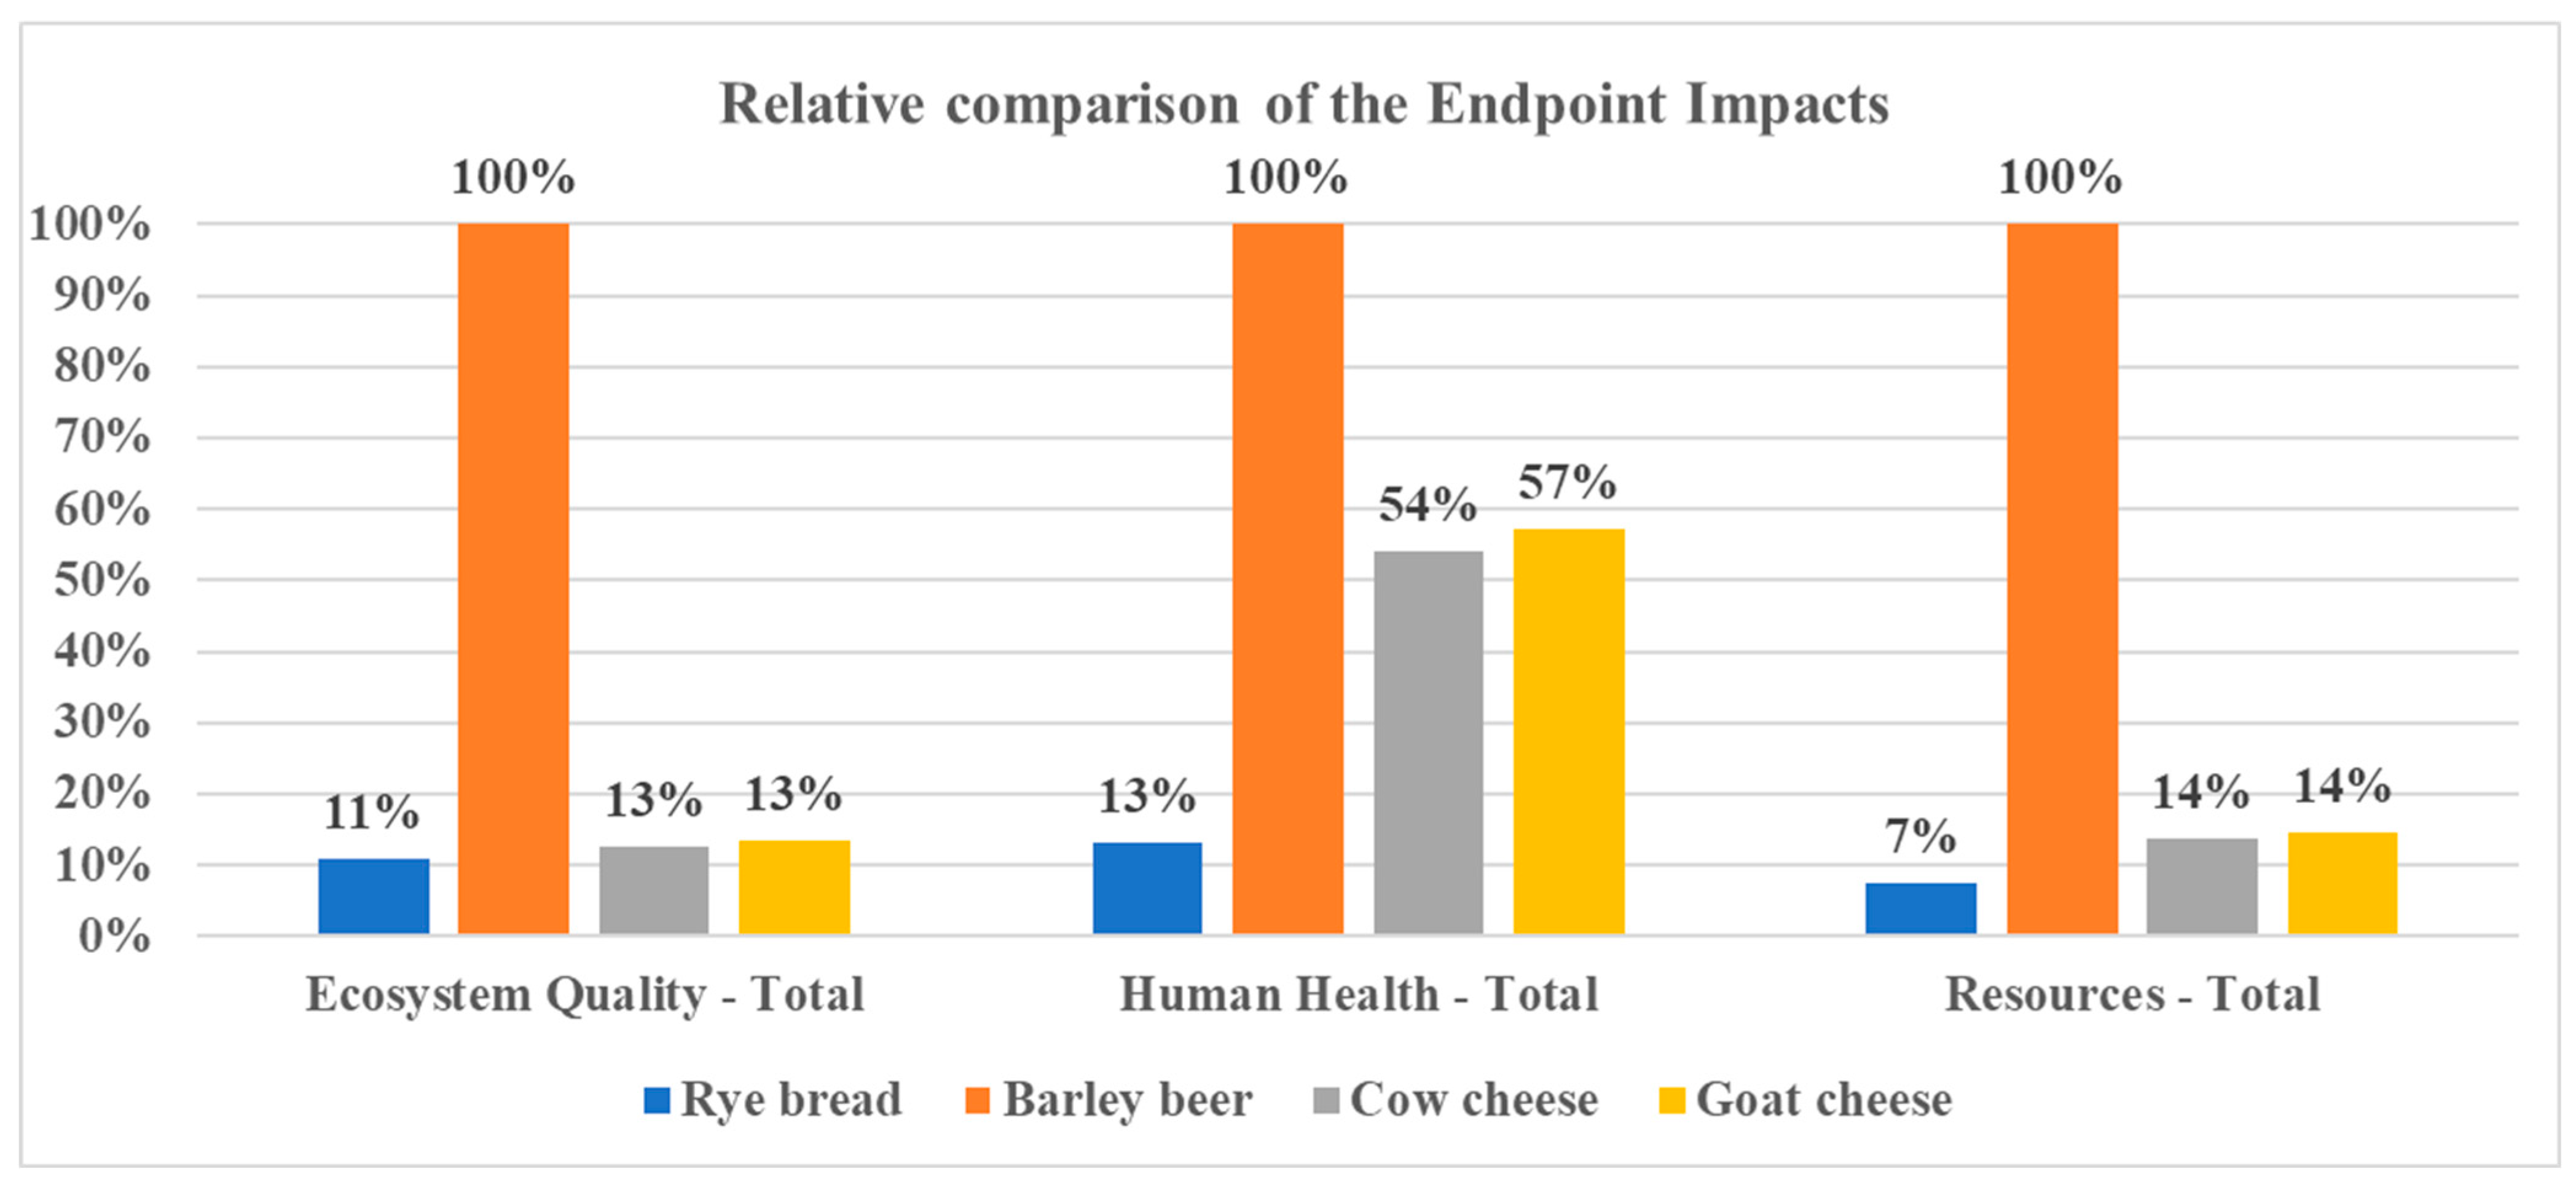
3.1. LCA Results
- (a)
- For the impacts related to climate change, land occupation, and fossil depletion, the barley–beer chain has values approximately 2–6 times greater than those found for the other production systems, confirming the previously mentioned effects of packaging; considering a breakdown of impacts based on the different phases, the cultivation of barley and rye are very similar, and impacts rise during beer production and packaging;
- (b)
- The rye–bread chain tends to have very low impacts, being the least impactful for three out of the four indicators considered;
- (c)
- The main critical impacts of cheese supply chains are related to particulate matter formation and derive mainly from processes related to the management of farm byproducts (from animal wastes); those impacts are comparable with those of the barley–beer supply chain.

| Impact | Rye Bread | Barley Beer | Cow Cheese | Goat Cheese | ||||
|---|---|---|---|---|---|---|---|---|
| 1 ha | 1 kg | 1 ha | 1 kg | 1 ha | 1 kg | 1 ha | 1 kg | |
| Land occupation (m2a) | 685.66 | 0.33 | 3271.89 | 1.56 | 194.96 | 0.09 | 204.70 | 0.10 |
| Climate change (kg CO2 eq) | 1312.98 | 0.63 1 | 9734.99 | 1.01 2 | 3687.59 | 8.05 3 | 3890.00 | 8.04 |
| Fossil depletion (kg oil eq) | 215.63 | 0.10 | 2967.13 | 0.31 | 334.45 | 0.73 | 352.77 | 0.73 |
| Particulate matter formation (kg PM10 eq) | 3.34 | 0.002 | 22.29 | 0.002 | 22.89 | 0.05 | 24.15 | 0.05 |
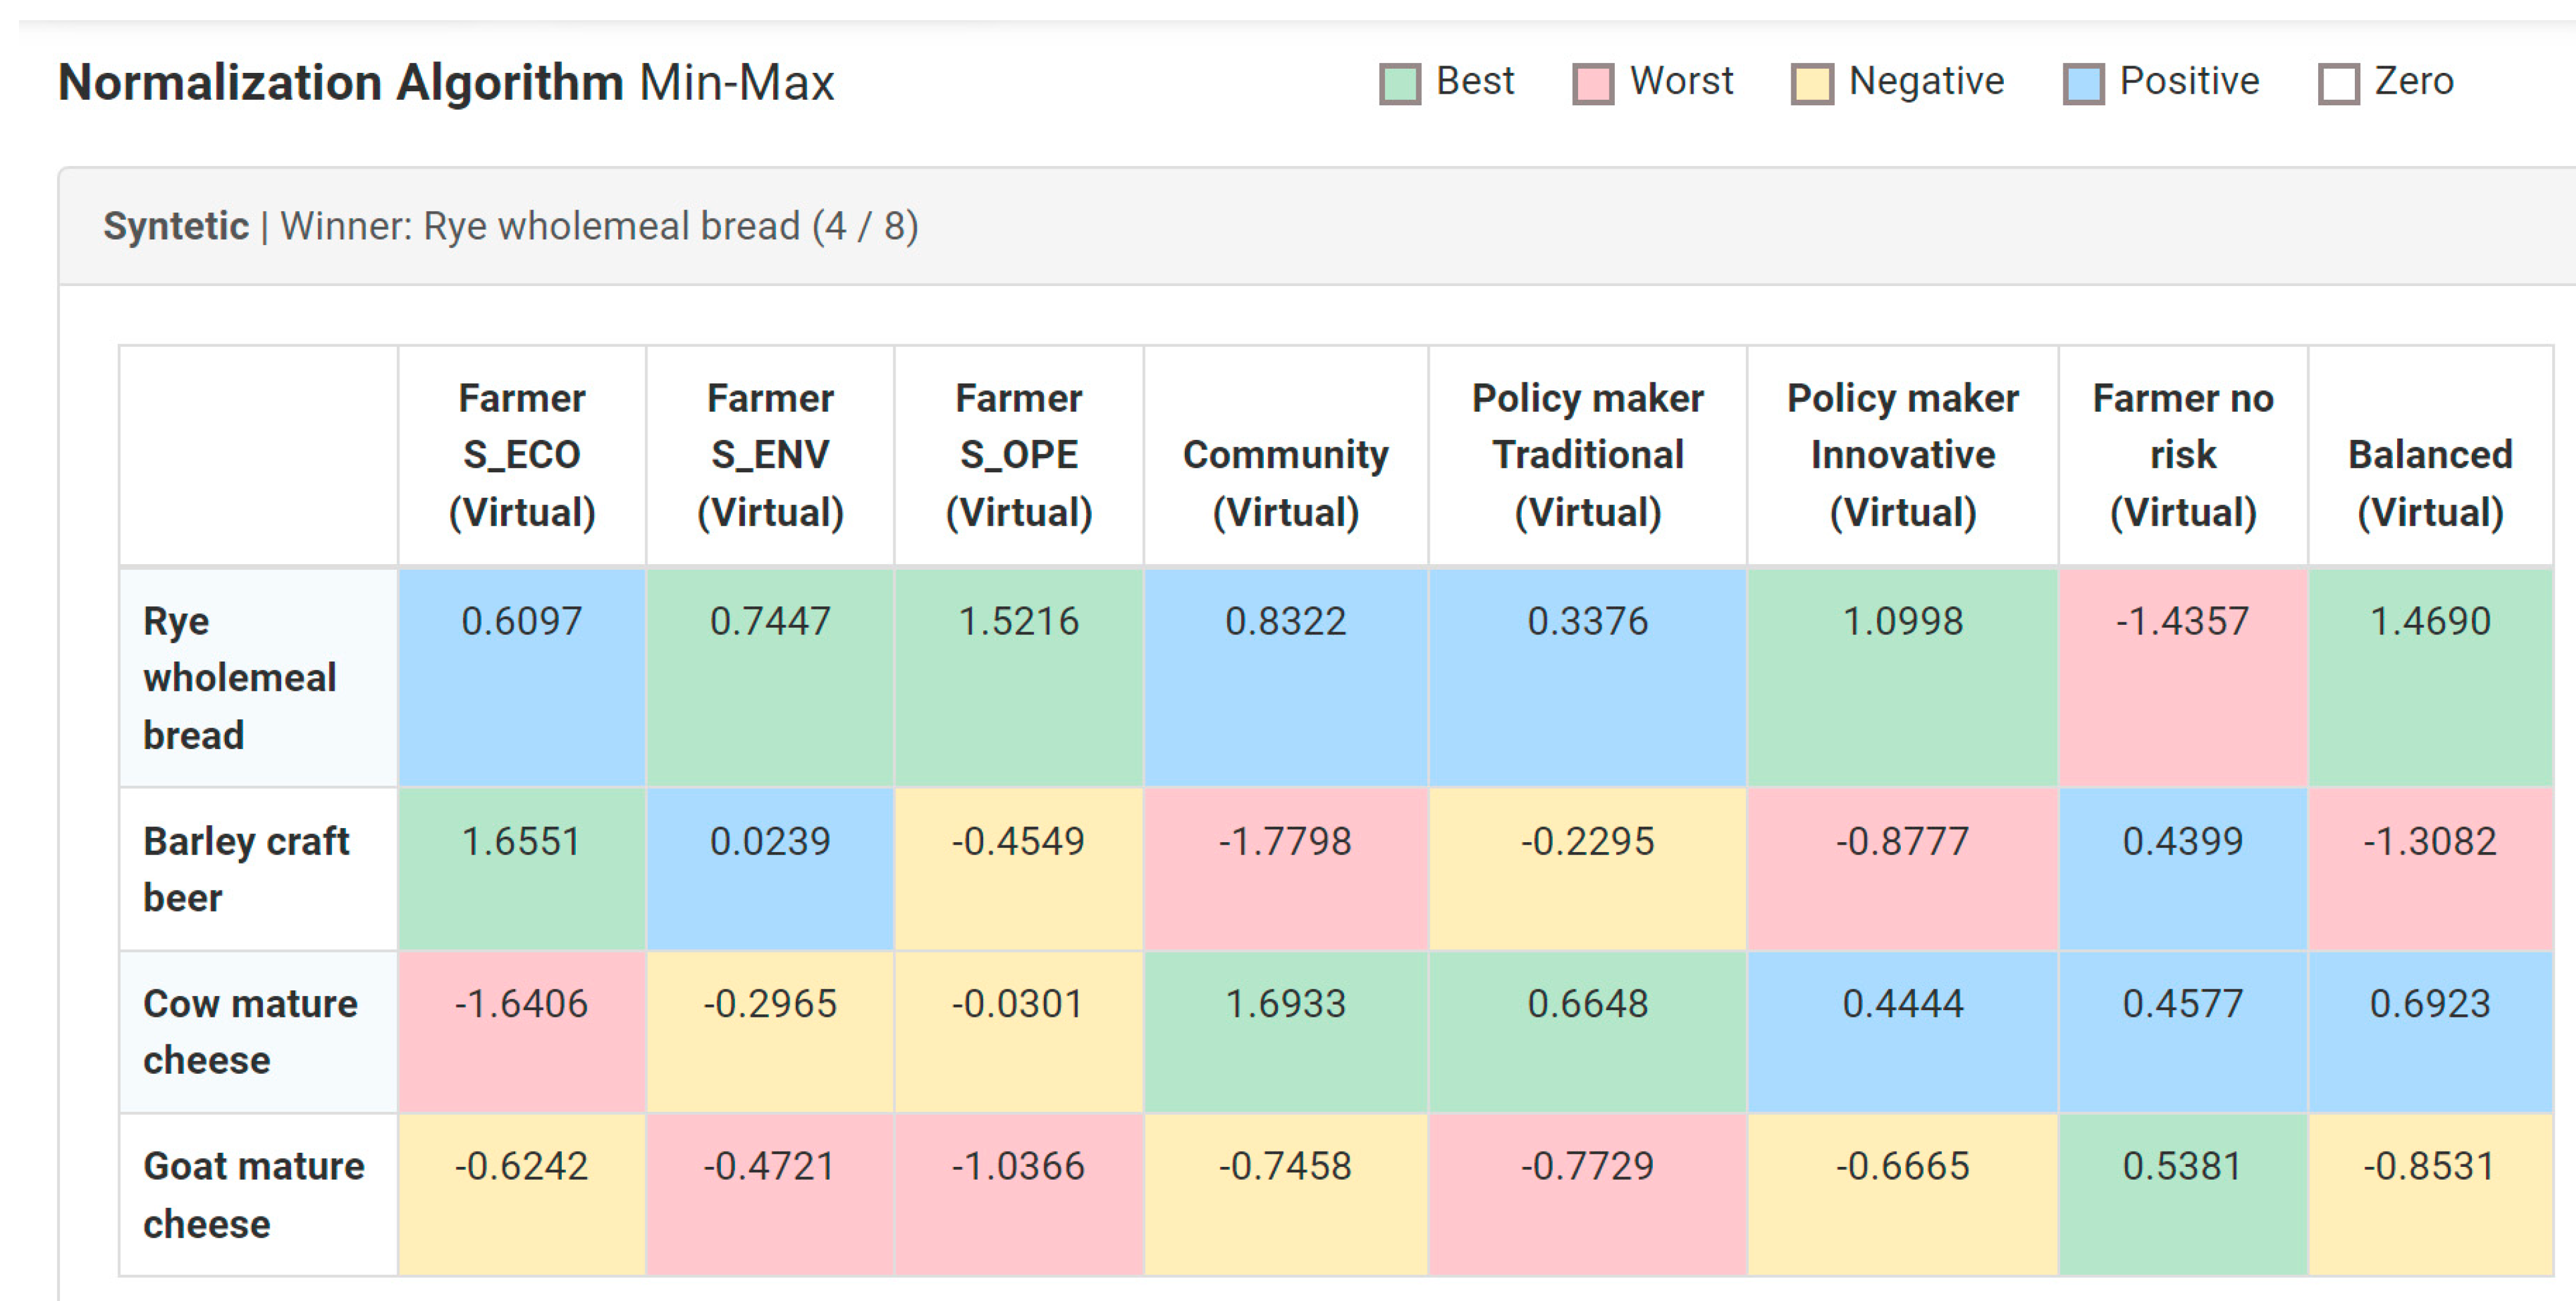
3.2. MCA Results: Comparative Analysis of Scenarios vs. Original Priority Profiles
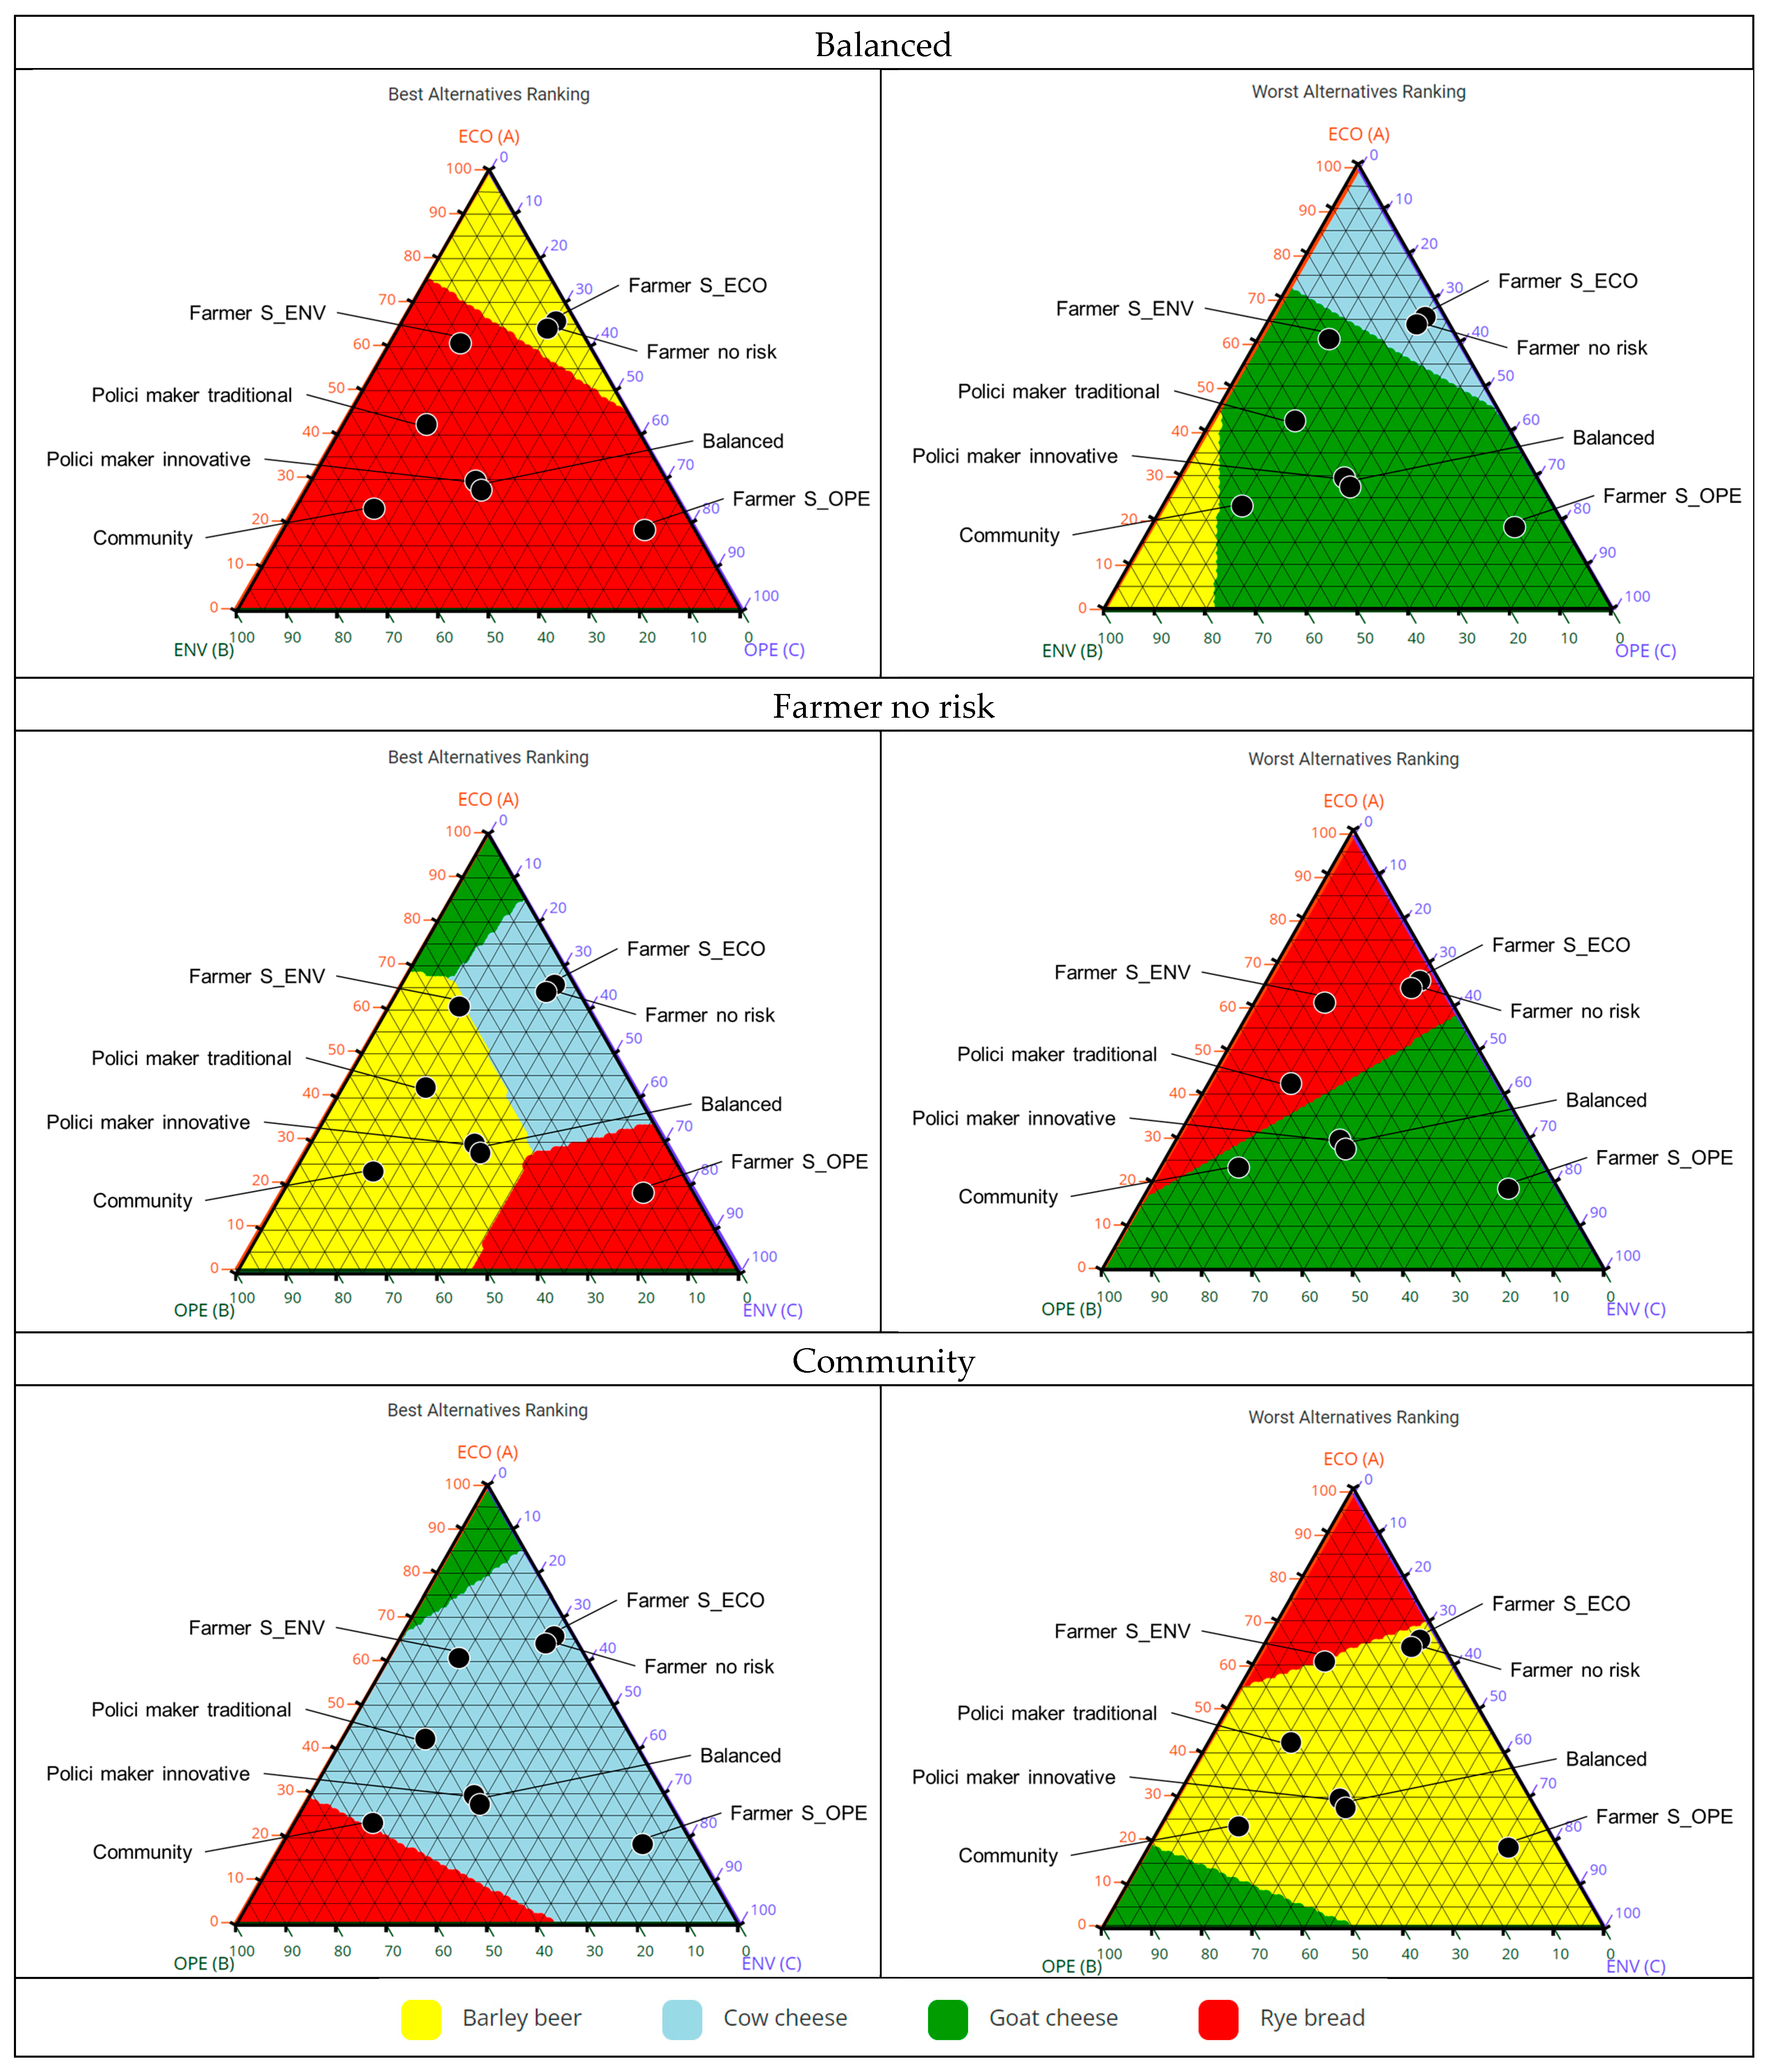
3.3. MCA Results: Sensitivity Analysis
- In the case of the sensitivity analysis with the Balanced profile, a large part of the triangular diagram gives the best rank to the solution Rye Bread; this happens both in a large part of the central area of the triangle and near the vertices where the OPE and ENV aspects prevail. Only in the case of a clear prevalence of ENV aspects (upper vertex) does the best solution fall on the Barley–Beer chain. Moreover, Rye Bread never appears as the worst solution, whereas Barley Beer is the least favored when ENV criteria prevail;
- Rye Bread is also the favored solution in the sensitivity analysis of the Farmer No Risk and Community profiles; this is observed in situations in which the priorities for the ENV and OPE criteria prevail. In both cases, however, it is now the least favored situation when the ECO criteria prevail; all these cases demonstrate a high instability of preferences for this solution when the criteria vary;
- The extreme situation of the Farmer No Risk profile is also evidenced by a very heterogeneous situation in the barycentric area of the triangular diagram; indeed, here, the best solution is disputed by three alternatives (Cow Cheese, Rye Bread, and Barley Beer). The ranking of the worst solutions, instead, is disputed between the alternatives Rye Bread and Goat Cheese, showing a condition of high instability with respect to the nature of the criteria, since they appear at the same time in the maps of the best and worst solutions;
- For the Community profile, a much more stable situation emerges, with the Cow Cheese solution being the best over a large barycentric portion of the triangular diagram, including the extreme corner where the ENV criteria prevail. Only to a limited extent are the Rye Bread and Goat Cheese solutions the preferred solutions (when the OPE and ECO criteria prevail, respectively). Their stability, however, is rather critical, as they become the worst solutions in the extreme conditions in which the ECO and OPE criteria prevail. The Barley Beer solution, on the other hand, is the least preferred solution in a large portion of the triangular diagram (barycentric area and vertex in which the ENV criteria prevail).
- (a)
- The Rye Bread solution appears among the best in all three profiles considered; it appears to be the worst solution only in the Farmer No Risk and Community profiles, when the ECO criteria clearly prevail;
- (b)
- The Cow Cheese solution is clearly the best only in the case of the Community profile, provided that the OPE criteria remain confined to an incidence of approximately 30% of the total; it is never fully appreciated in the case of the Balanced profile;
- (c)
- The barley Beer solution is significantly appreciated in the Farmer No Risk profile (with an incidence of OPE criteria of more than approximately 30%) and only marginally appreciated in the Balanced profile, when ECO criteria largely prevail;
- (d)
- The Goat Cheese solution shows only very marginal interest in the Farmer No Risk and Community profiles, whereas it clearly shows criticalities in all three profiles.
4. Conclusions
Author Contributions
Funding
Institutional Review Board Statement
Informed Consent Statement
Data Availability Statement
Acknowledgments
Conflicts of Interest
Appendix A
References
- Daugstad, K. Resilience in Mountain Farming in Norway. Sustainability 2019, 11, 3476. [Google Scholar] [CrossRef]
- Moreau, C.; Barnaud, C.; Mathevet, R. Conciliate Agriculture with Landscape and Biodiversity Conservation: A Role-Playing Game to Explore Trade-Offs among Ecosystem Services through Social Learning. Sustainability 2019, 11, 310. [Google Scholar] [CrossRef]
- Zanon, T.; De Monte, E.; Gauly, M. Effects of cattle breed and production system on veterinary diagnoses and administrated veterinary medicine in alpine dairy farms. Ital. J. Anim. Sci. 2021, 20, 1126–1134. [Google Scholar] [CrossRef]
- Wezel, A.; Vincent, A.; Nitsch, H.; Schmid, O.; Dubbert, M.; Tasser, E.; Fleury, P.; Stöckli, S.; Stolze, M.; Bogner, D. Farmers’ perceptions, preferences, and propositions for result-oriented measures in mountain farming. Land Use Policy 2018, 70, 117–127. [Google Scholar] [CrossRef]
- Darnhofer, I.; Lamine, C.; Strauss, A.; Mireille, N. The resilience of family farms: Towards a relational approach. J. Rural Stud. 2016, 44, 111–122. [Google Scholar] [CrossRef]
- Toscani, P.; Sekot, W. Assessing the Economic Situation of Small-Scale Farm Forestry in Mountain Regions: A Case Study in Austria. Mt. Res. Dev. 2017, 37, 271–280. [Google Scholar] [CrossRef]
- Genovese, D.; Culasso, F.; Giacosa, E.; Battaglini, L.M. Can Livestock Farming and Tourism Coexist in Mountain Regions? A New Business Model for Sustainability. Sustainability 2017, 9, 2021. [Google Scholar] [CrossRef]
- Kühl, S.; Flach, L.; Gauly, M. Economic assessment of small-scale mountain dairy farms in South Tyrol depending on feed intake and breed. Ital. J. Anim. Sci. 2020, 19, 41–50. [Google Scholar] [CrossRef]
- Stotten, R.; Schermer, M.; Wilson, G.A. Lock-ins and community resilience: Two contrasting development pathways in the Austrian Alps. J. Rural Stud. 2021, 84, 124–133. [Google Scholar] [CrossRef]
- Humer-Gruber, H. Farmers’ Perceptions of a Mountain Biosphere Reserve in Austria. Mt. Res. Dev. 2016, 36, 153–161. [Google Scholar] [CrossRef]
- Sacco, P.; Don, D.; Becce, L.; Carabin, G.; Mandler, A.; Mazzetto, F. Sustainability Performance of Mountain Food Value Chains. In AIIA 2022: Biosystems Engineering Towards the Green Deal, Lecture Notes in Civil Engineering, Proceeding of AIIA 2022: Biosystems Engineering Towards the Green Deal, Improving the Resilience of Agriculture, Forestry and Food Systems in the Post-Covid Era, Palermo, Italy, 19–22 September 2022; Ferro, V., Giordano, G., Orlando, S., Vallone, M., Cascone, G., Porto, S.M.C., Eds.; Springer: Cham, Switzerland, 2023; Volume 337. [Google Scholar]
- Hartmann, D.; Teixeira, M. Development of a methodology from LCA to a multi-criteria approach: Application to electricity transition in France. E3S Web Conf. 2022, 349, 07003. [Google Scholar] [CrossRef]
- Rockström, J.; Steffen, W.; Noone, K.; Persson, Å.; Chapin, F.S.; Lambin, E.F.; Lenton, T.M.; Scheffer, M.; Folke, C.; Schellnhuber, H.J.; et al. A safe operating space for humanity. Nature 2009, 461, 472–475. [Google Scholar] [CrossRef]
- Rockström, J.; Williams, J.; Daily, G.; Noble, A.; Matthews, N.; Gordon, L.; Wetterstrand, H.; DeClerck, F.; Shah, M.; Steduto, P.; et al. Sustainable intensification of agriculture for human prosperity and global sustainability. Ambio 2017, 46, 4–17. [Google Scholar] [CrossRef]
- Notarnicola, B.; Tassielli, G.; Renzulli, P.A.; Monforti, F. Energy flows and greenhouses gases of EU (European Union) national breads using an LCA (Life Cycle Assessment) approach. J. Clean. Prod. 2017, 140, 455–469. [Google Scholar] [CrossRef]
- Notarnicola, B.; Tassielli, G.; Renzulli, P.A.; Di Capua, R.; Saija, G.; Salomone, R.; Primerano, P.; Petti, L.; Raggi, A.; Casolani, N.; et al. Life cycle inventory data for the Italian agri-food sector: Background, sources and methodological aspects. Int. J. Life Cycle Assess. 2022, 29, 1430–1445. [Google Scholar] [CrossRef]
- Cordella, M.; Tugnoli, A.; Spadoni, G.; Santarelli, F.; Zangrando, T. LCA of an Italian lager beer. Int. J. Life Cycle Assess. 2008, 13, 133–139. [Google Scholar] [CrossRef]
- Salazar Tijerino, M.B.; San Martín-González, M.F.; Velasquez Domingo, J.A.; Huang, J.-Y. Life Cycle Assessment of Craft Beer Brewing at Different Scales on a Unit Operation Basis. Sustainability 2023, 15, 11416. [Google Scholar] [CrossRef]
- Houssard, C.; Maxime, D.; Pouliot, Y.; Margni, M. Allocation is not enough! A system boundaries expansion approach to account for production and consumption synergies: The environmental footprint of Greek yogurt. J. Clean. Prod. 2021, 283, 124607. [Google Scholar] [CrossRef]
- Famiglietti, J.; Guerci, M.; Proserpio, C.; Ravaglia, P.; Motta, M. Development and testing of the product environmental footprint milk tool: A comprehensive LCA tool for dairy products. Sci. Total Environ. 2019, 648, 1614–1626. [Google Scholar] [CrossRef]
- March, M.D.; Hargreaves, P.R.; Sykes, A.J.; Rees, R.M. Effect of Nutritional Variation and LCA Methodology on the Carbon Footprint of Milk Production From Holstein Friesian Dairy Cows. Front. Sustain. Food Syst. 2021, 5, 588158. [Google Scholar] [CrossRef]
- Berardy, A.; Seager, T.; Costello, C.; Wharton, C. Considering the role of life cycle analysis in holistic food systems research, policy, and practice. J. Agric. Food Syst. Community Dev. 2020, 9, 209–227. [Google Scholar] [CrossRef]
- Sturaro, E.; Cocca, G.; Gallo, L.; Mrad, M.; Ramanzin, M. Livestock systems and farming styles in Eastern Italian Alps: An on-farm survey. Ital. J. Anim. Sci. 2009, 8, 541–554. [Google Scholar] [CrossRef]
- Mazzetto, F.; Bonera, R. MEACROS: A tool for multi-criteria evaluation of alternative cropping systems. Eur. J. Agron. 2003, 18, 379–387. [Google Scholar] [CrossRef]
- Nijkamp, P.; van Delft, A. Multi-Criteria Analysis and Regional Decision-Making; Springer Science & Business Media: Leiden, The Netherlands, 1977; 140p, ISBN 90-2070-6896. [Google Scholar]
- Govindan, K.; Jepsen, M.B. ELECTRE: A comprehensive literature review on methodologies and applications. Eur. J. Oper. Res. 2016, 250, 1–29. [Google Scholar] [CrossRef]
- Mazzetto, F.; Papetti, L.; Pelikan, B. Small Hydroelectric Plants. In Guide to the Environmental Approach and Impact Assessment; Studio Frosio, European Commission (DGTREN, FP5, ENERGIE): Brescia, Italy, 2000; p. 110. [Google Scholar]
- Mazzetto, F.; Carabin, G.; Becce, L.; Mandler, A.; Sacco, P. Technological Solutions for Implementing Sustainable Cereal-Based Value-Chains in High Mountain Areas. Lect. Notes Civ. Eng. LNCE 2023, 337, 733–741. [Google Scholar]
- Dalgaard, R.; Schmidt, J.H. Life Cycle Inventories of Brewer’s Grain, DDGS and Milk Replacer; Arla Foods: Aarhus, Denmark, 2014; Available online: https://lca-net.com/files/Dalgaard-and-Schmidt-2014-Life-cycle-inventories-of-brewers-grain-DDGS-and-milk-replacer.pdf (accessed on 28 May 2025).
- Amienyo, D.; Azapagic, A. Life cycle environmental impacts and costs of beer production and consumption in the UK. Int. J. Life Cycle Assess. 2016, 21, 492–509. [Google Scholar] [CrossRef]
- Zeppa, G. Available online: http://www.giuseppezeppa.com/files/tecnologia-birra-feb-24.pdf (accessed on 28 May 2025).
- Kløverpris, J.H.; Elvig, N.; Nielsen, P.H.; Nielsen, A.M.; Bryggeri, H.; Ratzel, O.R.; Karl, A.; Comparative Life Cycle Assessment of Malt-Based Beer and 100% Barley Beer. Novozymes A/S 2009. Available online: https://www.yumpu.com/en/document/read/4630649/comparative-life-cycle-assessment-of-malt-based-beer-and-100- (accessed on 28 May 2025).
- De Marco, I.; Miranda, S.; Riemma, S.; Iannone, R. Life cycle assessment of ale and lager beers production. Chem. Eng. Trans. 2016, 49, 337–342. [Google Scholar]
- Brito, A.G.; Peixoto, J.; Oliveira, J.M.; Oliveira, J.A.; Costa, C.; Nogueira, R.; Rodrigues, A. Brewery and Winery Wastewater Treatment: Some Focal Points of Design and Operation. In Utilization of By-Products and Treatment of Waste in the Food Industry; Oreopoulou, V., Russ, W., Eds.; Springer: Boston, MA, USA, 2007; Volume 3, pp. 109–131. [Google Scholar]
- Cederberg, C.; Mattsson, B. Life cycle assessment of milk production—A comparison of conventional and organic farming. J. Clean. Prod. 2000, 8, 49–60. [Google Scholar] [CrossRef]
- Cimini, A.; Moresi, M. Il Carbon Footprint Della Birra Lager. Available online: https://www.georgofili.it/uploaded/1577.pdf (accessed on 28 May 2025).
- Jensen, J.K.; Arlbjørn, J.S. Product carbon footprint of rye bread. J. Clean. Prod. 2014, 82, 45–57. [Google Scholar] [CrossRef]
- Lovarelli, D.; Bacenetti, J.; Berckmans, D.; Guarino, M. Using LCA to estimate the potential reduction of the environmental impact by PLF technology. In Precision Livestock Farming; Organizing Committee of the European Conference on Precision Livestock Farming, Ed.; Elsevier: Amsterdam, The Netherlands, 2022; Available online: https://www.scopus.com/record/display.uri?eid=2-s2.0-85172348840&origin=inward&txGid=81705b5d597ff402693e62fdca999113 (accessed on 28 April 2025).
- Dalla Riva, A.; Burek, J.; Kim, D.; Thoma, G.; Cassandro, M.; De Marchi, M. The environmental analysis of asiago PDO cheese: A case study from farm gate-to-plant gate. Ital. J. Anim. Sci. 2017, 17, 250–262. [Google Scholar] [CrossRef]
- Romano, E.; Roma, R.; Tidona, F.; Giraffa, G.; Bragaglio, A. Dairy Farms and Life Cycle Assessment (LCA): The Allocation Criterion Useful to Estimate Undesirable Products. Sustainability 2021, 13, 4354. [Google Scholar] [CrossRef]


| Value Chain | Phases | Strengths/Opportunities | Weaknesses/Challenges |
|---|---|---|---|
| A Rye wholemeal bread |
|
|
|
| B Barley craft beer |
|
|
|
| C Cow mature cheese |
|
|
|
| D Goat mature cheese |
|
|
|
| Phase | Machine | Value Chain |
|---|---|---|
| Cultivation | Mountain tractor (Pn 63 kW) | Bread, Beer |
| Rotary harrow (fw 1.6 m; depth 10–12 cm) | Bread, Beer | |
| Drum mulcher (fw 1.8 m) | Bread, Beer | |
| Combi seeder (fw 1.6 m) | Bread, Beer | |
| Stripper head (fw 1.6 m), rotor speed 450 rpm | Bread, Beer | |
| Trailer | Bread, Beer, Cheese | |
| Mountain tracker (Pn 25 kW) | Cheese | |
| Rake (fw 3.8 m) | Cheese | |
| Hay turner (fw 4.0 m) | Cheese | |
| Mowing bar (fw 2.2 m) | Cheese | |
| Postharvest and storage | Stand thresher | Bread, Beer |
| Cleaner | Bread, Beer | |
| Dryer | Bread, Beer | |
| Vertical silos | Bread | |
| Milling and baking | Mill | Bread |
| Kneaders | Bread | |
| Oven | Bread | |
| Bakery room, flour storage, shop | Bread | |
| Brewing | Malting equipment | Beer |
| Fermenters | Beer | |
| Bottling machine | Beer | |
| Packaging machines | Beer | |
| Cooking room, cellar | Beer | |
| Stable management | Milking parlor plant | Cheese |
| Barn infrastructure | Cheese | |
| Manure treatment equipment | Cheese | |
| Hay and feed equipment | Cheese | |
| Cheese production | Maturation cell | Cheese |
| Curd room with equipment | Cheese | |
| Storage cell | Cheese |
| Phase | Input | Output | Notes |
|---|---|---|---|
| Cultivation | Rye seeds: 180 kg Organic fertilizer: 220 kg Fuel (diesel): 156 kg | Rye corn (20% w.b.): 2500 kg | Operations: mulching, harrowing, sowing, fertilization (organic), harvesting, transport to the warehouse (distance 0.2 km); irrigation is required only seldom in spring in extreme dry seasons and for this reason is omitted in the study; pesticides are not employed; impact of infrastructures is not considered. Harvest losses remain on the field. |
| Postharvest | Rye corn (20% w.b.): 2500 kg Fuel (Diesel): 28 kg Electricity: 78 kWh | Rye corn (12% w.b.): 2159 kg Residues: 114 kg Water (evaporated): 227 kg | Operations: threshing, cleaning, drying. The residues (5%) result from the cleaning and screening process and are composted on the farm. |
| Milling | Rye corn (12% w.b.): 2159 kg Electricity: 238 kWh | Flour: 2095 kg Residues: 64 kg | The residues (3%) are used as fertilizers and animal feed. |
| Bread making and baking | Flour: 2095 kg Salt: 31 kg Yeast: 52 kg Water: 1571 L Electricity: 519 kWh Paper: 21 kg | Packed bread: 2095 kg Water (evaporated): 1655 L | 1 kg bread in a paper bag |
| Phase | Input | Output | Notes |
|---|---|---|---|
| Cultivation | Barley seeds: 180 kg Organic fertilizer: 220 kg Fuel (diesel): 156 kg | Barley corn (20% w.b.): 2316 kg | Operations: mulching, harrowing, sowing, fertilization (organic), harvesting, transport to the warehouse; irrigation is required only seldom in spring in extreme dry seasons and for this reason is omitted in the study; pesticides are not employed; impact of infrastructures is not considered. Harvest losses remain on the field. |
| Postharvest | Barley corn (20% w.b.): 2316 kg Fuel (diesel): 26 kg Electricity: 72 kWh | Barley corn (12% w.b.): 2000 kg Residues: 106 kg Water (evaporated): 211 kg | Operations: threshing, cleaning, drying. The residues result from the cleaning and screening process and are composted on the farm. |
| Malting | Barley corn (12% w.b.): 2000 kg Natural gas: 92 Nm3 Electricity: 143 kWh Water: 3344 L | Malt: 1600 kg Barley sharps: 20 kg Malt sprouts: 72 kg | Operations: steeping, germination, kilning, cleaning. The malt/barley grain yield is 0.8 in line with [29,32]. For the inputs and outputs of the malting phase, reference is made to [29,32]. The residues are used as fertilizers and animal feed. Water is found in the waste and evaporates in the processes. |
| Brewing and bottling | Malt: 1600 kg Hop: 48 kg Yeast: 202 kg Water: 57,600 L Natural gas: 457 Nm3 Electricity: 739 kWh Glass: 7040 kg | Bottled beer: 9600 L Brewers’ grain: 1280 kg Wastewater: 39,031 L | Operations: cooking the wort, fermentation, filtration, bottling. 0.75 L glass bottle 1 kg beer = 1 L beer Water/beer ratio = 6 in accordance with [30,31]. Beer/malt ratio = 6 in accordance with [29,31,32]. Input yeast reference to [30]. Brewers’ grain approximately 0.8 following [29]. Wastewater 0.7 of input water following [34] |
| Phase | Input | Output | Notes |
|---|---|---|---|
| Cultivation | Fuel (diesel): 66 kg Manure: 9490 kg | Hay (18% w.b.): 3500 kg | Operations: mowing, hay turning, raking, harvesting (loose forage), transport, fertilization (manure). Harvest losses remain on the field. |
| Milk production | Hay (18% w.b.): 3500 kg Fuel (diesel): 68 kg Electricity: 356 kWh Water: 1921 L Poudre milk: 72 kg Feed: 826 kg | Milk: 2547 kg Wastewater: 1343 kg Manure: 667 kg | Operations (daily): hay pick-up/distribution, other feed distribution, calf feeding, milking, milking plant cleaning, barn cleaning and manure management. Wastewater 50% of milk production. |
| Cheese production | Milk: 2547 kg Electricity: 1159 kWh | Cheese: 458 kg Whey: 2089 kg | Operations (daily): ripening/cooking cell, curd room management, refrigeration/storage cell. |
| Phase | Input | Output | Notes |
|---|---|---|---|
| Cultivation | Fuel (diesel): 66 kg Manure: 667 kg | Hay (18% w.b.): 3500 kg | Operations: mowing, hay turning, raking, harvesting (loose forage), on-farm transport, fertilization (manure). Harvest losses remain on the field. |
| Milk production | Hay (18% w.b.): 3500 kg Fuel (diesel): 68 kg Electricity: 505 kWh Water: 2504 L Poudre milk: 129 kg Feed: 1184 kg | Milk: 2687 kg Wastewater: 1343 kg Manure: 667 kg | Operations (daily): hay pick-up/distribution, other feed distribution, goat feeding, milking, milking plant cleaning, barn cleaning and manure management. Wastewater 50% of milk production. |
| Cheese production | Milk: 2687 kg Electricity: 1222 kWh | Cheese: 484 kg Whey: 2203 kg | Operations (daily): ripening/cooking cell, curd room management, refrigeration/storage cell. |
| Criterion | Measure Type | C/B | Description | Category |
|---|---|---|---|---|
| Revenue (EUR) | CAR | B | Gross value of production | ECO |
| Investment (EUR) | CAR | C | Initial investment in machinery and plant | ECO |
| Difficulty in preserving the primary product (points 1–10) | ORD | C | Difficulty in preserving the primary product | OPE |
| Difficulty in preserving the processed product (points 1–10) | ORD | C | Difficulty in preserving the processed product | OPE |
| Production loss risk (points 1–10) | ORD | C | Risk of production loss due to adverse weather conditions | ECO |
| Labor for primary production (h UL) | CAR | C | Operator labor for plant production | OPE |
| Labor for first intermediate product (h UL) | CAR | C | Operator labor for first processing | OPE |
| Labor for final product (h UL) | CAR | C | Operator labor for second processing | OPE |
| Landscape and territorial stewardship (points 1–10) | ORD | B | Impact on the landscape of all stages of the supply chain and territorial protection function in conjunction with supply chain activities | ENV |
| Byproducts valorization potential (points 1–10) | ORD | B | Availability (quantity and quality) of byproduct to be valorized | ECO |
| Land occupation (m2a) * | CAR | C | Impact on the land due to agriculture, anthropogenic settlement and resource extractions | ENV |
| Climate change (kg CO2 eq) * | CAR | C | Alteration of global temperature caused by greenhouse gases | ENV |
| Fossil depletion (kg oil eq) * | CAR | C | Decrease in the availability of non-biological resources (non- and renewable) because of their unsustainable use | ENV |
| Particulate matter formation (kg PM10 eq) * | CAR | C | Suspended extremely small particles originated from anthropogenic processes such as combustion, resource extraction, etc. | ENV |
| Farmer S_ECO | Farmer S_ENV | Farmer S_OPE | Community | Policymaker Traditional | Policymaker Innovative | Farmer No Risk | Balanced | ||
|---|---|---|---|---|---|---|---|---|---|
| ECO | Byproducts val. | 2.1% | 21.2% | 1.4% | 13.3% | 3.5% | 10.9% | 0.3% | 7.1% |
| OPE | Preserving FP | 14.5% | 2.7% | 8.4% | 2.4% | 3.7% | 9.2% | 12.8% | 7.1% |
| OPE | Preserving PP | 14.5% | 2.9% | 12.3% | 1.9% | 3.9% | 8.6% | 10.4% | 7.1% |
| ECO | Product loss | 14.5% | 3.4% | 5.0% | 3.8% | 12.0% | 5.0% | 47.8% | 7.1% |
| ECO | Revenue | 18.1% | 15.8% | 6.5% | 2.8% | 17.7% | 5.2% | 14.6% | 7.1% |
| ENV | Climate change | 0.4% | 11.9% | 1.4% | 12.9% | 2.7% | 9.2% | 0.5% | 7.1% |
| ENV | Fossil depletion | 0.4% | 3.3% | 1.4% | 11.7% | 3.4% | 9.3% | 0.8% | 7.1% |
| ECO | Investment | 32.1% | 20.8% | 4.4% | 4.1% | 8.4% | 9.7% | 2.6% | 7.1% |
| OPE | Labor FP | 0.7% | 2.4% | 15.4% | 4.0% | 3.1% | 4.6% | 2.0% | 7.1% |
| OPE | Labor PP | 0.7% | 2.3% | 18.7% | 3.4% | 3.5% | 4.7% | 1.7% | 7.1% |
| OPE | Labor IP | 0.7% | 2.4% | 17.7% | 3.6% | 3.8% | 4.7% | 1.3% | 7.1% |
| ENV | Land occup. | 0.4% | 1.3% | 0.2% | 12.0% | 14.6% | 6.3% | 0.6% | 7.1% |
| ENV | Landscape | 0.7% | 6.3% | 3.4% | 18.3% | 15.9% | 5.9% | 1.5% | 7.1% |
| ENV | Particulate | 0.4% | 3.2% | 4.0% | 5.9% | 3.8% | 6.7% | 3.1% | 7.1% |
| Criterion | C/B | Rye Bread (A) | Barley Beer (B) | Cow Cheese (C) | Goat Cheese (D) | Category |
|---|---|---|---|---|---|---|
| Revenue (EUR) | B | 16,760.00 | 153,600.00 | 10,086.47 | 15,474.64 | ECO |
| Investment (EUR) | C | 17,687.50 | 19,750.00 | 22,375.00 | 21,125.00 | ECO |
| Difficulty in preserving the primary product (points 1–10) | C | 3.0 | 3.0 | 10.0 | 10.0 | OPE |
| Difficulty in preserving the processed product (points 1–10) | C | 8.0 | 1.0 | 2.0 | 2.0 | OPE |
| Production loss risk (points 1–10) | C | 9.0 | 8.0 | 3.0 | 3.0 | ECO |
| Labor for primary production (h UL) | C | 90.9 | 148.4 | 79.1 | 79.1 | OPE |
| Labor for first intermediate product (h UL) | C | 8.6 | 82.8 | 139.1 | 165.3 | OPE |
| Labor for final product (h UL) | C | 79.8 | 193.0 | 116.3 | 147.8 | OPE |
| Landscape and territorial stewardship (points 1–10) | B | 7.5 | 7.5 | 8.0 | 7.0 | ENV |
| Byproducts valorization potential (points 1–10) | B | 3.0 | 7.0 | 9.0 | 9.0 | ECO |
| Land occupation (m2a) | C | 685.7 | 3271.9 | 195.0 | 204.7 | ENV |
| Climate change (kg CO2 eq) | C | 1313.0 | 9735.0 | 3687.6 | 3890.0 | ENV |
| Fossil depletion (kg oil eq) | C | 215.6 | 2967.1 | 334.5 | 352.8 | ENV |
| Particulate matter formation (kg PM10 eq) | C | 3.3 | 22.3 | 22.9 | 24.2 | ENV |
| Criteria | C/B | Rye Bread | Barley Beer | Cow Cheese | Goat Cheese | Category |
|---|---|---|---|---|---|---|
| Revenue | B | 0.05 | 1.00 | 0.00 | 0.04 | ECO |
| Investment | C | 1.00 | 0.56 | 0.00 | 0.27 | ECO |
| Difficulty in preserving the primary product | C | 1.00 | 1.00 | 0.00 | 0.00 | OPE |
| Difficulty in preserving the final product | C | 0.00 | 1.00 | 0.86 | 0.86 | OPE |
| Production loss risk | C | 0.00 | 0.17 | 1.00 | 1.00 | ECO |
| Labor for primary production | C | 0.83 | 0.00 | 1.00 | 1.00 | OPE |
| Labor for intermediate product | C | 1.00 | 0.53 | 0.17 | 0.00 | OPE |
| Labor for final product | C | 1.00 | 0.00 | 0.68 | 0.40 | OPE |
| Landscape and territorial stewardship | B | 0.50 | 0.50 | 1.00 | 0.00 | ENV |
| Byproducts valorization potential | B | 0.00 | 0.67 | 1.00 | 1.00 | ECO |
| Land occupation | C | 0.84 | 0.00 | 1.00 | 1.00 | ENV |
| Climate change | C | 1.00 | 0.00 | 0.72 | 0.69 | ENV |
| Fossil depletion | C | 1.00 | 0.00 | 0.96 | 0.95 | ENV |
| Particulate matter formation | C | 1.00 | 0.09 | 0.06 | 0.00 | ENV |
Disclaimer/Publisher’s Note: The statements, opinions and data contained in all publications are solely those of the individual author(s) and contributor(s) and not of MDPI and/or the editor(s). MDPI and/or the editor(s) disclaim responsibility for any injury to people or property resulting from any ideas, methods, instructions or products referred to in the content. |
© 2025 by the authors. Licensee MDPI, Basel, Switzerland. This article is an open access article distributed under the terms and conditions of the Creative Commons Attribution (CC BY) license (https://creativecommons.org/licenses/by/4.0/).
Share and Cite
Sacco, P.; Don, D.; Mandler, A.; Mazzetto, F. Integrating LCA and Multi-Criteria Tools for Eco-Design Approaches: A Case Study of Mountain Farming Systems. Sustainability 2025, 17, 6240. https://doi.org/10.3390/su17146240
Sacco P, Don D, Mandler A, Mazzetto F. Integrating LCA and Multi-Criteria Tools for Eco-Design Approaches: A Case Study of Mountain Farming Systems. Sustainability. 2025; 17(14):6240. https://doi.org/10.3390/su17146240
Chicago/Turabian StyleSacco, Pasqualina, Davide Don, Andreas Mandler, and Fabrizio Mazzetto. 2025. "Integrating LCA and Multi-Criteria Tools for Eco-Design Approaches: A Case Study of Mountain Farming Systems" Sustainability 17, no. 14: 6240. https://doi.org/10.3390/su17146240
APA StyleSacco, P., Don, D., Mandler, A., & Mazzetto, F. (2025). Integrating LCA and Multi-Criteria Tools for Eco-Design Approaches: A Case Study of Mountain Farming Systems. Sustainability, 17(14), 6240. https://doi.org/10.3390/su17146240