Article

An Integrated Life Cycle Assessment of a Hemp-Based Craft Beer: A Case Study from Italy

Department of Management, Sapienza University of Rome, Via del Castro Laurenziano 9, 00161 Rome, Italy
*
Author to whom correspondence should be addressed.
Sustainability 2025, 17(13), 6232; https://doi.org/10.3390/su17136232
Submission received: 10 June 2025 / Revised: 3 July 2025 / Accepted: 5 July 2025 / Published: 7 July 2025
(This article belongs to the Special Issue Sustainable Development in Food Quality and Safety)

Abstract

With over 180 million tons produced annually and a global market exceeding 500 billion dollars, beer is one of the most widely consumed beverages in the world, thanks to its broad variety of styles, traditions, ingredients, and brewing techniques. However, behind this widespread popularity lies a potentially impactful production chain, whose environmental impacts remain underexplored, particularly within the craft segment. This research evaluates the sustainability of a hemp-based craft beer produced in the Lazio region (Italy) using an integrated approach that combines life cycle assessment with environmental impact monetization. The results indicate that the main impacts in beer production are related to global warming potential (0.916 kg CO2 eq/L), terrestrial ecotoxicity (0.404 kg 1.4-DCB eq/L), land use (0.841 m2a crop eq/L), and fossil resource scarcity (0.211 kg oil eq/L), primarily due to malt production and hop transportation. Packaging analysis revealed that including environmental costs, aluminum cans may add an additional environmental cost of €0.80–1.60 per unit, while glass bottles, despite their weight, incur a lower additional cost. For a beer priced at €3.50, this would translate to a real cost of €4.30–5.10, reflecting a 22–45% increase. Improving sustainability in the brewing sector requires strategic actions, such as careful supplier selection and appropriate packaging choices. Overall, sustainability in brewing emerges as a balance between production needs, distribution impacts, and systemic decisions.

1. Introduction

Beer, one of the oldest alcoholic beverages, dating back to around 6000 B.C., is now the most widely consumed alcoholic drink worldwide [1] and the third most popular beverage overall [2]. In recent years, it has also gained attention in Food Science, particularly regarding the environmental impacts of craft beer production and the growth of microbreweries [3]. Brewing beer is an ancient food fermentation practice in which a starch source, such as malt or other sprouted grains, is mixed with water and the resulting sugar-rich liquid (called “wort”) is allowed to ferment using yeast to produce alcoholic beer [4]. Although malted barley is the most commonly used ingredient, other grains such as wheat, corn, or rice can also be used. In general, the main steps in the brewing process include malting, milling, mashing, boiling, cooling, fermentation, maturation, filtration, and carbonation, followed by microbiological stabilization and packaging [5]. In recent years, numerous technological changes and process innovations have been introduced that have led to the emergence of new beer styles and beer-like beverages.
In countries with a long brewing tradition, such as Germany, beer production is strictly regulated, requiring only water, malted barley, hops, and yeast [6]. Elsewhere, more flexible regulations allow brewers to experiment with ingredients and recipes. Today, the global beer industry is worth more than $500 billion [7] against a production of 180,327,000 tons in 2022 [8], with countries such as China (34,028,000 tons), United States (23,761,000 tons), and Brazil (13,944,000 tons) dominating the world market. Considering annual per capita consumption, on the other hand, Botswana (150.43 kg per capita/year), Czech Republic (139.82), Lithuania (107.1), Austria (105.95), and Germany (95.22) are among the top performers [8]. Although Italy is not among the largest producers or consumers of beer globally (with 2,161,000 tons, it ranks 17th among producing countries and with 36.6 kg per capita it ranks 66th among consumers), it plays an increasingly important role in the international beer scene, particularly in the craft beer segment. Over the past decade, the Italian craft beer sector has experienced significant expansion, both in terms of the number of active microbreweries and the variety of styles and products offered. This growth reflects a broader trend toward small-scale production models that are strongly rooted in territories, quality-oriented, and often linked to regional identity and traditions. In general, almost all beer styles can be classified as ale or lager, depending on the type of yeast and fermentation method used. Ale (whose term comes from the Old English “ealu,” an ancient cereal-based fermented beverage) is brewed with highly fermented yeasts, particularly Saccharomyces cerevisiae, which operate at higher temperatures, usually between 15 and 24 °C (15 and 24 °C) [9]. This type of fermentation tends to be faster and gives the beer a complex flavor profile. Lagers, on the other hand, are fermented with bottom-fermenting yeasts, such as Saccharomyces pastorianus, which work at colder temperatures, generally between 7 and 13 °C [10]. Fermentation is slower and is followed by a long cold maturation phase, called laagering. Beers can be further classified according to their style, which considers several factors such as color and appearance, flavor and aroma profile, alcohol content, body, ingredients used (such as grains, yeasts, fruits, or spices), as well as geographical origin and production method. Common styles include Indian Pale Ale (IPA), ales (or blondes), stouts, pilsners, wheat beers, and sours. IPAs are characterized by the abundant use of hops, which gives them a markedly bitter flavor and intense aromas. Blonde beers, on the other hand, are generally light, easy to drink, and have a more restrained hop bitterness. Stouts are made with roasted malts, which give them a very dark color and aromas often reminiscent of coffee, chocolate, or vanilla [11]. Pilsners, originally from the Czech Republic, are part of the lager family and are characterized by a light color and light body, while sour beers have a more acidic flavor because they use lactic acid-producing bacteria, acetic acid-producing bacteria, or yeast [12]. In any case, these examples demonstrate how the beer industry is extremely vast and varied, characterized by a great diversity of styles, production traditions, ingredients, and fermentation techniques. Thus, despite the fact that beer is one of the most consumed and culturally rooted beverages in the world, its production involves a number of environmental impacts, related to the production of raw materials, their transportation, the use of electricity, the type of packaging, etc. In this context, the craft beer sector represents a booming but also extremely heterogeneous reality. In fact, unlike large industries, microbreweries operate with smaller facilities, local or variable supplies, and often less standardized technologies [13]. While industrial production has already embarked on structured paths of environmental efficiency, craft breweries find themselves operating in a more fragmented context, which could make it more difficult to measure and compare the real environmental impact of the finished product. Therefore, in this context, it might be useful to assess the sustainability of their productions in order to provide objective and comparable assessments that can steer the industry toward more sustainable practices.
Given the economic, social, and cultural role of beer, as well as considering a growing consumer focus on more responsible choices, it might be useful to broaden the discourse on sustainability within the brewing industry, especially considering the craft beer market segment. Added to this is also a particularly significant element, namely packaging. Often perceived as a simple container, it can significantly affect the overall impact of a beer. Given this, the objective of this study was to assess the environmental sustainability of craft beer production, with a focus on the impacts generated throughout the product’s life cycle. Life cycle assessment (LCA) methodology was used for the assessment, considering, and analyzing a hemp-flavored craft beer produced in a brewery in Lazio (Italy). Particular attention was also paid to the packaging phase, with the aim of comparing different types of packaging (in terms of materials and shapes) to identify the solution with the lowest environmental impact. Thus, the ultimate goal is to identify more sustainable production and distribution strategies for the brewing industry, helping to steer producer and consumer choices toward a more responsible pattern of beer consumption that can help reduce the overall impact.

2. Literature Review

Entering the keywords “Life Cycle Assessment AND Beer” (TITLE-ABS-KEY) on Scopus resulted in 79 publications, with the first studies as early as 1998. As shown in Figure 1, the distribution of publications over time shows a growing interest in the topic, especially in recent years, highlighting a significant growth in scientific attention to life cycle analysis applied to beer production, particularly after 2015. This trend may be partly explained by the significant expansion of the craft beer market globally, which has led to an increase in the diversity of beer types and production processes, creating the need for sustainability assessments tailored to different scales and products [14]. Additionally, the increasing economic support and policy incentives for small- and medium-sized enterprises in developed countries [15] may have encouraged investments in sustainability initiatives, including LCA studies in the brewing sector, as part of broader corporate social responsibility and environmental management practices.
Using VoSviewer 1.6.20 software, we conducted a bibliometric analysis based on the co-occurrence analysis of keywords (both author and index keywords) within the selected documents.
We applied a threshold of 3 co-occurrences to ensure comprehensive and interpretable results. This criterion required that at least three papers in our sample share a particular keyword. As a result (Figure 2), we identified three main clusters of keywords, which correspond to distinct paper themes, represented in different colors, and characterized as follows:
  • Cluster 1 (red—6 items): beer, brewing industry, chemistry, environmental sustainability, food industry, packaging;
  • Cluster 2 (green—6 items): carbon emission, circular economy, controlled study, sensitivity analysis, human, sustainable development;
  • Cluster 3 (blue—6 items): environmental footprint, environmental impact, life cycle assessment, recycling, sustainability.
The keywords inside each cluster present strong internal coherence and connection.
Interest has most likely grown with the adoption of environmental policies and eco-labels (Directive 2008/98/EC, Circular Economy Action Plan, European Green Deal, Farm to Fork Strategy) aimed at making food systems more sustainable, traceable, and low-emission, as well as pressure from consumers and markets for more sustainable products. The growth of the craft brewery movement may also have stimulated new studies focused on smaller but rapidly expanding production entities. However, the temporal distribution of publications is rather uneven. Generally, research often follows the priorities of funding calls. In certain years, greater availability of funds for projects on sustainability and agri-food supply chains could have stimulated more publications.
Conversely, events such as the COVID-19 pandemic (2020), might have slowed experimental studies or publications, explaining a temporary decline. Geographically, however, the most prolific countries are Italy (14 studies), the United States (11), Spain (9), and the United Kingdom (8) (Figure 3), thus showing a strong concentration of research in Europe and North America. This is followed by China, Finland, Germany, Ireland, and Sweden, each with 5 publications, while Brazil (4), Denmark, the Netherlands, and Norway record 3 studies each. Then, there are another 23 studies covering 23 other countries, including, Argentina, Belgium, Canada, India, Luxembourg, Denmark, etc.
This distribution reflects both the level of development of the brewing industry in different countries and the interest in sustainability and environmental assessment within their respective academic and industry contexts. The primacy of Italy and the US could be explained by several factors. For example, Italy has a great brewing tradition, and especially craft beer, and in about ten years, has experienced significant growth [16], driving interest in studies of environmental impact and efficiency of production processes. In addition, Italy, as an active member of the EU, has strongly implemented directives on circular economy, Product Environmental Footprint, and Farm to Fork strategies [15], incentivizing research projects on sustainability in the agri-food sector. Regarding the United States, as well as Italy, they have one of the most developed craft beer markets in the world. With sales of $29.7 billion and more than 9800 craft breweries (including 2092 microbreweries, 3502 brewpubs, 3910 taproom breweries, and 257 regional craft breweries) scattered across the territory [14], the industry is very focused on production efficiency and sustainability as competitive advantages. Interestingly, despite being renowned for its brewing tradition and occupying a prominent position in beer production and export in Europe, Belgium is not among the leading countries with publications on life cycle assessment applied to beer. Considering the literature, among other research, academic studies have been conducted to assess the environmental impact of beer production, with analyses involving both large multinational companies operating on a large scale [17,18] and craft breweries [19,20]. Building upon this, several recent studies have explored different perspectives and scales within the brewing sector to quantify environmental impacts using LCA approaches. For example, among recent studies, McDonagh et al. (2024) [21] investigated the production of a sourdough pale ale by experimenting with the inclusion of different percentages of bread in the recipe. The results showed that including up to 60% would result in a reduction in global warming potential (GWP) of 0.0544 kg CO2 eq/L of beer compared to 0.7516 kg CO2 eq/L of the current recipe. In another case, Marrucci et al. (2024) [22] analyzed large-scale commercial beer production, focusing on Carlsberg and Poretti brands. The results of the study showed that CO2 emissions varied according to the type of single-use packaging used: 64.48 kg CO2/hl for PET kegs (20 L), 111.30 kg CO2/hl for 0.33 L glass bottles, and 116.64 kg CO2/hl for 0.33 L aluminum cans.
Regarding comparative assessments of beer types, Salazar Tijerino et al. (2023) [20] analyzed the environmental profiles of ale and lager brewed on a commercial (microbrewery) scale.
The results, expressed per barrel (31 gallons of beer), indicated an energy consumption of 1.04 × 10² MJ for ale beer and 1.26 × 10² MJ for lager beer. De Sadeleer et al. (2022) [23] evaluated, via LCA, the environmental impact of 1000 0.5 L portions of beer served at Norwegian festivals, comparing single-use (incineration, open- and closed-loop recycling) and multi-use mugs. Focusing on smaller-scale production, Morgan et al. (2021) [19], on the other hand, assessed the environmental impact of some craft microbreweries in Wales, showing significant variability in carbon footprints, which ranged from 760 to 1900 g CO2 eq. per liter of beer. Cimini and Moresi (2016) [18] estimated a carbon footprint between 25 and 74 kg CO2 eq. per hectoliter of beer packaged in 33 cL glass bottles or 30 L steel kegs. Finally, Rajaniemi et al. (2011) [24] found that rye has the highest greenhouse gas (GHG) emissions among the cereals analyzed, with 870 g CO2 eq/kg, compared to 570–590 g CO2 eq/kg for wheat, barley, and oats. However, despite these insights, as also pointed out by D’Ascenzo et al. (2024) [25], differences in methods, assumptions, system boundaries, beer types, packaging, and functional units make it difficult to directly compare results between studies. For example, Sipperly et al. (2014) [17] reported a GWP of 0.09152 kg CO2 eq/L, while Lalonde et al. (2013) [26] estimated 3.296 kg CO2 eq/L. In any case, Morgan et al. (2021) [19] placed the standard range of the brewing sector’s carbon footprint between 0.75 and 1.9 kg CO2 eq. per liter of beer. However, it is important to note that available studies on the LCA application of beer are few and heterogeneous, which makes direct and meaningful comparison of results difficult. This limits the ability to generalize the results and draw firm conclusions. Thus, although the literature review shows a growing interest in assessing the environmental impacts of brewing, several methodological gaps emerge that this research aims to address. First, while global warming potential is often reported, other relevant impact categories such as terrestrial ecotoxicity, land use, and fossil resource scarcity are rarely considered, resulting in a biased and underestimated view of environmental performance. Second, environmental assessment of hemp-based craft beers is currently lacking, despite the growing interest in innovative ingredients in the brewing industry. Finally, monetization of environmental impacts, which would allow environmental burdens to be translated into potential hidden costs to society, remains largely unexplored in beer LCA studies. Addressing these gaps, this research seeks to provide a comprehensive and comparable assessment of the sustainability of hemp-based craft beer by integrating LCA with monetization of impacts to support informed decision-making in the beer industry.

3. Materials and Methods

3.1. Case Study Description

A small-scale craft brewery located in the province of Rome (Lazio, Italy) was considered for the environmental assessment analysis. The plant operates on a small scale and produces several types of top-fermented beers, with a focus on experimentation and enhancement of innovative ingredients. Among the references produced, a hemp-flavored pale ale was selected as a case study, chosen for its original composition and the growing interest in innovative brewing products. Hemp is recognized for its sustainability characteristics, including, as also stated by the European Commission (2025) [27], its low water requirements, its zero use of pesticides, its capacity for soil regeneration and carbon storage (one hectare of hemp sequesters 9–15 tons CO2, an amount similar to that sequestered by a young forest, but with five months to grow), and its role in promoting biodiversity [28], making it a promising ingredient within brewing practices. Furthermore, it is important to clarify that the hemp employed in craft beer production in Europe and Italy contains a Delta-9-tetrahydrocannabinol (THC) level below 0.2% in accordance with EU Regulation 1307/2013 [29] and Italian Law 242/2016 [30], ensuring compliance with safety and legal requirements. In the US, however, hemp beers are brewed using hemp seeds or non-psychoactive parts of the plant to flavor beers. In fact, with the Farm Bill [31], industrial hemp with THC < 0.3% was legalized at the federal level, including the possibility of use for food and beverage purposes. The use of industrial hemp in beer production is, therefore, legal and safe in EU and in US, as it does not possess psychoactive properties. However, as regulations vary between countries, the legality of hemp-based beer may depend on local policies. It is worth noting that the craft brewery considered in this research operates on a regional scale, ensuring traceability and compliance with local and national regulations, while prioritizing short supply chains within the Lazio region to further support environmental sustainability and regulatory adherence. The beer analyzed in this case study belongs to the ale family and is produced through high fermentation with Saccharomyces cerevisiae yeasts, which contribute light fruity notes. Malted barley provides the main fermentable sugars and caramel hints, while corn lightens the body and supports a dry finish. Hemp inflorescences, added during wort boiling, give herbaceous and resinous notes that enrich the aroma profile. Hops contribute moderate bitterness and subtle floral nuances, balancing the taste. The beer has a deep golden color, medium carbonation, a fine, persistent foam, and a clean, dry finish. The alcohol content is around 5.8% vol. The beer is intended for local and regional distribution, ensuring freshness, and preserving its aromatic character. The choice to analyze a small-scale craft brewery located in the province of Rome is motivated by several factors:
  • First, craft breweries represent a rapidly expanding production reality in Italy, but often under-studied in environmental impact studies. Focusing on small-scale local production allows to highlight specific criticalities and opportunities related to the small scale;
  • Hemp pale ale was selected as the object of research because it represents an innovative product, combining the classic characteristics of a top-fermented beer with the addition of an unconventional ingredient, hemp, which is increasingly used in the agri-food sector for its aromatic properties and sustainability [32,33]. This allows not only to assess the environmental impact of the brewing process itself, but also to reflect on the role of alternative ingredients and their potential in differentiating the flavor profile of the final product;
  • In addition, collaboration with the brewery made it possible to collect data on the individual stages of the production process, giving the possibility to conduct the study within a reasonable time frame.

3.2. Life Cycle Assessment

Life cycle assessment was used for the evaluation, based on ISO 14040:2006 [34] and ISO 14044:2006 [35]. This methodology allows for a systematic analysis of the environmental impacts associated with a product or process throughout its life cycle, including the stages of raw material extraction, transport, production and packaging, use, recycling, and eventual final disposal. It consists of four interrelated phases, described in the following sections, of which the first three are mandatory: (1) goal and scope definition, (2) life cycle inventory (LCI), (3) life cycle impact assessment (LCIA), (4) interpretation. The four phases for this research are explained in detail in the next paragraphs.

3.2.1. Goal and Scope Definition

The LCA goal was to analyze and verify the environmental compatibility of hemp beer production. As a functional unit (FU) or the quantitative reference to which relate the inputs and outputs of the system analyzed, it was chosen the production of 1 L of beer. This choice is motivated by the fact that the liter could be useful for the comparison between different production systems, making the results easily comparable and interpretable. This choice is consistent with other literature studies associated with the environmental assessment of beer production, including Sipperly et al. (2014) [17], Morgan et al. (2021) [19], and McDonagh et al. (2024) [21], which also consider 1 L of beer. However, it should be pointed out that while appropriate for evaluating the production process, the adoption of 1 L as FU has some limitations when comparing different packaging units (e.g., 0.33 L bottles, 0.66 L bottles, or cans). In fact, the environmental impact per liter can vary depending on the surface-to-volume ratio of the packaging, the weight of the material used, and the efficiency of transportation, affecting the environmental load per liter. Therefore, although it is possible to derive environmental impacts for other commercial formats by a proportional division of the values obtained, results should be interpreted with caution when comparing different types of packaging, considering possible normalization factors related to specific packaging characteristics to ensure more accurate comparisons. The system boundaries were chosen from a cradle-to-gate perspective (Figure 4), thus starting with the raw material cultivation phase (whose phases are already considered and included in the LCA databases) up to the carbonation phase. This approach was adopted in accordance with ISO 14044, which recommends defining system boundaries based on the goal and scope of the study and the intended use of the results, specifying which processes are included and excluded in the research, ensuring consistency and comparability [35]. In more detail, the production process consists of different stages: (1) preparation of the must (which includes grinding, mashing and agitation, filtration, and sparging); (2) boiling of the must; (3) cooling; (4) fermentation; and (5) carbonation.
In the grinding stage, barley malt and corn are ground to crush the grains and make them more easily attacked by enzymes during mashing. In the mashing and agitation stage, the ground grains are mixed with hot water in a mash tun. The mixture is heated in different steps (e.g., 52 °C, 63 °C, 72 °C) to activate the enzymes that convert starches into fermentable sugars. Constant stirring allows for uniform efficiency of the process. At this point, the liquid wort is separated from the grains by filtration. Next, sparging, which is the rinsing of the grains with hot water to extract residual sugars, takes place. The wort is then transferred to a boiling vat and heated to 100 °C for 60–90 min. During this stage, hops and hemp are added, which impart aroma, bitterness, and microbiological stability. Boiling sterilizes the wort and eliminates unwanted compounds. After boiling is finished, the wort is rapidly cooled (from 100 °C to about 18–24 °C) using a heat exchanger. Rapid cooling is essential to avoid contamination and prepare the wort for fermentation. The cooled wort is transferred to a fermenter and inoculated with dry yeast at a controlled temperature (18–24 °C) for 5–7 days, during which the sugars are converted to alcohol and CO2.
Finally, after fermentation, the beer is carbonated by liquid food CO2 fed into pressurized tanks. This process takes 2–4 h and results in the formation of the desired carbonation level. Process wastes, such as spent grains and wastewater, were considered as zero-load output streams as they were destined for feed and centralized treatment systems, respectively, in accordance with industry practices [18,19].

3.2.2. Life Cycle Inventory

Data used in this research are primary one and were collected following several meetings with the craft brewery producers, who provided all available information for the inventory. Then, correspondence was maintained via e-mail with the producers, to discuss and establish the most relevant processes. The basic ingredients for brewing (Table 1), are barley malt in the main amount, corn as an adjunct, hops, high fermentation ALE dry yeast (Saccharomyces cerevisiae), and hemp (which adds an herbaceous aroma). For clarity and replicability, the quantities of ingredients and resources used were reported both on a per-liter basis (FU) and for a typical batch size of 100 L. The commercial strain Fermentis SafAle™ US-05 (Fermentis, Marcq-en-Barœul, France), known for its high attenuation, neutral and clean profile, and low ester production, was used as the yeast, allowing the hop and hemp aromas to express themselves more prominently in the final product. Potable and CO2 food-grade water in liquid form (E290), supplied in pressurized cylinders or tanks, is added, as well as electricity for the various stages. Raw materials are mainly of regional origin, in line with the production choices of the brewery analyzed. In particular, barley malt and corn are supplied by local growers and processors in Lazio and central Italy. In detail, the finished barley malt is purchased from malt factories located in Umbria and transported to the brewery, considering an average of 250 km, while the corn comes from Agro Pontino (an average of 35 km). Hemp is supplied by a small farm in the same region, considering an average distance of 120 km. The three inputs are transported by truck (trucking). The hops used are of European origin, mainly German, as domestic production is not yet sufficient to cover demand, according to the producers. A distance of 1000 km by road was estimated, while the dry yeast is supplied by specialized international producers and is distributed through established channels in the Italian brewing market, the origin of which was not specified by the supplier. The water used comes from the local water supply, while liquid food CO2 (E290) for forced carbonation is supplied by Italian distributors and stored at the brewery in pressurized cylinders. All average transportation distances were estimated to be consistent with the brewery’s operational reality and used in LCA calculations, based on Equation (1), as suggested by Wild (2021) [36] and ISO 14083 [37]:
TKM = i × δ 1000
where:
  • TKM is the transport of 1 ton of goods for 1 km of distance;
  • i is the distance in km as the crow flies of commodity i from a place x to a place;
  • δ is the weight in kg of the material being transported.
So, for example, considering a weight of 0.2 kg, or 0.0002 tons, and a distance of 250 km as the crow flies, transporting 0.2 kg of malt from central Italy to the plant covers approximately 0.05 TKM and so on for each input. Therefore, the transportation data for raw materials are as follows: 0.05 TKM for barley malt, 0.00175 TKM for corn, 0.0006 TKM for hemp, 1.5 TKM for hops, n.a. the data for yeast and liquid CO2. However, the transport data used in the research should be considered purely indicative, as they are subject to significant variability due to the complexity of supply chains.
Table 1. Life cycle inventory of the brewing process (× 1 L and × batch).
InputUnitWort PreparationWort BoilingCoolingFermentationCarbonationTot.
GrindingMashing/AgitationFiltration/Sparging
×1 L×Batch (100 L)×1 L×Batch (100 L)×1 L×Batch (100 L)×1 L×Batch (100 L)×1 L×Batch (100 L)×1 L×Batch (100 L)×1 L×Batch (100 L)×1 L×Batch (100 L)
Malt Barleykg0.220------------0.220
Cornkg0.055------------0.055
Hempkg------0.0050.5------0.0050.5
WaterL--3.5350----------3.5350
Hopsg------1.5150------1.5150
Yeastsg----------0.770--0.770
ElectricitykWh0.0050.50.35350.0220.25250.0770.0660.0040.40.7676
Liquid food CO2 (E290)g------------88008800
Time 20 min60–90 min30–45 min60–90 min20–30 min5–7 days2–4 h7 days
Temperature°CRoom52–7265–75100from 100 to 2018–244
Output
WortL3.53503.23203.13102.92902.852852.75275----
BeerL------------11001100
Indeed, in many cases, it was not possible to accurately reconstruct the complete logistic route followed by raw materials, especially for those that undergo intermediate transformation processes (as in the case of CO2) or that come from international circuits (such as yeast or hops). The estimated distances were, therefore, modeled on the basis of typical suppliers, realistic sourcing scenarios, and prevailing transportation logics, but may not perfectly reflect the actual situation for each individual batch of raw materials. This introduces a margin of uncertainty that must be taken into account when interpreting the results, while remaining compatible with the level of detail commonly accepted in exploratory LCA studies. Relative to electricity, on the other hand, the Italian electricity mix was considered. The following databases were used for background data modeling: World Food LCA Database (WFLDB) for barley malt, Agri-Footprint for corn, Agribalyse 3.1 for hemp and yeast, EF Database for hops, and Ecoinvent v3.11 for water, electricity, and transport.

3.2.3. Life Cycle Impact Assessment

Two methodologies were used to assess environmental impacts: ReCiPe 2016 (H) MidPoint [38] and Environmental Prices [39]. The first methodology is a combination of the Eco-Indicator and CML methods, and provides results according to physical quantities, organized into 18 impact categories. The hierarchical perspective (H) was adopted because it represents an intermediate way between the other two available perspectives: the egalitarian (E) perspective, which is more precautionary and long-term oriented, and the individualist (I) perspective, which is generally more optimistic and based on short-term scientific evidence. The choice of perspective (H) is motivated by the fact that it reflects the most commonly adopted policy and regulatory principles, offering a reasonable balance between precaution and pragmatism [40]. The second methodology, on the other hand, was used to convert each category of environmental impact into monetary units, with the aim of estimating the economic value of environmental damage associated with emissions and to estimate, in theoretical terms, the potential costs to society. With this in mind, the environmental price was calculated by assigning a monetary value to environmental quality through an analysis of the damage caused by each pollutant stream. Specifically, the environmental price has been understood as the marginal social value of preventing an emission, expressed in €/kg, i.e., the loss of social welfare caused by an additional kilogram of pollutant released into the environment. To determine marginal damage costs, there are several approaches to convert biophysical fluxes into monetary units, such as Ecovalue12, Stepwise2006, LIME3, Ecotax, EcoValue Ratio (EVR), and Environmental Priority Strategies (EPS), but in this study, the environmental prices was chosen for its comprehensive and multi-comprehensive monetization for different impact categories. In fact, EPS and EVR are widely used and provide structured damage cost estimates across multiple categories, often supporting policy decisions and prioritization in eco-design. However, EPS and EVR typically consider a more limited set of emission types or are based on region-specific damage costs, while the environmental prices offers a comprehensive, Europe-focused, and multi-category monetization approach suitable for detailed LCA integration across 18 impact categories. ReCiPe 2016 MidPoint was chosen mainly because having 18 impact categories can give a broader view of environmental impacts, compared to, for example, other methodologies that have fewer impact categories (e.g., TRACI, ILCD, etc.). Environmental prices, on the other hand, was chosen mainly to assess the real environmental cost of a production process, which are paid by society and citizens in the form of health costs.

3.3. Scenario Analysis

Next, the functional unit of the study was changed from 1 L to 0.33 L, corresponding to the standard format of a bottle/can commonly used in retail. This choice was made to assess the environmental impact associated with the choice of packaging, so as to identify which type of packaging is most beneficial in terms of sustainability for the brewery itself. In the first part of the study, the data considered concerned only the internal stages of the production process, up to and including packaging readiness. Extending the analysis to the packaged unit now makes it possible to include packaging materials (glass and aluminum, PET) in the system so as to understand how impacts can be minimized, at least from the packaging point of view. Therefore, five types of packaging (0.33 cl), two aluminum and three glass, were considered, and weighed, as shown in Table 2. In more detail:
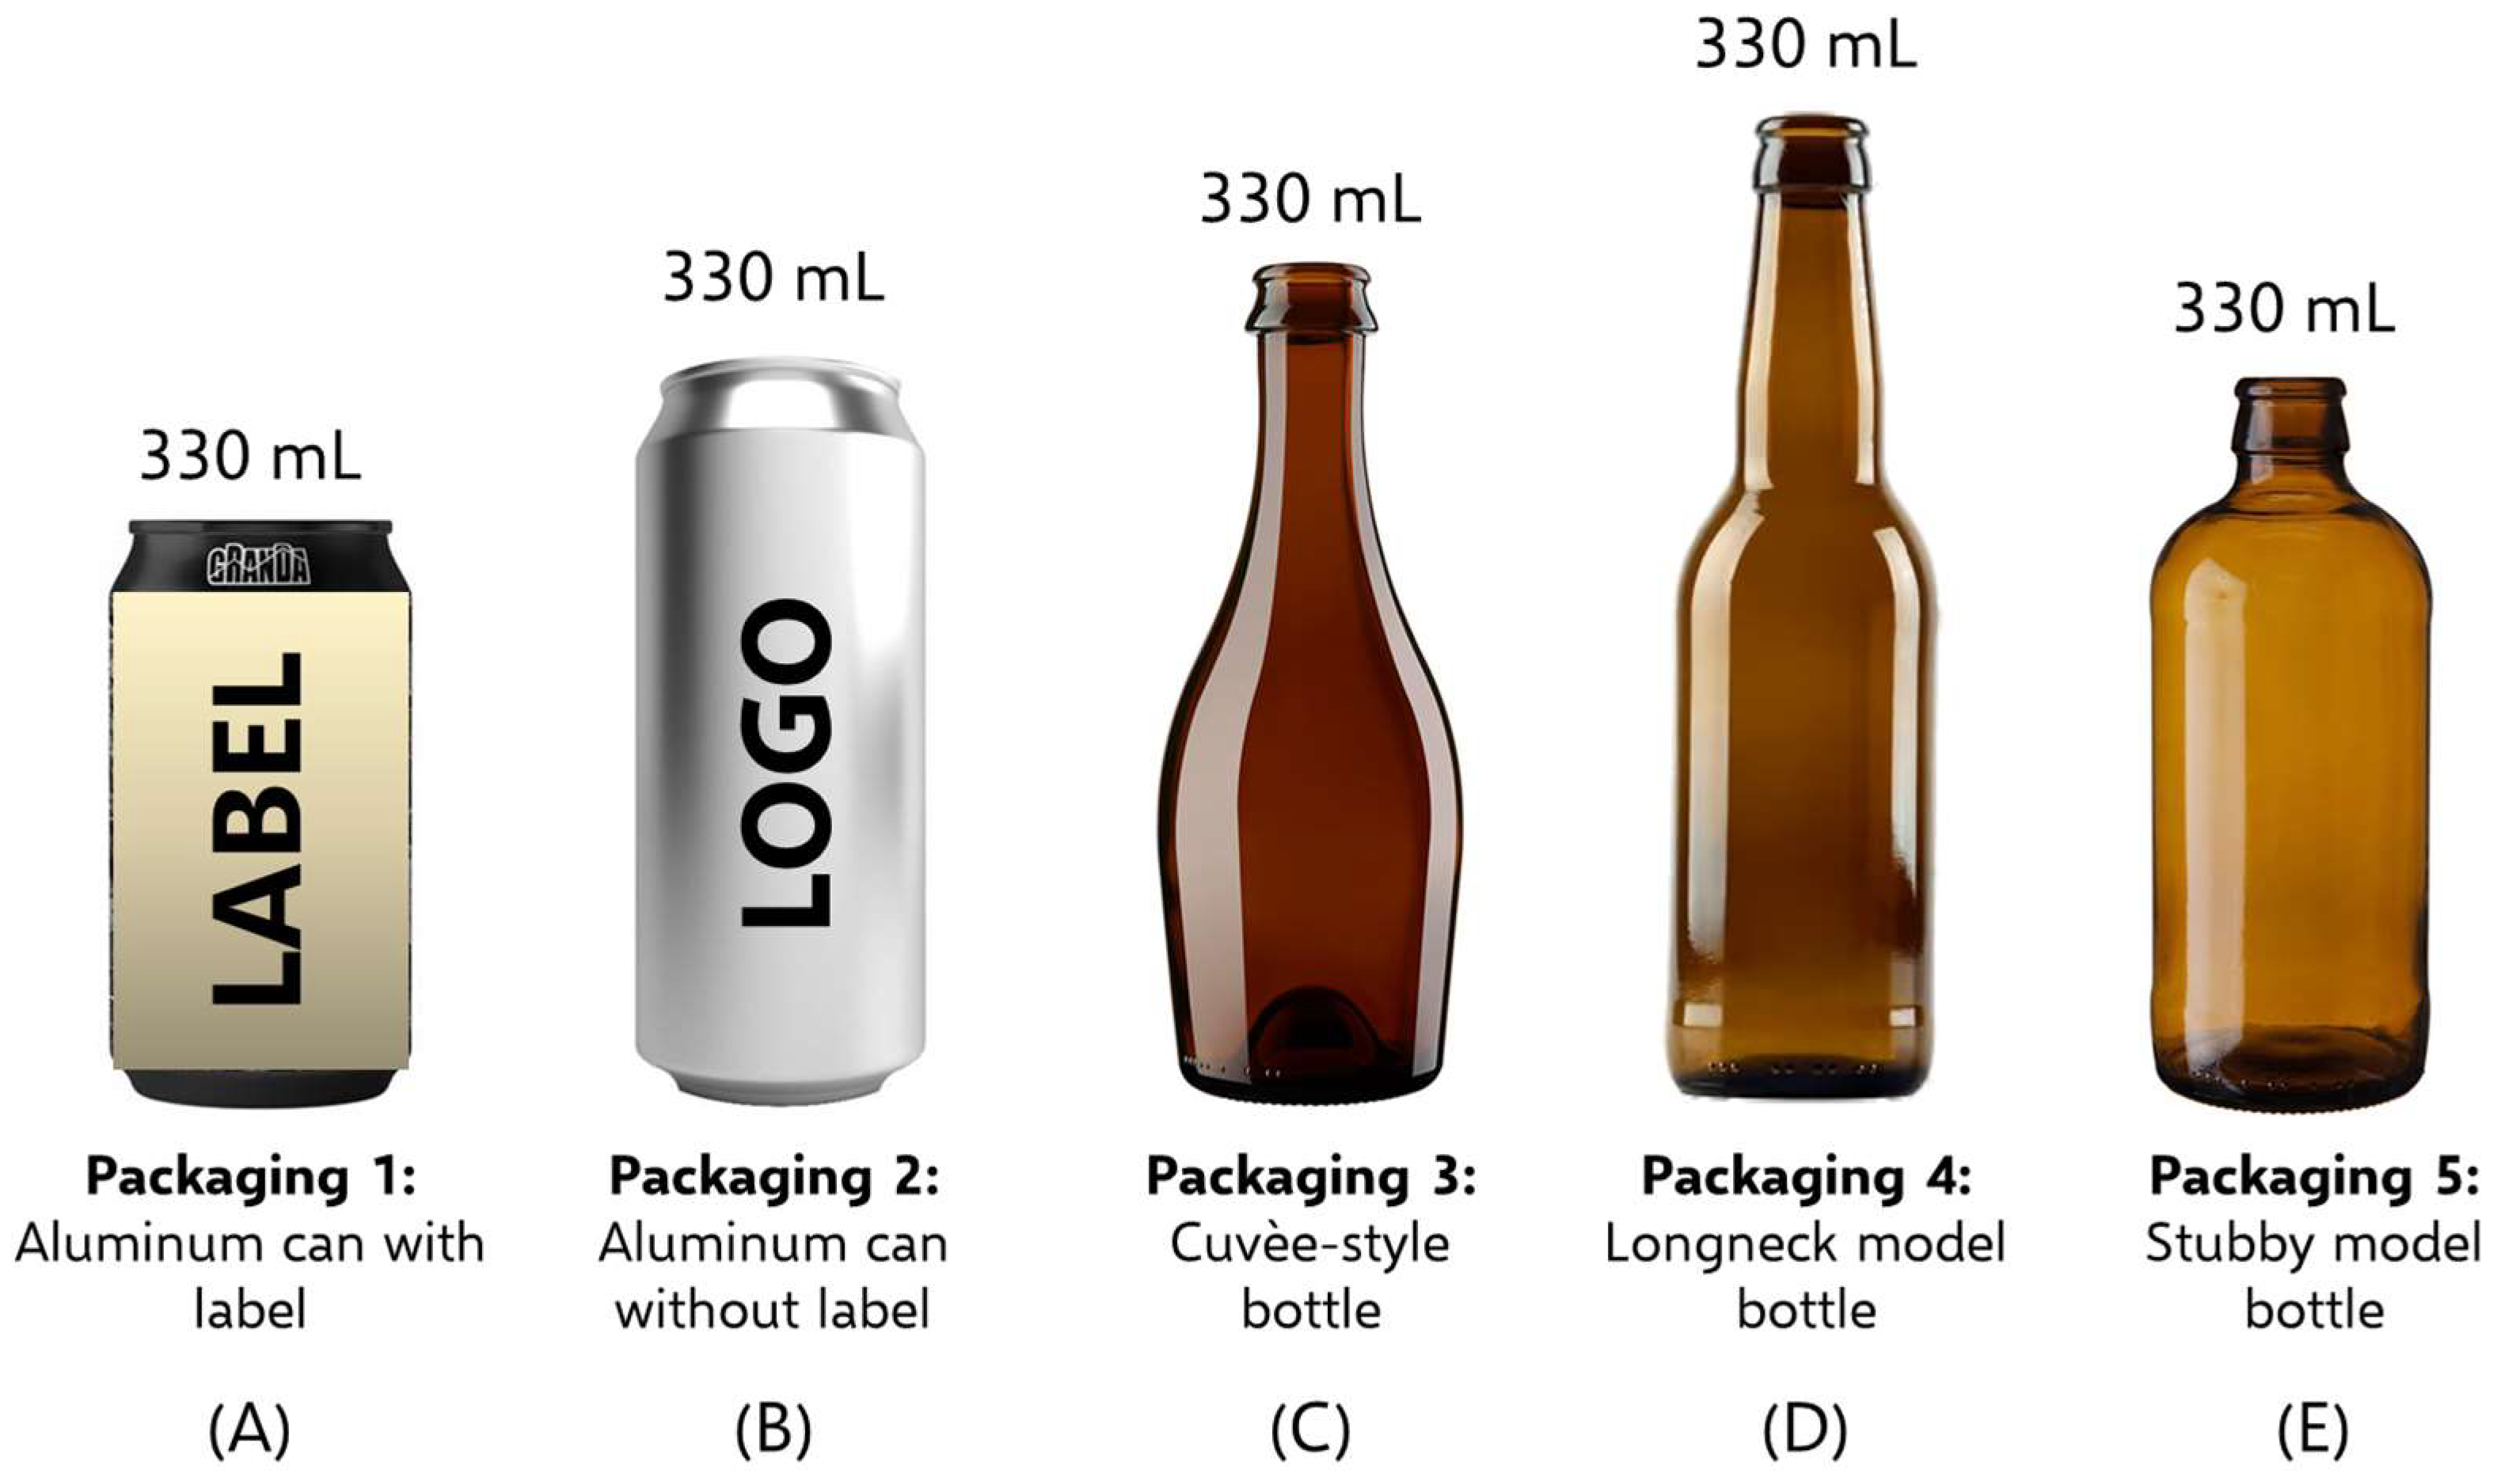
  • Packaging 1: A single-color black aluminum can with a label printed and pasted by the manufacturer itself was considered (Figure 5A), with a total weight of ~15.7 g;
  • Packaging 2: An aluminum can was considered without a label, but with the manufacturer’s logo printed on it, which was blacked out for reasons of commercial confidentiality and brand protection (Figure 5B). The total weight is ~13.3 g;
  • Packaging 3: A dark blue “Cuvèe-style” bottle was considered, i.e., a thick glass bottle with a long neck and convex body, an example prototype of which is shown in Figure 5C, weighing ~253.4 g, commonly used in the craft beer industry;
  • Packaging 4: A traditional “longneck” bottle, i.e., a disposable amber glass bottle, characterized by a long neck and sleek silhouette (an example prototype of which is shown in Figure 5D), weighing ~196.0 g, was considered;
  • Packaging 5: A “stubby” bottle was considered, i.e., an amber glass bottle with a compact shape, wide body, and short neck (of which an example prototype is shown in Figure 5E), weighing ~221.3 g.
These five packaging options were selected because they represent the formats most commonly used in the brewing industry, both artisanal and industrial, and are those that were actually available and retrievable during the data collection phase. The choice thus reflects both a logic of market representativeness and an operational concreteness related to direct experience and packaging options realistically adoptable by the brewery analyzed.
Table 2. Description, characteristics, and weights of the packaging considered.
MaterialBody (g)Label (g)Cap (g)Total WeightDescription
Packaging 1Aluminium14.4341.257Not present15.691Single-color aluminum can, label pasted on
Packaging 2Aluminium13.281Not presentNot present13.281Patterned aluminum can, no label
Packaging 3Glass250.181.072.18253.430“Cuvèe-style” bottle, 0.33 L, in disposable dark glass
Packaging 4Glass192.631.012.29195.930“Longneck” model bottle, 0.33 L, in disposable amber glass
Packaging 5Glass218.670.881.78221.330“Stubby” model bottle, 0.33 L, in disposable amber glass
It is important to note that this study did not explicitly include the scenario of beer distribution via draught systems (on-tap), which would eliminate or significantly reduce the environmental impacts associated with single-use packaging. Previous studies [18,22] have shown that draught beer can lower the GWP and overall environmental impacts per liter consumed, especially when using reusable kegs and efficient reverse logistics. Regardless, the sustainability of 1 L of bulk beer is considered in the first part of the analysis, without considering specific packaging impacts, which can be interpreted as a comparable assessment to beer sold on tap, except possibly considering the marginal impact related to keg logistics.

4. Results and Discussion

4.1. Life Cycle Assessment

LCA results are expressed in Table 3 (Quantity) and Table 4 (% Contribution). First, what emerges from the LCA is that the greatest impacts associated with the production of the beer under study concern GWP (0.916 kg CO2 eq/L), TEC (0.404 kg 1.4 DCB eq/L), LU (0.841 m2a crop eq/L), and FRS (0.211 kg oil eq/L), all with values above 0.1, compared to the other values which are mostly between 0.0001 and 0.012. Regarding GWP, the most relevant contribution comes from malt production, which accounts for 30%, and from hop transportation (around 25%). Concerning hops, transportation from Germany to Italy generates about 0.231 kg CO2 eq/L, due to the long distance covered and the use of diesel-powered road transport, known for high emissions of CO2, NOx, and particulate matter [41]. In any case, the results of this research are more or less in line with those found in the literature, placing themselves mostly in an intermediate range. For example, in the research by McDonagh et al. (2024) [21], the production of a pale ale showed a GWP of 0.7516 kg CO2 eq/L, 17% lower than the value recorded in this study. The results of Marrucci et al. (2024) [22], related to commercial beers produced on a large scale and packaged with different materials, indicate values between 0.6448 and 1.166 kg CO2 eq/L, 30% lower to 27% higher than the value of this research, highlighting how the type of packaging also plays a significant role in the overall balance.
Similarly, Morgan et al. (2021) [19] reported a range of 0.760 to 1.900 kg CO2 eq/L for Welsh microbreweries, with this study’s result falling +20% above the lower end and −52% below the upper end of that interval. The data from this study fall in the central range of that interval. Cimini and Moresi (2016) [18] also, analyzing beer packaged in 33 cL bottles and 30 L kegs, estimated a GWP of 0.25–0.74 kg CO2 eq/L, indicating a value 22–73% lower than this research, likely due to a different energy and supply mix compared to that of an electric craft plant. Finally, Sipperly et al. (2014) [17] reported an extremely low value (0.09152 kg CO2 eq/L), which is approximately 90% lower than the result of our study, for a high-efficiency production, while Lalonde et al. (2013) [26] estimated a higher value of 3.296 kg CO2 eq/L, which is about 3.5 times higher than the result of our research. However, as already mentioned, it is important to underline that the various studies differ methodologically, which often makes it difficult to uniformly compare the results obtained. Differences in the choice of system boundaries, materials, and packaging, as well as the electricity mixes of different countries and the type of beer considered, significantly influence the impacts calculated. These elements, although consistent with the specific aims of each work, introduce significant structural heterogeneity in LCA models, directly influencing the final results and making it necessary to interpret the data within their specific methodological context. For example, previous studies [18,19,22] have shown that the GWP of brewing can vary by ±20–40% depending on the inclusion or exclusion of upstream emissions (e.g., barley fertilizer production), differences in the mix of power grids (composed more or less of renewable and nonrenewable sources), or packaging choices. In some cases, categories such as LU and FRS can vary even more, with fluctuations of up to ±50%, especially when local agricultural practices or irrigation requirements differ significantly [24]. In the context of this study, recognizing these sensitivity ranges is essential to frame the results within a realistic range of uncertainty. For example, the GWP value of 0.92 kg CO2 eq/L reported here could realistically fluctuate between 0.7 and 1.2 kg CO2 eq/L depending on variations in hop transport distances, electricity sources used during brewing, and allocation methods applied to co-products such as spent grains. Such variability, however, does not affect the validity of the hop management system.
Regarding TEC instead, the hemp beer production analyzed in this study generates about 0.404 kg 1.4-DCB eq, of which about 55% is attributable to hop transport, while a further 30% derives from malt production. On the one hand, as also highlighted by Borrion et al. (2012) [42] and Jourdaine et al. (2020) [43], terrestrial ecotoxicity is strongly influenced by emissions of pesticides and fertilizers containing heavy metals used in agricultural cultivation, particularly in the production of barley for malting. These substances, released into the soil during the agricultural phase, are indirectly reflected in the mashing phase, as they are associated with the use of malt. On the other hand, the long-distance transport of hops, from Germany to the brewery, also significantly contributes to terrestrial toxicity, as well as to GWP, due to direct vehicle emissions. In particular, NOx released by diesel engines contributes both to soil acidification and terrestrial toxicity, while fine particles (PM10) and volatile organic compounds (VOCs) can deposit in soils or bind to existing pollutants, contaminating terrestrial and aquatic ecosystems [44,45].
Finally, among the most significant impact categories are also land use and fossil resource scarcity, with values of 0.841 m2a crop eq/L and 0.211 kg oil eq/L, respectively. In both cases, the phases most responsible are malt, corn, and hemp production and hop transport. The value of 0.841 m2a crop eq/L indicates that, for every liter of beer produced, the equivalent of 0.841 m2 of cultivated land is needed for an entire year. Of this surface, almost all is attributable to malt and corn production, while hemp accounts for about 4%.
Regarding FRS, 40% of the impact is linked to the mashing phase, mainly due to the electricity consumption required for heating, while about 35% is attributable to hop transport. The latter, coming from long distances (about 1000 km), has a major impact on fossil fuel consumption, especially when transported by diesel-powered vehicles. Overall, the analysis thus highlights how the critical points in the life cycle are definitely barley malt production and transportation, suggesting how local sourcing strategies, energy optimization, and input selection could help further reduce the environmental impact of the product.

4.2. Scenario Analysis

Once the main hotspots and environmental impacts associated with brewing were considered, it was chosen to consider another functional unit, namely 1 unit of 33 cL, including packaging. The results of the scenario analysis, with which an assessment of environmental prices was associated, are shown in Table 5. The objective of the latter analysis was to identify the environmental surcharge that each type of packaging entails, i.e., the economic value of the environmental damage associated with the production of the packaging, expressed in €/unit. In other words, how much it would cost to avoid, compensate, or repair the damage caused by the production of a good. This approach makes it possible to quantify in monetary terms the environmental externalities associated with beer production, including packaging, and, as a result, to support more conscious and sustainable choices for both producers and consumers.
In more detail, the analysis shows that choosing a decorated can (Packaging 2) might be the most environmentally sustainable choice, given, among the five packaging, it presents the lowest results in 16 out of 18 impact categories, except for ionizing radiation, and water consumption. These include a GWP of 0.449 kg CO2 eq/33 cL, SOD of 5.57 × 10⁻⁷ kg CFC11 eq/33 cl, 8.91 × 10⁻⁵ kg PM2.5 eq/33 cl, and 6.28 × 10⁻⁵ kg P eq/33 cL.
The other aluminum format (Packaging 1) shows very similar environmental performance to Packaging 2, but with slightly higher data in almost all impact categories. This can be attributed to both the higher weight and the presence of the label, which introduces an additional plastic or paper component, with energy and emission impacts in the production and printing phase [46] as well as related to the disposal phase, which may compromise the full recyclability of the container, since it requires separation. In fact, aluminum is highly recyclable and requires less energy to be remelted than primary production [47]. However, the adhesive label can reduce the purity of the material in the recycling process if not properly removed or if it hinders recognition in automatic separation systems [48]. Additionally, the recyclability of Packaging 1 may differ from Packaging 2 due not only to the label but also to potential differences in collection and sorting rates. Packaging without labels (Packaging 2) is generally easier to process in recycling streams, resulting in a higher effective recycling rate and better quality of secondary aluminum. In contrast, labeled cans may require additional processing steps, increasing costs and the risk of downcycling or material losses in the recycling phase [49]. These factors underline the importance of considering the end-of-life stage in the overall environmental evaluation of packaging types, as small differences in design and material combinations can lead to notable differences in circularity potential and effective environmental performance. The main differences compared to Packaging 2 are found, for example, in GWP (0.465 for Packaging 1 vs. 0.449 kg CO2 eq for Packaging 2), FPMF (9.23 × 10⁻⁵ for Packaging 1 vs. 8.91 × 10⁻⁵ for Packaging 2), FRS (0.109 for Packaging 1 vs. 0.105 kg oil eq for Packaging 2), and WC (1.474 for Packaging 1 vs. 1.358 m3 for Packaging 2). However, between Packaging 1 and Packaging 2, the % difference is in the range of 1–8% less, and the values, for both types, among the lowest in the overall comparison, still making this format very environmentally efficient. In contrast, the “Cuvée-style” bottle (Packaging 3) shows the worst environmental profile, with higher impacts than the other forms of packaging in 16 out of 18 impact categories, mainly due to the higher weight of glass, energy consumption for production, and transportation. Considering the absolute data, for example, it shows a global warming of 0.717 kg CO2 eq, fine particulate matter formation of 5.54 × 10⁻⁴ kg PM2.5 eq, human non-carcinogenic toxicity of 7.43 × 10⁻³ kg 1.4-DCB, land use of 0.329 m2a crop eq, and fossil resource scarcity of 0.172 kg oil eq. Compared with Packaging 2, it finally shows values that could reach 1.01 (MEP) to 6.21 (FMPM) times higher. Longneck and stubby bottles are in an intermediate range, showing higher impacts than cans but lower than the cuvee-style bottle. Overall, the results suggest that for the same content, the choice of container can significantly influence the overall environmental footprint of the beer, making packaging an equally important element in the product’s sustainability strategy. Thus, Packaging 2 represents the most environmentally sustainable solution, while Packaging 3 performs the least. Longneck and stubby bottles offer intermediate results, with a lower environmental impact than champaign but higher than cans.
Now, considering instead the monetization of impacts, a particularly interesting finding is that if the environmental price associated with the production of a 33 cL beer was considered, the results would vary with respect to environmental impacts. There is no single correct way to assign a price to environmental damages because they depend on different assumptions and value choices. For this reason, each impact category is accompanied by three different estimates: central, the reference value, i.e., the most likely and most balanced estimate according to the method adopted; lower, a more conservative or conservative estimate, i.e., the minimum plausible monetary damage, for example, considering a less severe impact or a lower economic value of the damage; and finally upper, which is a more severe estimate, i.e., the plausible maximum of the damage, for example, assuming a longer lasting impact or higher value for the environmental loss.
These ranges were determined by varying key parameters such as the discount rate (e.g., 1% vs. 3%), the time horizon of damage persistence (e.g., 20 years vs. 100 years), and the valuation approach adopted (avoided cost, damage cost, or willingness-to-pay methods). For instance, higher societal valuations of health impacts or ecosystem damages result in higher marginal prices per unit emitted, reflected in the upper value, while lower valuations or shorter time horizons result in the lower value. This tiered approach helps capture the uncertainty and variability inherent in the monetization of environmental impacts and allows stakeholders to interpret the results under different risk and value assumptions. It also emphasizes that environmental pricing is not purely a technical exercise but intersects with societal preferences and policy priorities, thereby providing a more comprehensive understanding of the potential economic significance of environmental impacts alongside their physical measurements. The results of this analysis are reported in Figure 6. Central values show that aluminum cans (Packaging 1 and 2) generate the highest environmental cost, at €0.88 and €0.83 per beer, respectively. This finding, although in apparent contrast to the ReCiPe MidPoint results found for these formats, can be explained by the fact that aluminum is associated with higher monetary values per unit of environmental impact, particularly for categories related to water depletion.
In contrast, single-use glass formats, such as the Cuvée-style bottle (Packaging 3), longneck (Packaging 4), and stubby (Packaging 5), while showing higher physical impacts in many categories, record environmental costs, ranging from €0.38 to €0.42, and thus lower than aluminum packaging.
Packaging 3, despite being the most environmentally impactful in physical terms, exhibits a monetized environmental cost that is over 50% lower than that of aluminum packaging. These results, which might seem paradoxical given that they contrast with the ReCiPe MidPoint assessment, highlight how the monetization of environmental impacts is not always directly proportional to physical values, but strongly depends on the economic value attributed to different types of environmental damage.
In fact, a higher environmental impact does not always correspond to an equally high monetary cost, as some impact categories have a higher environmental price than others. In this case, for example, the higher water consumption for Packaging 1 and 2 accounts for more than 75% of their environmental cost, equivalent to about €0.60–1.20 out of the total €0.80–1.60/unit environmental additional cost. This explains why more technically efficient packaging may be less beneficial from an economic–environmental point of view. Therefore, the two analyses are not conflicting but complementary. In this study, for example, the can was found to be less impactful physically, but more costly from a monetary environmental point of view because of its high water consumption and its value in the environmental pricing system.
Therefore, the choice of packaging should require an intelligent balancing point through an integrated approach to sustainable design, taking into account both environmental impacts and their social and economic burden. However, what is interesting to note is that if one were to consider the environmental price per unit of packaged beer, the differences between packaging formats would result in a real hidden economic overhead. For example, a simple can could generate a potential environmental cost of more than +€0.80/1.60 per unit, while a heavier glass bottle, while being more impactful in terms of physical quantities, may result in a much lower monetary penalty. For example, considering a price of 3.50€/beer, if environmental prices were taken into account, it could come to cost 4.30–5.10 €, 22–45% more. This figure, when read in systemic terms, opens a broader reflection according to which, real environmental costs are today not borne by producers or consumers directly, but are passed on to the community in the form of environmental and social externalities. There are thus invisible costs that, while not accounted for in market prices, burden the entire social and ecological system.
Consequently, the monetary valuation of environmental damages should go far beyond the simple quantification of emissions, while integrating this approach into LCAs would allow to return a more complete and concrete representation of the real impacts of production choices, and offer an opportunity to rethink product policies, consumption patterns, and responsibilities throughout the supply chain.

5. Conclusions

In this study, the environmental compatibility of hemp craft beer production was assessed using the life cycle assessment (LCA) methodology, integrating the evaluation with the monetization of environmental impacts. The results showed that the most significant impacts associated with beer production concern global warming potential (GWP, 0.916 kg CO2 eq/L), terrestrial ecotoxicity (TEC, 0.404 kg 1.4 DCB eq/L), land use (LU, 0.841 m2a crop eq/L), and fossil resource scarcity (FRS, 0.211 kg oil eq/L), all with values above 0.1, compared to the other impact categories, which mostly fall between 0.0001 and 0.012.
The most relevant contributions to these impacts come from malt production and hop transport, especially when hops are sourced from non-European countries such as the United States. While it is reasonable to expect that sourcing from closer regions (e.g., domestic Italian production) could reduce transport-related environmental impacts, it is important to note that a short supply chain is not always a feasible solution for breweries.
Firstly, Italian hop availability is still limited, as it is an emerging and fragmented sector which often fails to guarantee the variety, quantity, and quality required by growing craft breweries. Moreover, many brewers intentionally choose specific foreign hops for organoleptic reasons linked to the beer style being produced. This makes geographic origin a variable that is not always easily optimizable from an environmental standpoint.
Therefore, the beer supply chain faces structural constraints, which could be partially mitigated through internal measures, such as energy efficiency, lighter packaging, and similar strategies.
In parallel, the analysis of different packaging formats revealed that, from a physical environmental impact perspective, aluminum cans are the most efficient option. However, when environmental impact monetization is taken into account, single-use glass bottles in the Cuvée-style format emerge as the most favorable option. This is because environmental damage is not always proportional to the quantity of emissions, but rather depends on the economic value assigned to each type of impact.
The discrepancy between physical and monetary results highlights the importance of adopting an integrated, multi-criteria approach, which also considers the economic and social relevance of impacts. In fact, if the environmental cost were internalized into the product price, a can could result in a theoretical surcharge of +€0.80 to €1.60 per unit, while a heavier glass bottle would entail a lower additional environmental cost.
Overall, when considering impact monetization, a beer sold at €3.50 would correspond to a real price between €4.30 and €5.10, representing a 22–45% increase.
In this context, end-of-life packaging management becomes particularly relevant, especially considering that both aluminum and glass are highly recyclable materials and can be potentially integrated into a circular economy framework. The ability to close the material loop and reduce reliance on virgin raw materials is indeed a key factor in mitigating overall environmental impacts. However, the actual benefits of recycling depend on several variables, such as the efficiency of collection and treatment systems, the quality of the recovered material, and the effective recycling rate at the national or local scale. Therefore, to maximize the environmental potential of recyclable packaging, it is important that public policies, producers, and consumers align towards virtuous systems of separate waste collection, technologically advanced infrastructure, and consistent behavioral practices, so that the theoretical benefits of recycling can translate into tangible environmental and social gains. A particularly effective example is the implementation of deposit refund schemes already active in some European countries, such as Belgium and Germany, where consumers pay a deposit at the time of purchase, which is refunded upon returning the empty packaging. These systems enable very high return and reuse rates, promoting a reuse economy and high-quality recycling, and demonstrate how extended producer responsibility instruments can significantly contribute to the sector’s sustainability. In Italy, this system is still not widely adopted and should be strongly encouraged, although local pilot initiatives and increasing regulatory pressure at the EU level, especially in light of circular economy and packaging waste directives, are pushing towards its broader implementation.
In conclusion, the results of this study suggest that in order to make beer consumption truly sustainable, there is no single optimal choice. Instead, it would be ideal to implement a set of strategic decisions, including the optimization of supply chains, the selection of packaging with low environmental and monetary impacts, and the careful choice of suppliers, wherever feasible.

Author Contributions

Conceptualization, G.V., L.M. and M.R.; methodology, G.V.; software, G.V. and M.R.; validation, M.S. and L.M.; formal analysis, L.M.; investigation, L.M. and M.R.; resources, G.V. and M.R.; data curation, G.V.; writing—original draft preparation, M.R., L.M. and M.S.; writing—review and editing, M.R., L.M. and M.S.; visualization, G.V.; supervision, G.V.; project administration, G.V. and M.R.; funding acquisition, G.V. and M.R. All authors have read and agreed to the published version of the manuscript.

Funding

This research received no external funding.

Institutional Review Board Statement

Not applicable.

Informed Consent Statement

Not applicable.

Data Availability Statement

The data presented in this study are available on request from the corresponding author.

Conflicts of Interest

The authors declare no conflicts of interest.

Abbreviations

The following abbreviations are used in this manuscript:
GWPGlobal Warming Potential
SODStratospheric Ozone Depletion
IRIonizing Radiation
OFHHOzone Formation Human Health
FPMFFine Particulate Matter Formation
OFTEOzone Formation Terrestrial Ecotoxicity
TAPTerrestrial Acidification
FEPFreshwater Eutrophication
MEPMarine Eutrophication
TECTerrestrial Ecotoxicity
FECFreshwater Ecotoxicity
MECMarine Ecotoxicity
HCTHuman Carcinogenic Toxicity
HNCTHuman Non-Carcinogenic Toxicity
LULand Use
MRSMineral Resource Scarcity
FRSFossil Resource Scarcity
WCWater Consumption

References

  1. Oliver, G. The Oxford Companion to Beer; Oxford University Press: New York, NY, USA, 2012; ISBN 978-0-19-536713-3. [Google Scholar] [CrossRef]
  2. World Population Review. Alcohol Consumption by Country 2025. 2025. Available online: https://worldpopulationreview.com/country-rankings/alcohol-consumption-by-country (accessed on 7 April 2025).
  3. Gobbi, L.; Stanković, M.; Ruggeri, M.; Savastano, M. Craft beer in food science: A review and conceptual framework. Beverages 2024, 10, 91. [Google Scholar] [CrossRef]
  4. Ramanan, M.; Fox, G.P.; Marco, M.L. Beer for live microbe delivery. J. Funct. Foods 2024, 113, 105987. [Google Scholar] [CrossRef]
  5. Romano, G.; Tufariello, M.; Calabriso, N.; del Coco, L.; Fanizzi, F.P.; Blanco, A.; Carluccio, M.A.; Grieco, F.; Laddomada, B. Pigmented cereals and legume grains as healthier alternatives for brewing beers. Food Biosci. 2023, 52, 102463. [Google Scholar] [CrossRef]
  6. Salanță, L.C.; Coldea, T.E.; Ignat, M.V.; Pop, C.R.; Tofană, M.; Mudura, E.; Borșa, A.; Pasqualone, A.; Zhao, H. Non-Alcoholic and Craft Beer Production and Challenges. Processes 2020, 8, 1382. [Google Scholar] [CrossRef]
  7. Bamforth, C.W.; Fox, G.P. Malting and brewing. In ICC Handbook of 21st Century Cereal Science and Technology; Elsevier Inc.: Amsterdam, The Netherlands, 2023; pp. 363–368. [Google Scholar] [CrossRef]
  8. World Population Review. Beer Consumption by Country 2025. 2025. Available online: https://worldpopulationreview.com/country-rankings/beer-consumption-by-country (accessed on 7 April 2025).
  9. Testa, B.; Coppola, F.; Letizia, F.; Albanese, G.; Karaulli, J.; Ruci, M.; Pistillo, M.; Germinara, G.S.; Messia, M.C.; Succi, M.; et al. Versatility of Saccharomyces cerevisiae 41CM in the Brewery Sector: Use as a Starter for “Ale” and “Lager” Craft Beer Production. Processes 2022, 10, 2495. [Google Scholar] [CrossRef]
  10. Monerawela, C.; Bond, U. Brewing up a storm: The genomes of lager yeasts and how they evolved. Biotechnol. Adv. 2017, 35, 512–519. [Google Scholar] [CrossRef]
  11. Anderson, H.E.; Liden, T.; Berger, B.K.; Zanella, D.; Manh, L.H.; Wang, S.; Schug, K.A. Profiling of contemporary beer styles using liquid chromatography quadrupole time-of-flight mass spectrometry, multivariate analysis, and machine learning techniques. Anal. Chim. Acta 2021, 1172, 338668. [Google Scholar] [CrossRef]
  12. Smithers, G.W. Alcoholic Beverages. In Encyclopedia of Food Safety, 2nd ed.; Elsevier Inc.: Amsterdam, The Netherlands, 2024; Volume 1-4, pp. 176–186. [Google Scholar] [CrossRef]
  13. Faganel, A.; Rižnar, I. The Growth in Demand for Craft Beer and the Proliferation of Microbreweries in Slovenia. Beverages 2023, 9, 86. [Google Scholar] [CrossRef]
  14. Brewers Association. Brewers Association Releases Annual Craft Brewing Industry Production Report and Top 50 Producing Craft Brewing Companies for 2023. 2024. Available online: https://www.brewersassociation.org/association-news/brewers-association-releases-annual-craft-brewing-industry-production-report-and-top-50-producing-craft-brewing-companies-for-2023/ (accessed on 7 April 2025).
  15. MASE. Strategia Nazionale per L’economia Circolare. 2022. Available online: https://www.mase.gov.it/sites/default/files/archivio/allegati/PNRR/SEC_21.06.22.pdf (accessed on 7 April 2025).
  16. Coldiretti. Consumi: Triplica la Birra Made in Italy, è il Record del Decennio. 2023. Available online: https://www.coldiretti.it/consumi/consumi-triplica-la-birra-made-in-italy-e-il-record-del-decennio (accessed on 7 April 2025).
  17. Sipperly, E.; Edinger, K.; Ziegler, N.; Roberts, E. Comparative Cradle to Gate Life Cycle Assessment of 100% Barley-based Singha Lager Beer in Thailand. King Mongkut’s University of Technology: Bangkok, Thailand, 2014. [Google Scholar]
  18. Cimini, A.; Moresi, M. Carbon footprint of a pale lager packed in different formats: Assessment and sensitivity analysis based on transparent data. J. Clean. Prod. 2016, 112, 4196–4213. [Google Scholar] [CrossRef]
  19. Morgan, D.R.; Styles, D.; Lane, E.T. Thirsty work: Assessing the environmental footprint of craft beer. Sustain. Prod. Consum. 2021, 27, 242–253. [Google Scholar] [CrossRef]
  20. Salazar Tijerino, M.B.; San Martín-González, M.F.; Velasquez Domingo, J.A.; Huang, J.-Y. Life Cycle Assessment of Craft Beer Brewing at Different Scales on a Unit Operation Basis. Sustainability 2023, 15, 11416. [Google Scholar] [CrossRef]
  21. McDonagh, K.; Zhang, R.; Merkouri, L.P.; Arnell, M.; Hepworth, A.; Duyar, M.; Short, M. Lowering the carbon footprint of beer through waste breadcrumb substitution for malted barley: Life cycle assessment and experimental study. Clean. Environ. Syst. 2024, 15, 100241. [Google Scholar] [CrossRef]
  22. Marrucci, L.; Daddi, T.; Iraldo, F. Identifying the most sustainable beer packaging through a Life Cycle Assessment. Sci. Total Environ. 2024, 948, 174941. [Google Scholar] [CrossRef]
  23. de Sadeleer, I.; Lyng, K.A. A Life Cycle Assessment on Single-Use and Reuse Beer Cups at Festivals. Circ. Econ. Sust. 2022, 2, 1517–1539. [Google Scholar] [CrossRef]
  24. Rajaniemi, M.; Mikkola, H.; Ahokas, J. Greenhouse Gas Emissions from Oats, Barley, Wheat and Rye Production. Agron. Res. 2011, 9, 189–195. [Google Scholar]
  25. D’Ascenzo, F.; Vinci, G.; Maddaloni, L.; Ruggeri, M.; Savastano, M. Application of Life Cycle Assessment in Beer Production: Systematic Review. Beverages 2024, 10, 86. [Google Scholar] [CrossRef]
  26. Lalonde, S.; Nicholson, A.; Schenck, R. Life Cycle Assessment of Beer in Support of an Environmental Product Declaration. Read. 2013. Available online: https://www.readkong.com/page/life-cycle-assessment-of-beer-in-support-of-an-2212961 (accessed on 4 April 2025).
  27. European Commission. Hemp Production in the EU. 2025. Available online: https://agriculture.ec.europa.eu/farming/crop-productions-and-plant-based-products/hemp_en (accessed on 1 July 2025).
  28. Michels, M.; Brinkmann, A.; Mußhoff, O. Economic, Ecological and Social Perspectives of Industrial Hemp Cultivation in Germany: A Qualitative Analysis. J. Environ. Manag. 2025, 389, 126117. [Google Scholar] [CrossRef]
  29. Regulation (EU) No 1307/2013 of the European Parliament and of the Council of 17 December 2013 Establishing Rules for Direct Payments to Farmers Under Support Schemes Within the Framework of the Common Agricultural Policy and Repealing Council Regulation (EC) No 637/2008 and Council Regulation (EC) No 73/2009. Available online: https://eur-lex.europa.eu/eli/reg/2013/1307/oj/eng (accessed on 1 July 2025).
  30. LEGGE. Disposizioni per la Promozione Della Coltivazione e Della Filiera Agroindustriale Della Canapa. (16G00258) (GU Serie Generale n.304 del 30-12-2016). 2 Dicembre 2016, n. 242. Available online: https://www.gazzettaufficiale.it/eli/id/2016/12/30/16G00258/sg (accessed on 1 July 2025).
  31. U.S. Department of Agriculture (USDA). The American Relief Act. 2025. Available online: https://www.fsa.usda.gov/tools/informational/farm-bill (accessed on 1 July 2025).
  32. Ahmed, A.T.M.F.; Islam, M.Z.; Mahmud, M.S.; Sarker, M.E.; Islam, M.R. Hemp as a potential raw material toward a sustainable world: A review. Heliyon 2022, 8, e08753. [Google Scholar] [CrossRef]
  33. Nissen, L.; Casciano, F.; Gianotti, A.; Babini, E. Industrial hemp foods and beverages and product properties. In Industrial Hemp: Food and Nutraceutical Applications; Elsevier Inc.: Amsterdam, The Netherlands, 2022; pp. 219–246. [Google Scholar] [CrossRef]
  34. ISO 14040; Environmental Management—Life Cycle Assessment—Principle and Framework. International Organisation for Standardisation (ISO): Geneva, Switzerland, 2006. Available online: https://www.iso.org/standard/37456.html (accessed on 9 April 2025).
  35. ISO 14044; Environmental Management—Life Cycle Assessment—Requirements and Guidelines. International Organisation for Standardisation (ISO): Geneva, Switzerland, 2006. Available online: https://www.iso.org/standard/38498.html (accessed on 9 April 2025).
  36. Wild, P. Recommendations for a Future Global CO2-Calculation Standard for Transport and Logistics. Transp. Res. Part D Transp. Environ. 2021, 100, 103024. [Google Scholar] [CrossRef]
  37. ISO 14083:2023; Greenhouse Gases—Quantification and Reporting of Greenhouse Gas Emissions Arising from Transport Chain Operations. International Organisation for Standardisation (ISO): Geneva, Switzerland, 2023. Available online: https://www.iso.org/standard/78864.html (accessed on 2 July 2025).
  38. Huijbregts, M.A.J.; Steinmann, Z.J.N.; Elshout, P.M.F.; Stam, G.; Verones, F.; Vieira, M.; Zijp, M.; van Zelm, R. ReCiPe2016: A harmonised life cycle impact assessment method at midpoint and endpoint level. Int. J. Life Cycle Assess. 2017, 22, 138–147. [Google Scholar] [CrossRef]
  39. de Vries, J.; de Bruyn, S.; Boerdijk, S.; Juijn, D.; Bijleveld, M.; van der Giesen, C.; Korteland, M.; Odenhoven, N.; van Santen, W.; Pápai, S. Environmental Prices Handbook 2024: EU Version. November 2024. Available online: https://cedelft.eu/publications/environmental-prices-handbook-2024-eu27-version/ (accessed on 9 April 2025).
  40. Lim, C.H.; Bok, C.H.; Ngan, S.L.; How, B.S.; Ng, W.P.Q.; Lam, H.L. Evaluation of Sustainable Palm Oil Production Certification via LCA. In Encyclopedia of Sustainable Technologies, 2nd ed.; Elsevier Inc.: Amsterdam, The Netherlands, 2024; pp. 323–337. [Google Scholar] [CrossRef]
  41. Pal, P.; Gopal, P.R.C.; Ramkumar, M. Impact of transportation on climate change: An ecological modernization theoretical perspective. Transp. Policy 2023, 130, 167–183. [Google Scholar] [CrossRef]
  42. Borrion, A.L.; Khraisheh, M.; Benyahia, F. Environmental life cycle impact assessment of Gas-to-Liquid processes. In Proceedings of the 3rd Gas Processing Symposium, Doha, Qatar, 5–7 March 2012; Elsevier Inc.: Amsterdam, The Netherlands, 2012; pp. 71–77. [Google Scholar] [CrossRef]
  43. Jourdaine, M.; Loubet, P.; Trebucq, S.; Sonnemann, G. A detailed quantitative comparison of the life cycle assessment of bottled wines using an original harmonization procedure. J. Clean. Prod. 2020, 250, 119472. [Google Scholar] [CrossRef]
  44. Hawrot-Paw, M.; Koniuszy, A.; Zając, G.; Szyszlak-Bargłowicz, J. Ecotoxicity of soil contaminated with diesel fuel and biodiesel. Sci. Rep. 2020, 10, 16436. [Google Scholar] [CrossRef] [PubMed]
  45. Pongboriboon, N.; Mariyappan, V.; Wu, W.; Chandra-Ambhorn, W. Economic and environmental analyses for achieving net-zero CO2 emissions of a green diesel production process. J. Taiwan Inst. Chem. Eng. 2024, 165, 105781. [Google Scholar] [CrossRef]
  46. Liang, Z.; Deng, H.; Xie, H.; Chen, B.; Sun, M.; Wang, Y. Rethinking the paper product carbon footprint accounting standard from a life-cycle perspective. J. Clean. Prod. 2023, 393, 136352. [Google Scholar] [CrossRef]
  47. Al-Alimi, S.; Yusuf, N.K.; Ghaleb, A.M.; Lajis, M.A.; Shamsudin, S.; Zhou, W.; Altharan, Y.M.; Abdulwahab, H.S.; Saif, Y.; Didane, D.H.; et al. Recycling aluminium for sustainable development: A review of different processing technologies in green manufacturing. Results Eng. 2024, 23, 102566. [Google Scholar] [CrossRef]
  48. The Aluminium Association. Aluminum Container Design Guide Outlines Four Keys to Circular Recycling. 2020. Available online: https://www.aluminum.org/news/aluminum-container-design-guide-outlines-four-keys-circular-recycling (accessed on 16 April 2025).
  49. Nuss, P.; Eckelman, M.J. Life Cycle Assessment of Metals: A Scientific Synthesis. PLoS ONE 2014, 9, e101298. [Google Scholar] [CrossRef]
Figure 1. Distribution of scientific publications on “Life Cycle Assessment AND Beer” (1998–2025 ongoing) (Scopus) (Article title, Abstract, Keywords).
Sustainability 17 06232 g001
Figure 2. Bibliometric network of the keywords resulting from the literature.
Sustainability 17 06232 g002
Figure 3. Geographical distribution of scientific publications on “Life Cycle Assessment AND Beer” (Scopus) (Article title, Abstract, Keywords).
Sustainability 17 06232 g003
Figure 4. System boundaries of beer production considered in this research.
Sustainability 17 06232 g004
Figure 5. Examples of the packaging types considered: (A) Single-color can with sticker label; (B) decorated can without label; (C) “Cuvée-style” bottle; (D) “longneck” bottle; (E) “stubby” bottle. The original bottles analyzed and weighed are equivalent to those shown but were not directly photographed to avoid the spread of commercial logos or other identifying elements.
Sustainability 17 06232 g005
Figure 6. Environmental cost monetization (€ per 0.33 L of beer) across packaging options, showing central (reference), lower (conservative), and upper (precautionary) estimates.
Sustainability 17 06232 g006
Table 3. LCA results (unit).
Impact CategoriesUnitWaterMaizeBarley MaltHempHopYeastCarbon Dioxide,
Liquid
ElectricityInput TransportTotal
Atmospherical effects
GWPkg CO2 eq1.31 × 10−30.020.272.68 × 10−33.54 × 10−32.75 × 10−30.010.370.240.92
SODkg CFC11 eq4.39 × 10−102.09 × 10−71.02 × 10−63.23 × 10−81.74 × 10−81.80 × 10−81.29 × 10−92.11 × 10−78.34 × 10−81.59 × 10⁻⁶
IRkBq Co-60 eq3.71 × 10−42.66 × 10−40.017.45 × 10−58.07 × 10−64.16 × 10−58.16 × 10−40.051.32 × 10−30.06
OFHHkg NOx eq2.75 × 10−61.05 × 10−46.14 × 10−41.65 × 10−51.45 × 10−53.05 × 10−66.12 × 10−66.03 × 10−42.80 × 10−34.16 × 10⁻³
FPMFkg PM2.5 eq7.18 × 10−72.54 × 10−61.32 × 10−41.31 × 10−61.67 × 10−64.17 × 10−71.32 × 10−68.29 × 10−51.30 × 10−52.35 × 10⁻⁴
OFTEkg NOx eq2.76 × 10−61.97 × 10−46.18 × 10−41.65 × 10−51.48 × 10−53.05 × 10−66.14 × 10−66.04 × 10−42.82 × 10−34.28 × 10⁻³
TAPkg SO2 eq4.50 × 10−66.80 × 10−41.13 × 10−36.64 × 10−55.91 × 10−53.57 × 10−51.43 × 10−52.38 × 10−31.22 × 10−30.01
Eutrophication
FEPkg P eq9.00 × 10−79.39 × 10−66.28 × 10−52.53 × 10−62.70 × 10−63.56 × 10−62.48 × 10−69.84 × 10−56.86 × 10−61.89 × 10⁻⁴
MEPkg N eq8.55 × 10−84.76 × 10−58.85 × 10−41.90 × 10−51.02 × 10−58.51 × 10−64.49 × 10−77.19 × 10−62.49 × 10−79.78 × 10⁻⁴
Toxicity
TECkg 1.4-DCB7.92 × 10−50.090.025.02 × 10−52.87 × 10−41.16 × 10−30.030.030.230.40
FEC5.43 × 10−62.55 × 10−33.97 × 10−31.22 × 10−69.79 × 10−62.19 × 10−41.04 × 10−51.43 × 10−45.19 × 10−40.01
MEC2.39 × 10−69.19 × 10−47.10 × 10−43.17 × 10−73.37 × 10−65.48 × 10−53.26 × 10−67.84 × 10−52.47 × 10−42.02 × 10⁻³
HCT3.96 × 10−72.42 × 10−66.44 × 10−51.08 × 10−75.97 × 10−71.02 × 10−71.82 × 10−62.32 × 10−56.68 × 10−47.60 × 10⁻⁴
HNCT4.09 × 10−66.15 × 10−41.06 × 10−35.79 × 10−61.06 × 10−52.75 × 10−43.14 × 10−53.12 × 10−40.010.01
Abiotic resources
LUm2a crop eq1.59 × 10−40.050.740.020.010.011.49 × 10−40.013.28 × 10−30.84
MRSkg Cu eq9.13 × 10−64.86 × 10−50.002.09 × 10−45.54 × 10−63.60 × 10−65.16 × 10−61.43 × 10−45.08 × 10−51.20 × 10−3
FRSkg oil eq3.16 × 10−42.77 × 10−30.044.67 × 10−49.06 × 10−43.01 × 10−41.20 × 10−30.090.080.21
WCm33.52 × 10−33.14 × 10−30.011.22 × 10−55.04 × 10−40.014.66 × 10−59.56 × 10−37.86 × 10−50.03
GWP = global warming potential; SOD = stratospheric ozone depletion; IR = ionizing radiation; OFHH = ozone formation human health; FPMF = fine particulate matter formation; OFTE = ozone formation terrestrial ecotoxicity; TAP = terrestrial acidification; FEP = freshwater eutrophication; MEP = marine eutrophication; TEC = terrestrial ecotoxicity; FEC = freshwater ecotoxicity; MEC = marine ecotoxicity; HCT = human carcinogenic toxicity; HNCT = human non-carcinogenic toxicity; LU = land use; MRS = mineral resource scarcity; FRS = fossil resource scarcity; WC = water consumption.
Table 4. LCA results (%).
Impact
Categories
UnitWaterMaizeBarley MaltHempHopYeastCarbon Dioxide, LiquidElectricityInput TransportTotal
Atmospherical effects
GWPkg CO2 eq0.14%1.99%29.03%0.29%0.39%0.30%1.19%40.67%26.13%100.00%
SODkg CFC11 eq0.03%13.13%63.98%2.03%1.10%1.13%0.08%13.31%5.24%100.00%
IRkBq Co-60 eq0.59%0.43%14.69%0.12%0.01%0.07%1.31%81.27%2.12%100.00%
OFHHkg NOx eq0.07%2.53%14.75%0.40%0.35%0.07%0.15%14.49%67.27%100.00%
FPMFkg PM2.5 eq0.31%1.08%56.16%0.56%0.71%0.18%0.56%35.23%5.52%100.00%
OFTEkg NOx eq0.06%4.59%14.45%0.38%0.35%0.07%0.14%14.11%65.90%100.00%
TAPkg SO2 eq0.08%12.18%20.19%1.19%1.06%0.64%0.26%42.69%21.79%100.00%
Eutrophication
FEPkg P eq0.48%4.97%33.27%1.34%1.43%1.89%1.31%52.14%3.64%100.00%
MEPkg N eq0.01%4.87%90.47%1.94%1.04%0.87%0.05%0.74%0.03%100.00%
Toxicity
TECkg 1.4-DCB0.02%22.71%3.73%0.01%0.07%0.29%7.70%7.69%57.80%100.00%
FEC0.07%34.35%53.49%0.02%0.13%2.95%0.14%1.93%7.00%100.00%
MEC0.12%45.60%35.21%0.02%0.17%2.72%0.16%3.89%12.24%100.00%
HCT0.05%0.32%8.47%0.01%0.08%0.01%0.24%3.06%87.81%100.00%
HNCT0.03%5.06%8.74%0.05%0.09%2.26%0.26%2.56%80.98%100.00%
Abiotic resources
LUm2a crop eq0.02%5.49%88.46%2.86%0.81%0.69%0.02%1.27%0.39%100.00%
MRSkg Cu eq0.76%4.04%61.33%17.33%0.46%0.30%0.43%11.89%4.22%100.00%
FRSkg oil eq0.15%1.31%18.13%0.22%0.43%0.14%0.57%43.57%35.63%100.00%
WCm314.07%12.54%23.28%0.05%2.01%23.40%0.19%38.21%0.31%100.00%
GWP = global warming potential; SOD = stratospheric ozone depletion; IR = ionizing radiation; OFHH = ozone formation human health; FPMF = fine particulate matter formation; OFTE = ozone formation terrestrial ecotoxicity; TAP = terrestrial acidification; FEP = freshwater eutrophication; MEP = marine eutrophication; TEC = terrestrial ecotoxicity; FEC = freshwater ecotoxicity; MEC = marine ecotoxicity; HCT = human carcinogenic toxicity; HNCT = human non-carcinogenic toxicity; LU = land use; MRS = mineral resource scarcity; FRS = fossil resource scarcity; WC = water consumption.
Table 5. Scenario analysis results (data referring to a 33 cL beer packaged in different packaging).
Impact CategoriesUnitPackaging 1—
Aluminium Can with Label
Packaging 2—Aluminium Can Without LaberPackaging 3—Cuvèe-Style BottlePackaging 4—Longneck BottlePackaging 5—Stubby
Atmospherical effects
GWPkg CO2 eq0.4650.4490.7170.6250.664
SODkg CFC11 eq5.62 × 10−75.57 × 10−76.28 × 10−76.04 × 10−76.15 × 10−7
IRkBq Co-60 eq2.27 × 10−22.24 × 10−21.93 × 10−21.97 × 10−21.95 × 10−2
OFHHkg NOx eq1.67 × 10−31.64 × 10−32.50 × 10−32.25 × 10−32.36 × 10−3
FPMFkg PM2.5 eq9.23 × 10−58.91 × 10−55.54 × 10−44.45 × 10−44.94 × 10−4
OFTEkg NOx eq1.72 × 10−31.69 × 10−32.54 × 10−32.29 × 10−32.40 × 10−3
TAPkg SO2 eq2.35 × 10−32.30 × 10−33.90 × 10−33.43 × 10−33.64 × 10−3
Eutrophication
FEPkg P eq6.36 × 10−56.28 × 10−52.44 × 10−42.02 × 10−42.21 × 10−4
MEPkg N eq3.25 × 10−43.24 × 10−43.35 × 10−43.32 × 10−43.33 × 10−4
Toxicity
TECkg 1.4-DCB0.1490.1470.2070.1940.197
FEC2.47 × 10−32.46 × 10−32.98 × 10−32.86 × 10−32.91 × 10−3
MEC6.88 × 10−46.82 × 10−49.19 × 10−48.62 × 10−48.86 × 10−4
HCT3.16 × 10−43.09 × 10−43.95 × 10−43.64 × 10−43.77 × 10−4
HNCT4.36 × 10−34.30 × 10−37.43 × 10−36.75 × 10−36.98 × 10−3
Abiotic resources
LUm2a crop eq0.2790.2780.3290.3180.323
MRSkg Cu eq6.17 × 10−45.92 × 10−41.08 × 10−31.01 × 10−39.80 × 10−4
FRSkg oil eq0.1090.1050.1720.1490.159
WCm31.4741.3580.0170.0160.015
GWP = global warming potential; SOD = stratospheric ozone depletion; IR = ionizing radiation; OFHH = ozone formation human health; FPMF = fine particulate matter formation; OFTE = ozone formation terrestrial ecotoxicity; TAP = terrestrial acidification; FEP = freshwater eutrophication; MEP = marine eutrophication; TEC = terrestrial ecotoxicity; FEC = freshwater ecotoxicity; MEC = marine ecotoxicity; HCT = human carcinogenic toxicity; HNCT = human non-carcinogenic toxicity; LU = land use; MRS = mineral resource scarcity; FRS = fossil resource scarcity; WC = water consumption.
Disclaimer/Publisher’s Note: The statements, opinions and data contained in all publications are solely those of the individual author(s) and contributor(s) and not of MDPI and/or the editor(s). MDPI and/or the editor(s) disclaim responsibility for any injury to people or property resulting from any ideas, methods, instructions or products referred to in the content.

