Article

Sustainable Decision Systems in Green E-Business Models: Pricing and Channel Strategies in Low-Carbon O2O Supply Chains

1
School of Management & Economics, University of Electronic Science & Technology of China, Chengdu 611731, China
2
School of Information & Communication Engineering, University of Electronic Science & Technology of China, Chengdu 611731, China
*
Author to whom correspondence should be addressed.
Sustainability 2025, 17(13), 6231; https://doi.org/10.3390/su17136231
Submission received: 28 May 2025 / Revised: 1 July 2025 / Accepted: 4 July 2025 / Published: 7 July 2025
(This article belongs to the Special Issue Sustainable Information Management and E-Commerce)

Abstract

This paper investigates sustainable decision systems within green E-business models by analyzing how different O2O (online-to-offline) fulfillment structures affect emission-reduction efforts and pricing strategies in a two-tier supply chain consisting of a manufacturer and a new retailer. Three practical sales formats—package self-pickup, nearby delivery, and hybrid—are modeled using Stackelberg game frameworks that incorporate key factors such as inconvenience cost, logistics cost, processing fees, and emission-reduction coefficients. Results show that the manufacturer’s emission-reduction decisions and both parties’ pricing strategies are highly sensitive to cost conditions and consumer preferences. Specifically, higher inconvenience and abatement costs consistently reduce profitability and emission efforts; the hybrid model exhibits threshold-dependent advantages over single-mode strategies in terms of carbon efficiency and economic returns; and consumer green preference and distance sensitivity jointly shape optimal channel configurations. Robustness analysis confirms the model’s stability under varying parameter conditions. These insights provide theoretical and practical guidance for firms seeking to develop adaptive, low-carbon fulfillment strategies that align with sustainability goals and market demands.

1. Introduction

As e-commerce continues to experience rapid expansion, consumer preferences have significantly shifted towards online shopping, promoting the widespread emergence of the O2O (online-to-offline) retail model, which seamlessly integrates digital and physical commerce channels [1]. According to the latest data from China’s National Bureau of Statistics, online retail sales reached 1.403 trillion yuan in 2024, marking a 7.4% increase compared to the previous year [2]. Physical goods accounted for 1.1806 trillion yuan, reflecting a year-on-year growth rate of 6.8%. Prominent Chinese enterprises such as JD.com, Suning, Ele.me, and Meituan have proactively adopted the O2O retail strategy, emphasizing not only convenience but also sustainability through green business practices. Concurrently, the General Office of the State Council explicitly advocated enhancing sustainable interactions between online and offline retail channels in its strategic document, “Guidelines on Promoting Online-Offline Interaction to Accelerate Innovation, Development, and Upgrading of Business and Trade”. Consequently, the O2O retail model, particularly within the framework of sustainable and green e-business models, has received heightened attention from both industry stakeholders aiming for long-term competitive advantages and policymakers striving to foster environmentally responsible economic growth in China.
Meanwhile, in response to intensifying climate challenges and increasing international commitment to carbon neutrality, the transition to a low-carbon economy has become a global imperative [3]. Achieving this goal requires not only technological innovation and greener production but also consumption-side transformations that promote the market penetration of low-carbon products. As frontline agents of consumer interaction, retailers—particularly those operating in O2O models—are well positioned to observe and respond to consumers’ growing preference for eco-friendly products [4], thereby facilitating carbon reduction across the entire supply chain.
However, the commercial promotion and diffusion of low-carbon products within O2O supply chains face several systemic challenges. In particular, multi-channel O2O structures typically involve both self-pickup and delivery fulfillment formats, each with distinct cost structures, service attributes, and carbon footprints. These differences directly affect the pricing, channel decisions, and emission-reduction efforts of upstream manufacturers. Existing studies have recognized that fulfillment structures significantly influence operational cost and carbon emissions [5,6], but few have systematically analyzed how different fulfillment strategies impact green product pricing and carbon-efficiency equilibrium decisions in a dynamic, channel-integrated context.
This study aims to fill this research gap by investigating how different O2O fulfillment formats—package self-pickup, nearby delivery, and hybrid modes—affect upstream manufacturers’ emission-reduction decisions, pricing strategies, and profit outcomes, in collaboration with newly established O2O retailers. We construct a Stackelberg game in which the manufacturer acts as the channel leader and the retailer as a follower. Based on consumer green preference and service-distance sensitivity, we derive closed-form solutions and conduct comparative-static analysis to evaluate how fulfillment structure interacts with carbon-abatement and pricing incentives.
This study seeks to address the following core questions: (1) How do different O2O fulfillment structures influence the manufacturer’s voluntary emission-reduction decisions and pricing strategies? (2) Under what conditions does a hybrid fulfillment mode outperform single-mode strategies in both carbon efficiency and economic returns? (3) How do consumer green preference intensity and distance sensitivity jointly shape the optimal channel configuration and profit distribution?
This study contributes to the literature in the following aspects: (1) We enrich the literature on low-carbon e-commerce by introducing a structured comparison of three fulfillment formats (self-pickup, delivery, and hybrid) within an O2O framework, a topic largely neglected in existing research focused on centralized or single-channel supply chains [7]. (2) By integrating carbon-abatement behavior into a Stackelberg pricing model, we provide novel insights into how emission-reduction incentives and fulfillment modes co-determine optimal decisions. This multi-layered modeling approach bridges green production and channel management decisions, which are often treated in isolation. (3) Our results demonstrate that consumer green preferences and distance sensitivity jointly affect the optimal fulfillment strategy. We identify threshold effects (e.g., when delivery costs or emission-abatement costs exceed certain bounds) that prompt firms to switch between fulfillment modes—findings that provide actionable guidance for platform managers and manufacturers seeking to reduce emissions through service design.
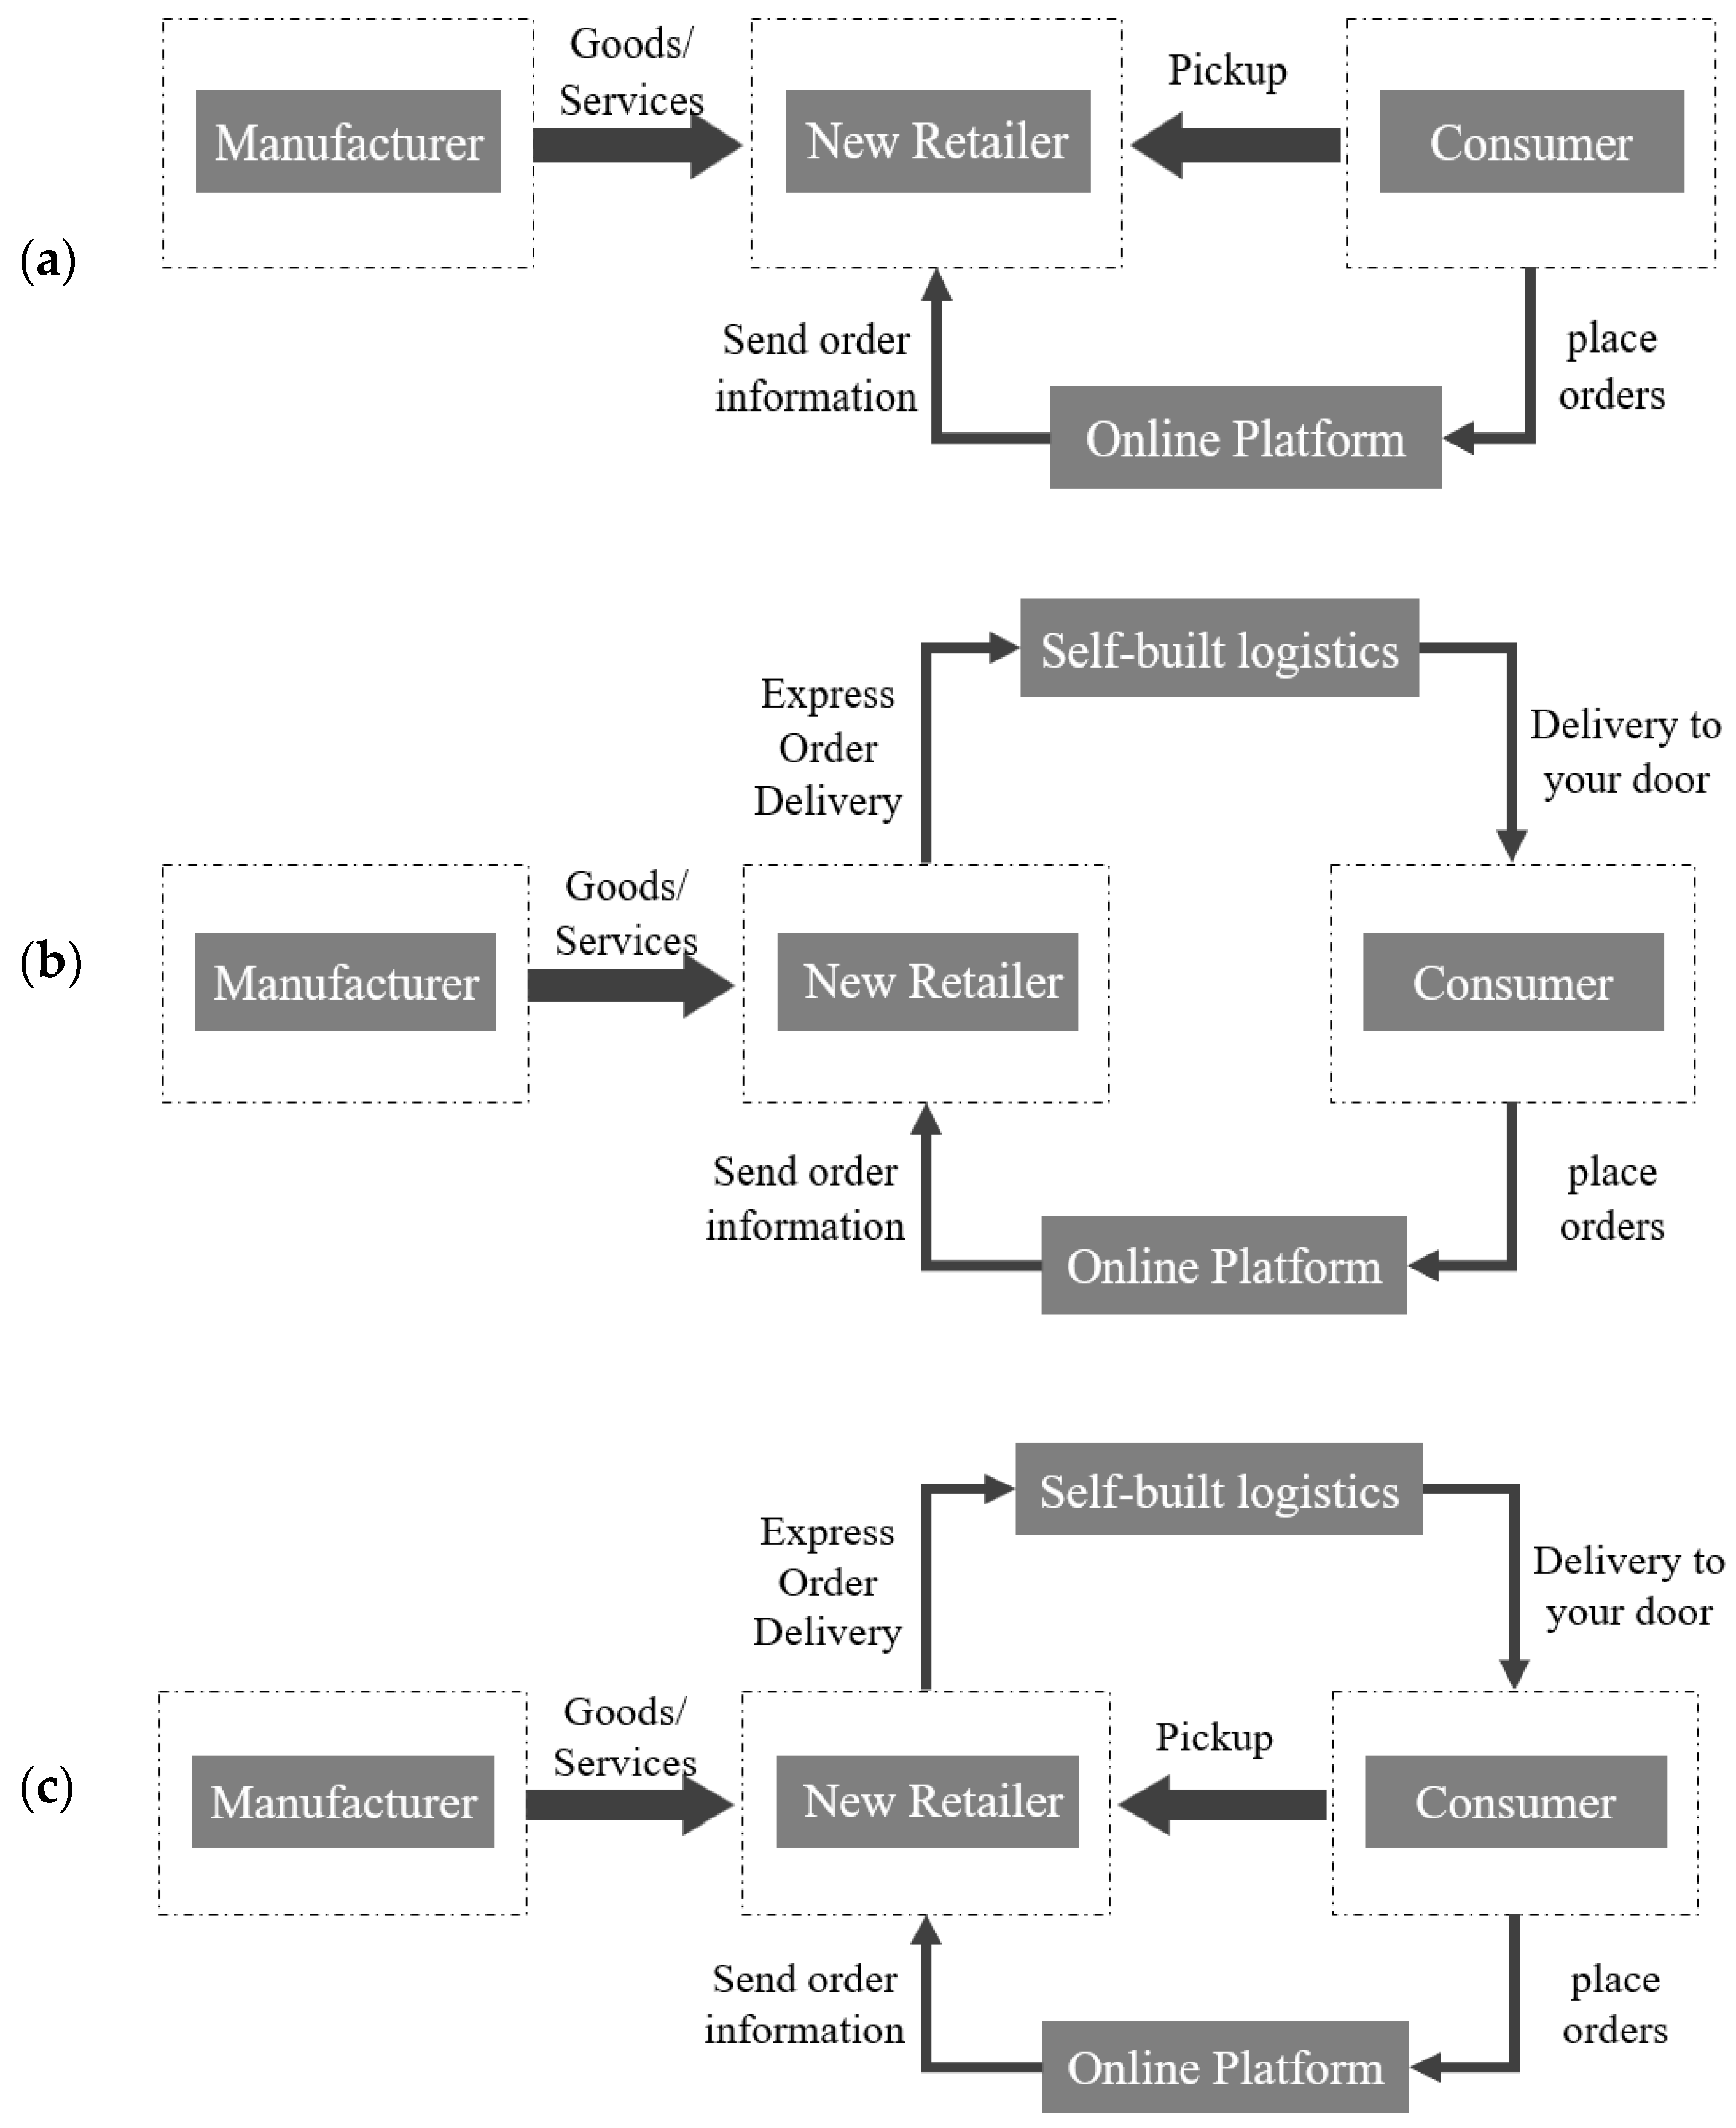
To investigate the sustainable decision-making mechanisms under different O2O sales models, this study constructs a Stackelberg game model to capture the pricing and carbon-reduction interactions between a manufacturer and a new retailer, as shown in Figure 1. The remainder of this paper is structured as follows: Section 2 reviews the related literature on green e-business and sustainable O2O supply chains. Section 3 presents the problem description, basic assumptions, and model construction for the three sales strategies. Section 4 develops the Stackelberg game models for the package self-pickup, nearby delivery, and hybrid modes and derives the corresponding analytical results. Section 5 conducts a series of numerical simulations and robustness analyses to evaluate the impact of key parameters. Section 6 discusses the theoretical insights and interprets the role of different model settings under realistic conditions. Section 7 provides managerial implications for sustainable channel design and green pricing. Finally, Section 8 concludes the study and suggests avenues for future research.

2. The Literature Review

This paper focuses on three major streams of literature: green-oriented O2O supply chains, information asymmetry in supply chain management, and sustainable pricing and emission-reduction strategies. The following subsections review relevant works in these areas and identify key research gaps.

2.1. Green-Oriented O2O Supply Chains

An expanding body of the literature explores strategic decisions in O2O supply chains, particularly within the context of green consumption and sustainable business transformation. Wang et al. [8] employed social network analysis (SNA) to analyze how sustainable product perception and trust impact consumer behavior in O2O environments. Similarly, Dai et al. [9] confirmed the effectiveness of pricing and visual promotion strategies on O2O platforms in stimulating sustainable consumption. Noori [10] extended this discussion by examining flexible refund and cancellation policies in aviation and hospitality, highlighting their role in improving resource efficiency and reducing waste under O2O systems.
From an operational strategy perspective, Geng et al. [11] studied bundled and unbundled pricing strategies in O2O channels, providing insights into how such decisions affect sustainability outcomes. Taleizadeh et al. [12] proposed a dual-channel O2O recycling model combining offline refund and online loyalty mechanisms, concluding that such integration enhances both profitability and environmental benefits. Pu et al. [13] focused on last-mile logistics and introduced an optimization algorithm that reduces delivery-related carbon emissions. In addition, Xu et al. [14] examined the effect of rights structures on sustainable pricing strategies in mixed O2O channels. Choi et al. [15] offered a theoretical comparison between integrated O2O retail and traditional models, showing improvements in efficiency, satisfaction, and resource utilization. Scholars, including Xing et al. [16], He et al. [17], Guo et al. [18], and He et al. [19], further explored O2O-related sustainability topics such as quality management, location optimization, commission contracts, and green financing.
These studies collectively emphasize the rising academic interest in embedding sustainability into O2O retail models. However, they primarily focus on service and platform strategies, with limited attention to how low-carbon product promotion and fulfillment format affect upstream manufacturers’ decisions within the O2O ecosystem.

2.2. Information Asymmetry in Sustainable Supply Chains

Information asymmetry is a central issue in supply chain coordination and becomes more complex in integrated O2O systems. As retail operations span online and offline interfaces, consumer behavior, sales feedback, and environmental performance data become fragmented across actors and platforms. He et al. highlighted the role of information asymmetry in shaping emission-reduction strategies, particularly when green incentives and coordination signals are unevenly distributed [19]. While some studies focus on information sharing between consumers and retailers [8,9], few explore how asymmetric information affects upstream manufacturers’ green investment or pricing behaviors in O2O settings.
In multi-channel systems, retailers are typically closer to the end market and have greater access to real-time sales and consumer preference data. This asymmetry may result in suboptimal decision-making, including pricing mismatches, inefficient allocation of carbon-reduction resources, and reduced overall system sustainability. Although the importance of data transparency and coordination in O2O has been recognized, there remains a paucity of research on how fulfillment structure and environmental strategies interact under asymmetric information conditions.

2.3. Low-Carbon Pricing and Emission-Reduction Strategies

Extensive research has investigated low-carbon policies, such as carbon trading, taxation, and emission quotas, and their influence on supply chain decision-making. Zhao et al. [20] and Song et al. [21] examined how such mechanisms shape sustainable pricing decisions under consumer low-carbon preferences. Zhang et al. [22] studied how cost-sharing contracts and green marketing improve coordination in dual-channel supply chains. Lu et al. [23] and Cai et al. [24] analyzed centralized and decentralized abatement strategies under carbon regulation. Xu et al. [25] investigated emission-sensitive demand and its implications for pricing and revenue sharing in closed-loop chains. Ghosh and Shah [26] proposed two-step pricing models to enhance cooperation in low-carbon settings. Vivek et al. [27] adopted a network optimization lens to study emission behavior in tiered supply chains.
Although these studies provide valuable tools for emission reduction and pricing under regulatory environments, most of them address single-channel or centralized systems, and few extend the analysis to O2O fulfillment structures [28]. Moreover, while some models embed green preferences, they often do not reflect channel heterogeneity or retail format complexity [29]. Thus, there is a need to examine carbon-abatement decisions within diverse O2O fulfillment models, considering both economic and environmental objectives [30].

2.4. Research Gap

(1)
While prior studies have addressed either sales-side or production-side low-carbon decisions, little attention has been paid to the promotion and fulfillment of low-carbon products in O2O systems. Only Cheng [31] has studied pricing strategies in O2O under carbon trading. Other studies, such as those by Chai et al. [32] and Lemon et al. [33], touch on consumer pick-up or offline experience stores but do not address emission reduction or green coordination in depth.
(2)
Although pricing and marketing strategies in sustainable O2O models have been widely examined, few works compare the carbon and economic outcomes of different fulfillment modes (e.g., self-pickup vs. home delivery vs. hybrid). This study addresses that gap by explicitly comparing three green O2O sales models under emission-reduction considerations.
(3)
A third gap concerns alignment of manufacturer strategy with O2O retail formats. The previous literature often assumes manufacturers adopt uniform strategies across markets. In reality, their decisions vary significantly depending on channel cost structure, green preferences, and service trade-offs. This study introduces a game-theoretic model incorporating manufacturer’s adaptive responses to fulfillment strategy and channel-specific emission-reduction challenges.

3. Problem Statement and Mathematical Model

3.1. Model Description

This study centers on a two-echelon O2O supply chain designed to promote sustainability and foster green e-business models. The supply chain comprises a single manufacturer—responsible for producing low-carbon products in response to the growing demand for sustainable consumption—and a newly established retailer who undertakes sales and fulfillment activities. To accommodate heterogeneous consumer preferences for convenience and green value, the retailer can adopt one of three distinct sales strategies: the package self-pickup model (Model P1), the nearby delivery model (Model P2), and the hybrid model (Model P3). These strategies reflect common operational practices in real-world O2O retail environments (e.g., JD.com’s “pick-up locker” model, Yonghui Life’s instant delivery, and Freshippo’s integrated hybrid logistics) and are thus representative of emerging low-carbon e-commerce configurations.
In Model P1 (package self-pickup), consumers place and pay for orders online, and then retrieve their products at designated offline pickup points, as illustrated in Figure 2a. This model is widely adopted by firms aiming to reduce last-mile carbon emissions, such as Cainiao and Meituan lockers, as it avoids delivery-related logistics emissions. The inconvenience cost parameter in this model captures the consumer’s time and effort in retrieving the goods and is assumed to increase with distance or accessibility limitations. Additionally, the manufacturer’s carbon emission-reduction efforts influence product sustainability, modeled via a quadratic abatement cost function consistent with marginally increasing emission-reduction costs observed in practice.
In Model P2 (nearby delivery), depicted in Figure 2b, consumers also place orders online, but the retailer fulfills the order through local distribution centers or physical stores using same-day or instant delivery services. This model corresponds to real-world O2O platforms like JD Daojia or Tmall Supermarket, where nearby warehouses enable rapid and localized deliveries. The logistics cost parameter in this model reflects transportation energy consumption and carbon emission, which scales with geographic dispersion and order volume. The model realistically assumes that carbon emission costs are borne by the manufacturer as part of green production incentives, while the retailer faces trade-offs between faster service and environmental burden.
To address the limitations of each model in isolation, the hybrid model (Model P3) combines both package self-pickup and nearby delivery options, allowing consumers to select the preferred method based on convenience, cost, or sustainability preferences (Figure 2c). This hybrid strategy is increasingly adopted by fresh food retailers (e.g., Freshippo) and takeaway platforms, offering flexibility while maintaining a low-carbon footprint. The hybrid model incorporates both logistics and inconvenience costs, with consumers endogenously segmented based on their sensitivity to these factors. This configuration mirrors real consumer behavior, as evidenced by preference heterogeneity in last-mile delivery studies (e.g., urban vs. suburban preferences).

3.2. Assumptions

In this paper, under the background that the manufacturer takes strategies to reduce low-carbon emission, the Stackelberg game approach is employed to analyze pricing decisions and emission-reduction measures within the supply chain, meanwhile highlighting the new retailer’s sales model decision-making issues. To further analyze the above issues, the study makes three assumptions:
Assumption 1: The manufacturer wholesales products to the new retailer at a unit wholesale price ω, and the new retailer sells the products to consumers at a retail price p. Under Model P1, consumers must collect products from designated locations, incurring an inconvenience cost C1. This cost reflects travel distance, time, and product characteristics (e.g., size, weight). Following d’Aspremont et al. [34], we assume that C1~U [0, 1], which captures heterogeneity in consumers’ travel-related disutility while ensuring analytical tractability. Additionally, the new retailer bears a per-unit processing cost mmm for establishing and operating self-pickup infrastructure (e.g., shelving, staffing, and space). In Model P2, products are delivered to consumers’ homes. Consistent with common urban logistics practice, we define a delivery cost C2 as the fee borne by consumers, accounting for packaging, transportation, and labor inputs [35]. In Model P3, consumers can flexibly choose between self-pickup and delivery. This model reflects real-world omnichannel strategies (e.g., JD Daojia, Hema Fresh), designed to accommodate diverse preferences for convenience, environmental concern, and service quality.
Assumption 2: Following the approach of d’Aspremont and Jacquemin [35], we model the manufacturer’s total emission-reduction cost as the following convex quadratic function: C = 1 2 k L 2 , where L represents the per-unit carbon-reduction effort (e.g., cleaner inputs, process innovations) and kkk is the emission-reduction cost coefficient. This functional form implies increasing marginal abatement cost: each additional unit of emission reduction requires disproportionately higher investment, consistent with real-world observations in clean technology deployment and environmental operations. The function satisfies C > 0 and C > 0 , confirming its convexity.
Assumption 3: Consumers differ in their willingness to pay (WTP) for green products due to income variation, environmental consciousness, and brand loyalty. Let B denote the WTP for low-carbon attributes. To capture this heterogeneity, we assume B~U [0, 1], following prior studies on sustainable consumption [36]. This uniform distribution allows clear segmentation of consumer types and facilitates derivation of demand boundaries under each fulfillment model. Moreover, it aligns with empirical evidence that green product markets include both price-sensitive and environmentally motivated buyers.

3.3. Demand Function Construction

(1) Under Model P1, consumers can only pick up the products they purchase offline. According to the consumer utility theory, the net utility for consumers under this model is as follows:
U 1 = B + L P C 1
where B is the consumer’s WTP, L denotes the unit product emission reduction, P represents the product sales price, and C1 is the inconvenience cost for consumers when picking up the product themselves. Consumers will only purchase the product if the net utility under this model is not less than zero, i.e., B + L P C 1 0 . At this time, the demand function for consumers under Model P1 is as follows:
d 1 = P + C 1 L 1 d F ( B ) = 1 P + L C 1
(2) Under Model P2, consumers can directly place orders online to purchase products, which are then delivered to consumers by logistics. The net utility for consumers under this model is as follows:
U 2 = B + L P C 2
where C2 is the logistics cost for consumers to purchase online. Consumers will only purchase the product if the net utility under this model is not less than zero, i.e., B + L P C 2 0 . At this time, the demand function for consumers under Model P2 is the following:
d 2 = P + C 2 L 1 d F ( B ) = 1 P + L C 2
(3) Under Model P3, consumers have the option to buy products online and retrieve them in physical stores. Consumers will only buy products under Model P1 if the net utility of choosing Model P1 is not less than zero and greater than the net utility of choosing Model P2, that is, U 1 U 2 and B + L P C 1 0 ; similarly, consumers will only buy products under Model P2 if the net utility of choosing Model P2 is not less than zero and greater than the net utility of choosing Model P1, that is, U 2 U 1 and B + L P C 2 0 . Therefore, the demand function for self-pickup under Model P3 is as follows:
d 3 = P + C 2 L 1 d F ( B ) C 2 1 d F ( C 1 ) = ( 1 P C 2 + L ) ( 1 C 2 )
The demand function for online purchases is the following:
d 4 = 0 C 2 d F ( C 1 ) P + C 1 L 1 d F ( B ) = 1 2 C 2 ( 2 2 P + 2 L C 2 )

4. Model Construction and Solution

The following combines the characteristics of the package self-pickup model, nearby delivery model, and hybrid model to construct game models for the three sales models. In this model, the low-carbon manufacturer acts as the market leader while the new retailer takes the follower role. Their decision-making is structured as a two-stage Stackelberg game, with each party aiming to maximize their respective profits. The game proceeds in a specific order: the manufacturer first gives the product’s wholesale price w and the unit emission reduction L, and then the new retailer confirms the sales price based on w, leading to the optimal decisions and maximum profits for them under different models. The superscripts Z, S, and H represent the package self-pickup model, nearby delivery model, and hybrid model, respectively. The subscripts m and e respectively denote the manufacturer and the new retailer. Additionally, the asterisk “*” indicates the optimal solution. C1, and C2 denote the inconvenience cost and logistics cost, respectively; m denotes the additional processing cost; k is the emission-reduction cost coefficient; and L is the emission reduction per unit product. By solving the models corresponding to fulfillment strategies P1, P2, and P3, we derive the following propositions. The complete derivations and solution procedures are presented in Appendix A.
Proposition 1. 
Under the package self-pickup model, the optimal wholesale price, emission reduction, and profit of the manufacturer are  w Z * = 2 k ( C 1 + m 1 ) 4 k 1 , L Z * = C 1 + m 1 4 k 1 , and  π m Z * = k ( C 1 + m 1 ) 2 8 k 2 , respectively; the optimal sales price and profit of the new retailer are P Z * = k ( m 3 C 1 + 3 ) m 4 k 1 and  π e Z * = k 2 ( C 1 + m 1 ) 2 ( 4 k 1 ) 2 , respectively.
Proposition 1 indicates that under the package self-pickup model, the optimal wholesale price of the manufacturer and the optimal sales price of the new retailer are influenced by the inconvenience cost C1, the additional processing cost m, and the emission-reduction cost coefficient k. Specifically, as these costs increase, both the wholesale and retail prices tend to decrease due to pressure on consumer willingness to pay and rising marginal costs. Importantly, the analysis reveals a structural relationship: the optimal wholesale price is exactly twice the emission-reduction level, reflecting a proportional trade-off between environmental effort and pricing power. This relationship offers intuitive insight into how cost-side sustainability burdens directly shape supply chain pricing decisions, making the model not only analytically rigorous but also practically interpretable for decision-makers seeking to balance profitability with low-carbon goals.
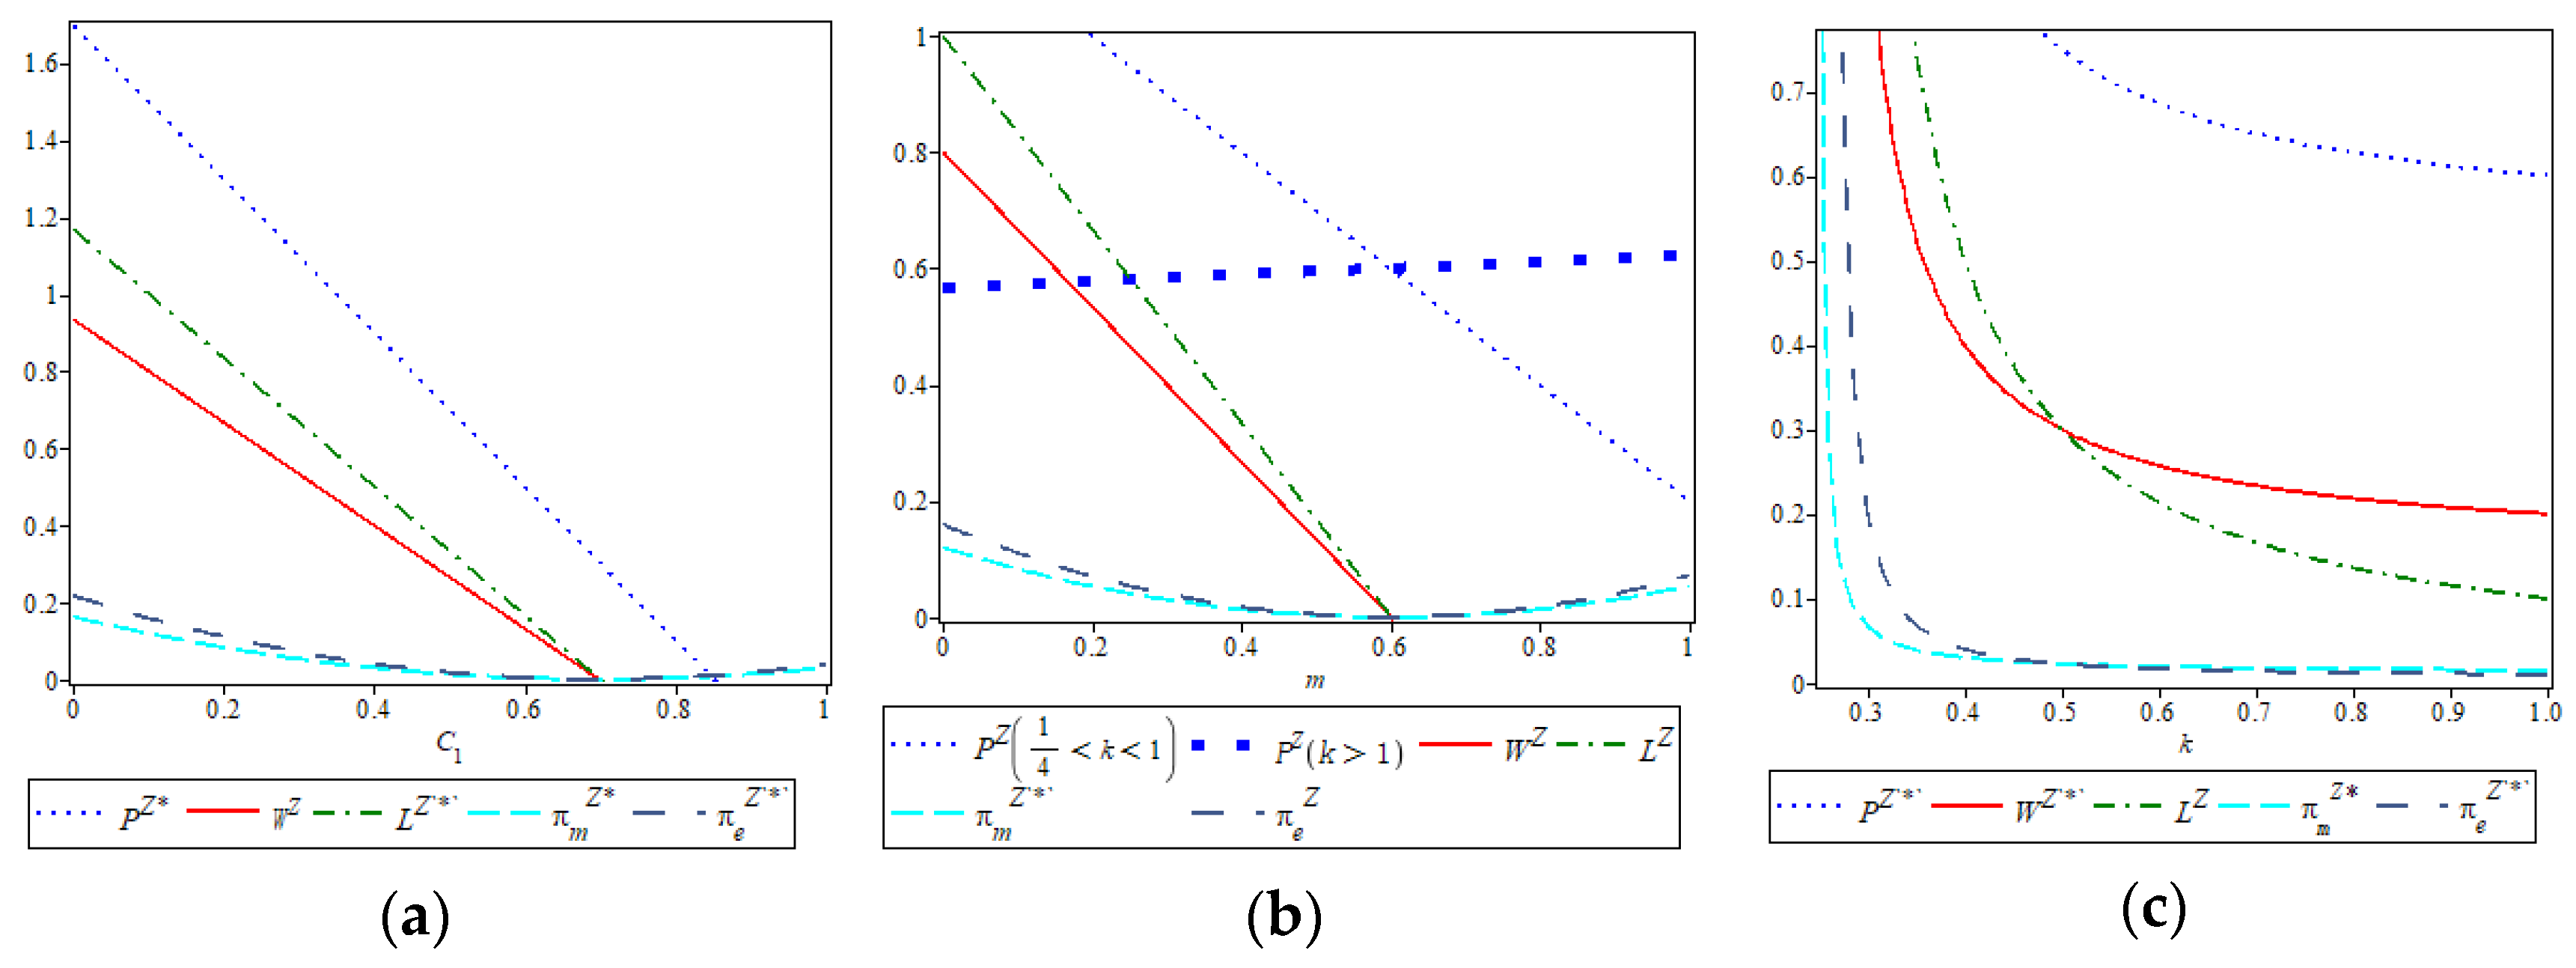
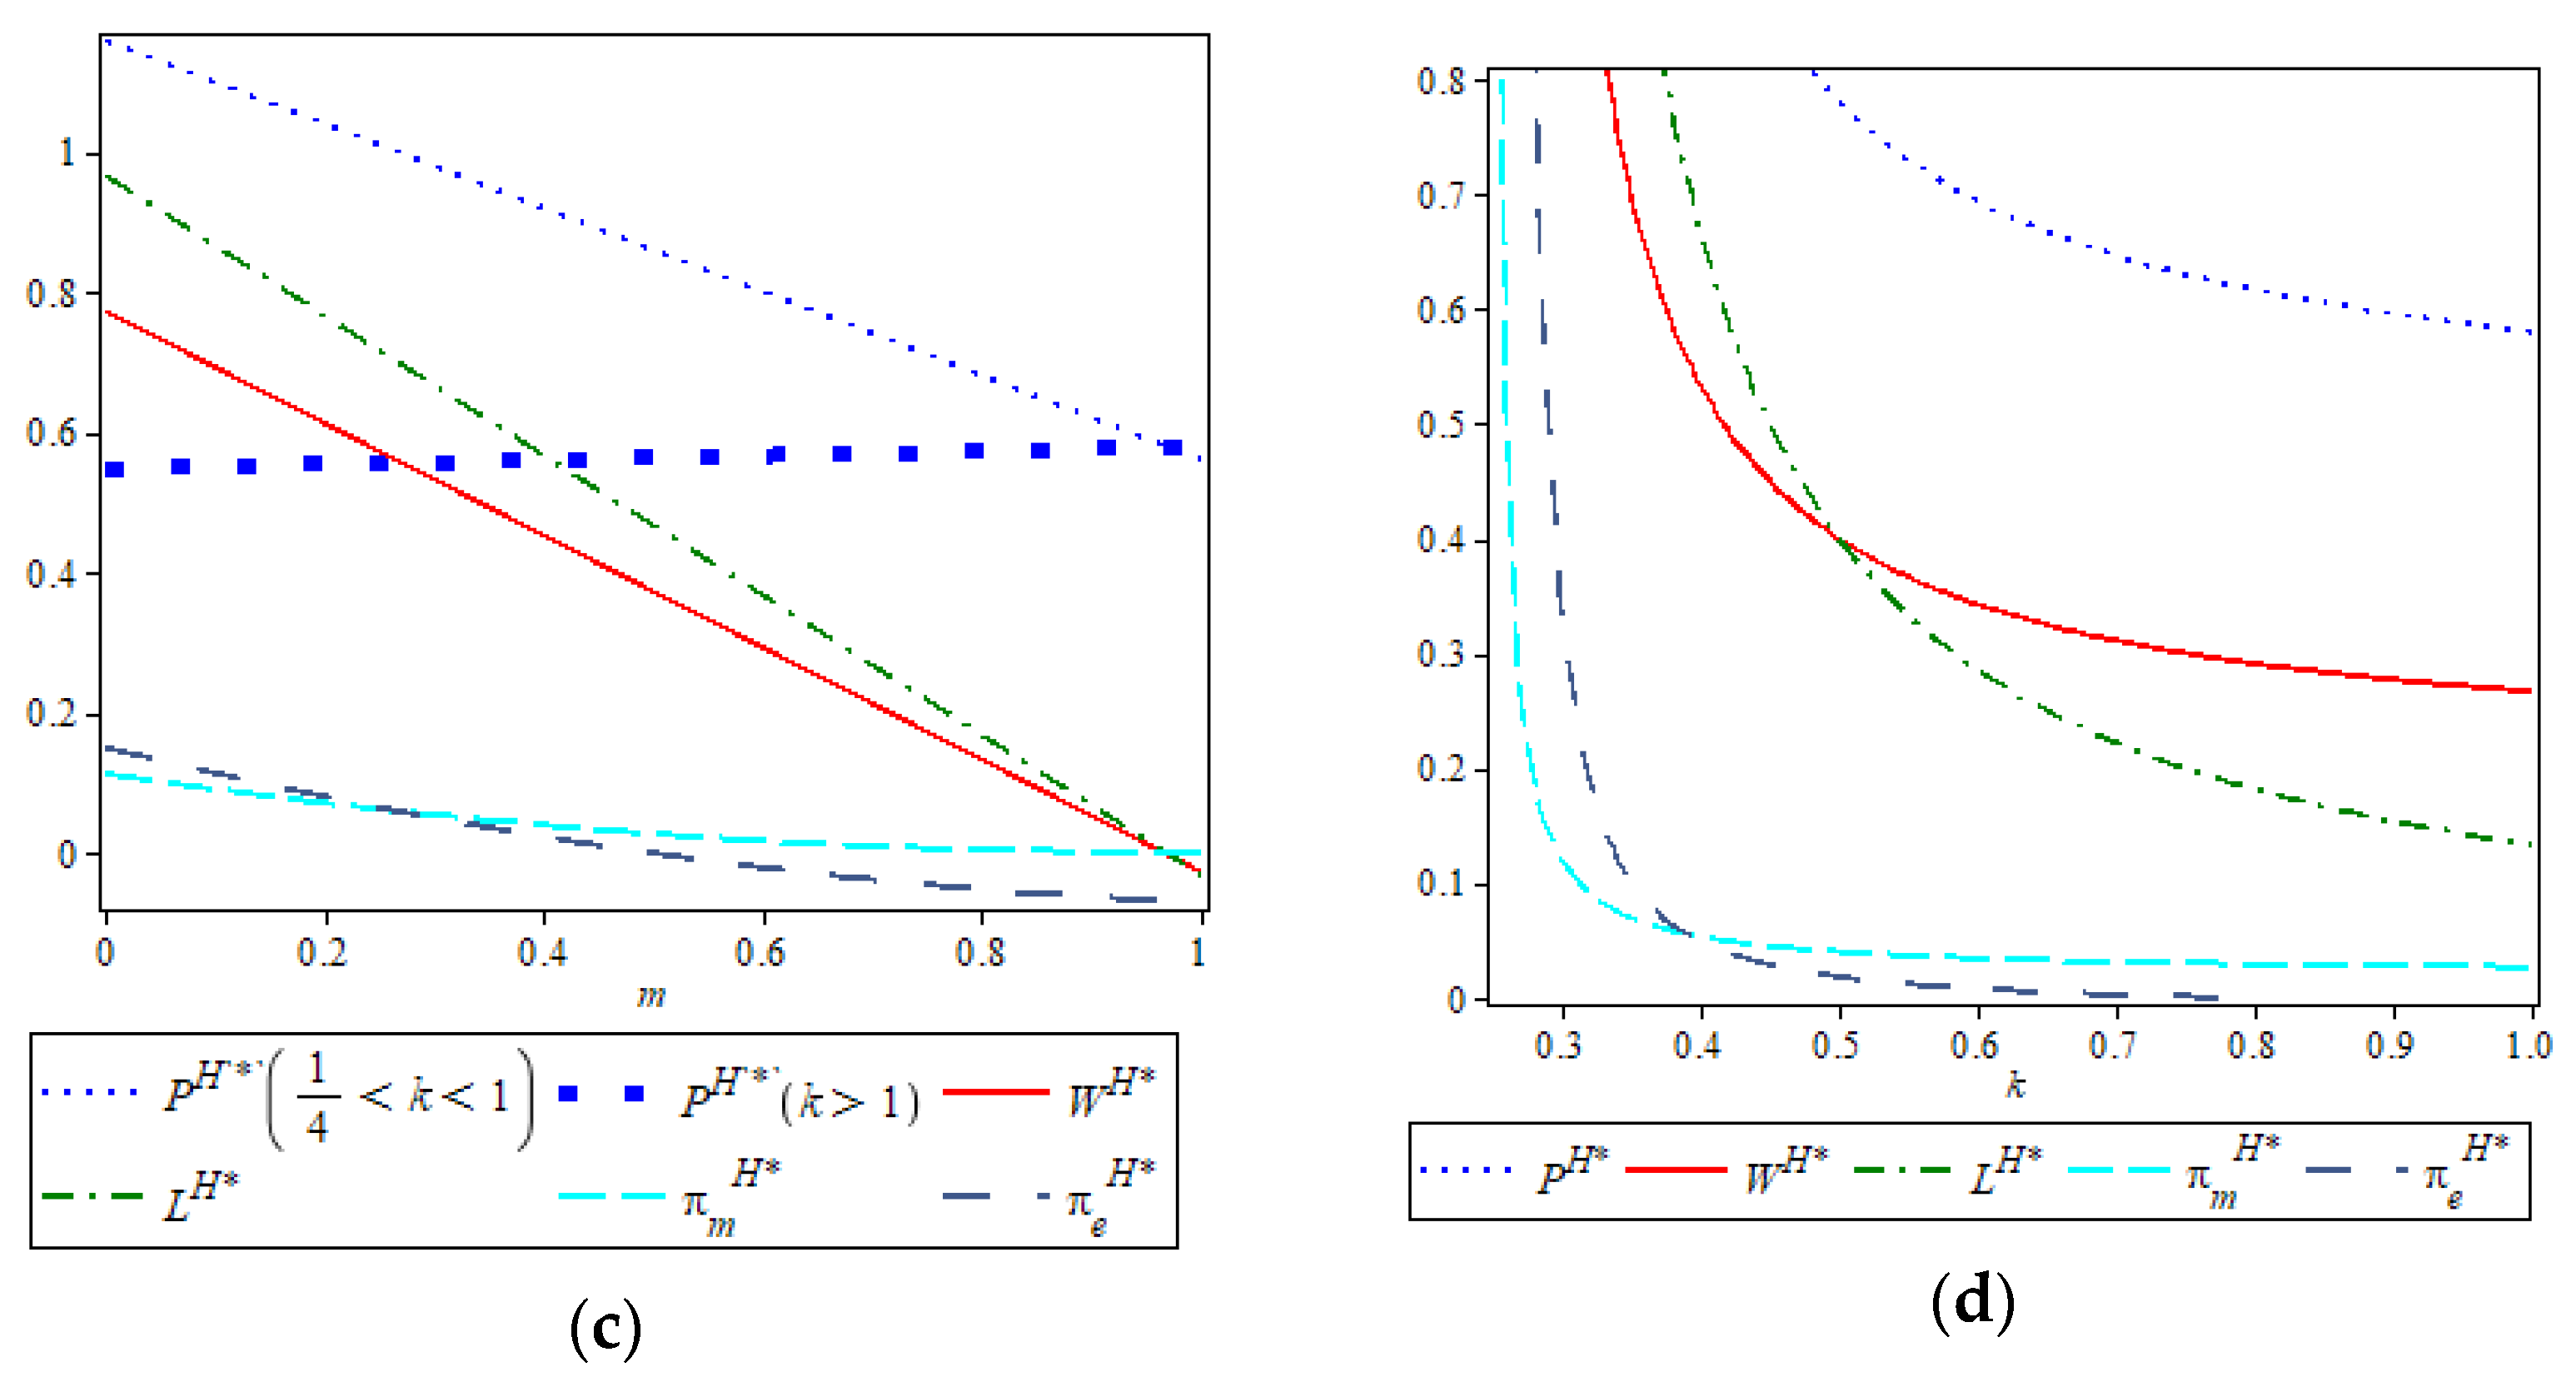
Proposition 2. 
Under the package self-pickup model, the optimal wholesale price w Z * , optimal emission reduction L Z * , and optimal sales price P Z * all present a negative relevance to C1 or k; w Z *  and  L Z *  both present a negative relevance to m;  P Z *  presents a negative relevance to m when  1 4 < k < 1 , and a positive relevance when k > 1.
Proof. 
Taking the derivatives of Equations (A6)–(A8) against C1, m, and k, we get
w Z * C 1 = 2 k 4 k 1 < 0 ; w Z * m = 2 k 4 k 1 < 0 ; L Z * C 1 = 1 4 k 1 < 0 ; L Z * m = 1 4 k 1 < 0 ; P Z * C 1 = 3 k 4 k 1 < 0 ; w Z * k = 2 ( C 1 + m 1 ) ( 4 k 1 ) 2 < 0 ; L Z * k = 4 ( C 1 + m 1 ) ( 4 k 1 ) 2 < 0 ;   and P Z * k = 3 ( C 1 + m 1 ) ( 4 k 1 ) 2 < 0 ,
when 1 4 < k < 1 , P Z * m = k 1 4 k 1 < 0 , and when k > 1 , P Z * m > 0 . □
Proposition 2 reveals that as the inconvenience cost C1 increases, fewer consumers are willing to adopt the package self-pickup model, leading to a decline in total market demand. In response, new retailers must reduce their sales prices to retain consumers, which in turn pressures manufacturers to lower their wholesale prices in order to maintain downstream order volumes. Similarly, when the emission-reduction cost coefficient k rises, the cost burden on the manufacturer increases, prompting a reduction in the emission-reduction level, which subsequently diminishes the attractiveness of low-carbon products. To stimulate demand, both wholesale and retail prices are further reduced. Additionally, as the processing cost mmm increases—due to expenses such as equipment, space, and labor for operating the pickup point—the manufacturer again responds by cutting wholesale prices and emission efforts to sustain profitability. A particularly noteworthy insight is that the effect of mmm on the retailer’s sales price is non-monotonic: when k is relatively low, increases in m lead to a decrease in the sales price due to intensified cost pressures; however, when k is high, the retailer may instead raise the sales price to offset the compounded cost burden. These nuanced interactions illustrate how cost structure and emission-reduction behavior jointly shape pricing strategies under the package self-pickup model.
Proposition 3. 
In the package self-pickup model, both the manufacturer’s optimal profit π m Z *  and the new retailer’s optimal profit π e Z *  exhibit a negative relevance to k, m, and C1.
Proof. 
Taking the derivatives of Equations (A7) and (A8) against C1, m, and k, we obtain π e Z * k = 2 k ( C 1 + m 1 ) 2 ( 4 k 1 ) 3 < 0 ; π m Z * k = ( C 1 + m 1 ) 2 2 ( 4 k 1 ) 3 < 0 ; π m Z * C 1 = 2 k ( C 1 + m 1 ) 8 k 2 < 0 ; π e Z * m = 2 k 2 ( C 1 + m 1 ) ( 4 k 1 ) 2 < 0 ; π e Z * C 1 = 2 k 2 ( C 1 + m 1 ) ( 4 k 1 ) 2 < 0 ; and π m Z * m = 2 k ( C 1 + m 1 ) 8 k 2 < 0 . □
According to Proposition 3, increases in the emission-reduction cost coefficient k, additional processing cost mmm, and inconvenience cost C1 will all lead to a decline in the profits of both supply chain members under the package self-pickup model. A higher k means that emission reduction becomes more expensive for the manufacturer, directly lowering its profit margins. To offset this, the manufacturer reduces the emission level, which negatively affects product appeal and results in fewer consumer purchases, thus also reducing the new retailer’s profit. Similarly, an increase in m raises the retailer’s cost of maintaining the pickup infrastructure, weakening the economic incentive to promote this model. Finally, as C1 grows, consumers perceive more inconvenience, causing overall market demand to shrink and thereby reducing revenue and profit for both parties. This proposition underscores the sensitivity of sustainable fulfillment profitability to operational cost pressures and consumer perception factors.
Proposition 4. 
In the nearby delivery model, the manufacturer’s optimal wholesale price, optimal emission reduction, and optimal profit are w S * = 2 k ( C 2 1 ) 4 k 1 , L S * = C 2 1 4 k 1 , and  π m S * = k ( C 2 1 ) 2 8 k 2 , respectively; the new retailer’s optimal sales price and optimal profit are  P S * = 3 k ( C 2 1 ) 4 k 1  and  π e S * = k 2 ( C 2 1 ) 2 ( 4 k 1 ) 2 , respectively.
Proposition 4 reveals that in the nearby delivery model, both the manufacturer’s optimal wholesale price and the new retailer’s sales price decrease as C2 and k increase. This is because higher logistics costs diminish consumer utility and suppress demand, prompting the new retailer to reduce prices. In turn, the manufacturer lowers the wholesale price to maintain downstream sales volume. Moreover, the analytical solution suggests that the manufacturer’s wholesale price is exactly twice the emission-reduction level, reflecting a cost-sharing mechanism where the emission-reduction burden is proportionally internalized into pricing. This relationship offers clear managerial intuition: when sustainability costs rise, coordinated price reductions become necessary to preserve supply chain viability.
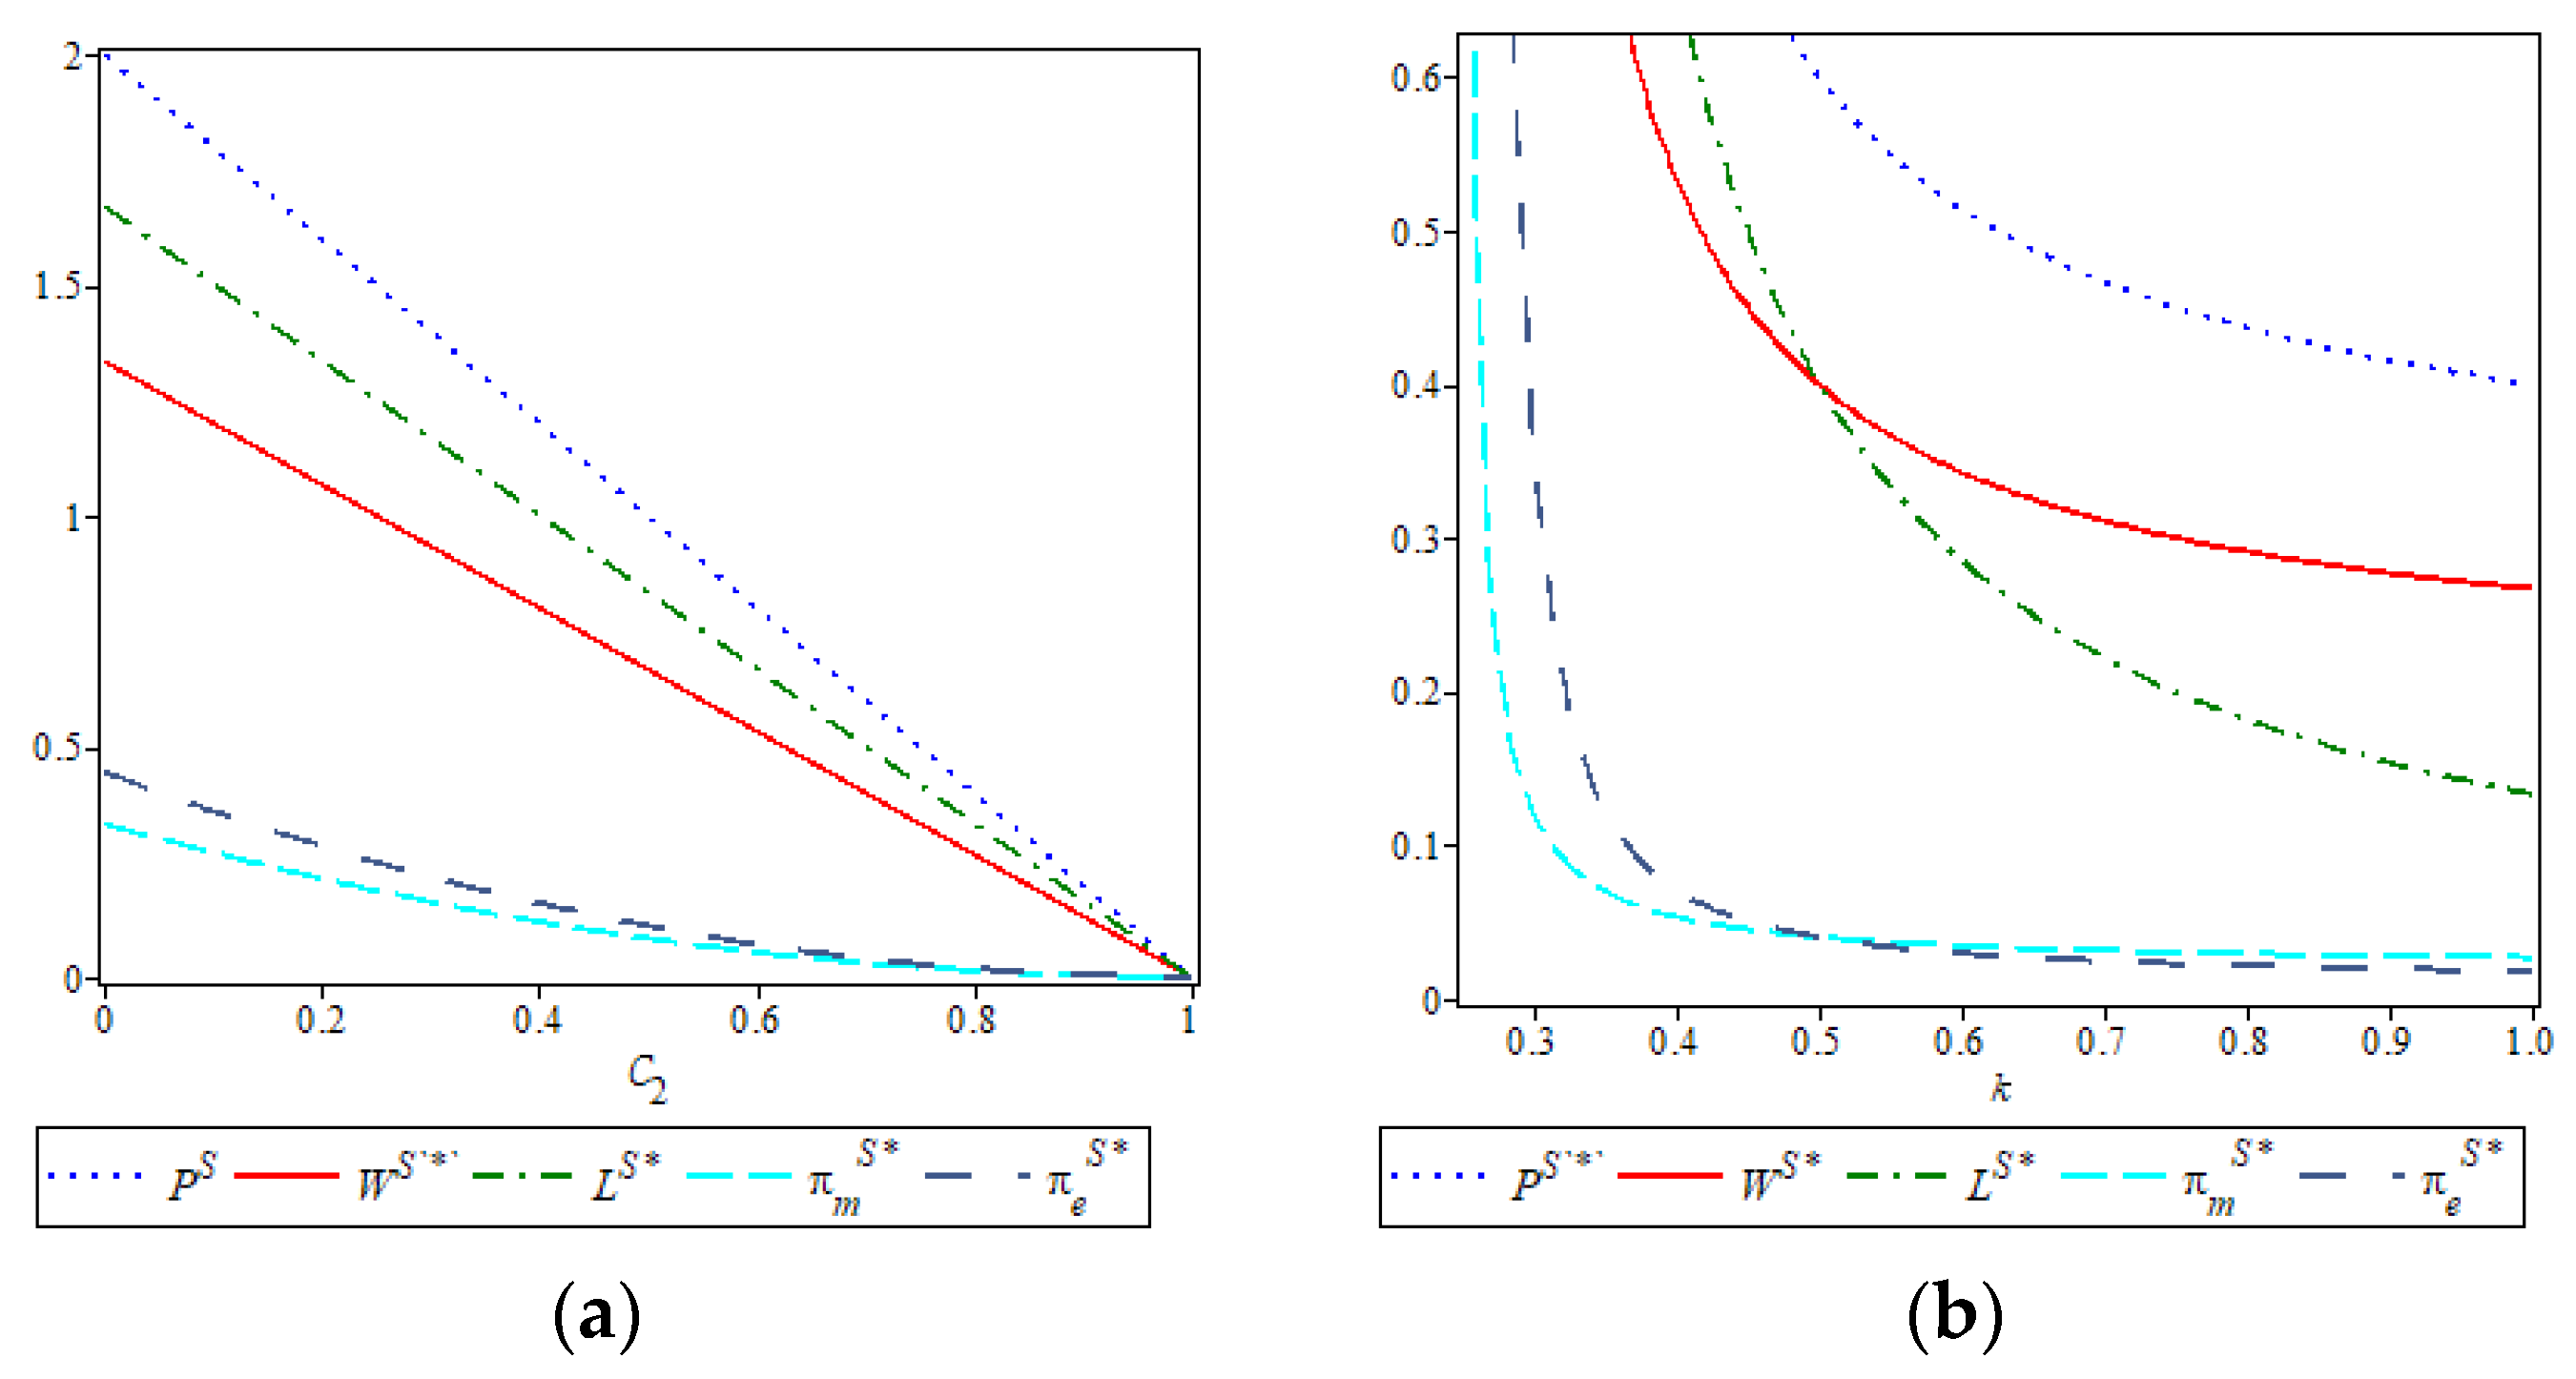
Proposition 5. 
In the nearby delivery model, the optimal wholesale price  w S * , optimal emission reduction  L S * , and optimal sales price  P S *  are all negatively correlated with C2 and k.
Proof. 
Taking the derivatives of Equations (A16)–(A18) against C2 and k yields w S * C 2 = 2 k 4 k 1 < 0 ; L S * C 2 = 1 4 k 1 < 0 ; P S * C 2 = 3 k 4 k 1 < 0 ; w S * k = 2 ( C 2 1 ) ( 4 k 1 ) 2 < 0 ; L S * k = 4 ( C 2 1 ) ( 4 k 1 ) 2 < 0 ; and P S * k = 3 ( C 2 1 ) ( 4 k 1 ) 2 < 0 . □
According to Proposition 5, increases in both the logistics cost C2 and the emission-reduction cost coefficient k lead to declines in the manufacturer’s optimal wholesale price and the new retailer’s sales price under the nearby delivery model. This pricing adjustment stems from the rising service burden on consumers—higher delivery costs reduce consumer willingness to purchase, which then lowers the retailer’s sales volume and consequently diminishes the manufacturer’s order volume. To sustain demand and mitigate losses, both supply chain members are incentivized to reduce prices. The influence of k mirrors that observed in the package self-pickup model: rising abatement costs suppress emission-reduction efforts, weaken product attractiveness, and reduce overall profits. These effects highlight how increased downstream costs can trigger a pricing chain reaction that impacts the sustainability and viability of nearby delivery operations.
Proposition 6. 
In the nearby delivery model, both the manufacturer’s optimal profit πmS∗ and the new retailer’s optimal profit   π m S *  are negatively correlated with C2 and k.
Proof: 
Taking the derivatives of Equations (A19) and (A20) against C2 and k yields
π m S * C 2 = 2 k ( C 2 1 ) 8 k 2 < 0 ; π e S * C 2 = 2 k 2 ( C 2 1 )   4 k 1 2 < 0 ; π m S * k = 2 k ( C 2 1 ) 8 k 2 < 0 ;   and π e S * k = 2 k ( C 2 1 ) 2   4 k 1 3 < 0 .
Proposition 6 shows that as logistics cost C2 and emission-reduction cost coefficient k rise, the profits of both the manufacturer and the new retailer decline under the nearby delivery model. The key mechanism lies in how these costs influence consumer utility and operational expenses. Higher logistics costs reduce consumer willingness to pay, shrinking overall market demand. At the same time, a larger k significantly increases the cost burden of emission-reduction investments, further compressing profit margins. Thus, both parameters act as profit dampeners—C2 by eroding demand and k by raising upstream costs—jointly undermining the economic viability of sustainable delivery strategies.
Proposition 7. 
In the hybrid model, the optimal wholesale price, optimal emission reduction, and optimal profit of the manufacturer are w H * = k ( C 2 2 2 m C 2 2 C 2 + 2 ) 4 k 1 , L H * = C 2 2 2 m C 2 2 C 2 + 2 8 k 2 , and  π m H * = k ( C 2 2 + 2 m C 2 + 2 C 2 2 ) 2 32 k 8 , respectively; the optimal sales price and optimal profit of the new retailer are  P H * = ( 6 + 3 C 2 2 + ( 2 m 6 ) C 2 ) k 2 m C 2 8 k 2  and  π e H * = C 2 4 k 2 + ( ( 28 m 4 ) k 2 16 m k + 2 m ) C 2 3 + ( ( 4 m 2 24 m + 8 ) k 2 + 16 m k 2 m ) C 2 2 8 k 2 ( m + 1 ) C 2 + 4 k 2 4 ( 4 k 1 ) 2 , respectively.
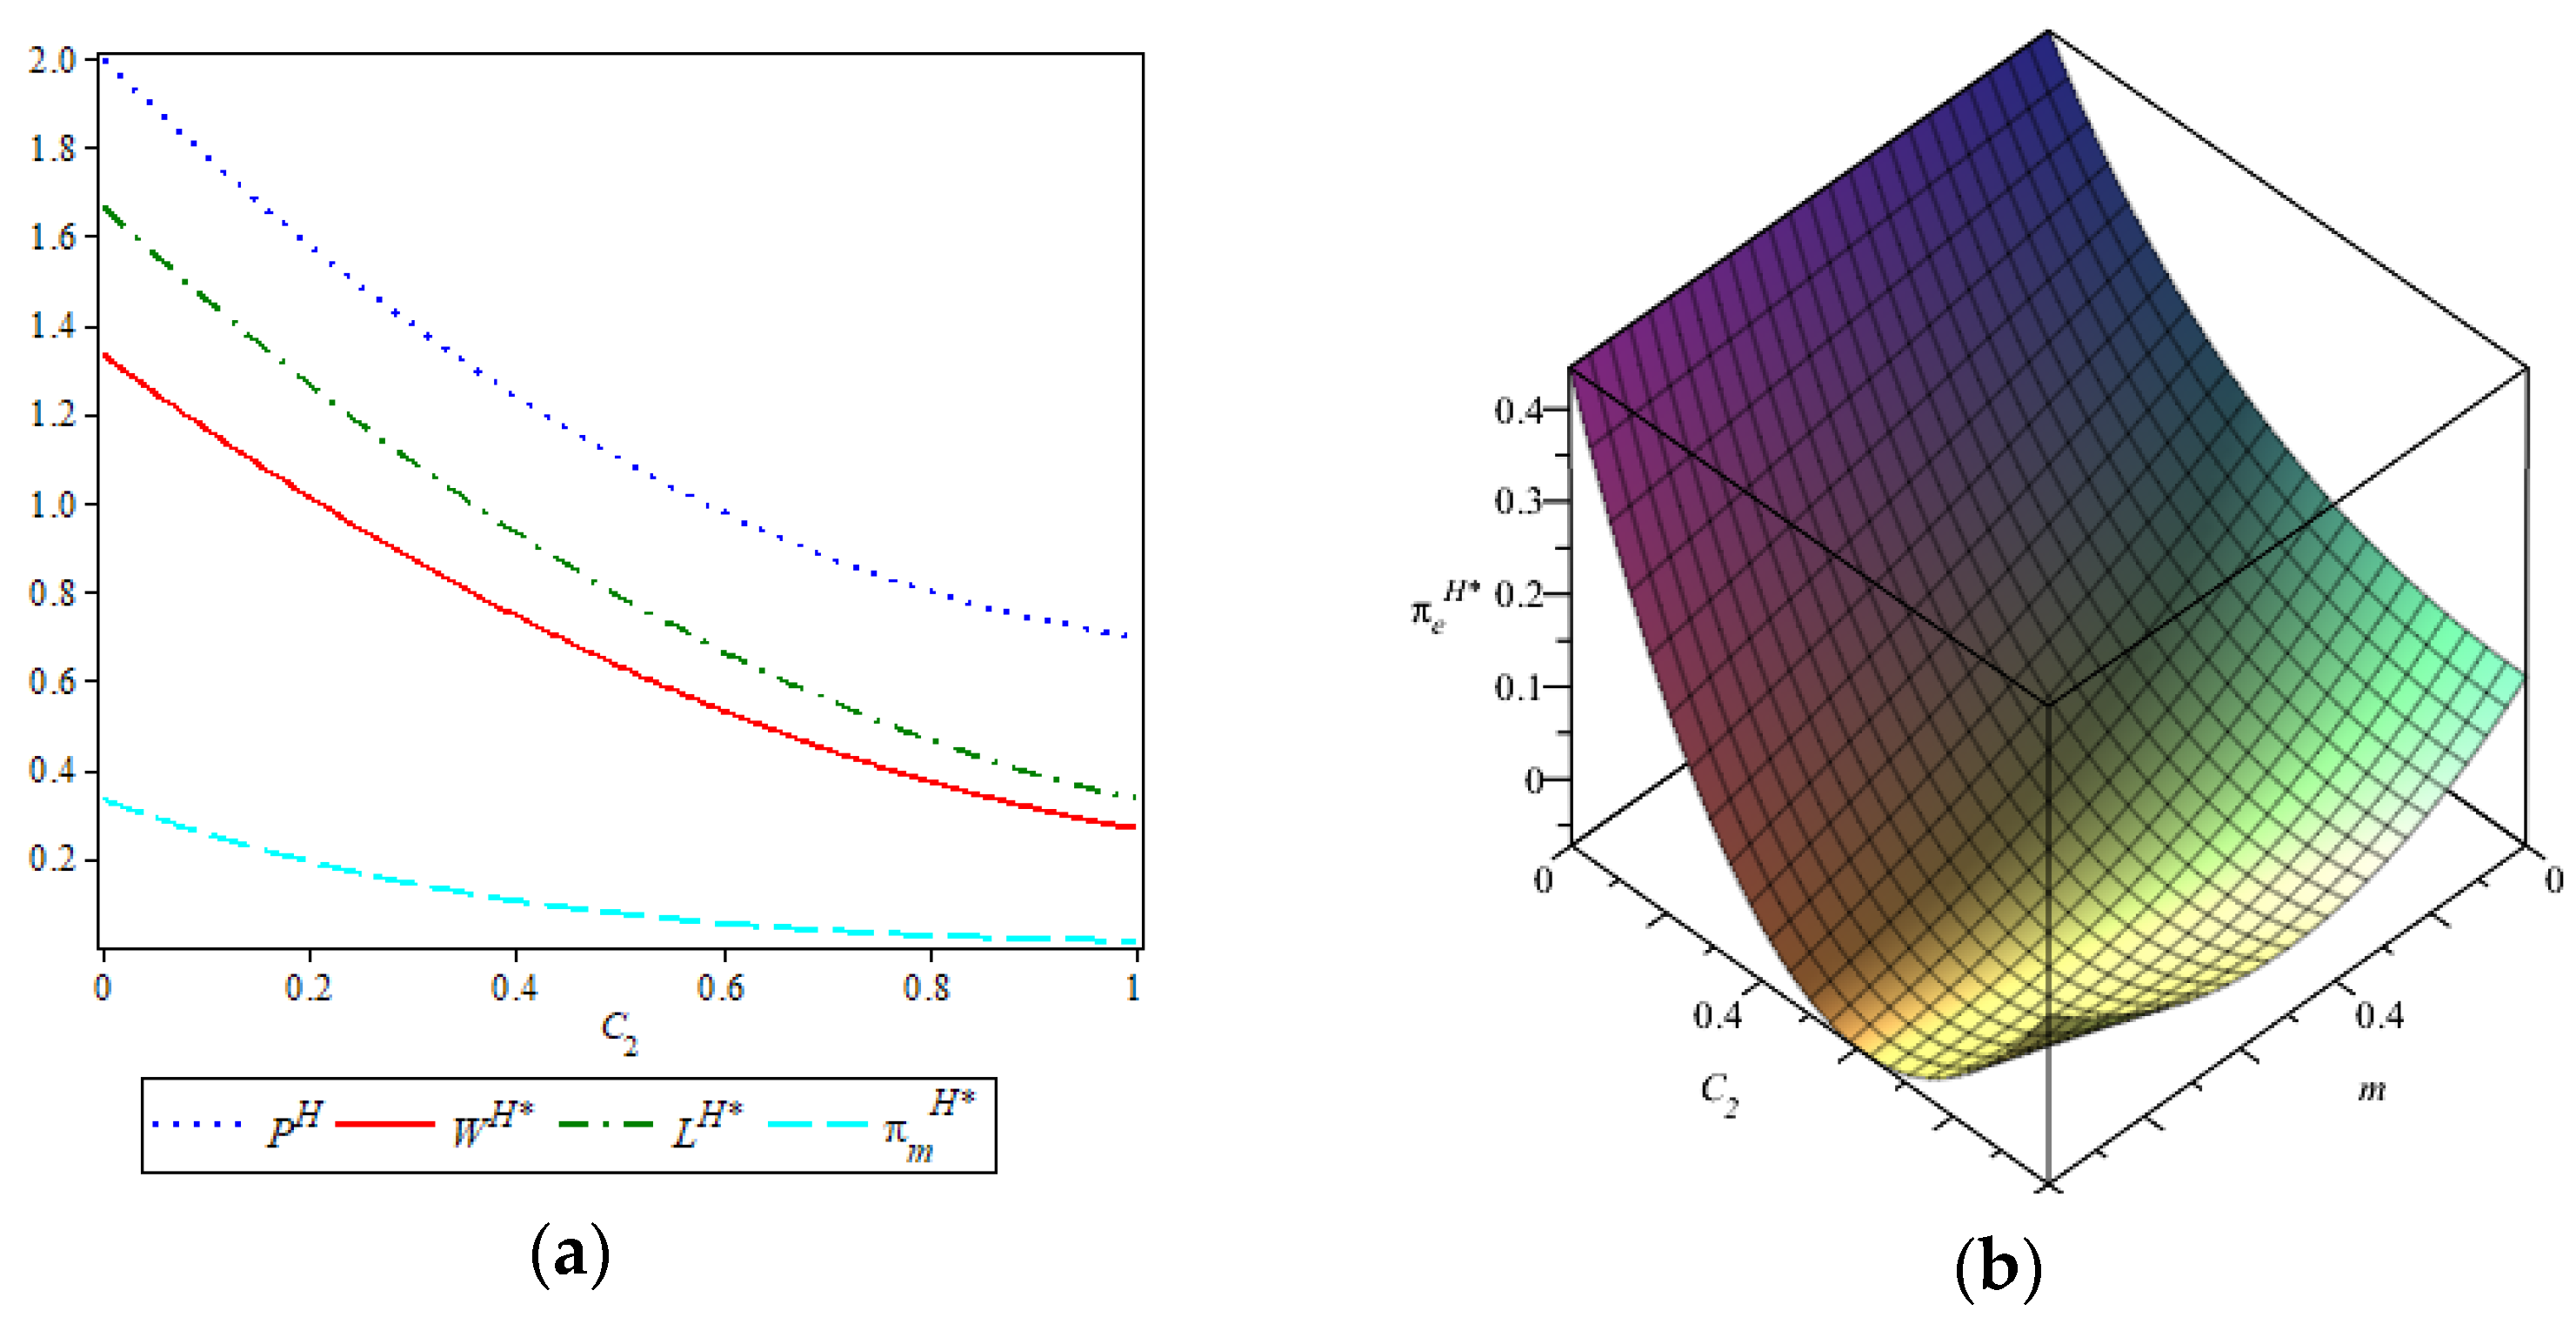
Proposition 7 shows that under the hybrid model, the manufacturer’s optimal wholesale price and the new retailer’s optimal sales price are jointly influenced by C2, k, and m. As these costs increase, the manufacturer tends to reduce both the emission-reduction effort and the wholesale price to maintain margin levels, while the new retailer adjusts the sales price in response to rising operational burdens. Notably, the manufacturer’s wholesale price remains proportional to emission reduction, specifically equal to 2k, indicating that as the cost of sustainability rises, the manufacturer internalizes this into pricing at a fixed multiple. This highlights the hybrid model’s sensitivity to cross-cost interactions and suggests that managing processing and logistics costs is essential for preserving profitability under dual-channel service formats.
Proposition 8. 
In the hybrid model, the optimal wholesale price  w H * and the optimal emission reduction  L H * both exhibit a negative relevance to C2, k, and m; the optimal sales price  P H * is negatively correlated with C2 and k; when  1 4 < k < 1 ,  P H * is negatively correlated with m, and when  k > 1 , P H * is positively correlated with m.
Proof. 
Taking the derivatives of Equations (A26)–(A28) against C2, m, and k, we get
w H * C 2 = k ( 2 C 2 2 m 2 ) 4 k 1 < 0 ; L H * C 2 = 2 C 2 2 m 2 8 k 2 < 0 ; w H * m = 2 k C 2 4 k 1 < 0 ; L H * m = C 2 4 k 1 < 0 ;   P H * C 2 = ( 6 C 2 + 2 m 6 ) k 2 m 8 k 2 < 0 ; L H * k = 2 ( C 2 2 2 m C 2 2 C 2 + 2 ) ( 4 k 1 ) 2 < 0 ;   and   P H * k = 6 3 C 2 2 + ( 6 m + 6 ) C 2 2 ( 4 k 1 ) 2 < 0
when 1 4 < k < 1 , P H * m = 2 C 2 k 2 C 2 8 k 2 < 0 ; when k > 1 , P H * m > 0 . □
Proposition 8 demonstrates that in the hybrid model, as C2, k, and m increase, the manufacturer’s optimal wholesale price and emission-reduction effort both decline. For the new retailer, a rise in C2 and k leads to lower sales prices, reflecting reduced consumer willingness to pay under higher service and carbon costs. Interestingly, the impact of m on the retailer’s pricing decision exhibits a threshold effect based on the value of k: when k is relatively low, an increase in m suppresses the retail price; but when k is high, the retail price rises with m. This suggests that under high carbon costs, retailers may transfer additional processing burdens into pricing, whereas under low carbon costs, they are more inclined to absorb them. This nuanced interaction between k and m offers valuable insight for managing dual-channel pricing strategies under varying carbon and service cost structures.
Proposition 9. 
In the hybrid model, the manufacturer’s optimal profit  π m H * exhibits a negative relevance to C2, m, or k. When  m < e 1 H , the new retailer’s optimal profit  π e H * is negatively correlated with C2; otherwise, the situation is reversed. When  m < e 1 m , π e H * is negatively correlated with m; otherwise, the situation is reversed.  π e H * is negatively correlated with k.
Proof. 
Taking the first-order partial derivatives of Equations (A29) and (A30) against C2, we get π m H * / C 2 < 0 ; π m H * / m < 0 ; π m H * / k < 0 . When 0 < m < e 1 H , π e H * / C 2 < 0 ; when m > e 1 H , π e H * / C 2 > 0 ; when m < e 1 m , π e H * / m < 0 ; and when m > e 1 m , π e H * / m > 0 . π e H * / k < 0 , where
e 1 H = ( ( ( 1732 k 4 2016 k 3 + 828 k 2 144 k + 9 ) C 2 4 + ( 1920 k 4 + 2496 k 3 1080 k 2 + 192 k 12 ) C 2 3 + ( 112 k 4 576 k 3 + 328 k 2 64 k + 4 ) C 2 2 + 256 k 2 ( k 1 / 4 ) 2 C 2 + 16 k 4 ) 1 / 2 + ( 42 k 2 + 24 k 3 ) C 2 2 + ( 24 k 2 16 k + 2 ) C 2 + 4 k 2 ) / 8 k 2 C 2
e 1 m = ( ( 14 k 2 + 8 k 1 ) C 2 2 + ( 12 k 2 8 k + 1 ) C 2 + 4 k 2 ) / 4 k 2 C 2 .
Proposition 9 indicates that as C2, k, and m increase, not only will the manufacturer’s reduction cost increase, but consumer demand will also decrease due to the increase in C2, thereby directly reducing the manufacturer’s profit. For the new retailer, its profit decreases with the increase in k, but when m is within varying threshold ranges, m and C2 will affect the new retailer’s optimal profit to different extents. This highlights the importance of context-specific cost control and pricing flexibility in hybrid low-carbon retail strategies.

Sales Model Comparison Analysis

First, the optimal pricing decision-making under varying models are analyzed. By comparing the optimal solutions under the package self-pickup model, nearby delivery model, and hybrid model, the following propositions can be obtained:
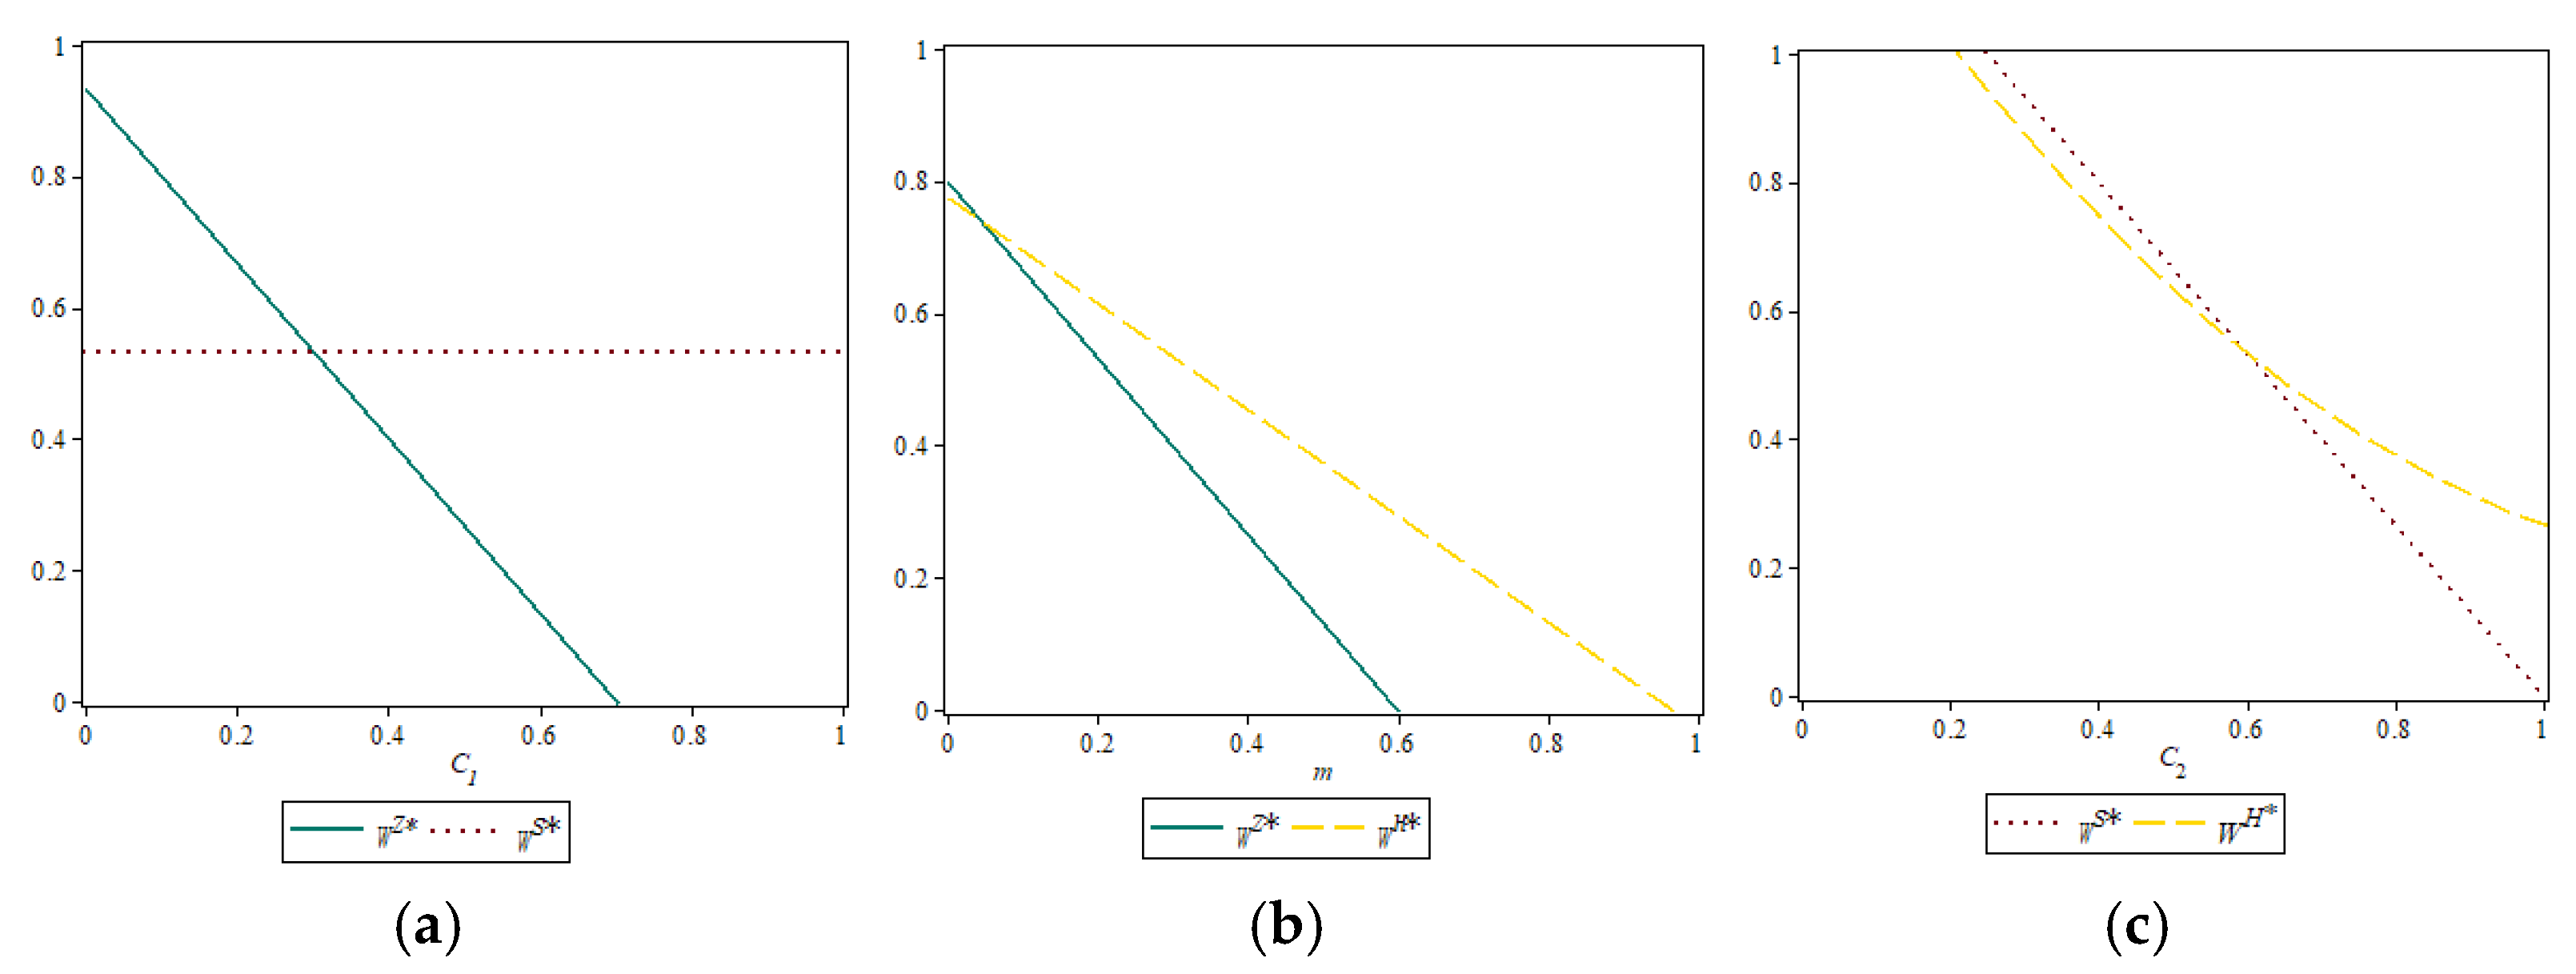
Proposition 10. 
In the three sales models, the relationship between the new retailer’s optimal sales prices is the following: (1) When  C 1 < C 2 m ( k 1 ) 3 k ,  P S * > P Z * ; otherwise, the situation is reversed. (2) When  C 2 < 2 m ( k 1 ) 3 k ,  P S * > P H * ; otherwise, the situation is reversed. (3) When  m > 3 k ( C 2 2 + 2 C 1 2 C 2 ) 2 ( k C 2 C 2 k + 1 ) , P Z * < P H * ; otherwise, the situation is reversed.
According to Proposition 10, in the case of C1 being below a certain threshold, the nearby delivery model is accompanied by a higher optimal sales price versus the package self-pickup model; in the case of C2 being below a certain threshold, the nearby delivery model is accompanied by a higher optimal sales price versus the hybrid model; in the case of m being above a certain threshold, although the cost of opening the package self-pickup increases, the hybrid model still sets a higher product price compared to the package self-pickup model.
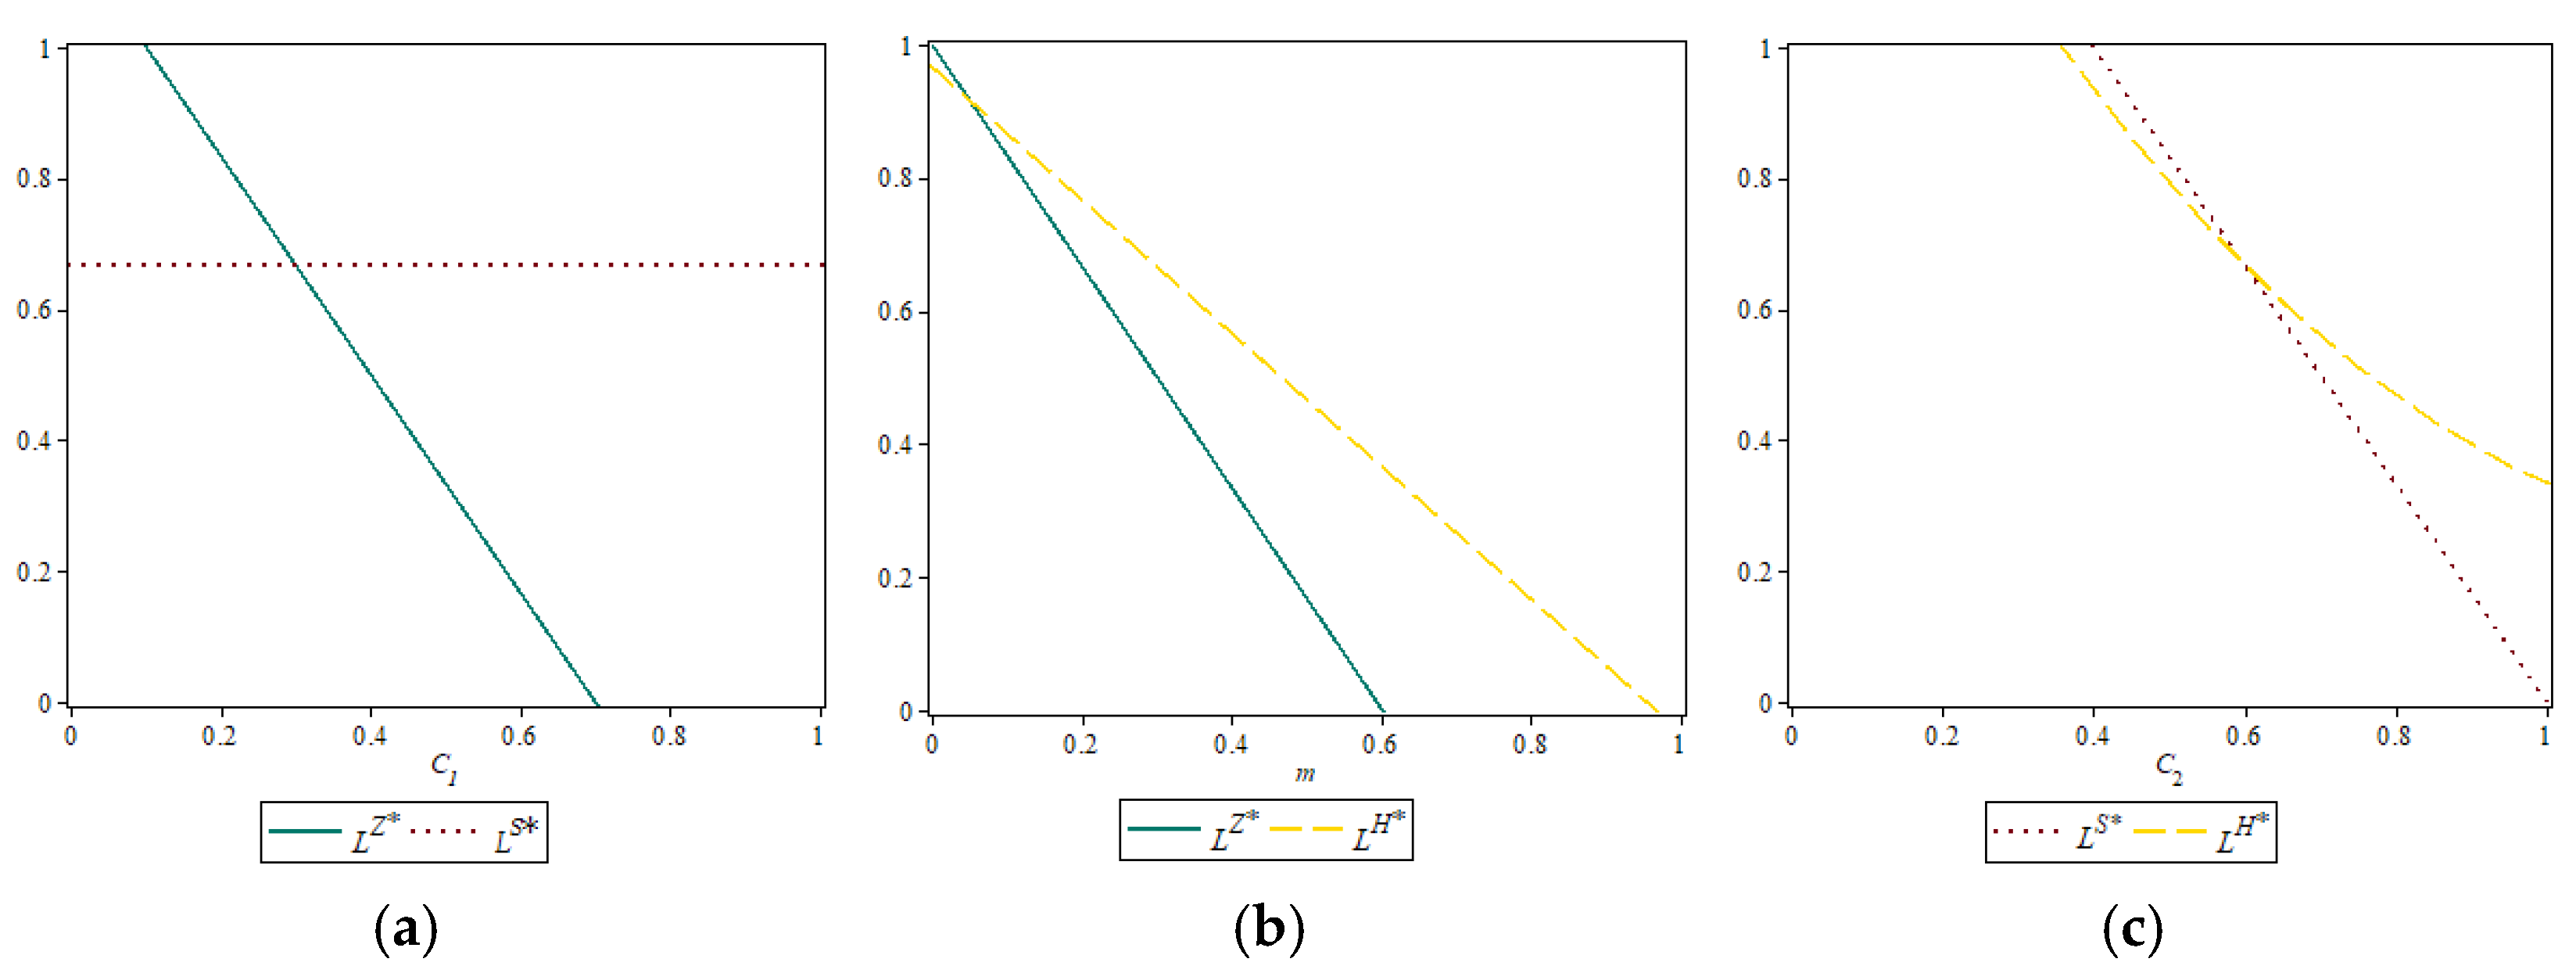
Proposition 11. 
In the three sales models, the relationship between the manufacturer’s emission reductions is as follows: (1) When  C 1 < C 2 m ,  L S * < L Z * ; otherwise, the situation is reversed. (2) When  C 2 < 2 m ,  L S * > L H * ; otherwise, the situation is reversed. (3) When  m > 3 k ( C 2 2 + 2 C 1 2 C 2 ) 2 ( k C 2 C 2 k + 1 ) ,  L Z * < L H * ; otherwise, the situation is reversed.
Proposition 11 indicates that when the consumer’s C1 is below a certain threshold, the package self-pickup model shows a higher manufacturer’s emission reduction versus the nearby delivery model; when C2 is below twice the m, the emission reduction under the nearby delivery model is higher compared to the hybrid model; in the case of m being above a certain threshold, the emission reduction under the package self-pickup model is lower compared to the hybrid model.
Proposition 12. 
In the three sales models, the relationship between the manufacturer’s wholesale prices is as follows: (1) When  C 1 < C 2 m ,  w S * < w Z * ; otherwise, the situation is reversed. (2) When  C 2 < 2 m ,  w S * > w H * ; otherwise, the situation is reversed. (3) When  m > 2 C 2 2 C 1 C 2 2 2 ( 1 C 2 ) ,  w Z * < w H * ; otherwise, the situation is reversed.
Proposition 12 indicates that in the case of C1 being below a certain threshold, the package self-pickup model sets a higher manufacturer’s wholesale price versus the nearby delivery model; when C2 is below twice the m, the wholesale price under the nearby delivery model is lower compared to the hybrid model; with m above a certain threshold, the wholesale price under the package self-pickup model is always lower compared to the hybrid model. These comparative insights offer intuitive guidance for fulfillment model selection based on real-world cost parameters.
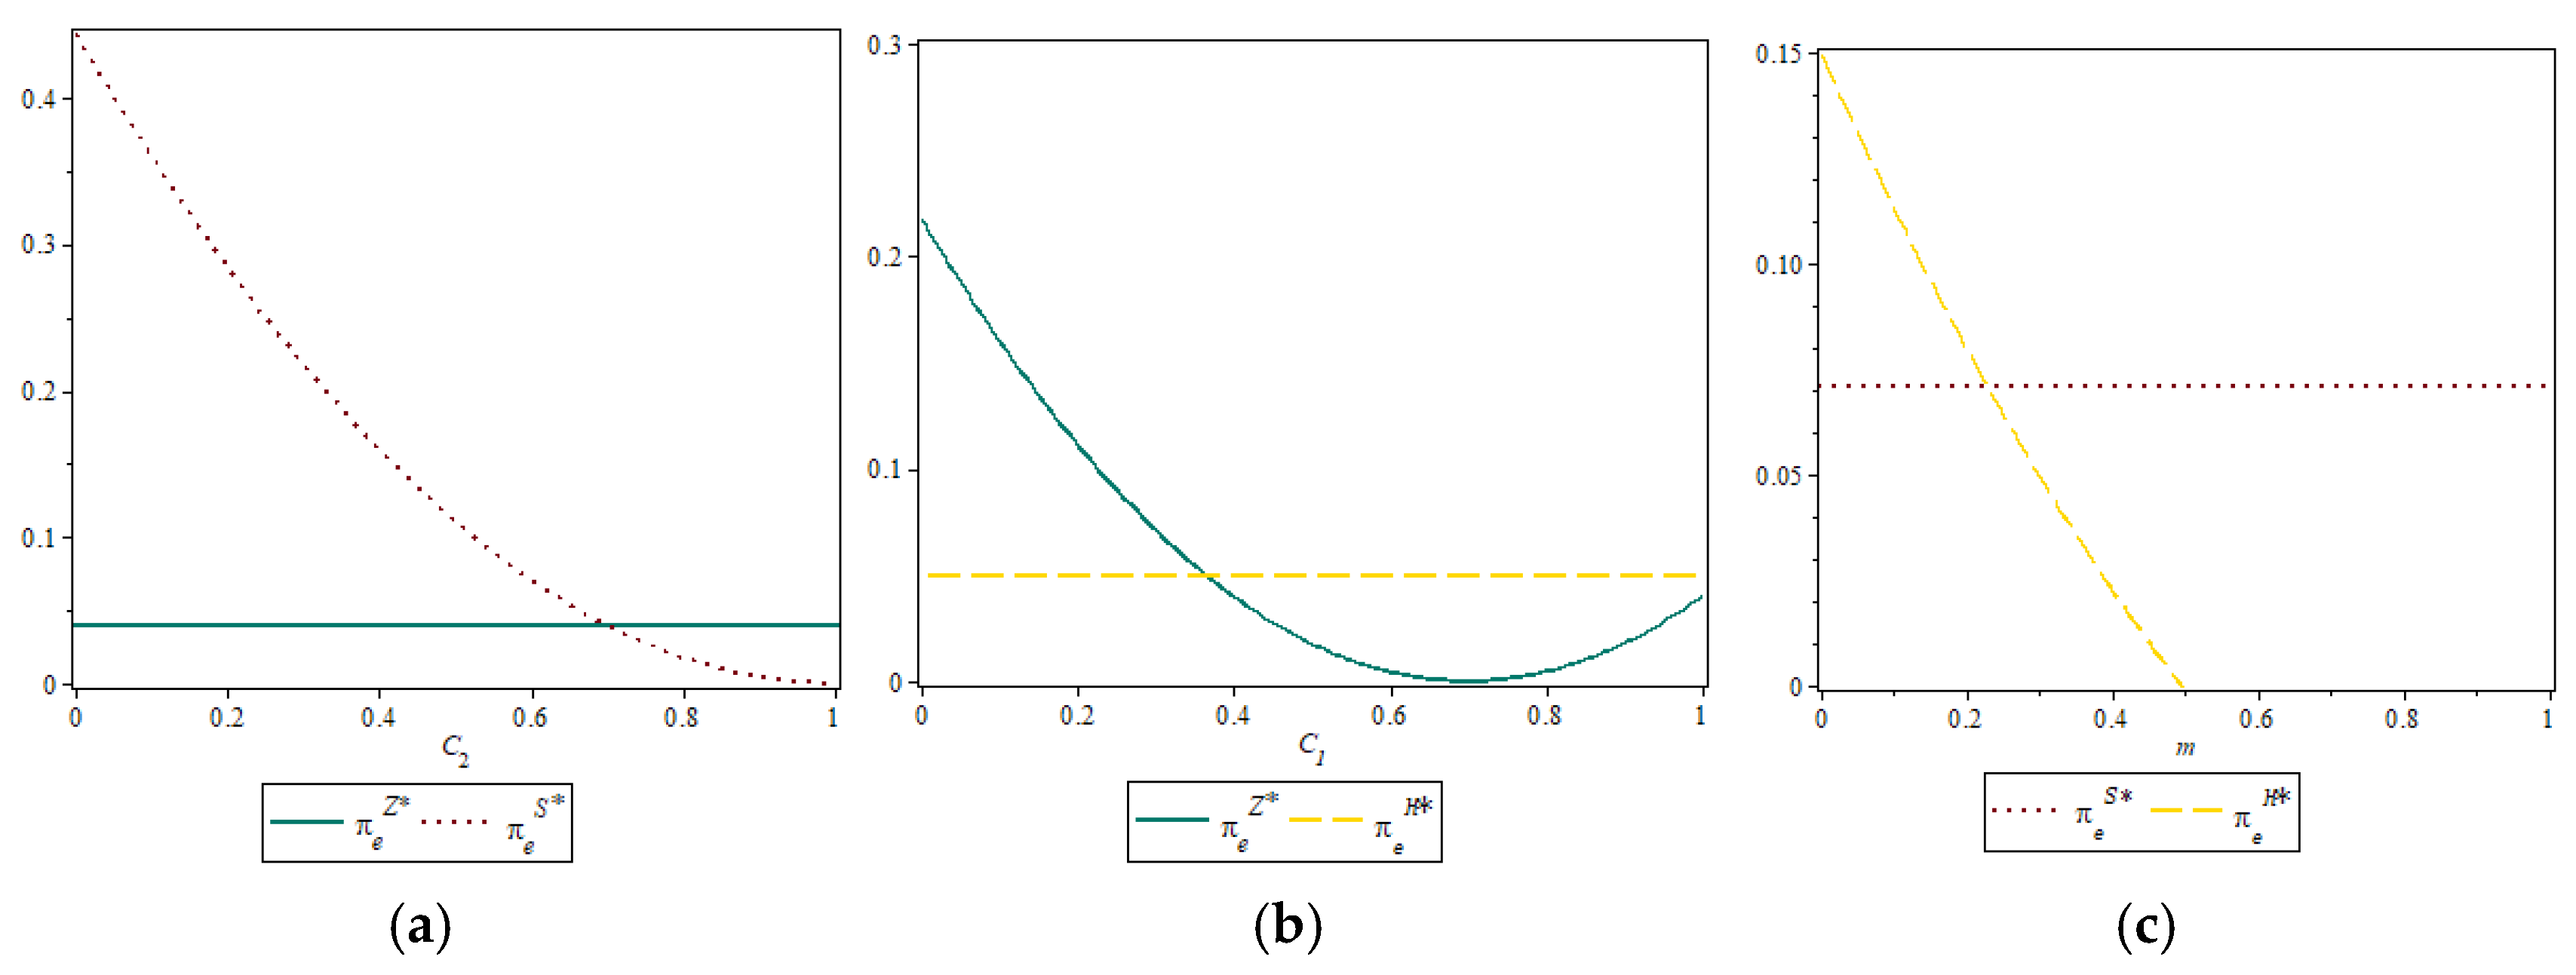
Proposition 13. 
In the three sales models, the relationship between the new retailer’s profits is as follows: (1) As shown in regions III, VIII, X, and X of Figure 3, when  C 1 > C 2 m  and  C 1 < C 1  or  C 1 > C 2 m  and  C 1 > C 1 , always  π e S * > π e Z * > π e H * . (2) As shown in regions XI and VIII of Figure 3, when  C 1 > C 2 m ,  C 1 < C 1   <   C 1  and  m < m  or  C 1 > C 2 m , C1<C1′ and  m > m , always  π e H * > π e S * > π e Z * . (3) As shown in region VI of Figure 3, when  C 1 > C 2 m ,  C 1 < C 1 < C 1  and  m < m < m , always  π e S * > π e H * > π e Z * . (4) As shown in regions IV and V of Figure 3, when  C 1 < C 2 m  and  C 1 < C 1 < C 1 , always  π e H * > π e Z * > π e S * . (5) As shown in Region I of Figure 3, when conditions  C 1 < C 2 m ,  C 1 < C 1  and  m < m  or  C 1 < C 2 m ,  C 1 < C 1  and  m > m  or  C 1 < C 2 m ,  C 1 > C 1  and  m < m  or  C 1 < C 2 m ,  C 1 > C 1  and  m > m  are satisfied, there is always  π e Z * > π e H * > π e S * . (6) As shown in Region II of Figure 3, when conditions  C 1 < C 2 m ,  C 1 < C 1  and  m < m < m  or  C 1 < C 2 m ,  C 1 > C 1  and  m < m < m  are satisfied, there is always  π e Z * > π e S * > π e H * .
where
X = ( ( 4 C 2 2 k 2 m 2 + ( 28 C 2 3 24 C 2 2 8 C 2 ) k 2 + ( 16 C 2 3 + 16 C 2 2 ) k + 2 C 2 3 2 C 2 2 ) m + k 2 ( C 2 2 2 C 2 + 2 ) 2 ) 1 / 2 ;
C 1 = ( 2 k m X + 2 k ) / 2 k ;   C 1 ( 2 k m + X + 2 k ) / 2 k ;
m = ( Y + ( 14 k 2 + 8 k 1 ) C 2 2 + ( 12 k 2 8 k + 1 ) C 2 + 4 k 2 ) / 4 C 2 k 2 ;
m = ( Y + ( 14 k 2 + 8 k 1 ) C 2 2 + ( 12 k 2 8 k + 1 ) C 2 + 4 k 2 ) / 4 C 2 k 2 ;   and
Y = 192 ( ( k 2 2 / 3 k + 1 / 12 ) ( C 2 1 ) ( ( k 1 / 4 ) 2 C 2 2 ( k 1 / 4 ) 2 C 2 k 2 / 4 ) ) 1 / 2 .
Proposition 13 indicates that the optimal sales model for the new retailer shifts as the relationship among the logistics cost C2, inconvenience cost C1, and additional processing cost m changes. As illustrated in Figure 3, when the inconvenience cost C1 is below a specific threshold—corresponding to regions I and II—the new retailer maximizes profit by selecting the package self-pickup model. In regions IV, V, VII, and XI, where processing and logistics costs are moderate while inconvenience costs are higher, the hybrid model becomes optimal. In contrast, in regions VI, III, VIII, IX, and X—characterized by higher inconvenience costs and lower logistics and processing costs—the nearby delivery model is the most profitable choice.
These threshold effects reflect realistic trade-offs observed in O2O retail settings. For example, C1 is generally low in densely populated urban areas with well-developed transportation and pickup infrastructure, making self-pickup models viable. In contrast, C2 is higher in suburban and rural regions, where last-mile delivery coverage is sparse or expensive, thereby favoring hybrid or self-pickup models. Additionally, the additional processing cost mmm—including equipment, labor, and shelf organization—varies significantly across retail formats. In fresh food and FMCG retail (e.g., Yonghui Life, Hema Fresh), offline setup costs are moderate due to scale, allowing hybrid models to operate efficiently. When these costs become too high, as in new market entries with limited offline presence, the retailer may pivot toward delivery-dominant models. In sum, empirical patterns from Chinese O2O retail platforms suggest that each model corresponds to specific, observable cost environments. These findings affirm that the conditions described in Proposition 13 are not only theoretically valid but also align with market realities across geographic and operational contexts.

5. Numerical Simulation

To more intuitively demonstrate the impact of inconvenience cost C1, logistics cost C2, additional processing cost m, and emission-reduction cost coefficient k on the optimal decisions and maximum profits of the two members under the package self-pickup model, nearby delivery model, and hybrid model, as well as the comparison among the three models, we adopt numerical simulation for the verification of the model calculations. Assume inconvenience cost C1 = 0.4, logistics cost C2 = 0.6, additional processing cost m = 0.3, and emission-reduction cost coefficient k = 0.4 or k = 1.2.

5.1. Impact of P1 Model on Optimal Decisions and Maximum Profits

From Figure 4a–c, it is observed that under the package self-pickup (P1) model, as inconvenience cost C1 and emission-reduction cost coefficient k increase, the manufacturer’s optimal wholesale price w Z * , unit emission-reduction level L Z * , and the new retailer’s sales price P Z * all decrease. Additionally, both the manufacturer’s and retailer’s profits π m Z * and π e Z * decline.
Moreover, the impact of additional processing cost mmm presents a more nuanced effect. As mmm increases, w Z * , L Z * , π m Z * , and π e Z * consistently decline, while the effect on P Z * depends on the value of k. When 1 / 4 < k < 1 , m decreases with the increase in m; when k > 1 , P Z * increases with the increase in m. These results not only validate Propositions 2 and 3 but also demonstrate the robustness of the conclusions under varying model parameters. This indicates that the model’s strategic implications remain stable across a range of realistic cost configurations, while also revealing key threshold-dependent shifts in pricing behavior. Such sensitivity analyses enhance the interpretability and practical relevance of the model.

5.2. Impact of Relevant Factors on Optimal Decisions and Maximum Profits Under P2 Model

Figure 5a,b show that under the nearby delivery (P2) model, increases in logistics cost C2 and emission-reduction cost coefficient k lead to lower values of w S * , L S * , and P S * and the profits π m S * and π e S * .
These findings confirm Propositions 5 and 6 and further highlight that the delivery cost structure has a proportionally linear effect on both pricing and emission-reduction behaviors. The results remain robust under variations in key parameters, suggesting that the P2 model’s managerial implications are reliable across different logistical environments.

5.3. Impact of Relevant Factors on Optimal Decisions and Maximum Profits Under P3 Model

According to Figure 6a–d, under the hybrid P3 model, as C2, k, and m increase, the manufacturer’s wholesale price w S * and unit emission reduction L S * will both decrease. For the retailer’s price P S * , the impact of mmm again depends on the value of k: when 1 / 4 < k < 1 , P S * decreases with mmm; when k > 1 , P S * increases with m. Regarding profits, π m H * consistently declines with increasing C2, k, and m, while π e H * shows mixed behavior: it declines when mmm is small but may increase with C2 and m. Across all scenarios, a higher emission-reduction cost coefficient k reduces both profits.
These patterns validate Propositions 8 and 9, and the parameter-driven behavioral shifts further reinforce the model’s sensitivity structure and robustness. By revealing how cost dynamics interact with consumer response and emission policies, this section strengthens confidence in the model’s generalizability.

5.4. Comparison of Optimal Decisions and Maximum Profits

According to Figure 7a–c, Figure 8a–c, Figure 9a–c and Figure 10a–c, the numerical simulation confirms that the relative performance of the three fulfillment models (P1, P2, P3) depends on threshold levels of key cost parameters. When the inconvenience cost C1 is low, Model P2 sets a higher sales price than P1; when the logistics cost C2 is low, P2 also exceeds P3 in pricing. However, under high processing cost mmm, P1 exhibits a lower price than P3. In terms of emission reduction, P2 outperforms P1 when C1 is high and outperforms P3 when C2 is low, while P3 achieves a higher emission level than P1 when mmm is high. For wholesale pricing, P2 maintains an advantage over P1 when C1 is high and over P3 when C2 is low; conversely, P3 sets a consistently higher wholesale price than P1 under high mmm. Regarding profit distribution, P1 provides greater profit for the retailer than P2 when C2 is high and greater than P3 when C2 is low. Additionally, P3 outperforms P2 in retailer profit when mmm is relatively low. These results collectively validate Propositions 10–13, illustrating how cost structure thresholds systematically influence pricing, emission reduction, and profit outcomes across different fulfillment strategies.

6. Discussion

This study develops a low-carbon O2O supply chain model involving a manufacturer and a new retailer offering three fulfillment modes: self-pickup, nearby delivery, and hybrid. By embedding emission-reduction efforts into a Stackelberg game framework, the model reveals how fulfillment choices interact with consumer green preferences, service sensitivity, and cost structures, thereby shaping pricing strategies and environmental outcomes.
Results show that the hybrid model outperforms the other two under moderate abatement costs and distance sensitivity, offering higher profits and better emission performance. This confirms the advantages of flexible fulfillment strategies and extends prior research by linking delivery formats directly to sustainability outcomes. However, the effectiveness of fulfillment modes varies with cost structures [37]. High marginal abatement costs reduce the manufacturer’s green investment regardless of channel type, highlighting the critical role of economic constraints in enabling sustainability—echoing Xu et al. [38] on the limits of voluntary abatement in decentralized systems.
The analysis also reveals how fulfillment mode affects profit distribution. Nearby delivery increases the retailer’s bargaining power, while self-pickup shifts logistical costs to consumers, benefiting manufacturers. These findings align with theories of channel power and green investment incentives [39].
For practice, both manufacturers and retailers must jointly consider carbon efficiency and economic trade-offs when designing O2O strategies. Manufacturers should assess not only cost but also carbon transmission across channels, while retailers should align service offerings with consumer green preferences and pricing signals. This dual perspective supports recent calls for integrated, sustainability-oriented channel design [40].
Finally, the study addresses concerns about generalizability by showing that the environmental performance of fulfillment strategies is context-dependent. Achieving green goals requires aligning cost structures, consumer behavior, and channel choices within each operational setting.

7. Conclusions and Management Implications

7.1. Conclusions

Against the backdrop of sustainable consumption and low-carbon economic transition, this paper develops a pricing and emission-reduction model within a green O2O supply chain composed of one manufacturer and one newly established retailer. The retailer may choose among three competing fulfillment strategies—package self-pickup, nearby delivery, and a hybrid of both—each of which affects pricing incentives, carbon-abatement levels, and profit distribution.
The analysis identifies the following three key findings: (1) The choice of fulfillment model (self-pickup, nearby delivery, or hybrid) significantly affects the manufacturer’s emission-reduction level and pricing decision. Higher consumer inconvenience and emission-reduction costs discourage green investment, lowering prices and profits. Thus, fulfillment structure is a strategic lever for balancing sustainability and profitability. (2) The hybrid model does not always dominate. Its advantage emerges only under specific thresholds of logistics cost and processing cost. When consumer needs are diverse and operational costs are well-managed, hybrid fulfillment achieves superior carbon-efficiency and profit, making it the most flexible and robust option. (3) Green preference intensity and distance sensitivity jointly determine the optimal channel configuration. For example, high green preference favors low-emission channels, while high distance sensitivity lowers the appeal of self-pickup. These behavioral factors influence pricing power and profit allocation, calling for demand-driven, differentiated channel strategies.

7.2. Management Implications

This study offers practical guidance for manufacturers and retailers aiming to implement sustainable strategies in green O2O supply chains. By comparing the economic and environmental outcomes of three fulfillment models under varying cost structures, we provide insights into channel selection and collaborative pricing.
First, firms should align their fulfillment strategies with key operational parameters—logistics cost, inconvenience cost, and processing cost. Self-pickup is preferable in areas with convenient access; nearby delivery suits regions with low logistics costs; and hybrid models offer flexibility under demand heterogeneity or cost uncertainty.
Second, retailers should tailor marketing and pricing strategies based on consumer green preferences and distance sensitivity. Tools such as carbon footprint labels, green badges, and loyalty incentives can guide consumers toward low-carbon options, while differentiated pricing can improve green product adoption and profitability.
Finally, in complex and dynamic markets, hybrid fulfillment systems supported by integrated information platforms and agile inventory management can enhance resilience. Such flexibility enables firms to balance carbon goals with economic performance, promoting the long-term evolution of sustainable e-commerce models.

8. Theoretical Implications and Future Study

8.1. Theoretical Implications

This study advances the theory of sustainable O2O supply chains by integrating emission reduction, multi-channel fulfillment, and consumer heterogeneity into a unified Stackelberg game framework. It establishes a direct link between low-carbon operations and channel configuration, offering a novel perspective on how fulfillment formats shape pricing, profitability, and environmental outcomes.
First, the model extends green supply chain theory by capturing the trade-offs between service convenience, environmental cost, and pricing under different O2O configurations. Unlike prior studies that rely on fixed channels or simplified carbon settings, this research highlights the sensitivity of emission decisions to cost structures and consumer-side frictions.
Second, it contributes to the sustainable operations literature by modeling strategic interactions between a manufacturer and a retailer under carbon constraints. The results show that both economic and environmental factors jointly determine equilibrium outcomes, offering new insights into green coordination.
Finally, the identification of threshold effects reveals that the optimal channel choice depends on nonlinear interactions among emission costs, logistics parameters, and consumer utility. This finding challenges static assumptions in existing O2O models and opens avenues for research on adaptive, cost-sensitive channel strategies under uncertainty.

8.2. Limitation and Future Study

This study adopts a deterministic demand structure and assumes zero production cost to focus on the interplay between emission reduction and fulfillment strategies. While this enables analytical clarity, it abstracts from real-world uncertainties such as demand fluctuations and production complexities. Future research could improve the model’s applicability by incorporating stochastic demand, evolving consumer preferences, and positive production costs.
Additionally, the model does not account for recycling or remanufacturing processes commonly seen in real-world O2O systems. Extending the framework to include multi-stage closed-loop operations would enhance its relevance to circular economy practices.
Finally, this study is theoretical in nature and lacks empirical validation. Although benchmark data inform our parameter choices, future work could combine the model with case studies or empirical tests to strengthen its practical relevance and external validity.

Author Contributions

Original draft, Y.L.; conceptualization, Y.L. and T.L.; review and editing, Y.L. and Y.G. All authors have read and agreed to the published version of the manuscript.

Funding

This research was funded by the National Social Science Foundation of China (grant number: 23BTJ040).

Institutional Review Board Statement

Not applicable.

Informed Consent Statement

Not applicable.

Data Availability Statement

No new data were created or analyzed in this study. Data sharing is not applicable to this article.

Conflicts of Interest

The authors declare no conflicts of interest.

Appendix A

Appendix A.1. Package Self-Pickup Model (P1)

In the package self-pickup model, consumers need to incur C1, and the new retailer needs to incur m. Let d1, C, and w denote the total market demand, the manufacturer’s cost through emission reduction, and the product’s wholesale price, respectively. To simplify the analysis without affecting the research conclusions, we assume the manufacturer’s production cost at zero. Hence, the manufacturer’s profit function is as follows:
π m Z = w d 1 C
For the new retailer, the sales price of the product is P, so the new retailer’s profit function is the following:
π e Z = ( P w m ) d 1
Substituting Equation (1) into Equations (A1) and (A2), respectively, we can further get the following profit functions for the two parties:
π m Z = w ( 1 P + L C 1 ) 1 2 k L 2
π e Z = ( P w m ) ( 1 P + L C 1 )
Backward induction method is used. First, determine the product price P decided by the new retailer. Take the first-order partial derivative of Equation (A4) against P and set it to zero, yielding π e Z P = 1 2 P + L C 1 + w = 0 . Second, we obtain 2 π e Z P 2 = 2 < 0 ; thus, π e Z is a convex function regarding P. From this, it can be derived that
P Z = 1 + L C 1 + w 2
Substitute Equation (A5) into Equations (A3) and (A4). To ensure that π m Z is a convex function regarding L and w, the Hessian matrix k 1 / 2 1 / 2 1 must be negative definite. Solving these yields, k > 1 4 . Taking the first-order partial derivatives of the equation against L and w and setting them to zero, we can obtain the following:
w Z * = 2 k ( C 1 + m 1 ) 4 k 1
L Z * = C 1 + m 1 4 k 1
Substituting Equations (A6) and (A7) into Equation (A4) yields
P Z * = k ( m 3 C 1 + 3 ) m 4 k 1
Substituting Equations (A6)–(A8) into Equations (A3) and (A4) yields
π m Z * = k ( C 1 + m 1 ) 2 8 k 2
π e Z * = k 2 ( C 1 + m 1 ) 2 ( 4 k 1 ) 2
From this, Proposition 1 is derived.

Appendix A.2. Nearby Delivery Model (P2)

In the nearby delivery model, consumers need to pay C2, the total market demand is d2, and the manufacturer’s cost through emission reduction is C. The product’s wholesale price is w. For simplifying the analysis without affecting the research conclusions, we assume that the manufacturer’s production cost is zero. The manufacturer’s profit function is
π m S = w d 2 C
The new retailer will also pay an additional processing cost for each unit product m, and the product’s sales price is P. Here, the new retailer’s profit function is
π e S = ( P w ) d 2
Substituting Equation (4) into Equations (A11) and (A12), respectively, helps to acquire the profit functions for the two members as
π m S = w ( 1 P + L C 2 ) 1 2 k L 2
π e S = ( P w ) ( 1 P + L C 2 )
Backward induction method is adopted here, first determining the product price P decided by the new retailer. Take the first-order partial derivative of Equation (A4) against P and set it to zero, yielding π e Z P = 1 2 P + L C 1 + w = 0 . Further, we obtain 2 π e Z P 2 = 2 < 0 ; thus, π e Z is a convex function regarding P. From this, it can be derived that
P S = 1 + L C 2 + w 2
Substituting Equation (A15) into Equations (A13) and (A14) ensures that π m S * is a convex function pertaining to L and w; the Hessian matrix must be negative definite. By solving, we can obtain k 1 / 2 1 / 2 1 . Take the first-order partial derivatives of the equation against L and w and set them to zero. Solving together yields the following:
w S * = 2 k ( C 2 1 ) 4 k 1
L S * = C 2 1 4 k 1
Substituting Equations (A16) and (A17) into Equation (A15) yields
P S * = 3 k ( C 2 1 ) 4 k 1
Substituting Equations (A16), (A17) and (A18) into Equations (A13) and (A14) yields
π m S * = k ( C 2 1 ) 2 8 k 2
π e S * = k 2 ( C 2 1 ) 2 ( 4 k 1 ) 2
From this, Proposition 4 is derived.

Appendix A.3. Hybrid Model (P3)

In the hybrid model, the new retailer provides not only the package self-pickup model but also the nearby delivery model. The manufacturer’s profit function is as follows:
π m H = w ( d 3 + d 4 ) C
The new retailer’s profit function is as follows:
π e H = ( P w ) d 3 + ( P w m ) d 4
Substituting Equations (5) and (6) into Equations (A21) and (A22), respectively, enables us to further obtain the profit functions for the two parties as
π m H = w ( ( 1 P + L C 2 ) ( 1 C 2 ) + 1 2 C 2 ( 2 2 P + 2 L C 2 ) ) 1 2 k L 2
π e H = ( P w ) ( 1 P + L C 2 ) ( 1 C 2 ) + ( P w m ) 1 2 C 2 ( 2 2 P + 2 L C 2 )
Backward induction method is adopted. First, solve for the new retailer’s decision on the product price P. Take the first-order partial derivative of Equation (A23) against P and set it to zero, π e H P = ( 1 P + L C 2 ) ( 1 C 2 ) ( P w ) ( 1 C 2 ) + 1 2 C 2 ( 2 2 P + 2 L C 2 ) ( P w m ) C 2 = 0 .
Second, we can obtain 2 π e H P 2 = 2 < 0 ; hence, π e H is a convex function against P. Thus, we can obtain
P H = C 2 2 2 C 2 + 2 L + 2 + 2 w + 2 m C 2 4
Substituting Equation (A25) into Equations (A23) and (A24) to ensure that π m H * is a convex function against p, the Hessian matrix k 1 / 2 1 / 2 1 must be negative definite, which requires k > 1 4 . Taking the first-order partial derivatives of the equation against L and w and setting them to zero, solving together yields
w H * = k ( C 2 2 2 m C 2 2 C 2 + 2 ) 4 k 1
L H * = C 2 2 2 m C 2 2 C 2 + 2 8 k 2
Substituting Equations (A26) and (A27) into Equation (A25) yields
P H * = ( 6 + 3 C 2 2 + ( 2 m 6 ) C 2 ) k 2 m C 2 8 k 2
Substituting Equations (A26)–(A28) into Equations (A23) and (A24) yields
π m H * = k ( C 2 2 + 2 m C 2 + 2 C 2 2 ) 2 32 k 8
π e H * = C 2 4 k 2 + ( ( 28 m 4 ) k 2 16 m k + 2 m ) C 2 3 + ( ( 4 m 2 24 m + 8 ) k 2 + 16 m k 2 m ) C 2 2 8 k 2 ( m + 1 ) C 2 + 4 k 2 4 ( 4 k 1 ) 2
From this, Proposition 7 is derived.

References

  1. Acimovic, J.; Graves, S.C. Mitigating spillover in online retailing via replenishment. Manuf. Serv. Oper. Manag. 2017, 19, 419–436. [Google Scholar] [CrossRef]
  2. Ji, J.; Zhang, Z.; Yang, L. Comparisons of initial carbon allowance allocation rules in an O2O retail supply chain with the cap-and-trade regulation. Int. J. Prod. Econ. 2017, 187, 68–84. [Google Scholar] [CrossRef]
  3. Iacobuţă, G.I.; Höhne, N.; van Soest, H.L.; Leemans, R. Transitioning to low-carbon economies under the 2030 agenda: Minimizing trade-offs and enhancing co-benefits of climate-change action for the sdgs. Sustainability. 2021, 13, 10774. [Google Scholar] [CrossRef]
  4. Wang, Q.; Zhang, F.; Li, R.; Sun, J. Does artificial intelligence facilitate the energy transition and curb carbon emissions? The role of trade openness. J. Clean. Prod. 2024, 447, 141298. [Google Scholar] [CrossRef]
  5. Zhu, L.; Li, H. Workstation layout strategies in robotic mobile fulfillment systems considering carbon emissions. CLSCN 2022, 4, 100050. [Google Scholar] [CrossRef]
  6. Ekren, B.Y.; Perotti, S.; Foresti, L.; Prataviera, L. Enhancing e-grocery order fulfillment: Improving product availability, cost, and emissions in last-mile delivery. Electron Commer Res. 2024, 25, 2417–2455. [Google Scholar] [CrossRef]
  7. Huang, Z.H.; Huang, W.L.; Guo, F. Integrated sustainable planning of self-pickup and door-to-door delivery service with multi-type stations. Comput. Ind. Eng. 2019, 135, 412–425. [Google Scholar] [CrossRef]
  8. Wang, C.; Wang, Y.; Wang, J.; Xiao, J.; Liu, J. Factors influencing consumers’ purchase decision-making in o2o business model: Evidence from consumers’ overall evaluation. J. Retail. Consum. Serv. 2021, 61, 102565. [Google Scholar] [CrossRef]
  9. Dai, H.; Ge, L.; Li, C.; Wen, Y. The interaction of discount promotion and display-related promotion on on-demand platforms. Inf. Syst. e-Bus. Manag. 2021, 20, 285–302. [Google Scholar] [CrossRef]
  10. Noori Daryan, M.; Allah, T.A.; Aickelin, U. Time-sensitive cancellation refund in advance booking: Effect of online-too-ff line marketing policy. Comput. Ind. Eng. 2023, 183, 109445. [Google Scholar] [CrossRef]
  11. Geng, X.; Tan, Y.R.; Wei, L. How add-on pricing interacts with distribution contracts. Prod. Oper. Manag. 2018, 27, 605–623. [Google Scholar] [CrossRef]
  12. Taleizadeh, A.A.; Rebie, N.; Yue, X.; Daryan, M.N. Pricing decisions through O2O commerce in a closed-loop green supply network and logistics under return and cooperative advertising policies. Comput. Ind. Eng. 2023, 183, 109539. [Google Scholar] [CrossRef]
  13. Pu, S.; Xia, C. Exact approach for integrated delivery optimization of e-commerce and online-to-offline parcels. Asia-Pac. J. Oper. Res. 2022, 40, 2250026. [Google Scholar] [CrossRef]
  14. Li, B.; Geng, Y.; Xia, X.; Qiao, D. The impact of government subsidies on the low-carbon supply chain based on carbon emission reduction level. Int. J. Environ. Res. Public Health 2021, 18, 7603. [Google Scholar] [CrossRef]
  15. Choi, S.-B.; Dey, B.K.; Sarkar, B. Retailing and servicing strategies for an imperfect production with variable lead time and backorder under Online-To-Offline environment. J. Ind. Manag. Optim. 2023, 19, 4804–4843. [Google Scholar] [CrossRef]
  16. Xing, P.; Yao, J.; Wang, M. Quality effort strategy of O2O takeout service supply chain under three operation modes. Complexity 2022, 2022, 8177186. [Google Scholar] [CrossRef]
  17. He, Z.; Cheng, T.C.E.; Dong, J.; Wang, S. Evolutionary location and pricing strategies for service merchants in competitive O2O markets. Eur. J. Oper. Res. 2016, 254, 595–609. [Google Scholar] [CrossRef]
  18. Guo, F.; Yang, Z.; Qin, W.; Wang, Y.; Chen, S. Optimising O2O supply chain strategies through cost-sharing contracts: Strategic analysis and empirical insights. Eng. Manag. Syst. Eng. 2024, 3, 183–198. [Google Scholar] [CrossRef]
  19. He, J.; Huang, X.; Jiang, X.; Gao, Y. An incentive theory of green supply chain finance. Int. J. Prod. Res. 2024, 1–23. [Google Scholar] [CrossRef]
  20. Zhao, L.; Jin, S.; Jiang, H. Investigation of complex dynamics and chaos control of the duopoly supply chain under the mixed carbon policy. Chaos Solitons Fractals 2022, 164, 112492. [Google Scholar] [CrossRef]
  21. Song, C.; Xu, B.; Xu, L. Dual-channel supply chain pricing decisions for low-carbon consumers: A review. J. Intell. Manag. Decis. 2023, 2, 57–65. [Google Scholar] [CrossRef]
  22. Zhang, Z.; Yu, L. Dynamic optimization and coordination of cooperative emission reduction in a dual-channel supply chain considering reference low-carbon effect and low-carbon goodwill. Int. J. Environ. Res. Public Health 2021, 18, 539. [Google Scholar] [CrossRef]
  23. Lu, Z.; Bai, L.; Wang, J.; Wei, J.; Xiao, Y.; Chen, Y. Peer-To-Peer Joint Electricity and Carbon Trading Based on Carbon-Aware Distribution Locational Marginal Pricing. IEEE Trans. Power Syst. 2023, 38, 835–852. [Google Scholar] [CrossRef]
  24. Cai, J.; Jiang, F. Decision models of pricing and carbon emission reduction for low-carbon supply chain under cap-and-trade regulation. Int. J. Prod. Econ. 2023, 264, 108964. [Google Scholar] [CrossRef]
  25. Xu, L.; Wang, C. Sustainable manufacturing in a closed-loop supply chain considering emission reduction and remanufacturing. Resour. Conserv. Recycl. 2018, 131, 297–304. [Google Scholar] [CrossRef]
  26. Ghosh, D.; Shah, J. Supply chain analysis under green sensitive consumer demand and cost sharing contract. Int. J. Prod. Econ. 2015, 164, 319–329. [Google Scholar] [CrossRef]
  27. Chouhan, V.K.; Khan, S.H.; Hajiaghaei-Keshteli, M. Hierarchical tri-level optimization model for effective use of by-products in a sugarcane supply chain network. Appl. Soft Comput. 2022, 128, 109468. [Google Scholar] [CrossRef]
  28. He, L.; Wang, H.; Liu, F. Emission abatement in low-carbon supply chains with government subsidy and information asymmetry. Int. J. Prod. Res. 2024, 62, 6598–6626. [Google Scholar] [CrossRef]
  29. Jain, R.; Mittal, M.; Mangla, S.K.; Baraiya, R. Optimizing supply chain strategies for deteriorating items and imperfect manufacturing under carbon emission regulations. Comput. Ind. Eng. 2023, 182, 109350. [Google Scholar] [CrossRef]
  30. Eslamipoor, R.; Sepehriyar, A. Promoting green supply chain under carbon tax, carbon cap and carbon trading policies. Bus. Strategy Environ. 2024, 33, 4901–4912. [Google Scholar] [CrossRef]
  31. Cheng, Y.; Zhang, P. Pricing Strategy and Coordination in an O2O Mixed Channel Supply Chain with Carbon Cap-and-Trade Mechanism. In Proceedings of the 2017 36th Chinese Control Conference (CCC), Dalian, China, 26–28 July 2017. [Google Scholar]
  32. Chai, L.; Wang, Y. Exploring the sustainable usage intention of BOPS: A perspective of channel integration quality. Sustainability 2022, 14, 14114. [Google Scholar] [CrossRef]
  33. Lemon, K.N.; Verhoef, P.C. Understanding customer experience throughout the customer journey. J. Mark. 2016, 80, 69–96. [Google Scholar] [CrossRef]
  34. Gao, F.; Su, X. Omnichannel retail operations with Buy-Online-and-Pick-up-in-Store. Manag. Sci. 2017, 63, 2478–2492. [Google Scholar] [CrossRef]
  35. d’Aspremont-Lynden, C.; Jacquemin, A. Cooperative and noncooperative R&D in duopoly with spillovers. Am. Econ. Rev. 1988, 78, 1133–1137. [Google Scholar]
  36. Cao, J.; So, K.C.; Yin, S. Impact of an “online-to-store” Channel on demand allocation, pricing and profitability. Eur. J. Oper. Res. 2016, 248, 234–245. [Google Scholar] [CrossRef]
  37. Anokhin, D.; Dehghanian, P.; Lejeune, M.A.; Su, J. Mobility-as-a-service for resilience delivery in power distribution systems. Prod. Oper. Manag. 2021, 30, 2492–2521. [Google Scholar] [CrossRef]
  38. Xu, L.; Wang, C.X.; Li, H. Decision and coordination of low-carbon supply chain considering technological spillover and environmental awareness. Sci. Rep. 2017, 7, 3107. [Google Scholar] [CrossRef] [PubMed]
  39. Williams, N.; Kannan, P.K.; Azarm, S. Retail channel structure impact on strategic engineering product design. Manag. Sci. 2011, 57, 897–914. [Google Scholar] [CrossRef]
  40. Sarkar, B.; Dey, B.K.; Ma, J.H.; Sarkar, M.; Guchhait, R.; Ahn, Y.-H. Does Outsourcing Enhance Consumer Services and Profitability of a Dual-Channel Retailing? J. Retail. Consum. Serv. 2024, 81, 103996. [Google Scholar] [CrossRef]
Figure 1. Research framework.
Sustainability 17 06231 g001
Figure 2. (a) Package self-pickup model; (b) nearby delivery model; (c) hybrid model.
Sustainability 17 06231 g002
Figure 3. Diagram of new retailer sales model selection.
Sustainability 17 06231 g003
Figure 4. (a) Relationship between C1 and optimal decisions. (b) Relationship between m and optimal decisions. (c) Relationship between k and optimal decisions.
Sustainability 17 06231 g004
Figure 5. (a) Relationship between C2 and optimal decisions. (b) Relationship between k and optimal decisions.
Sustainability 17 06231 g005
Figure 6. (a) Relationship between C2 and optimal decisions. (b) Relationship between C2 and optimal decisions. (c) Relationship between m and optimal decisions. (d) Relationship between k and optimal decision.
Sustainability 17 06231 g006aSustainability 17 06231 g006b
Figure 7. (a) Comparison between w Z * and w S * . (b) Comparison between w Z * and w H * . (c) Comparison between w S * and w H * .
Sustainability 17 06231 g007
Figure 8. (a) Comparison between P Z * and P S * . (b) Comparison between P Z * and P H * . (c) Comparison between P S * and P H * .
Sustainability 17 06231 g008
Figure 9. (a) Comparison between L Z * and L S * . (b) Comparison between L Z * and L H * . (c) Comparison between L S * and L H * .
Sustainability 17 06231 g009
Figure 10. (a) Comparison between π e Z * and π e S * . (b) Comparison between π e Z * and π e H * . (c) Comparison between π e S * and π e H * .
Sustainability 17 06231 g010
Disclaimer/Publisher’s Note: The statements, opinions and data contained in all publications are solely those of the individual author(s) and contributor(s) and not of MDPI and/or the editor(s). MDPI and/or the editor(s) disclaim responsibility for any injury to people or property resulting from any ideas, methods, instructions or products referred to in the content.

