


Spatial–Temporal Restructuring of Regional Landscape Patterns and Associated Carbon Effects: Evidence from Xiong’an New Area

Abstract
1. Introduction
2. Materials and Methods
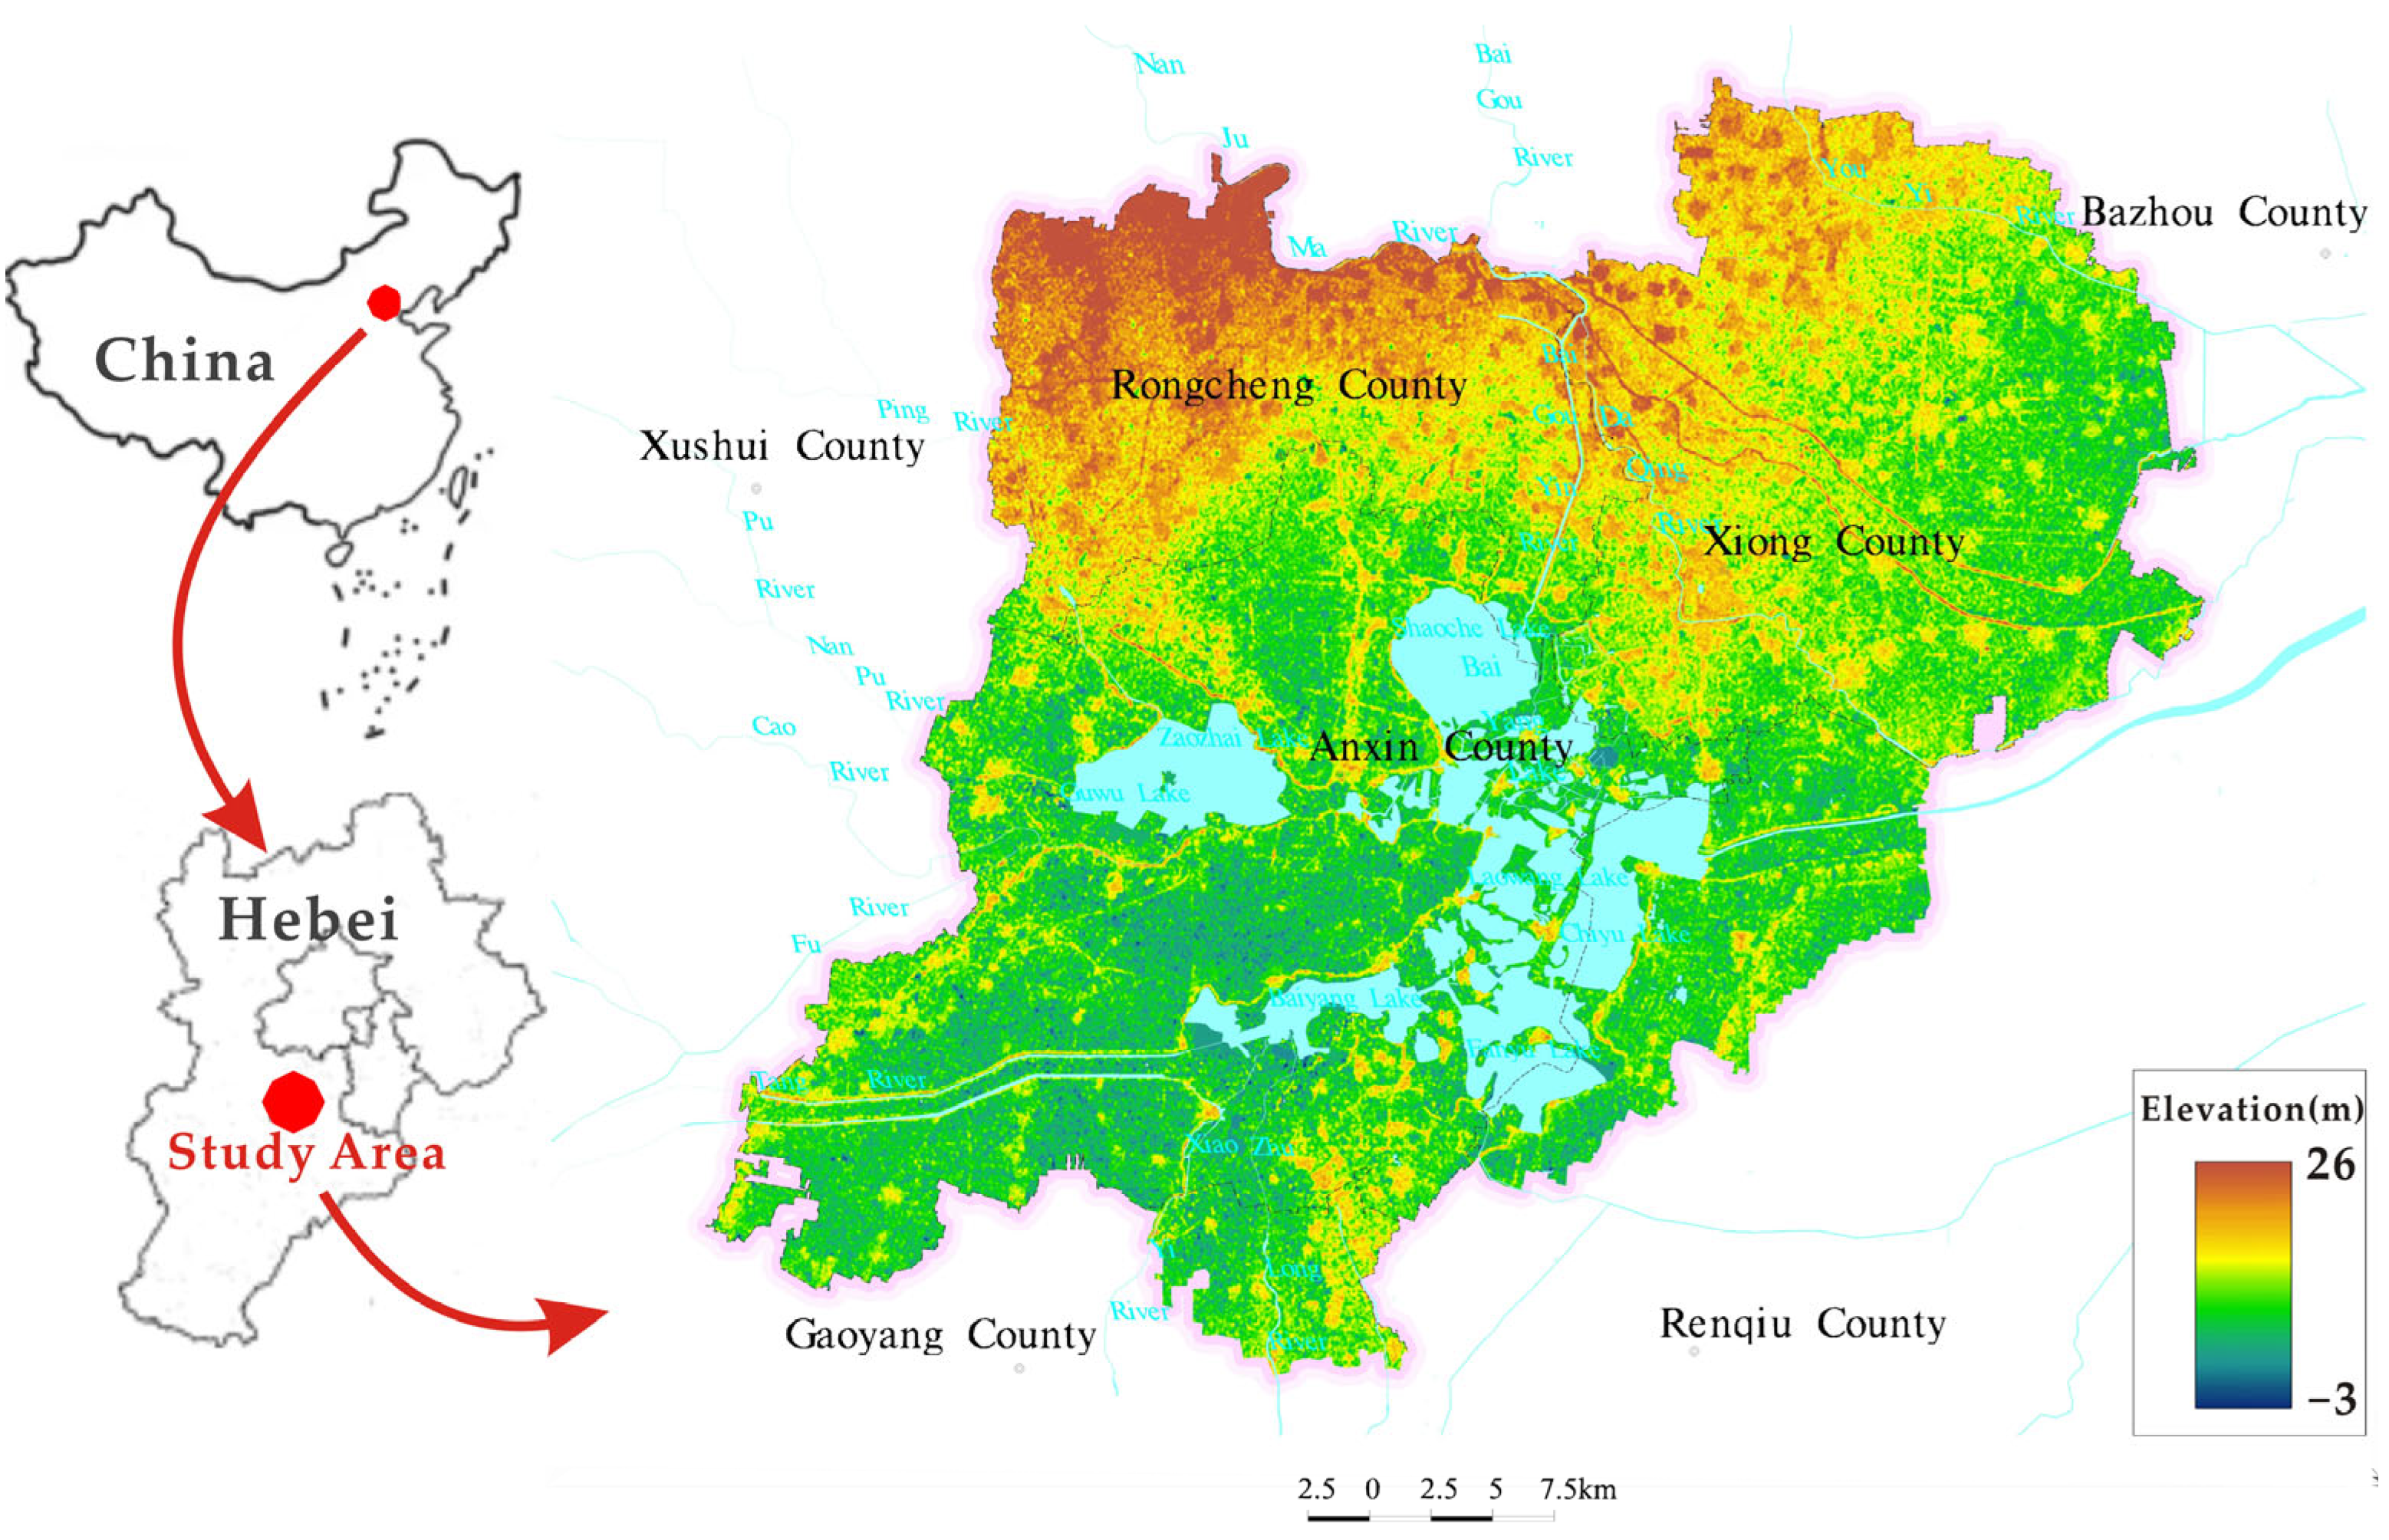
2.1. Study Area
2.2. Data Sources
2.3. Land Spatial Classification System
2.4. Transition Matrix
2.5. Carbon Emission Measurement of Land Use
3. Results
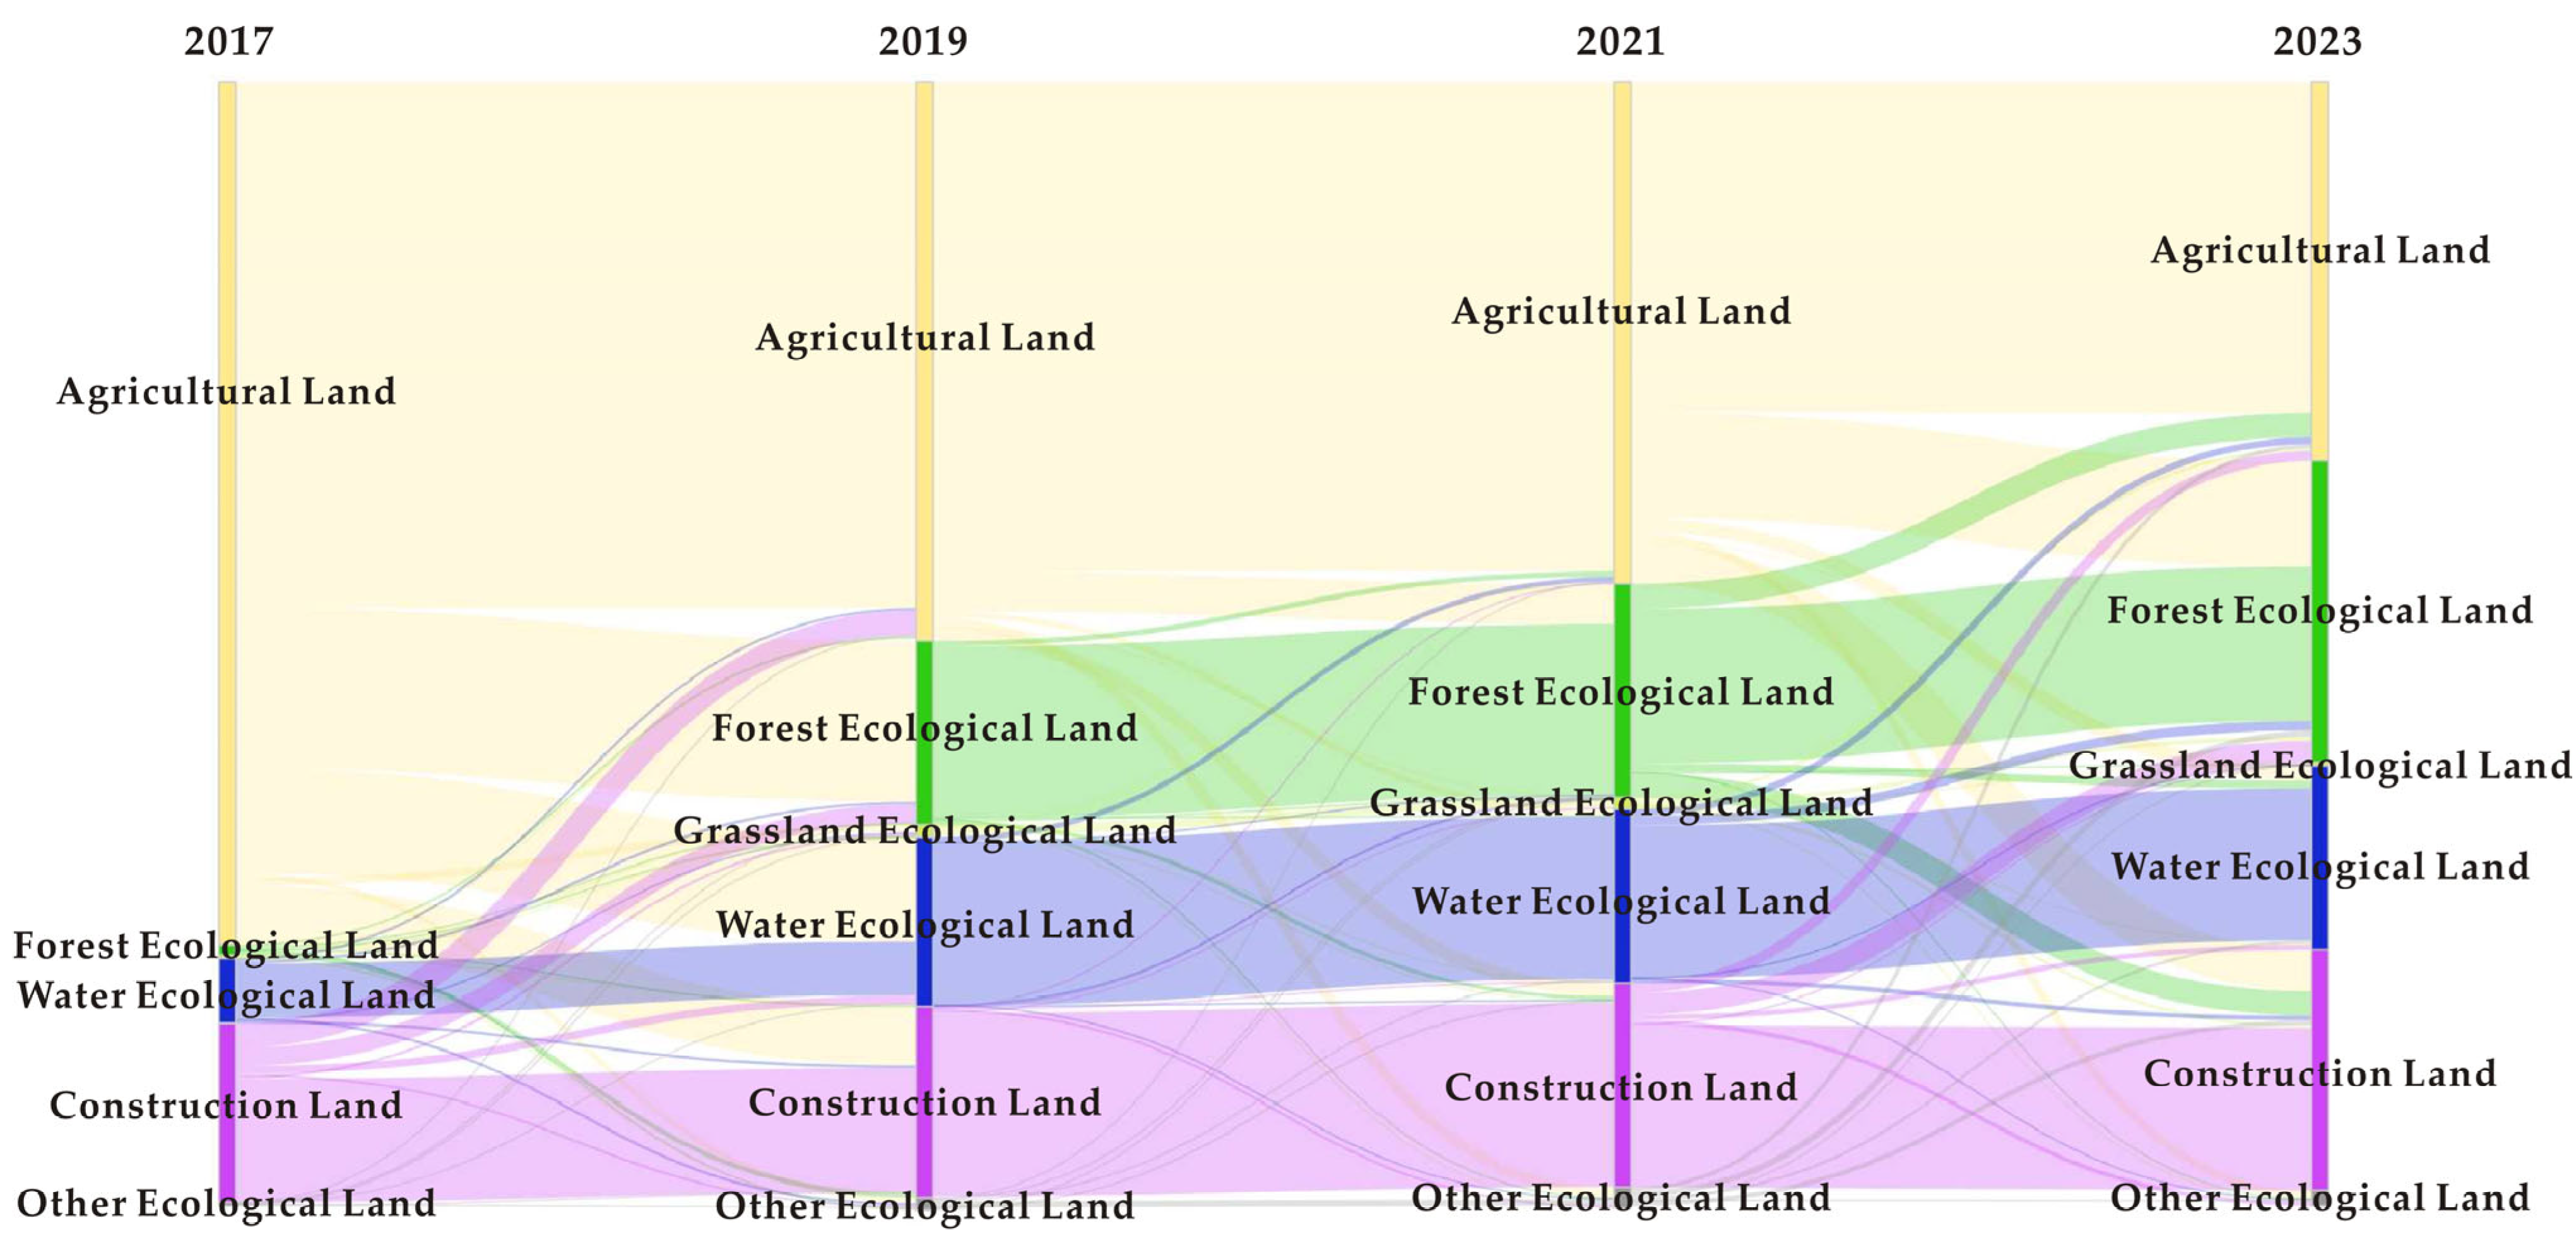
3.1. Analysis of Land Use Change Characteristics in Xiongan from 2017 to 2023
- The scale and structure of land use have undergone drastic adjustments. First, the rapid shrinkage of arable land is evident: the agricultural land area decreased from 876.54 km2 in 2017 to 597.89 km2 in 2023, representing a 31.80% decline. The period 2017–2019 witnessed the most rapid loss, with an average annual decrease of 41.5 km2, primarily converted to construction land and water ecological land. Between 2019 and 2021, there was explosive growth, averaging an annual increase of 28.6 km2. After 2021, the growth rate decelerated and shifted toward the construction of high-end industrial parks.
- The reconstruction of the ecological land network progressed in two primary aspects. Firstly, the quality of the forestland ecosystem was enhanced, with its area expanding from 287.5 km2 to 475.14 km2, primarily attributed to the “Millennium Xiulin” Project and the development of the urban green space system. Secondly, the restoration of the water wetland system achieved significant outcomes: the Baiyangdian Treatment Project maintained the water ecological land area within the range of 264–290 km2, while the wetland area expanded to 366 km2 (Table 3).
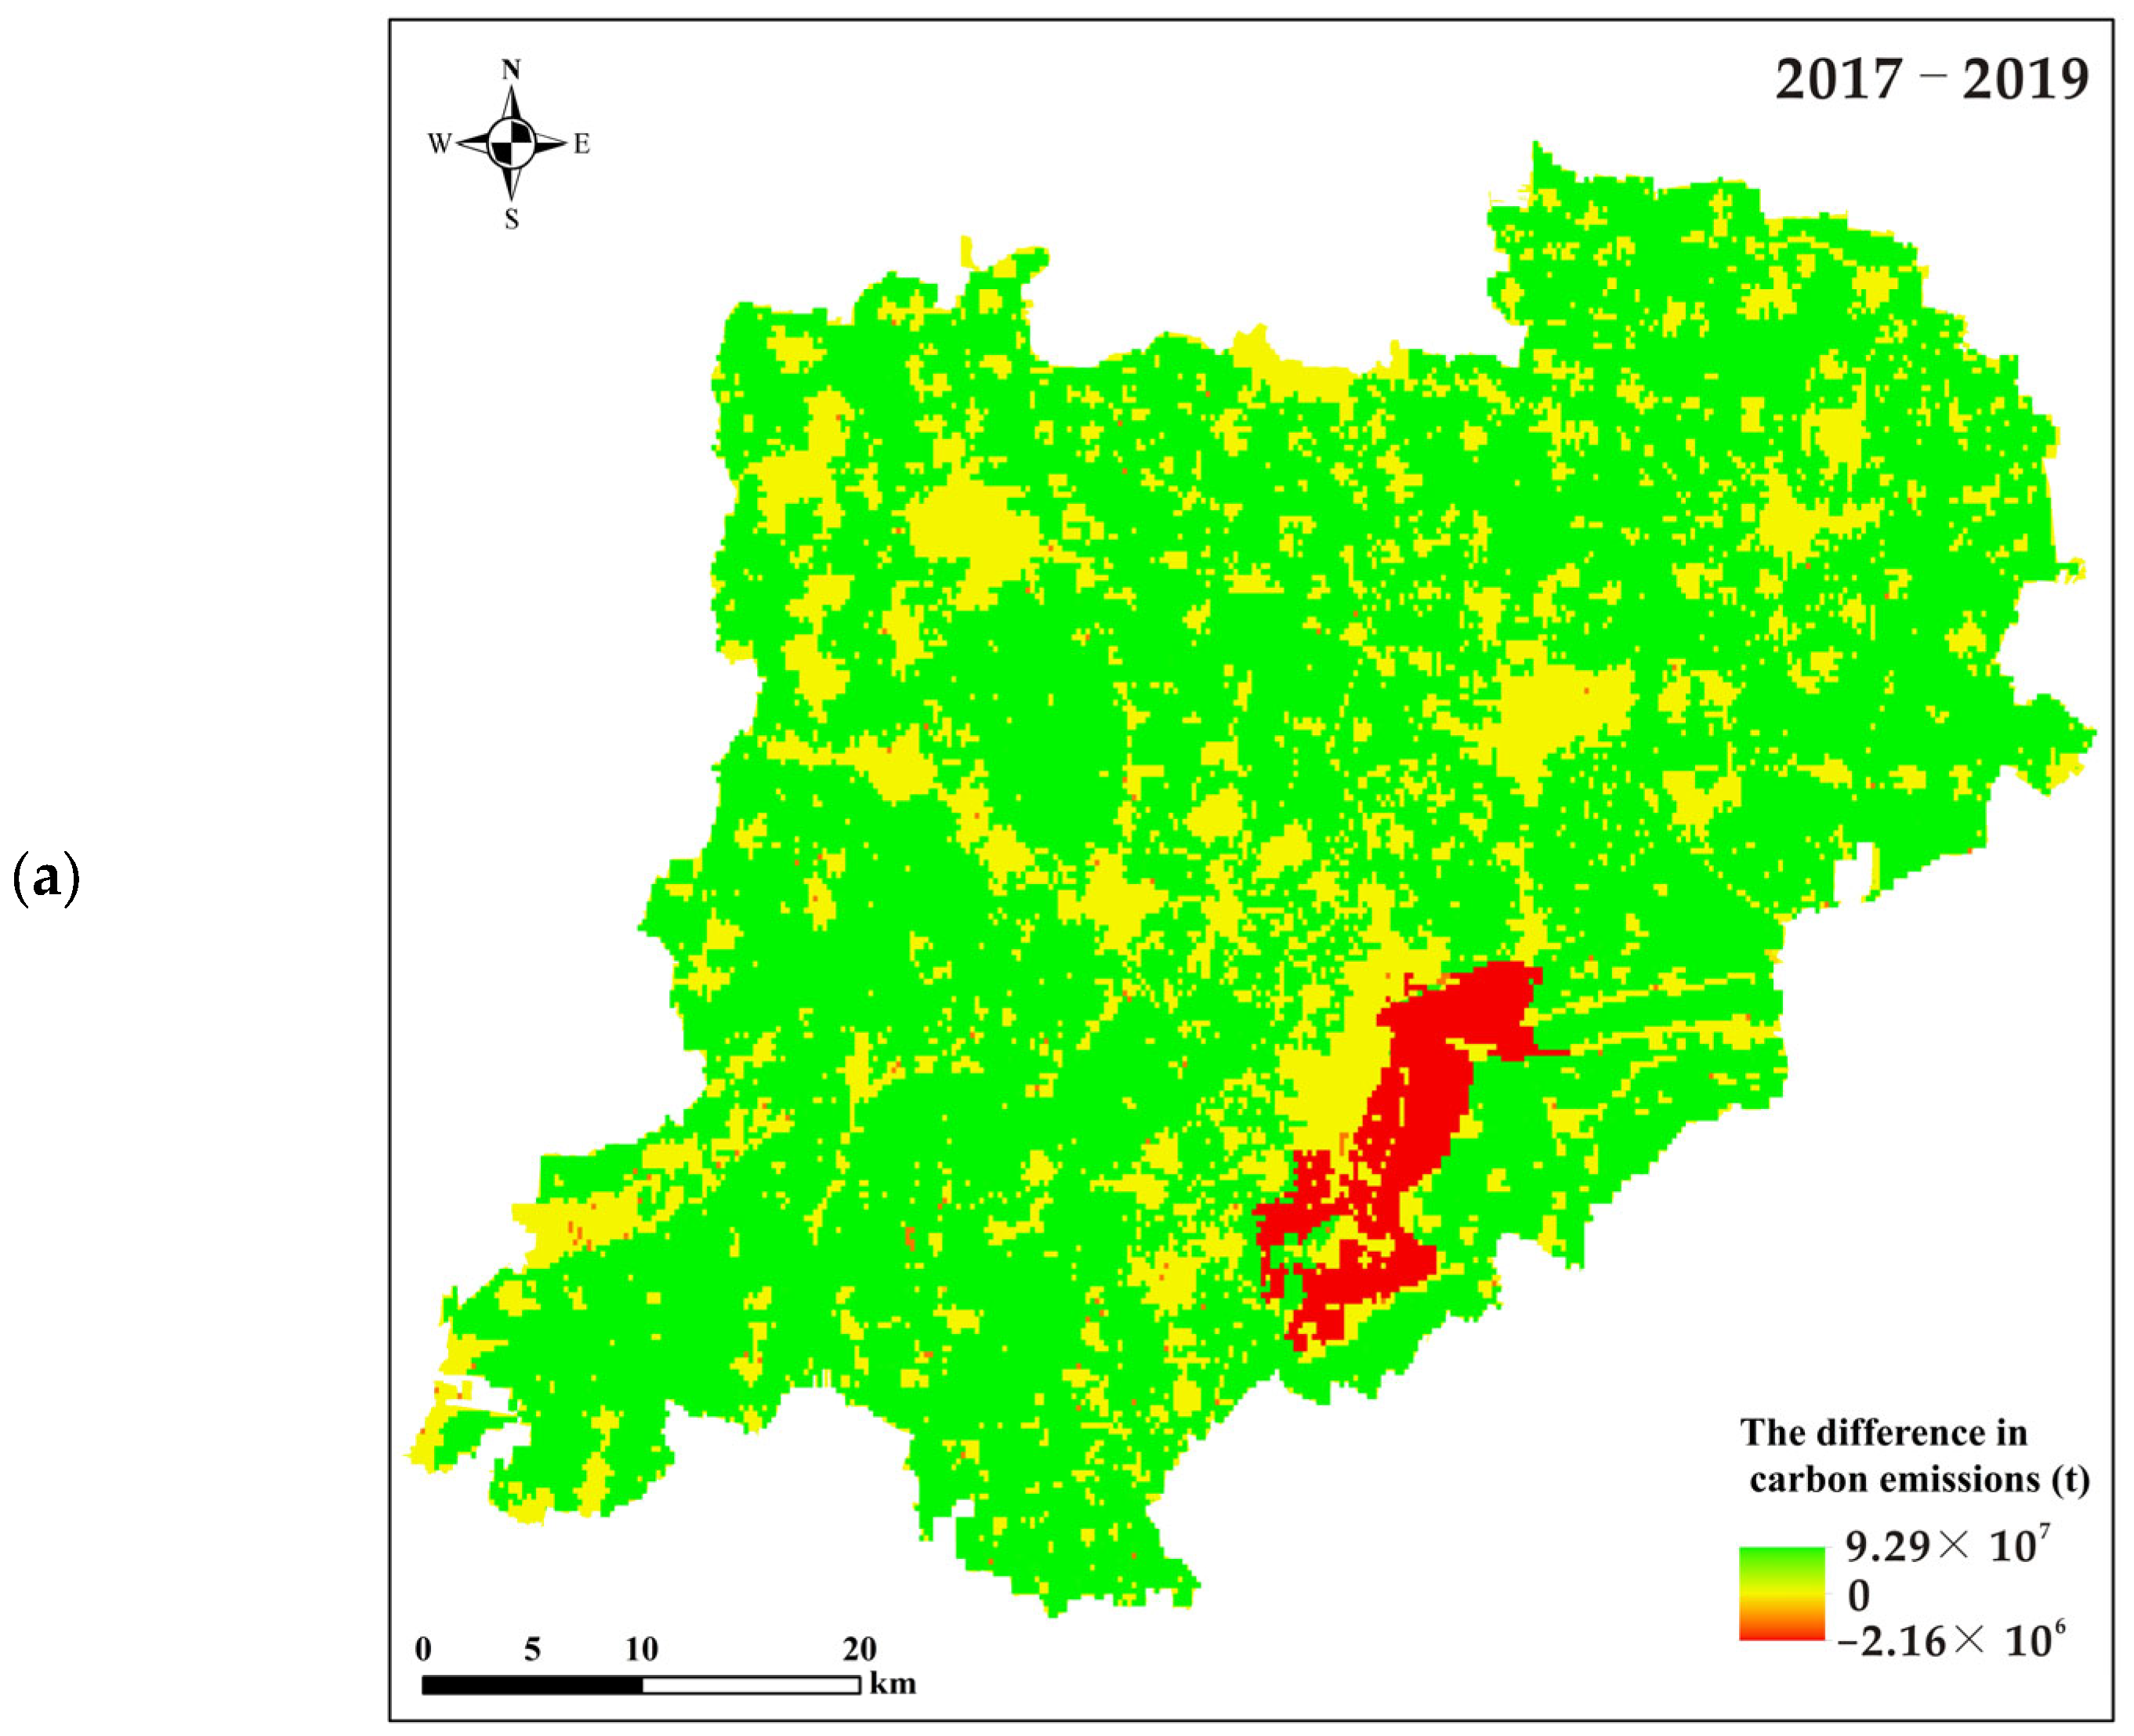
3.2. Analysis of Spatial and Temporal Evolution Characteristics of Carbon Emissions in Xiongan from 2017 to 2023
- Construction land dominated the growth in total carbon emissions, which surged from 281 kt (kilotons) in 2017 to 3322 kt in 2023—a nearly 11-fold increase—with its share of regional total emissions rising from 3% to 87%. This surge was primarily driven by the expansion of the construction land area from 284.50 km2 to 379.10 km2, coupled with industrial aggregation. Notably, despite this substantial growth in emissions, the carbon emission intensity decreased from 988.58 t/km2 to 876.31 t/km2, attributable to energy efficiency improvements and renewable energy integration, as evidenced by Green Building Standards and Operational Energy Efficiency Gains—green building standards cut unit energy use by 28.7% (2021–2023 vs. 2017 baseline), with monitoring platforms reducing lighting/air conditioning energy consumption by 15–20%, lowering operational intensity from 1.25 to 0.89 t/m2 (45% of decline)—and renewable energy integration and energy structure transformation—“BIPV + regional renewable energy stations” increased non-fossil energy in electricity (27–59% by 2023) and heating (12–78%), reducing intensity by 32% [30].
- Carbon emissions from cultivated land continued to shrink, declining from 94,740,000 tons to 25,230,000 tons (a 73.40% decrease). This reduction was directly linked to the contraction of cultivated area from 1380.60 km2 to 597.90 km2. However, the carbon emission intensity remained stable at 42,200 tons/km2, indicating that the promotion of low-carbon agricultural technologies is insufficient and reliance on traditional farming models persists.
- The carbon sink capacity of ecological land has significantly improved. The carbon sink of the forest ecological space has increased from −1,375,000 tons to −30,601,000 tons, while its area has expanded from 0.22 km2 to 475.16 km2, thanks to the ‘Millennium Show Forest’ project. Additionally, due to the ecological restoration of Baiyangdian, the carbon sink of the water ecological space has stabilized at −4,190,000 to −7,420,000 tons.
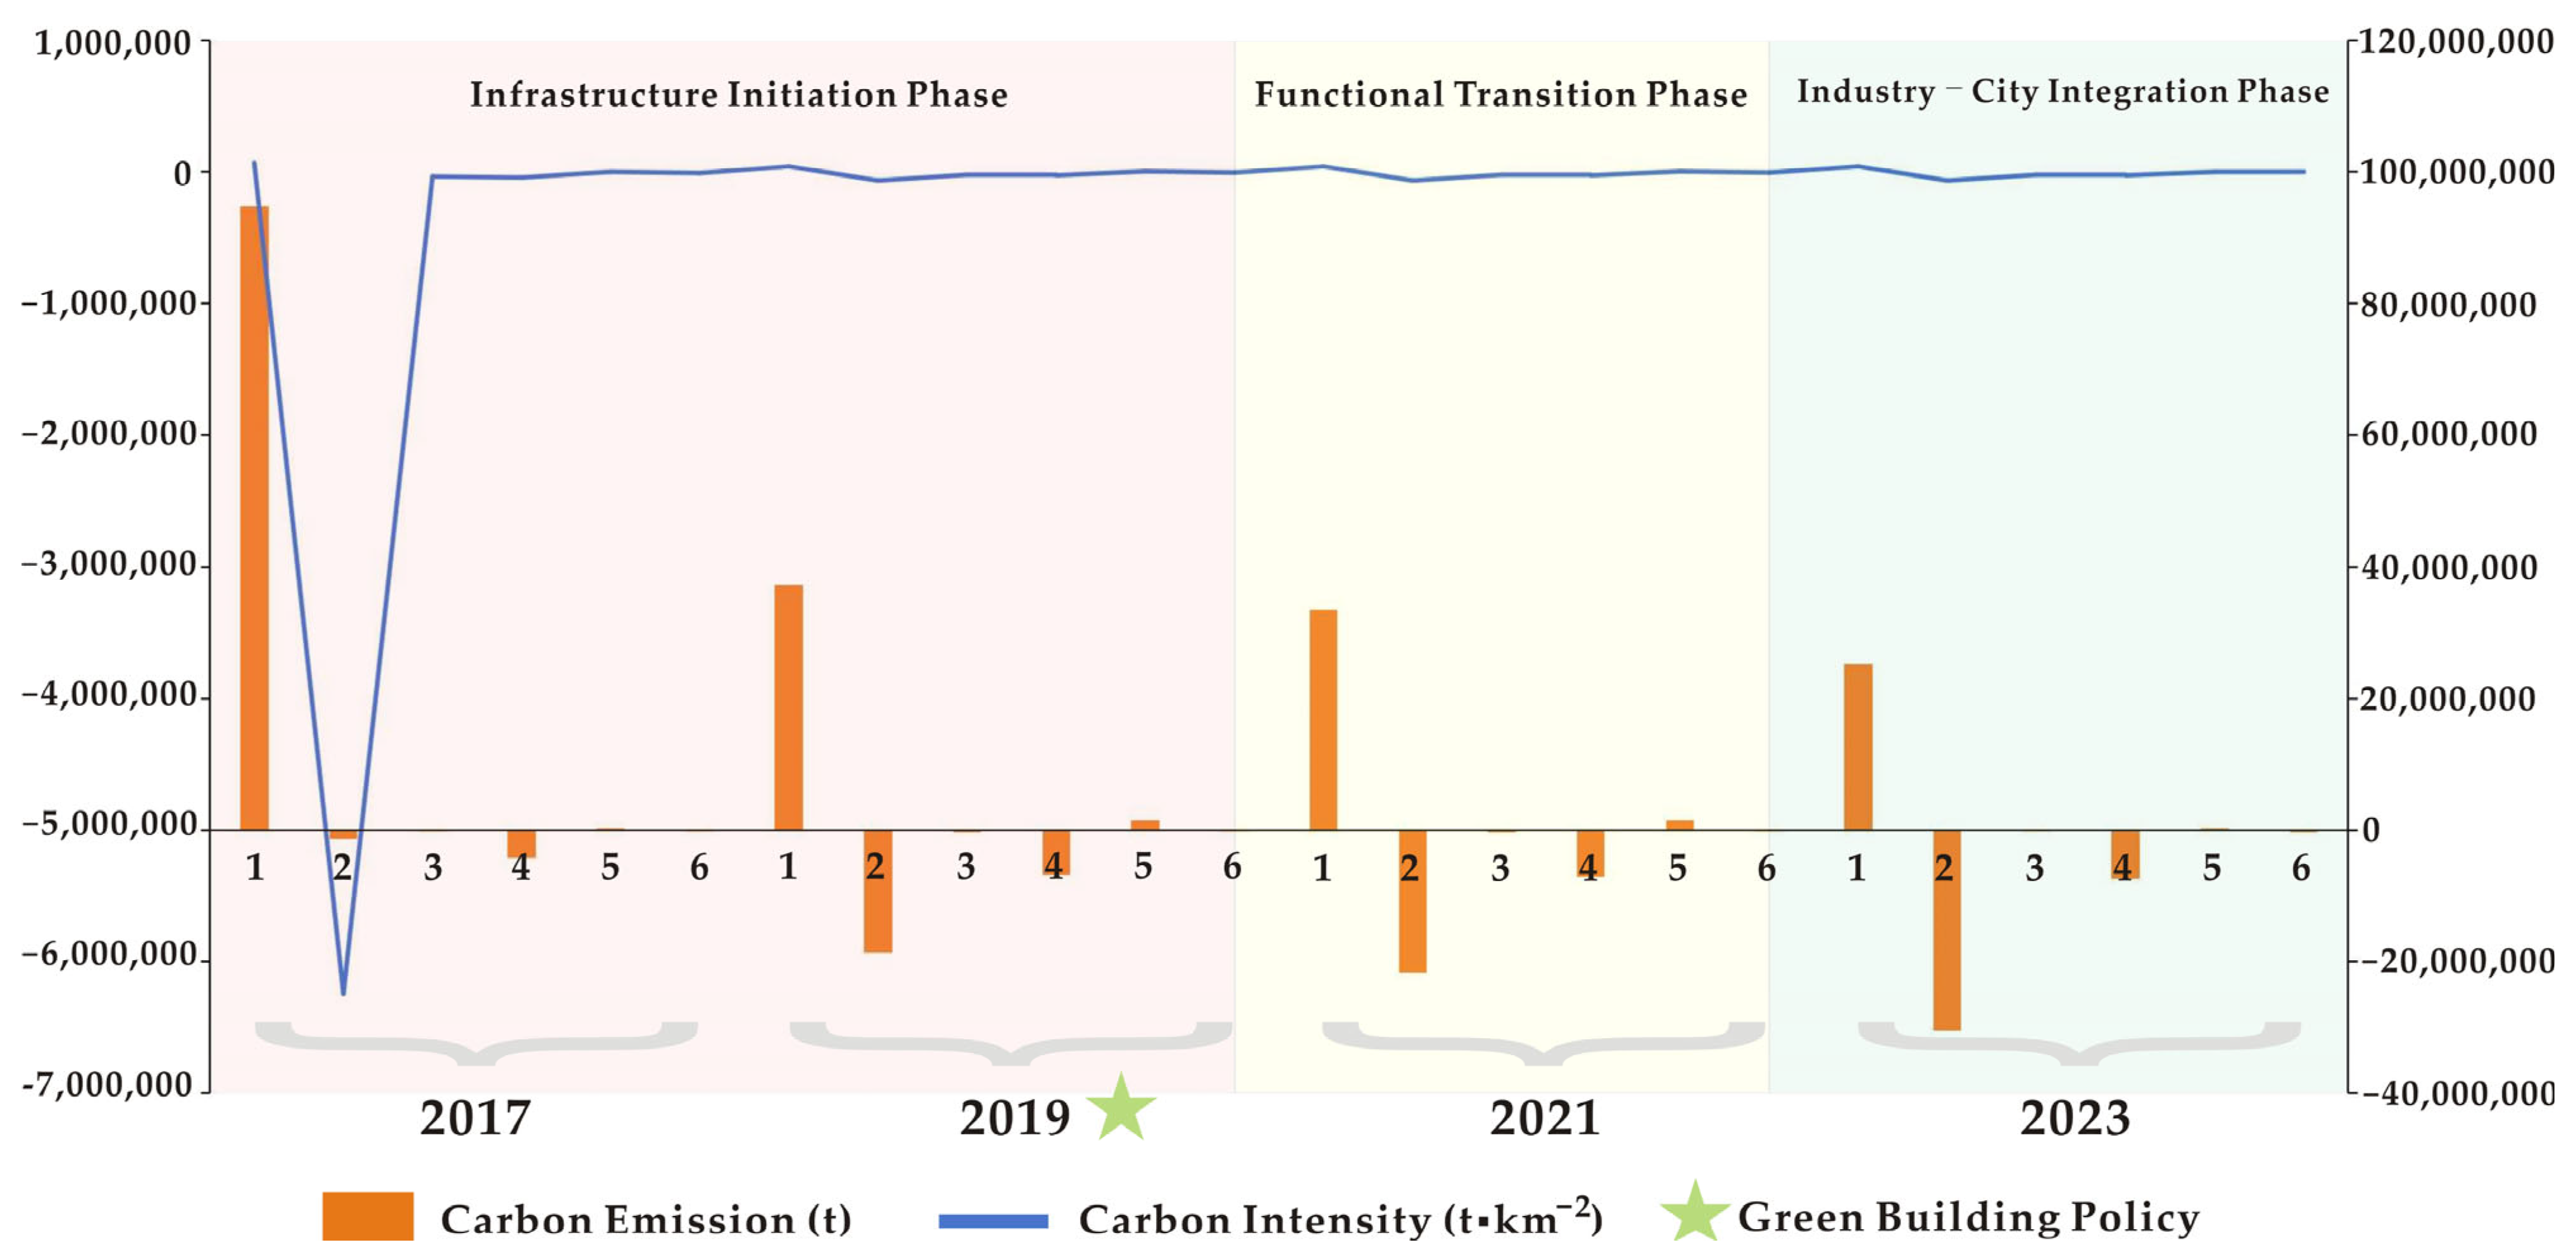
3.3. Analysis of Land Use Carbon Emission Effect
- 2017–2019: Rapid rise in carbon emissions
- 2019–2021: Carbon emission fluctuation adjustment period
- 2021–2023: Carbon emission partial rebound period
4. Conclusions
- Transformation of Land Use Structure
- Dynamics and Stage-specific Characteristics of Carbon Emissions
5. Discussions
- The finding that “construction land expansion drives carbon emission growth” in this study aligns with Zou et al. (2025)’s research on urban agglomerations in the Yangtze River Delta, which demonstrated a positive correlation between urbanization rate and carbon emissions [31,32,33]. However, the carbon sink growth effect achieved through ecological restoration in Xiongan New Area (with forest coverage increasing by 65.3%) significantly exceeds the average level of Hebei Province. Luo et al. (2024) reported an average annual growth of 7.9% in ecological carbon sinks in this region [28], which may be directly attributed to the new area’s planning strategy of “planting greenery before constructing the city”. In terms of carbon emission intensity, this study reveals a 11.4% decrease in unit carbon emissions from construction land, consistent with the theory proposed by D. Rokityanskiy et al. (2007) that “compact cities can reduce energy consumption per unit area” [12]. Nevertheless, this decline remains lower than that observed in European “compact city” cases (e.g., Copenhagen’s annual unit carbon emission reduction of 15–20%). This suggests that Xiongan New Area needs to further optimize its energy structure rather than relying solely on spatial intensification.
- The carbon coefficients employed in this study are derived from previous research [27,28], which may exhibit deviations from local data in Xiongan. In the future, it will be essential to establish a localized carbon accounting system by integrating remote sensing inversion and ground-based measurements (such as carbon flux observations in Baiyangdian Wetland). This approach aligns with the trend of the “high-resolution carbon simulation framework” proposed by Qin et al. (2024) [11]. Simultaneously, introducing the CLUE-S model to simulate multi-scenario land use transitions [15] can provide more accurate decision support for spatial planning under the “dual-carbon” goals.
Author Contributions
Funding
Institutional Review Board Statement
Informed Consent Statement
Data Availability Statement
Conflicts of Interest
References
- United Nations Human Settlements Programme (UN-Habitat). World Cities Report 2022: Envisaging the Future of Cities; UN-Habitat: Nairobi, Kenya, 2022. [Google Scholar]
- Ye, X.; Chuai, X.W. Carbon sinks/sources’ spatiotemporal evolution in China and its response to built-up land expansion. J. Environ. Manag. 2022, 321, 115863. [Google Scholar] [CrossRef] [PubMed]
- IPCC. Climate Change 2023: Synthesis Report. Contribution of Working Groups I, II and III to the Sixth Assessment Report of the Intergovernmental Panel on Climate Change; IPCC: Geneva, Switzerland, 2023. [Google Scholar]
- Zhao, D.; Li, T. Analysis of carbon emissions and the influence factors in the process of urbanization among Chinese Provinces. Acta Sci. Nat. Univ. Pekin. 2016, 52, 947–958. [Google Scholar]
- Liu, J.; Wu, B.; Wang, H.; Wei, G. Spatial differentiation and dynamic analysis of land use change in China under different carbon emission scenarios. Bull. Soil Water Conserv. 2025, 45, 1–11. [Google Scholar]
- Li, C.; Zhao, R.; Wang, F.; Wang, F.; Hu, Y.; Yang, P.; Zhao, Y. Current situation fo the coastal wetlands in Guangxi and analysis of carbon storage in the mangrove wetland. North China Geol. 2022, 45, 62–68. [Google Scholar]
- Huang, L.; Li, L.; Wang, W. Research on comprehensive evaluation and regionalization of natural resources in North China based on GIS. North China Geol. 2023, 46, 83–88. [Google Scholar]
- Liu, M.; Chen, Y.; Wang, J.; Chen, K.; Chen, Y. The spatial association network and driving factors of land use carbon emission efficiency in China: An investigation in the national major strategic regions. Resour. Sci. 2024, 46, 2462–2476. [Google Scholar]
- Lv, Q.; Luo, Y.; Gao, Z.; Lei, X. Spatio-temporal pattern, dynamic evolution, and carbon compensation zoning of land use carbon budget in Beijing-Tianjin-Hebei Region. Environ. Sci. 2025. [Google Scholar] [CrossRef]
- Li, Z.; Xu, L.; Ye, Y.; Wu, Q. Spatiotemporal differentiation of carbon budget and carbon compensation zoning in the Yangtze River Delta Urban agglomeration. Environ. Sci. 2025. [Google Scholar] [CrossRef]
- Qin, Z.; Zhu, Y.; Canadel, G.; Chen, M.; Li, T.; Mishar, M.; Yuan, W. Global spatially explicit carbon emissions from land-use change over the past six decades (1961–2020). One Earth 2024, 7, 835–847. [Google Scholar] [CrossRef]
- Rokityanskiy, D.; Benítez, P.; McCallum, I.; Obersteiner, M.; Rametsteiner, E.; Yamagata, Y. Geographically explicit global modeling of land-use change, carbon sequestration, and biomass supply. Technol. Forecast. Soc. Change 2007, 74, 1057–1082. [Google Scholar] [CrossRef]
- Guo, Y.; Cao, X.; Wei, W.; Zeng, G. The impact of regional integration in the Yangtze River Delta on urban carbon emissions. Geogr. Res. 2022, 41, 181–192. [Google Scholar]
- Zhang, S.; Yuan, C.; Zhao, X. Spatial and temporal characteristics of land use carbon emission intensity in the central area of Yangtze River Delta from 2000 to 2018. J. Henan Agric. Univ. 2019, 39, 122–129. [Google Scholar]
- Bian, Z.; Ma, X.; Gong, L.; Zhao, J.; Zeng, C.; Wang, L. Land use prediction based on CLUE-S model under different Non-spatial simulation methods: A case study of the Qinhuai River watershed. Sci. Geogr. Sin. 2017, 37, 252–258. [Google Scholar]
- Wei, L.; Zhou, L.; Sun, D.; Tang, X. The evolution of spatio-temporal pattern and scenario simulation of urban agglomeration expansion in the Yellow River Basin: A case study in the Hohhot-Baotou-Ordos-Yulin urban agglomeration. Geogr. Res. 2022, 41, 1610–1622. [Google Scholar]
- Shi, D.; Shi, K. Analysis of the targets, stylized facts and influencing factors of green and low-carbon development in China: Based on a literature review. Soc. Sci. Int. 2023, 4, 95–120+243–244. [Google Scholar]
- Tian, Y.; Cai, Y. EKC-based test for agricultural carbon emissions in Yangtze River economic belt and analysis of driving factors. Resour. Environ. Yangtze Basin 2023, 32, 2403–2417. [Google Scholar]
- Xie, X.; Zhang, C. Research on Shanghai planning management strategy under the “carbon emissions peak and carbon neutrality”: Based on analysis of international experiences. Shanghai Urban Plan. Rev. 2023, 3, 71–77. [Google Scholar]
- Ma, Z.; Xia, Y.; Li, H.; Han, B.; Yu, X.; Zhou, Y.; Wang, Y.; Guo, X.; Li, H.; Pei, Y. Analysis of natural resources and environment eco-geological conditions in Xiong’an New Area. Geol. China 2021, 48, 677–696. [Google Scholar]
- Han, B.; Xia, Y.; Ma, Z.; Wang, X.; Guo, X.; Lin, L.; Pei, Y. Division of engineering geological strata, building of 3D geological structure and its application in urban planning and construction in Xiong’an New Area. Geol. China 2023, 50, 1903–1918. [Google Scholar]
- Lu, Z.; Zhang, Z. Research on regional variability in the evolution of territorial space pattern and its driving factors in Beijing-Tianjin-Hebei Region. China Land Sci. 2022, 36, 42–52. [Google Scholar]
- Lin, J.; Liu, Q.; Li, J. Research on establishing a land space utilization classification for new urbanization. Urban Stud. 2016, 23, 51–60. [Google Scholar]
- Lin, Y.; Zhao, J.; Zhang, M.; Chen, G. Identification of territory space pattern and spatio-temporal evolution analysis of urban agglomeration in central Yunnan. Trans. Chin. Soc. Agric. Mach. 2019, 50, 176–191. [Google Scholar]
- Su, Y.; Zhang, Y. Study on effects of carbon emission by land use patterns of Shaanxi Province. J. Soil Water Conserv. 2011, 25, 152–156. [Google Scholar]
- Lai, L.; Lv, W.; Shu, L. Discussion on the design of carbon pricing system with Chinese characteristics under dual-carbon goal. New Financ. 2022, 5, 45–52. [Google Scholar]
- Li, A.; Yin, X.; Wei, H. Spatio-temporal evolution of carbon emission from land use and its driving factors in Beijing-Tianjin-Hebei districts and counties. Environ. Sci. 2024, 44, 2270–2283. [Google Scholar]
- Luo, Y.; Chen, S.; Liu, W.; Wang, X.; Qi, A. Analysis and prediction on the spatiotemporal evolution of carbon emissions from land use in Hebei province. Chin. J. Environ. Eng. 2024, 11, 3360–3373. [Google Scholar]
- Wang, G.; Nan, L. Temporal-spatial variance of carbon emission effect in Shaanxi’s land use. Resour. Ind. 2012, 14, 124–130. [Google Scholar]
- Hebei Xiong’an New Area Management Committee. Guidelines for High-Quality Development of Green Building in the Xiong’an New Area; Hebei Xiong’an New Area Management Committee: Baoding, China, 2021. [Google Scholar]
- Zou, X.; Yang, L.; Sun, X.; Liu, S. Study on the measurement of peak carbon levels, spatial and temporal evolution, and influencing factors in the Yangtze River delta urban agglomeration. Soft Sci. 2025. Available online: http://kns.cnki.net/kcms/detail/51.1268.G3.20250613.1846.002.html (accessed on 22 May 2025).
- Li, Y.; Zhao, Q.; Lin, W.; Li, Y.; Liu, H.; Fang, Q. Spatial and temporal evolution of carbon emission and influencing factors in Yangtze River delta based on luminous remote sensing data. J. Atmos. Environ. Opt. 2024. Available online: http://kns.cnki.net/kcms/detail/34.1298.O4.20240509.1131.002.html (accessed on 22 May 2025).
- Feng, X.; Li, Y.; Yu, E.; Yang, J.; Wang, S.; Ma, J. Spatiotemporal pattern and coordinating development characteristics of carbon emission performance and land use intensity in the Yangtze River delta urban agglomeration. Trans. Chin. Soc. Agric. Eng. 2023, 39, 208–218. [Google Scholar]


| Land Use Function Classification | Secondary Classification of Land Use Classification System | Attribute | |
|---|---|---|---|
| Primary Space | Secondary Space | ||
| Agricultural Space | Agricultural Production Space | Paddy Fields, Dry Land | Carbon source/Carbon sink |
| Construction Space | Settlement Construction Space | Rural, Urban, and Transportation Land | Carbon source |
| Ecological Space | Forest Ecological Space | Forested Land, Shrub Land, Other Forested Land | Carbon sink |
| Grassland Ecological Space | Artificial Grassland | Carbon sink | |
| Water Ecological Space | Rivers, Lakes, Pond, Marshlands | Carbon sink | |
| Other Ecological Space | Saline–Alkali land, Bare Land | Carbon sink | |
| Land Use Type | Forest Ecological Space | Grassland Ecological Space | Water Ecological Space | Other Ecological Space | Agricultural Ecological Space |
|---|---|---|---|---|---|
| Carbon Emission Coefficient * | −0.0644 | −0.021 | −0.0257 | −0.005 | 0.0422 |
| Stage | Characteristics | Land Use Change Magnitude |
|---|---|---|
| 2017–2019 | Infrastructure Initiation Phase | The agricultural land area decreased by 83 km2, while the construction land area increased by 23 km2 |
| 2019–2021 | Functional Transition Phase | The construction land area increased by 56 km2, while the ecological land area increased by 49 km2 |
| 2021–2023 | Industry–City Integration Phase | The construction land area increased by 27 km2 |
| Land Use Transition Type | Total Carbon Effect × 108 tons | ||
|---|---|---|---|
| 2017–2019 | 2019–2021 | 2021–2023 | |
| Agricultural Land—Forest Ecological Land | −7561.2734 | −0.1179 | −25.2733 |
| Agricultural Land—Grassland Ecological Land | −827.2535 | −0.0014 | −0.0127 |
| Agricultural Land—Water Ecological Land | −1675.1332 | −0.0370 | −4.2645 |
| Agricultural Land—Construction Land | −10,915.6132 | 0.0329 | 0.2918 |
| Agricultural Land—Other Ecological Land | −0.3343 | −0.8100 | −0.1147 |
| Forest Ecological Land—Agricultural Land | 0.0344 | 0.0352 | 10.1504 |
| Forest Ecological Land—Grassland Ecological Land | 0.0023 | 0.0008 | −0.0024 |
| Forest Ecological Land—Water Ecological Land | −0.0241 | −0.0151 | −7.3916 |
| Forest Ecological Land—Construction Land | 0.0382 | 0.0678 | 0.7259 |
| Forest Ecological Land—Other Ecological Land | 0.8168 | −0.2794 | −0.0450 |
| Grassland Ecological Land—Agricultural Land | 0.0007 | 0.0035 | 1.8505 |
| Grassland Ecological Land—Forest Ecological Land | −0.0007 | −0.0004 | −2.1806 |
| Grassland Ecological Land—Water Ecological Land | −0.0444 | −0.0006 | −0.5154 |
| Grassland Ecological Land—Construction Land | 0.0003 | 0.0162 | 0.0414 |
| Grassland Ecological Land—Other Ecological Land | 0.0123 | −0.0190 | −0.0110 |
| Water Ecological Land—Agricultural Land | 0.7365 | 0.0124 | 3.2192 |
| Water Ecological Land—Forest Ecological Land | 1.1311 | 0.0011 | −4.6886 |
| Water Ecological Land—Grassland Ecological Land | 0.1663 | 0.0000 | −0.0003 |
| Water Ecological Land—Construction Land | 3.3591 | 0.0099 | 0.1331 |
| Water Ecological Land—Other Ecological Land | 0.6422 | −0.0590 | −0.0065 |
| Construction Land—Agricultural Land | 0.0443 | 0.0192 | 19.3326 |
| Construction Land—Forest Ecological Land | −0.1949 | −0.0061 | −33.0676 |
| Construction Land—Grassland Ecological Land | −0.0143 | −0.0025 | −0.0045 |
| Construction Land—Water Ecological Land | −0.1357 | −0.0238 | −31.3456 |
| Construction Land—Other Ecological Land | 4.2442 | −0.1855 | −0.1141 |
| Other Ecological Land—Agricultural Land | 0.0077 | −1.4059 | 1.0027 |
| Other Ecological Land—Forest Ecological Land | −0.0015 | −1.3571 | −0.8140 |
| Other Ecological Land—Grassland Ecological Land | 0.0000 | −0.1729 | 0.0129 |
| Other Ecological Land—Water Ecological Land | −0.0046 | −0.7193 | 0.1079 |
| Other Ecological Land—Construction Land | 0.0007 | −10.2558 | 0.4486 |
| Total | −20,968.7908 | −15.2698 | −72.5354 |
| Phase | Key Drivers | Typical Carbon Effect Shifts | Implications |
|---|---|---|---|
| 2017–2019 (Expansion Phase) | Rapid urbanization and ecological land encroachment | Construction land expansion dominates high carbon emissions | Strict control over development intensity must be enforced, prioritizing the protection of high-carbon-sink ecological land |
| 2019–2021 (Adjustment Phase) | Green policy interventions and early stages | Carbon effect of construction land conversion shifts from negative to positive | Strengthening the application of low-carbon technologies in ecological restoration projects |
| 2021–2023 (Rebound Phase) | Hidden emission from ecological engineering vs. reserve land development dilemmas | Surge in carbon emissions from conversion of construction land to ecological land | Optimizing the sequencing of land use transitions to avoid “carbon-for-carbon” remediation approaches |
Disclaimer/Publisher’s Note: The statements, opinions and data contained in all publications are solely those of the individual author(s) and contributor(s) and not of MDPI and/or the editor(s). MDPI and/or the editor(s) disclaim responsibility for any injury to people or property resulting from any ideas, methods, instructions or products referred to in the content. |
© 2025 by the authors. Licensee MDPI, Basel, Switzerland. This article is an open access article distributed under the terms and conditions of the Creative Commons Attribution (CC BY) license (https://creativecommons.org/licenses/by/4.0/).
Share and Cite
Gao, Y.-H.; Han, B.; Liu, H.-W.; Bai, Y.-N.; Li, Z. Spatial–Temporal Restructuring of Regional Landscape Patterns and Associated Carbon Effects: Evidence from Xiong’an New Area. Sustainability 2025, 17, 6224. https://doi.org/10.3390/su17136224
Gao Y-H, Han B, Liu H-W, Bai Y-N, Li Z. Spatial–Temporal Restructuring of Regional Landscape Patterns and Associated Carbon Effects: Evidence from Xiong’an New Area. Sustainability. 2025; 17(13):6224. https://doi.org/10.3390/su17136224
Chicago/Turabian StyleGao, Yi-Hang, Bo Han, Hong-Wei Liu, Yao-Nan Bai, and Zhuang Li. 2025. "Spatial–Temporal Restructuring of Regional Landscape Patterns and Associated Carbon Effects: Evidence from Xiong’an New Area" Sustainability 17, no. 13: 6224. https://doi.org/10.3390/su17136224
APA StyleGao, Y.-H., Han, B., Liu, H.-W., Bai, Y.-N., & Li, Z. (2025). Spatial–Temporal Restructuring of Regional Landscape Patterns and Associated Carbon Effects: Evidence from Xiong’an New Area. Sustainability, 17(13), 6224. https://doi.org/10.3390/su17136224