

Urban Allotment Gardens with Turf Reduce Biodiversity and Provide Limited Regulatory Ecosystem Services

 ,
,  ,
,  , , and
Abstract
1. Introduction
2. Materials and Methods

| Type of Use | Characteristics of Greenery and Dominant Vegetation Type | Number of Plots | Literature | |
|---|---|---|---|---|
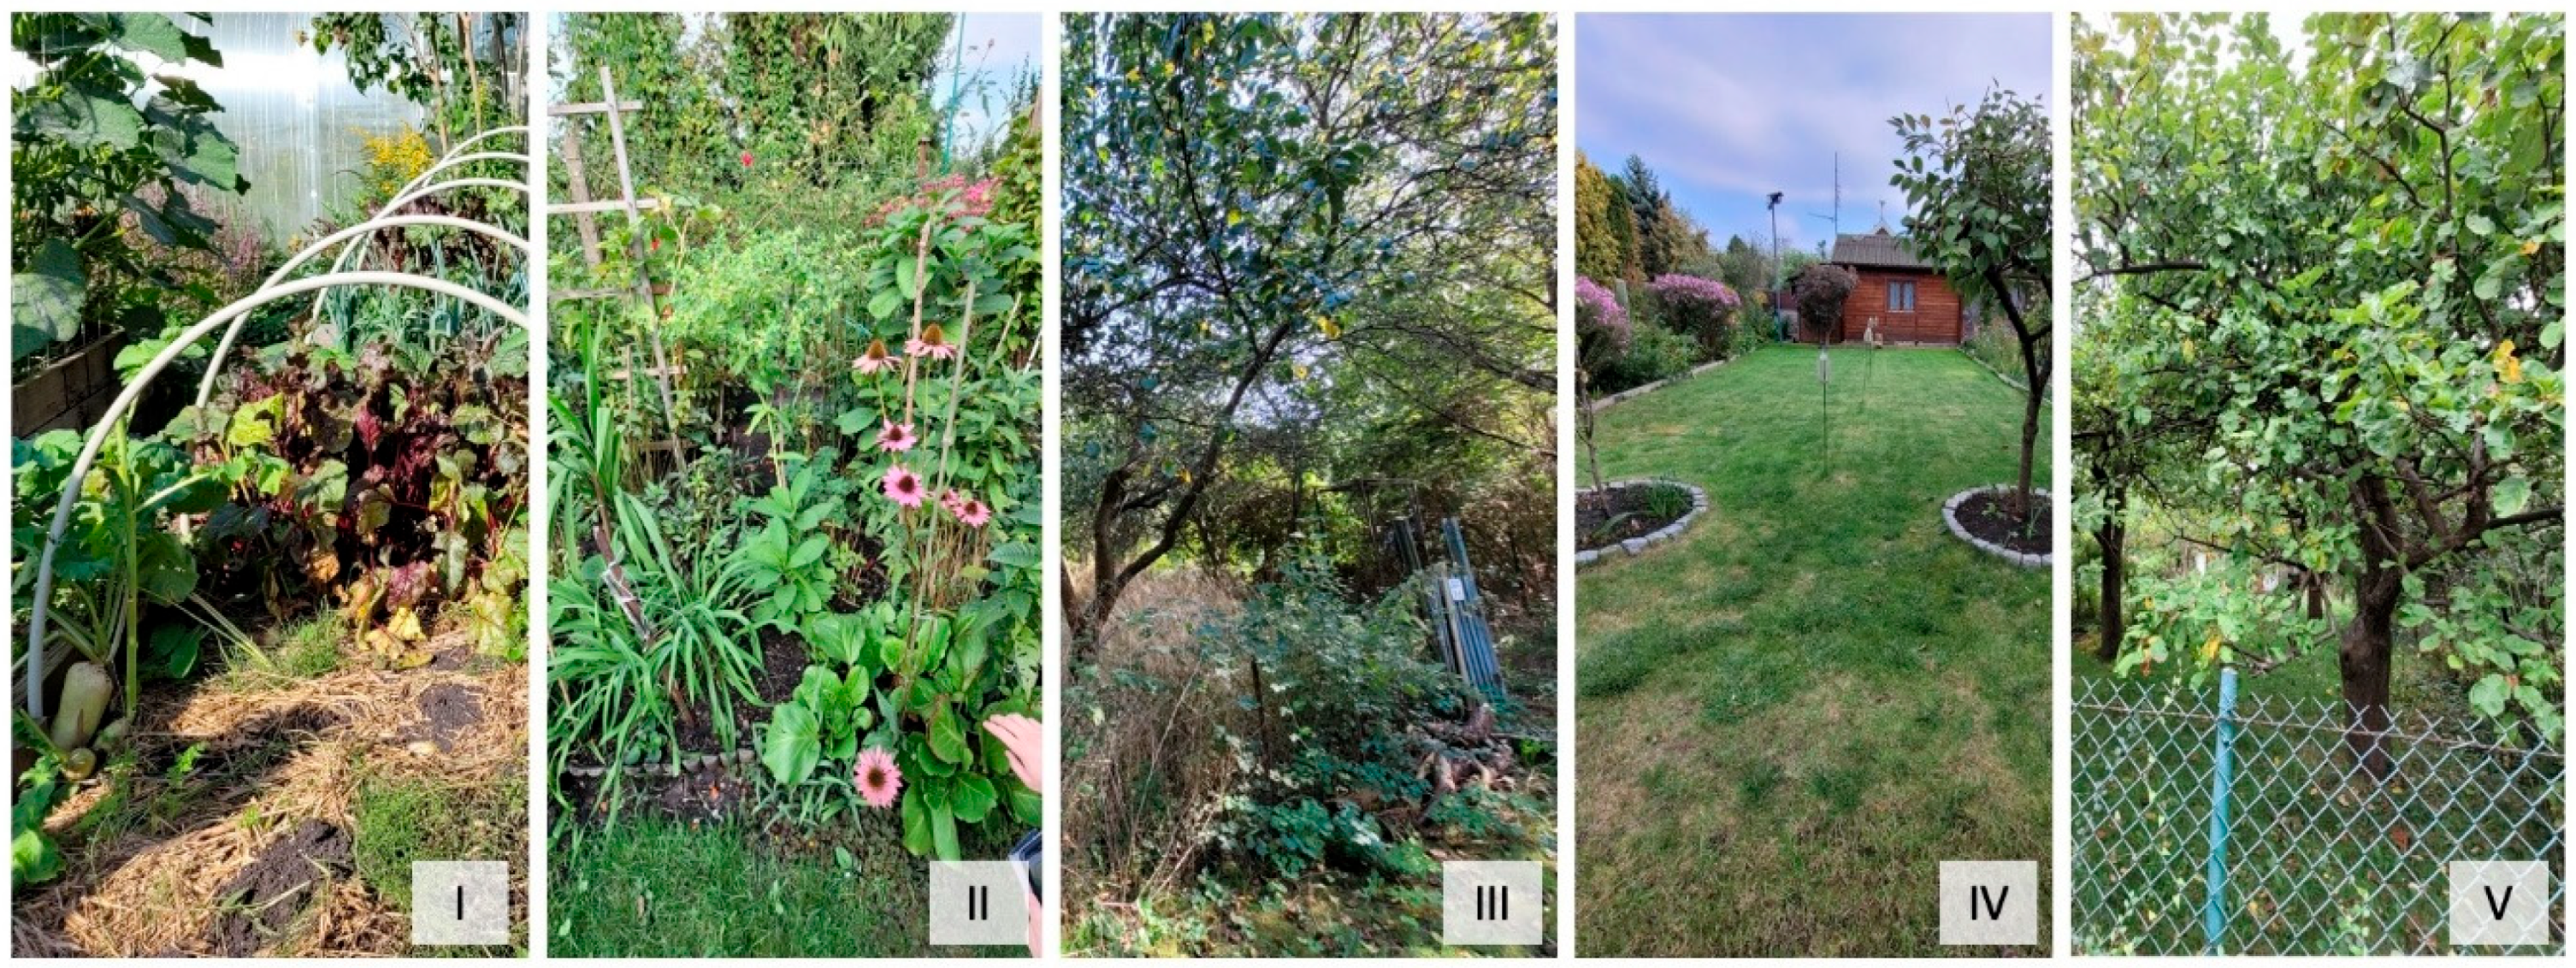
| I | vegetable (Figure 2I) | dominated by vegetable crops growing in the ground, as well as elevated crops or tunnels (class Stellarietea) | 5 | [44] |
| II | flower (Figure 2II) | dominated by flower crops in the form of flower beds or elevated crops (class Stellarietea) | 13 | [17,25] |
| III | abandoned (Figure 2III) | no signs of maintenance and introduced cultivation, spontaneous vegetation is present, and no human activity is visible (class Robinietea, Artemisietea) | 8 | [42] |
| IV | turf (Figure 2V) | dominated by low mowed lawn or turf, current equipment for user recreation (class Polygono arenastri-Poëtea annuae) | 12 | [45,46] |
| V | orchard (Figure 2IV) | presence of various species of low-fruit trees and shrubs that occupy most of the plot area (class Polygono arenastri-Poëtea annuae i Artemisietea) | 6 | [47,48] |
- Vegetable plots were dominated by cultivated species such as Cucurbita pepo, Allium cepa, and Beta vulgaris.
- Flower plots primarily contained ornamental herbaceous species including Paeonia officinalis, Helianthus annuus, and Tagetes patula, as well as ornamental shrubs such as Spiraea japonica.
- Abandoned plots were colonized by spontaneously emerging synanthropic and ruderal species, including Dactylis glomerata, Glechoma hederacea, and Setaria pumila, indicative of minimal or no recent human management.
- Turf plots consisted predominantly of managed grasses and lawn-associated species such as Lolium perenne, Festuca rubra, and Bellis perennis.
- Orchards featured characteristic fruit trees (Malus domestica, Prunus domestica) in the canopy layer, accompanied by understory species such as Fragaria vesca, Taraxacum officinale, and Poa annua.
2.1. In Situ Regulatory Services Examined
2.2. Statistical Analyses
3. Results
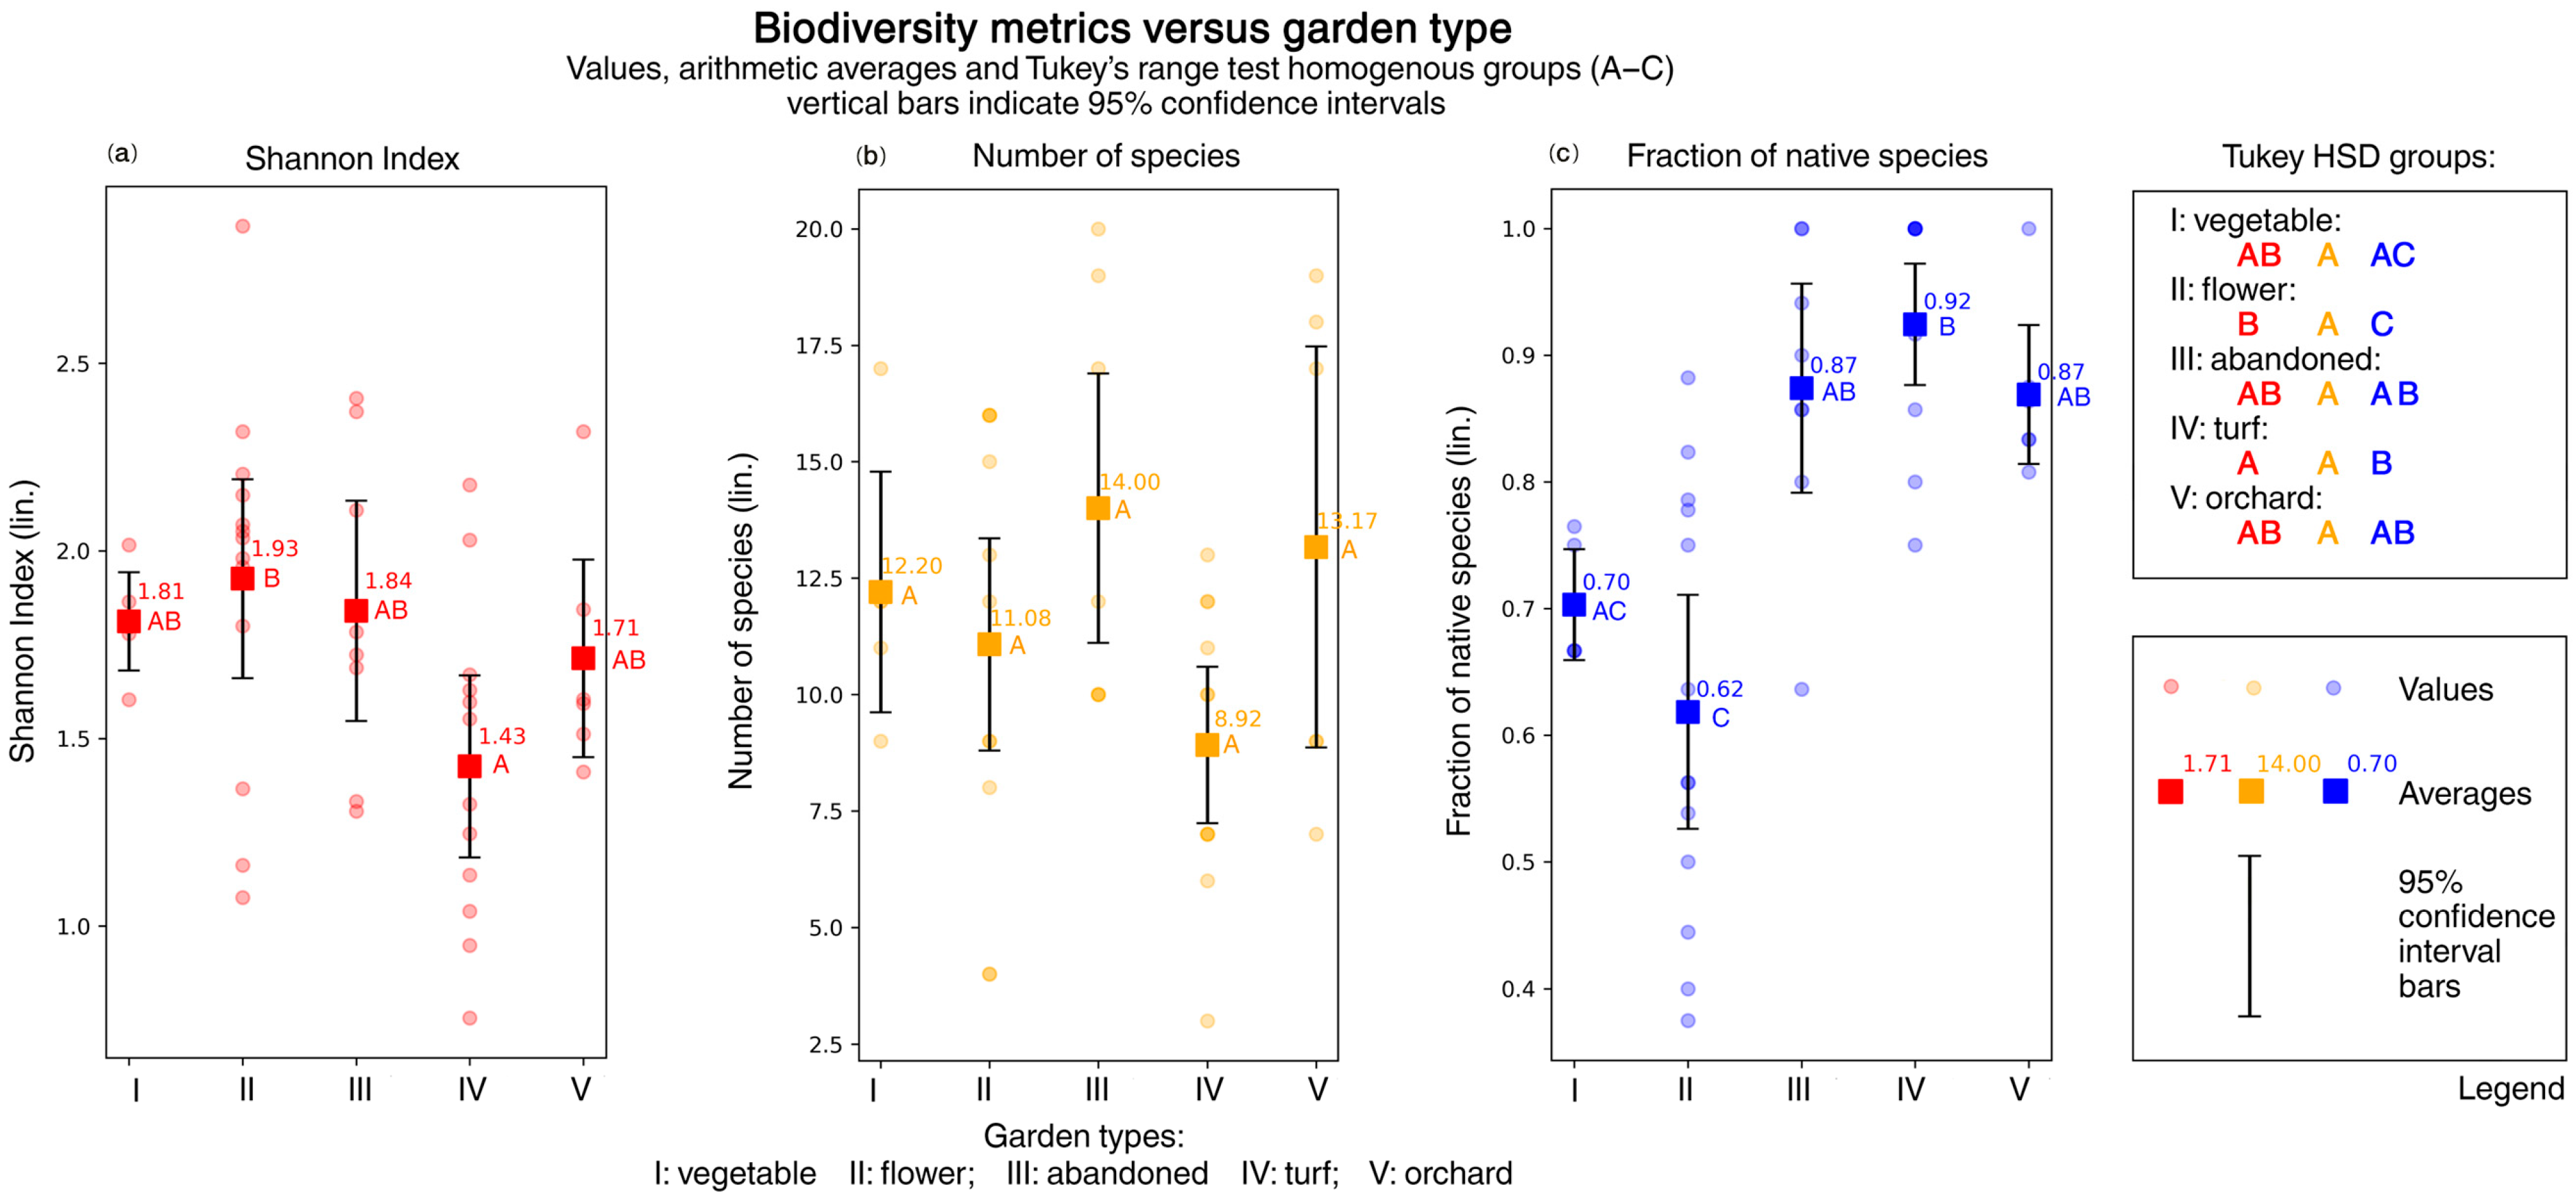
3.1. Biodiversity Across Different Allotment Garden Types
3.2. Leaf Area Index and Regulating Services
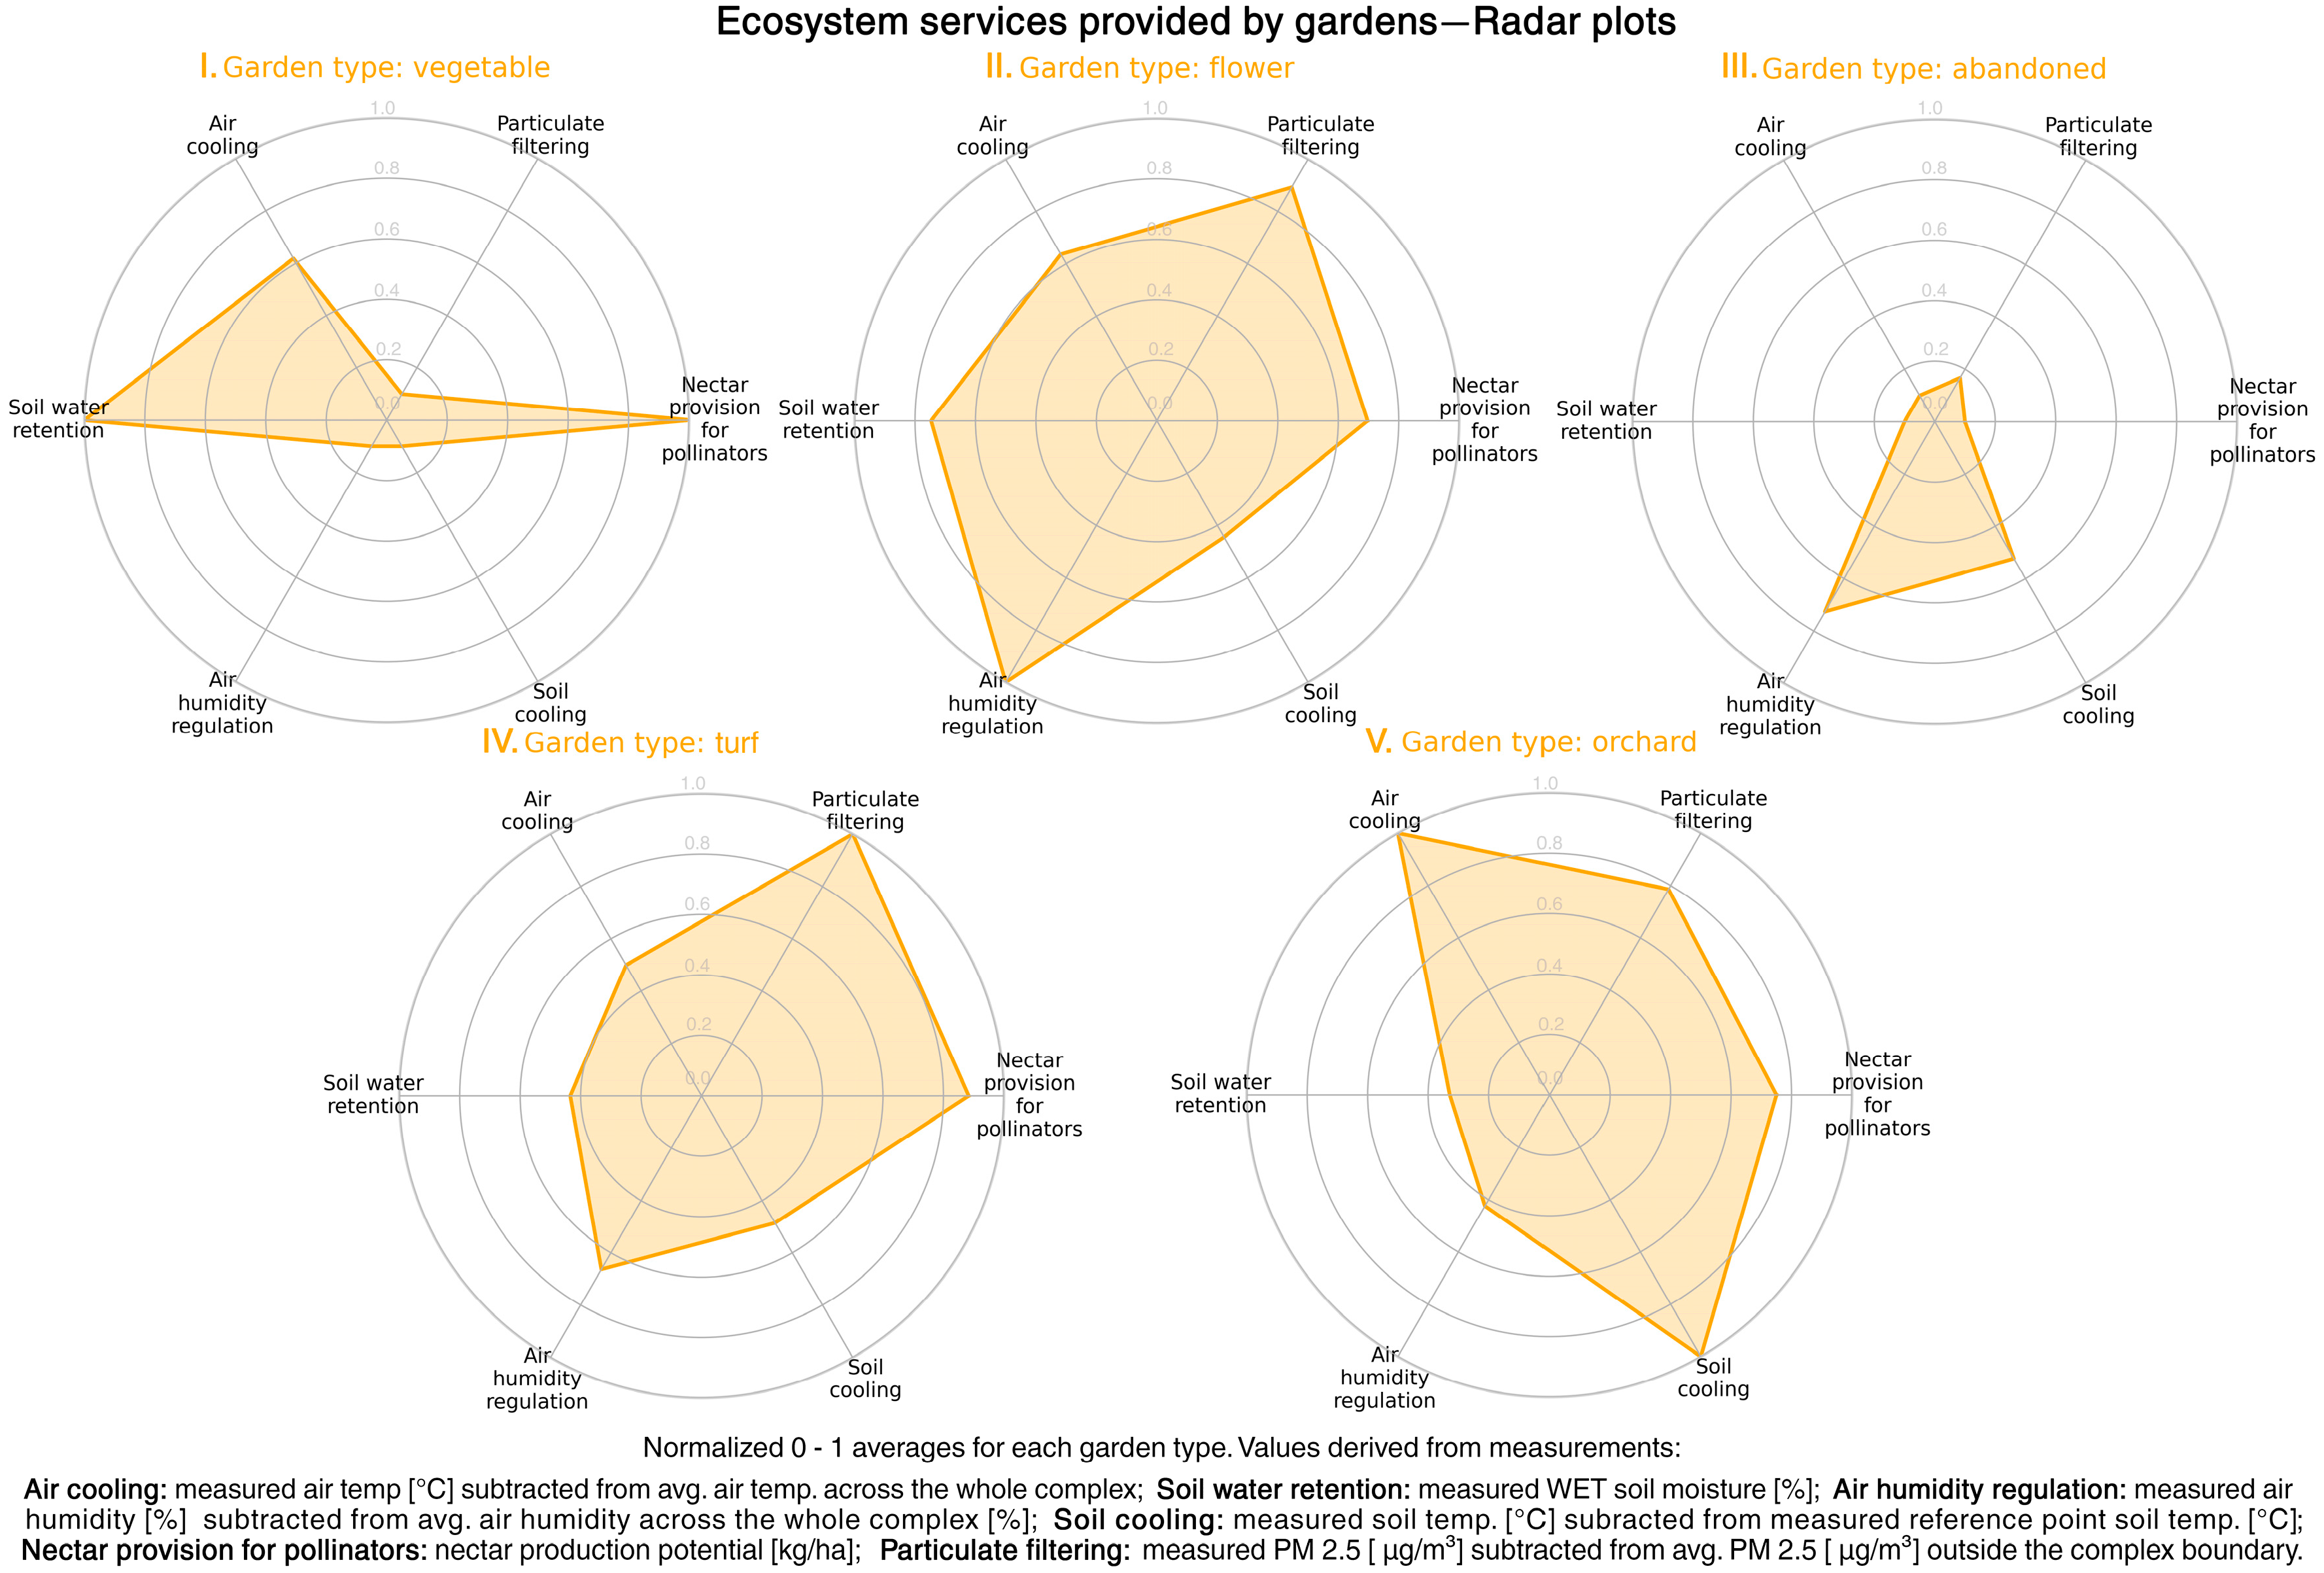
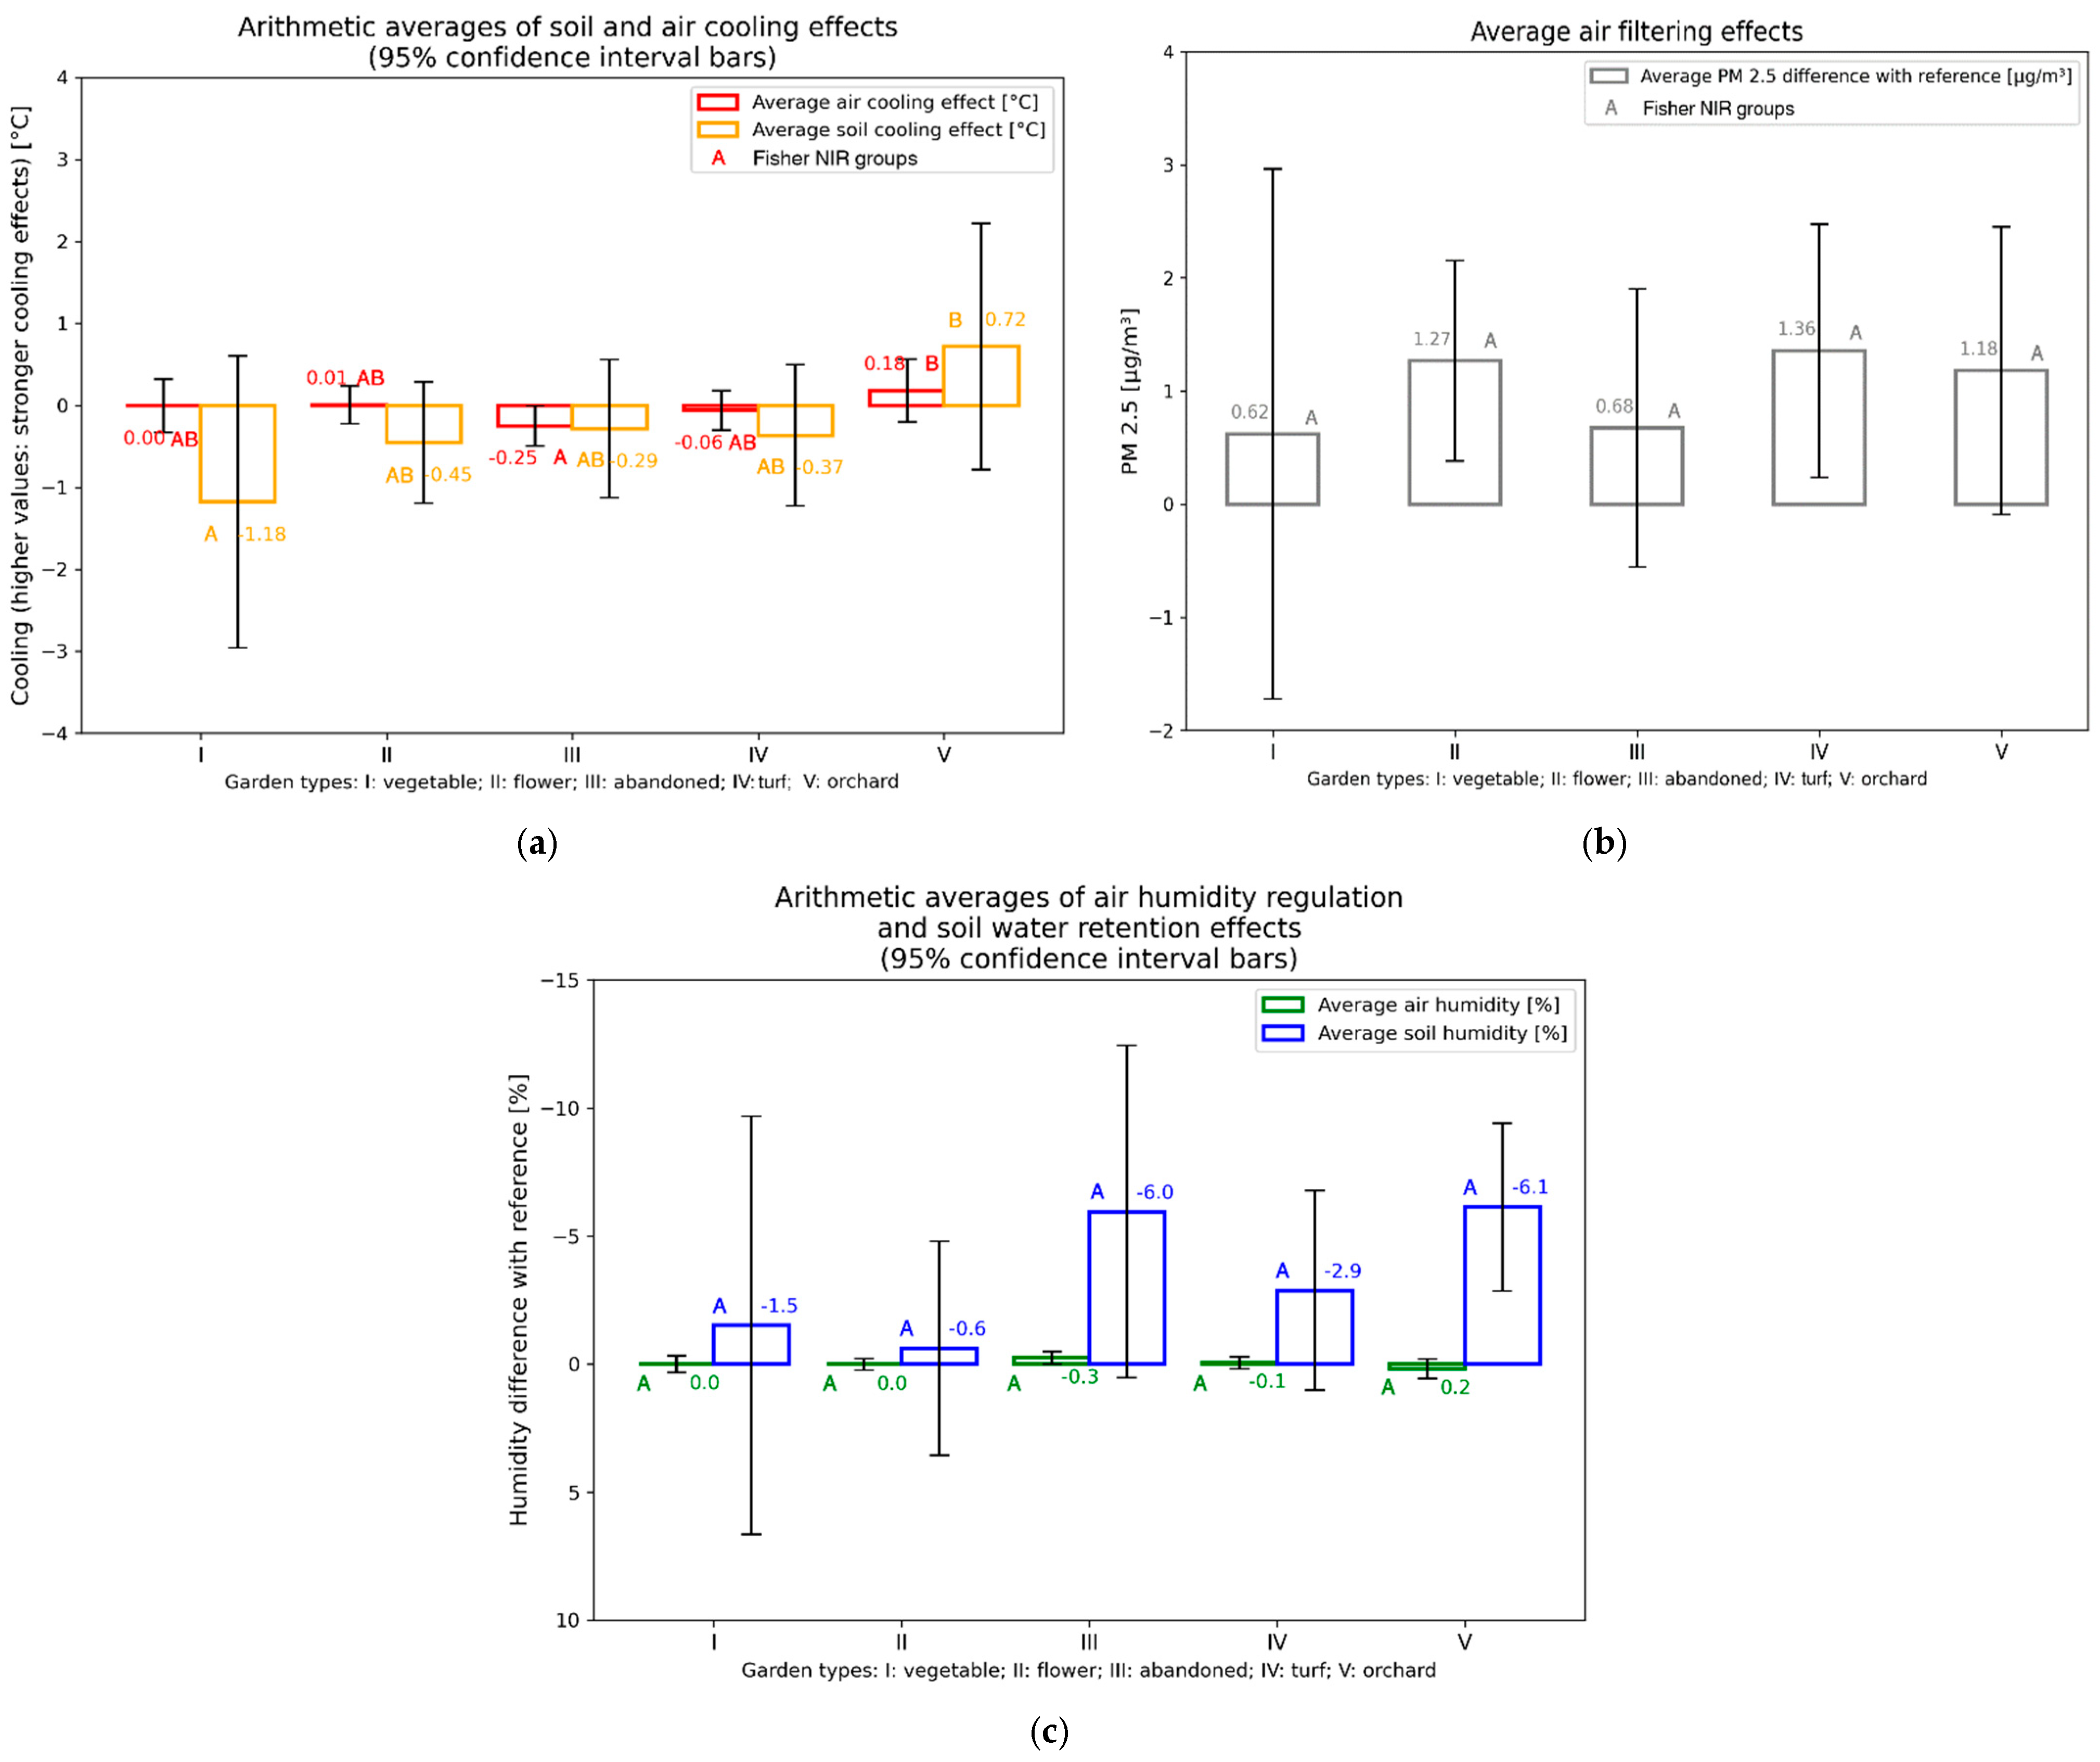
3.3. Regulatory Services of Different Types of Green Allotment Gardens
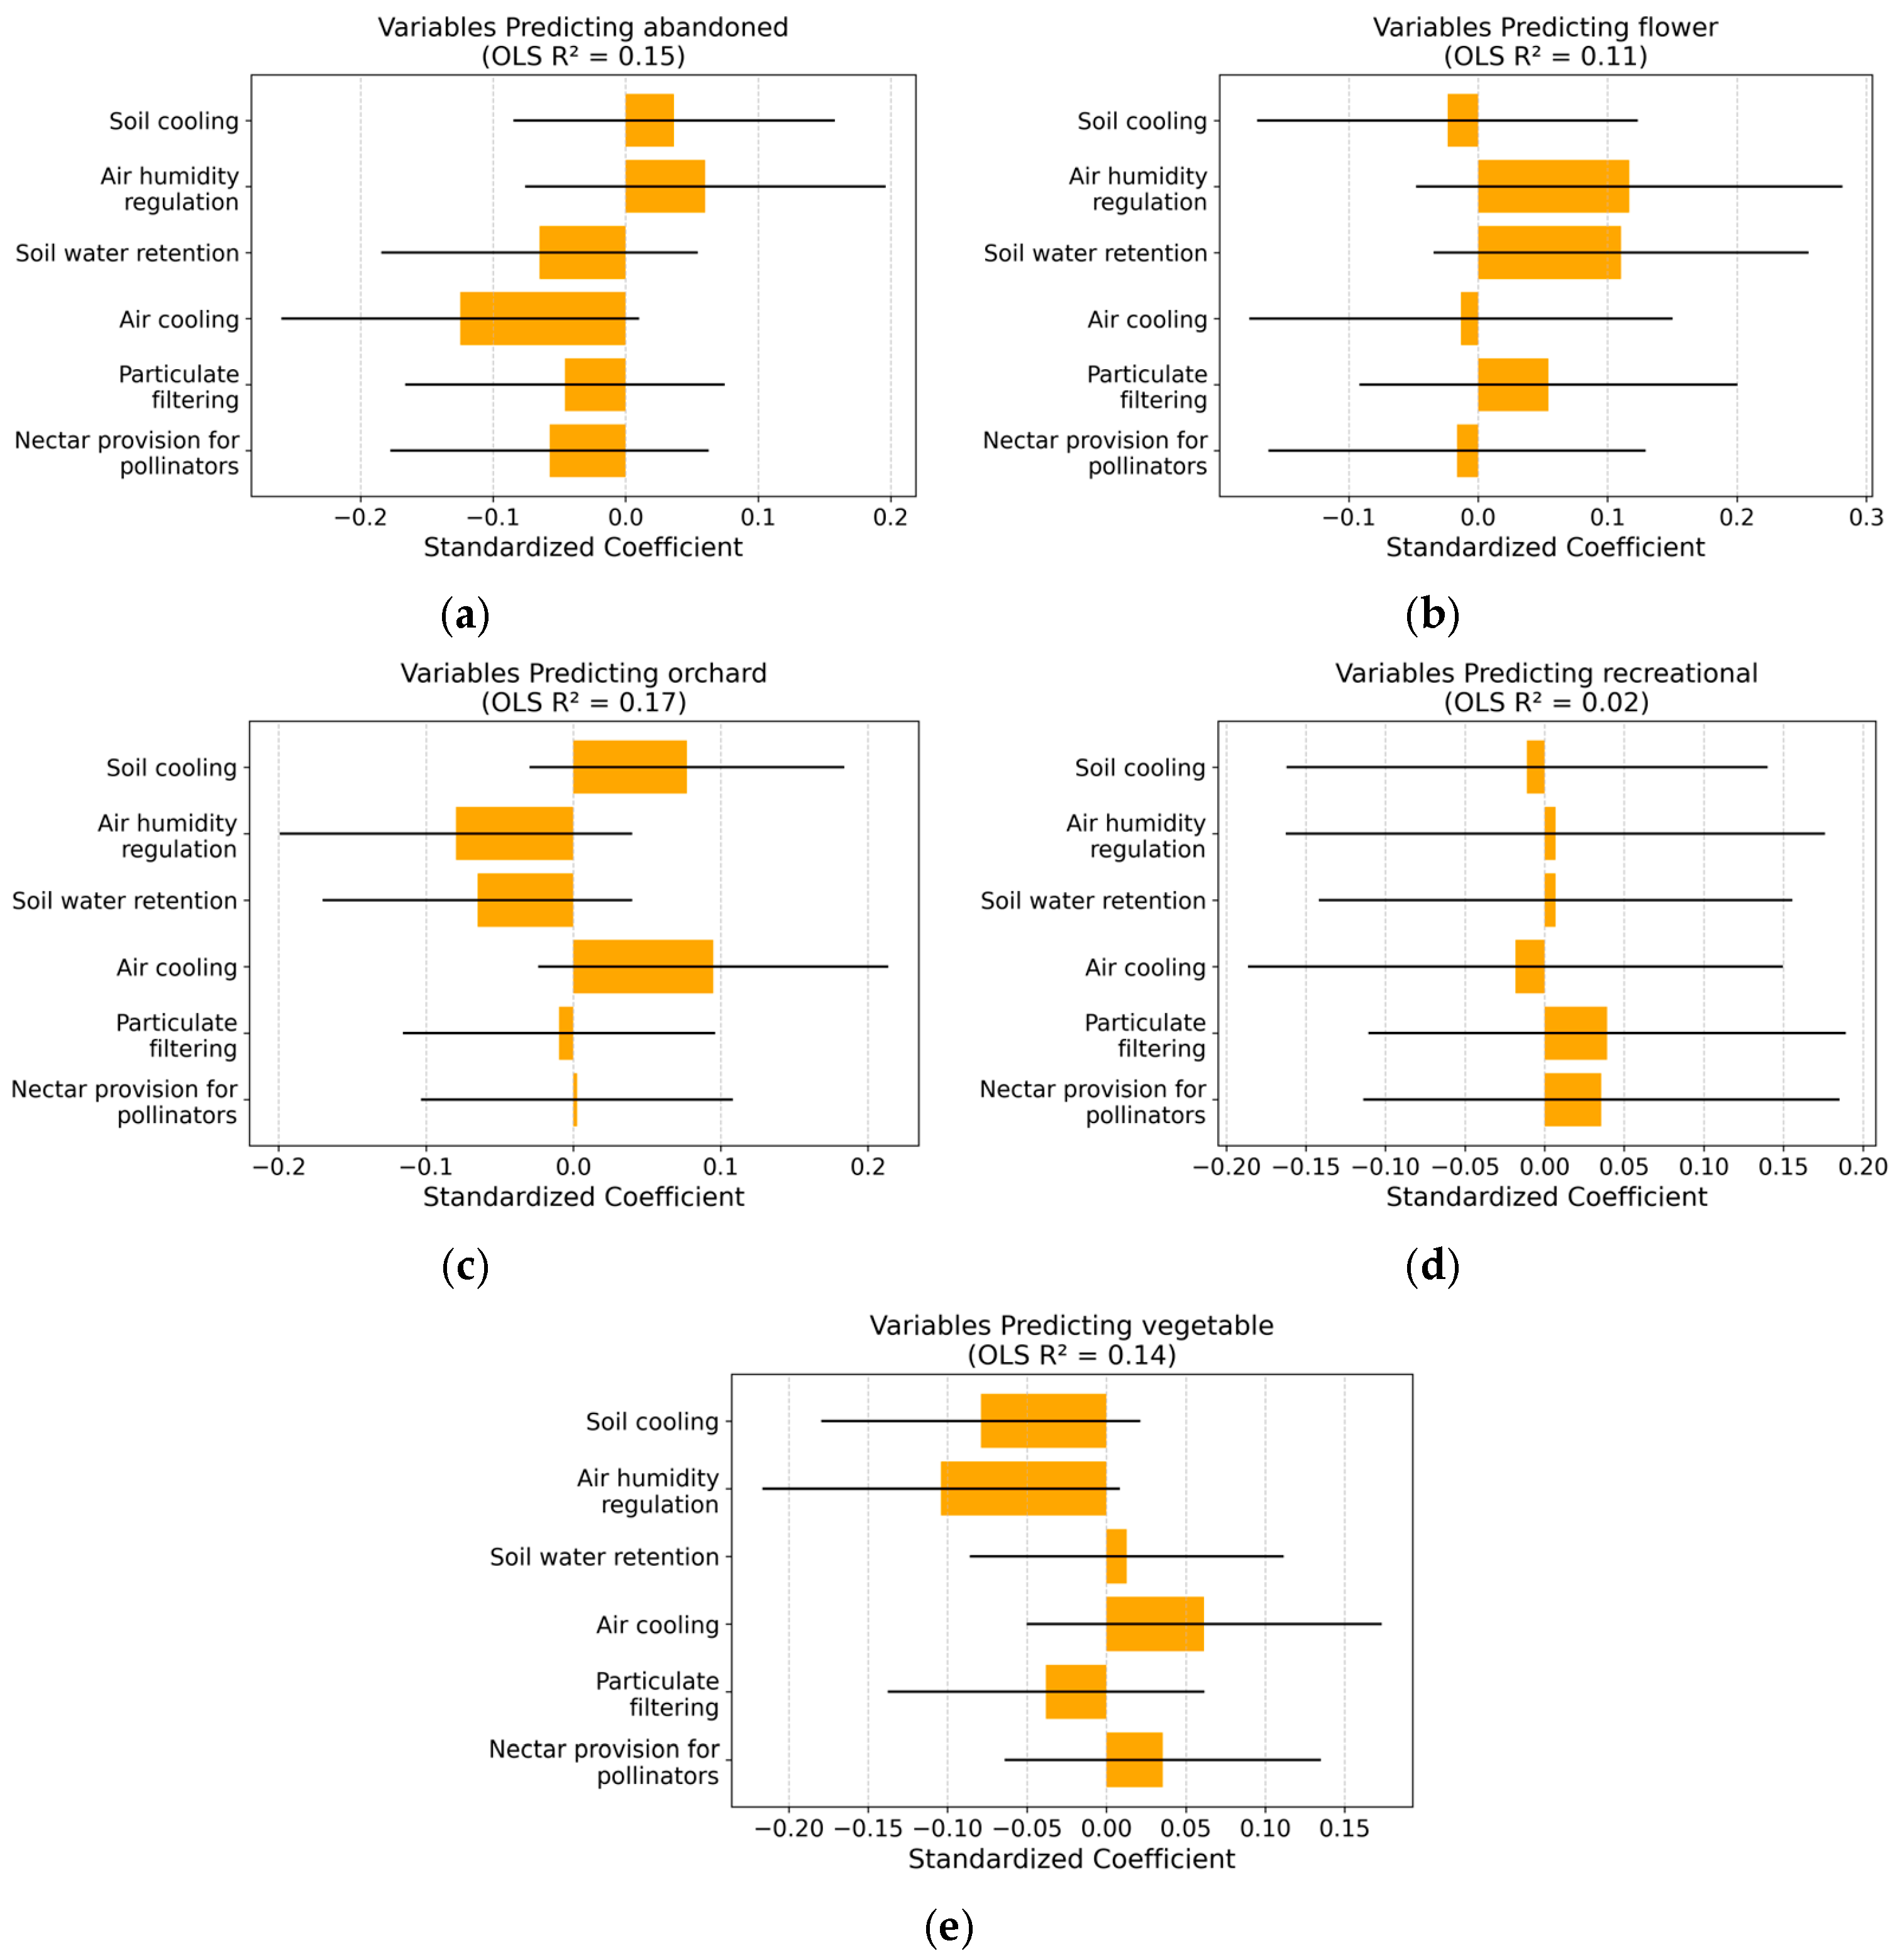
3.4. Statistical Models of Garden Type Differentiation
3.5. Relationships Among Ecosystem Service Indicators
4. Discussion
5. Limitations
6. Conclusions
- The type of garden use significantly influences species diversity and the proportion of native species while having a weaker and more variable impact on the provision of regulatory ecosystem services.
- Turf gardens had the lowest biodiversity (Shannon = 1.43) and the highest proportion of native species (92%, group B), indicating simplified vegetation dominated by a few resilient native species. They showed limited performance in ecosystem services, although they may facilitate pollutant dispersion due to open structure.
- Flower gardens showed the highest species diversity (Shannon = 1.93) and supported a broad range of ecosystem services but had a lower fraction of native species (62%). This suggests a trade-off between biodiversity quality and quantity, reflecting the dominance of ornamental and exotic plants.
- Abandoned plots exhibited the highest vegetation density (LAI = 4.93) and a high native species share (87%), consistent with early natural succession. However, they did not significantly outperform other garden types in ecosystem services, likely due to the short abandonment period (1–3 years) and still-developing vegetation structure.
- Orchards provided the strongest cooling effects (air and soil) and stable nectar availability while maintaining moderate biodiversity (Shannon = 1.71) and a high native species share (87%). These features highlight their multifunctional role and service stability.
- Vegetable gardens had moderate diversity (Shannon = 1.81), a relatively low share of native species (70%), and limited regulatory services. High human input—such as tilling and irrigation—may simplify habitat structure and influence ecological balance.
- Future designs should promote a mosaic layout combining native flowering plants, fruit trees, and unmanaged patches to enhance biodiversity and pollination services while maintaining productive functions. Due to the large within-type variability and the lack of a strong statistical separation in ecosystem services, future research should incorporate direct indicators of management intensity and landscape context to better predict ecosystem functioning.
Author Contributions
Funding
Institutional Review Board Statement
Informed Consent Statement
Data Availability Statement
Acknowledgments
Conflicts of Interest
Abbreviations
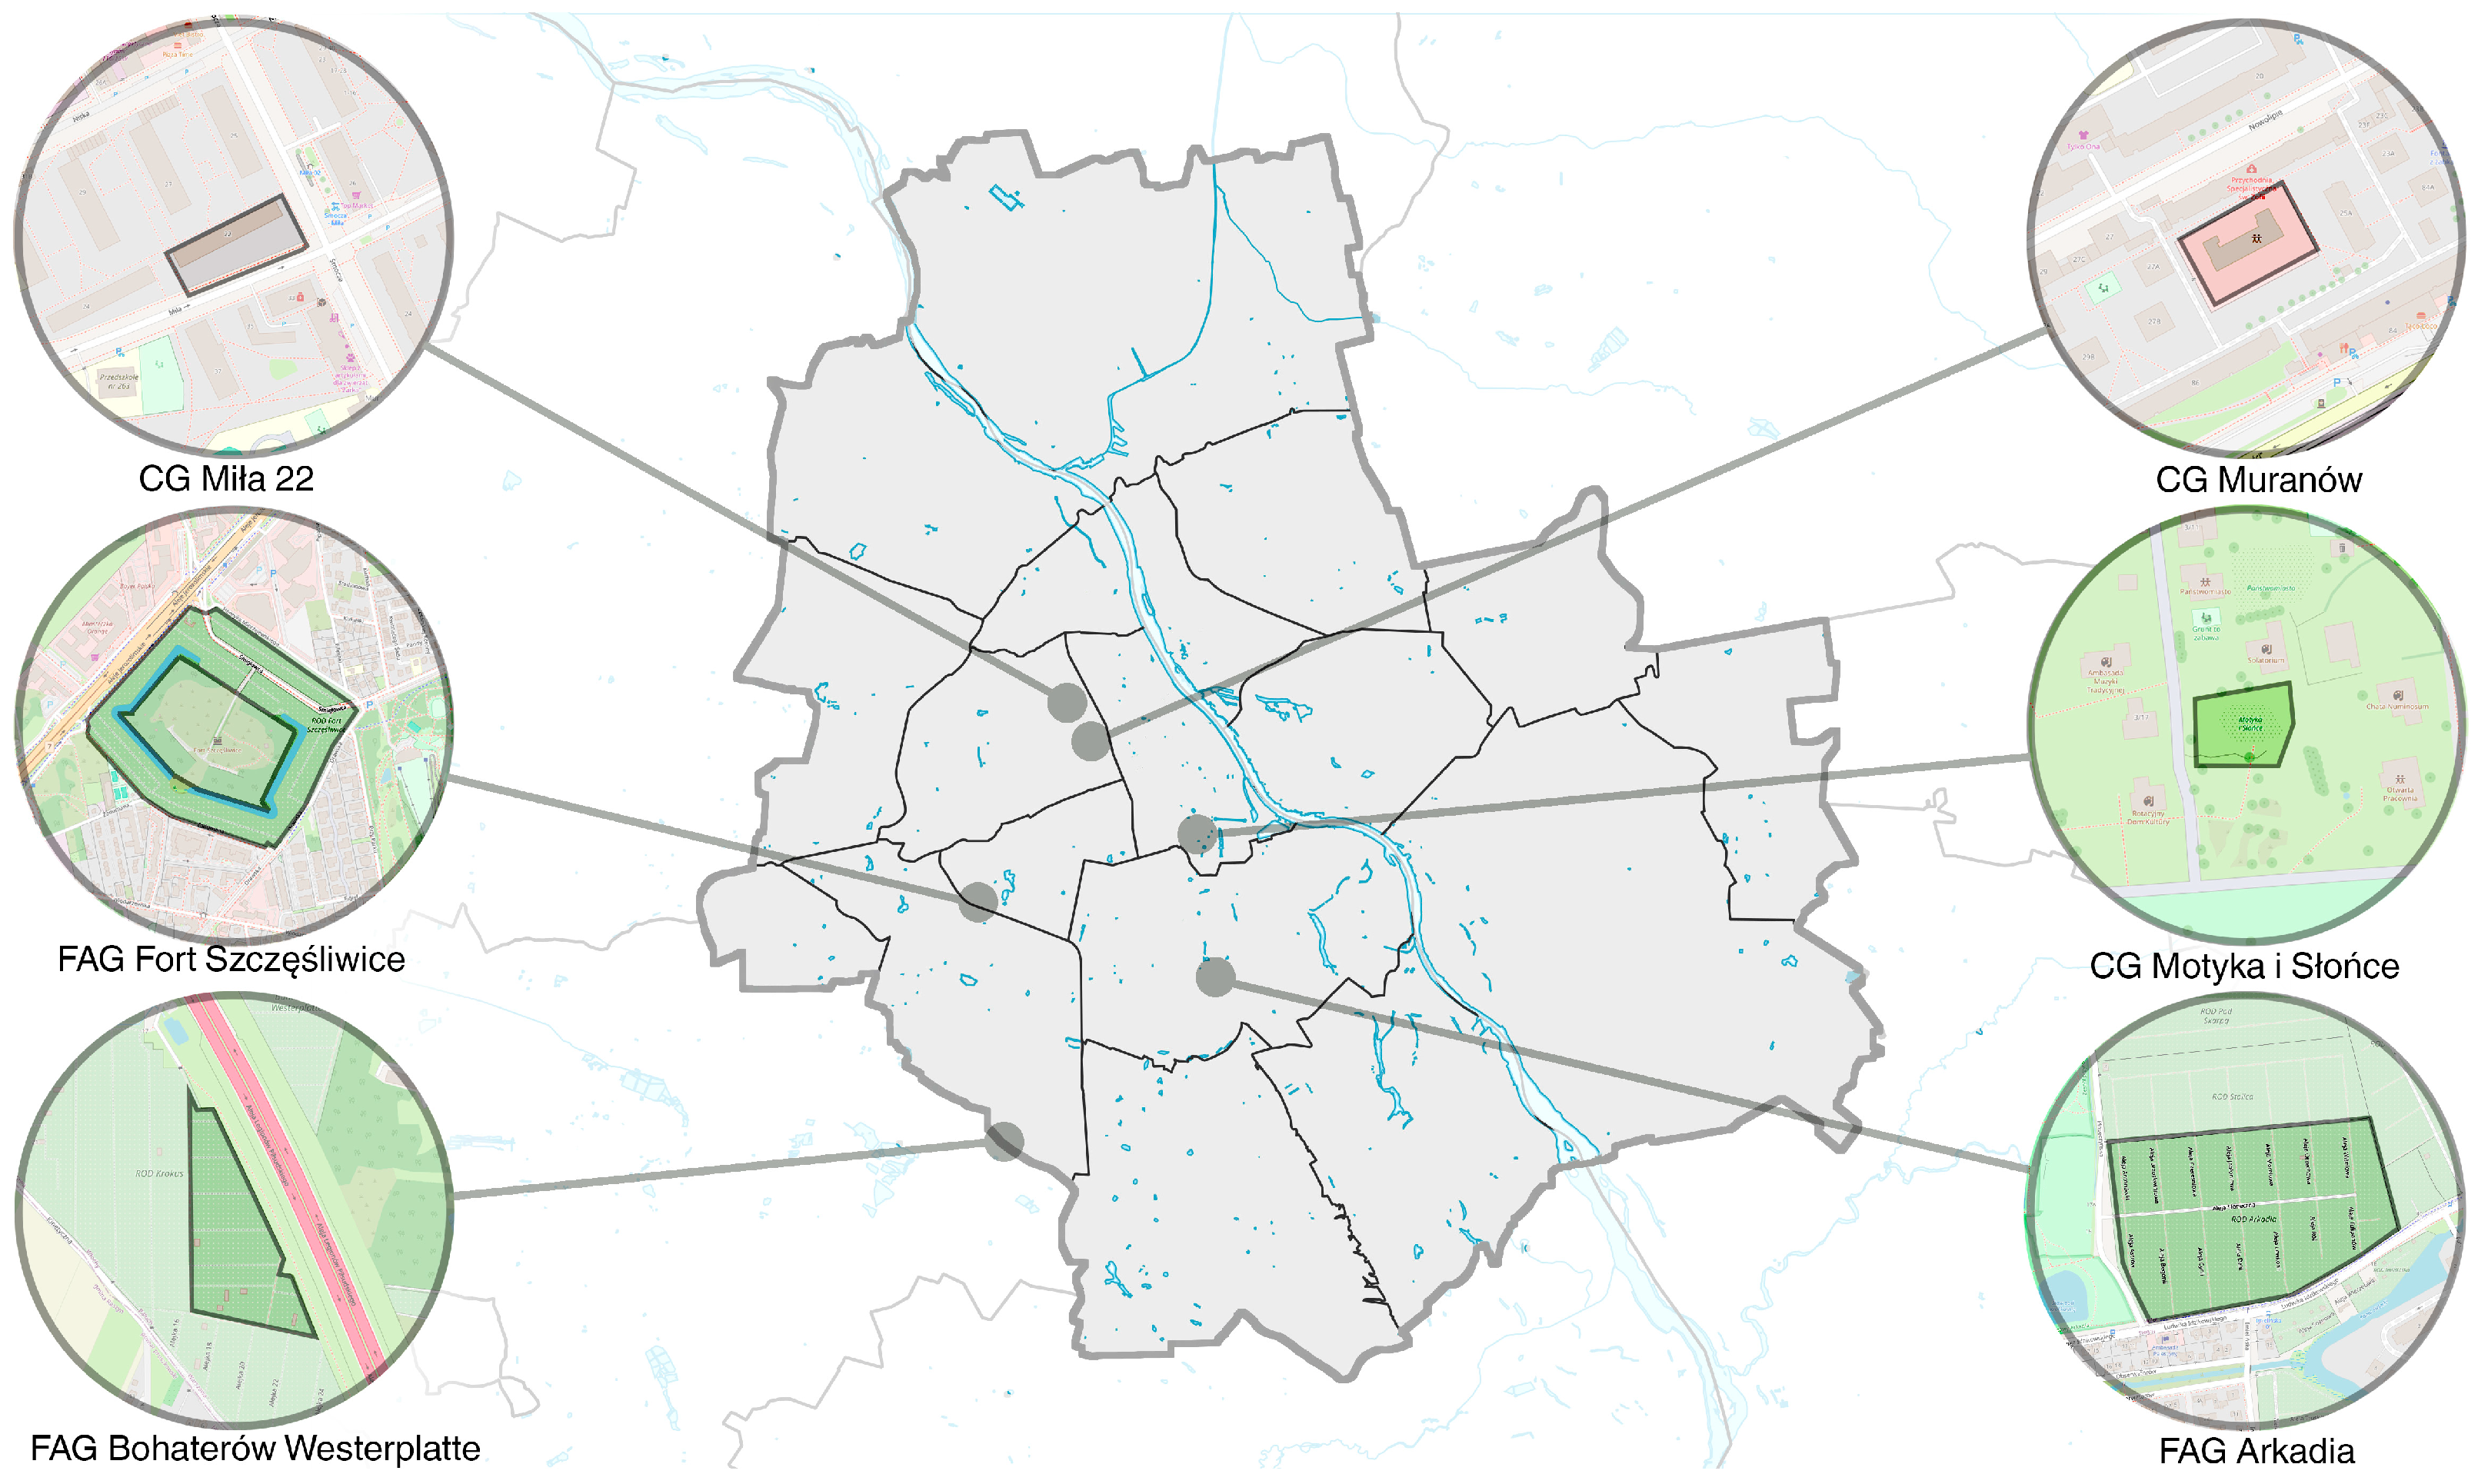
| FAGs | Family Allotment Gardens |
| CGs | Community Gardens |
| LAI | Leaf Area Index |
Appendix A. Characteristics of Selected Study Sites—Family Allotment Gardens
| FAG FORT SZCZĘŚLIWICE | FAG ARKADIA | FAG BOHATERÓW WESTERPLATTE | |
| DATE OF GARDEN ESTABLISHMENT | 1963 * | 1953 ** | 1964 *** |
| AREA [HA] | 21.1 | 9.89 ** | >6 |
| NUMBER OF PLOTS | >250 | 177 | Ok. 150 |
| DIRECT LINE DISTANCE FROM THE CITY CENTER | 3–5 km | 5–8 km | >8 km |
| DISTANCE FROM AIRPORT | ~4 km | ~5 km | ~1 km |
| EXTENT OF HEAT ISLAND (YES/NO) | yes | yes | no |
| SOIL **** | Podzolic or brown earth soil | Degraded chernozem | Chernozem |
| GROUND WATER **** | 5–10 m | 2–5 m | >10 m |
| SITE SURROUNDINGS | ROD is located near a major railway junction and the S7 expressway with high traffic intensity. Warszawa Zachodnia railway station lies approx. 1.5 km away. To the east, the site borders Szczęśliwicki Park. Within a 1 km radius are large shopping centers such as Atrium Reduta and Blue City. The northeast vicinity includes dense residential development of the Ochota district. (https://www.google.com/maps; 15.10.2024 r.). | The allotment gardens surround the Piłsudski Fort and the Arkadia Park with the Królikarnia on the Warsaw escarpment. In the nearby Arkadia Park, at a distance of 100 m from the entrance gate to the ROD in question, there are water reservoirs. Another reservoir is located in the vicinity of Fort Piłsudski separated from the Arkadia ROD by Idzikowskiego Street. Approximately 0.5 km away is Pulawska Street with heavy traffic. To the west of the ROD are the dense developments of Wierzbno, Stary Mokotow, and Sluzewiec. To the east of the Garden are numerous green areas and the Siekierki Power Station, with the Vistula River approximately 5 km away. The south-west is mainly the densely populated Sadyba and Wilanów Wysoki. (https://www.google.com/maps; 15.10.2024 r.). | In the neighborhood, on the north-eastern side, there is Chopin Airport (approx. 1 km). To the west, it is bordered by the dense built-up area of the town of Raszyn. To the south, it is surrounded by agricultural areas. ROD on the outskirts of the city. |
| * https://pzd.pl/archiwum/strona.php?3265 (access 20 October 2024 r.) ** http://pzd.pl/artykuly/17650/61/Arkadia-kraina-szczesliwosci.html.(access 20 October 2024 r.) *** https://rodbohwesterplatte.pl/historia-ogrodu/ (access 20 October 2024 r.) **** Ecophysiographic Atlas 2018—https://architektura.um.warszawa.pl/documents/12025039/26223617/atlas_ekofizjograficzny.pdf/94816176-87cd-2d9b-5bf8-79e37a12dea0?t=1634497935335 (access 20 October 2024 r.) | |||
Appendix B. Characteristics of Selected Research Sites—Community Gardens
| CG MOTYKA I SŁOŃCE | CG MIŁA 22 | CG MURANÓW | |
| DATE OF GARDEN ESTABLISHMENT | 2014 | 2000 | 2018–2020 |
| AREA [HA] | 0.07 ha | 0.3 ha | 0.2 ha |
| NUMBER OF PLOTS | 1 | 1 | 1 |
| DIRECT LINE DISTANCE FROM THE CITY CENTER | ~2 km | ~2 km | ~1–2 km |
| DISTANCE FROM AIRPORT | ~6 km | ~8 km | ~7 km |
| EXTENT OF HEAT ISLAND (YES/NO) | Yes | Yes | Yes |
| SOIL **** | Anthropogenic | Anthropogenic | Anthropogenic |
| GROUND WATER **** | 5–10 m | 5–10 m | 5–10 m |
| SITE SURROUNDINGS | The vegetable and herb garden was born out of the need to introduce the cultivation of edible plants to the city and to address the theme of food self-sufficiency. The garden is used by about 40 gardeners who come to the area twice a week on specific days. The garden is an open space and is used as the site of nature, cooking, and gardening workshops. | Flower and vegetable garden, with fruit trees; neighborhood garden managed by a community of residents at 22 Miła Street. | A garden with raised herbs, vegetables, and flowers; created on the premises of the Centre for Intergenerational Activity on Nowolipie Street in Warsaw. Anyone interested can join in the collective seasonal planting or sowing of herbs, flowers, vegetables, and fruit. The aim of establishing this garden is to strengthen the activities of seniors and intergenerational groups through neighborhood and city integration. The initiative is part of the Design-led Innovations for Active Ageing project. |
| **** Ecophysiographic Atlas 2018—https://architektura.um.warszawa.pl/documents/12025039/26223617/atlas_ekofizjograficzny.pdf/94816176-87cd-2d9b-5bf8-79e37a12dea0?t=1634497935335 (access: 20 October 2024 r.) | |||
References
- Dymek, D.; Wilkaniec, A.; Bednorz, L.; Szczepańska, M. Significance of Allotment Gardens in Urban Green Space Systems and Their Classification for Spatial Planning Purposes: A Case Study of Poznań, Poland. Sustainability 2021, 13, 11044. [Google Scholar] [CrossRef]
- Spilková, J.; Vágner, J. The Loss of Land Devoted to Allotment Gardening: The Context of the Contrasting Pressures of Urban Planning, Public and Private Interests in Prague, Czechia. Land Use Policy 2016, 52, 232–239. [Google Scholar] [CrossRef]
- Noori, S.; Benson, M.; Gawryszewska, B.; Hardman, M.; Kasemets, K.; Partalidou, M.; Pikner, T.; Willman, K. Urban Allotment Gardens in Europe; Routledge: London, UK, 2016; ISBN 978-1-138-92109-2. [Google Scholar]
- Haase, D.; Gaeva, D. Allotments for All? Social–Environmental Values of Urban Gardens for Gardeners and the Public in Cities: The Example of Berlin, Germany. People Nat. 2023, 5, 1207–1219. [Google Scholar] [CrossRef]
- Pawlikowska-Piechotka, A. Active Recreation Space ’for All’: Family Gardens in Poland. Stud. Phys. Cult. Tour. 2011, 18, 18–27. [Google Scholar]
- Pourias, J. Urban Allotment Gardens in the City in Crisis. Insights from Sevilla (Spain). In Proceedings of the COST Action Urban Allotment Gardens Short Term Scientific Mission Sevilla, Andalucía, Spain, 7 April–3 June 2015. [Google Scholar]
- Janowska, B.; Łój, J.; Andrzejak, R. Role of Community Gardens in Development of Housing Estates in Polish Cities. Agronomy 2022, 12, 1447. [Google Scholar] [CrossRef]
- Gray, T.; Tracey, D.; Truong, S.; Ward, K. Community Gardens as Local Learning Environments in Social Housing Contexts: Participant Perceptions of Enhanced Wellbeing and Community Connection. Local Environ. 2022, 27, 570–585. [Google Scholar] [CrossRef]
- Maćkiewicz, B.; Szczepańska, M.; Kacprzak, E.; Fox-Kämper, R. Between Food Growing and Leisure: Contemporary Allotment Gardeners in Western Germany and Poland. Die ERDE J. Geogr. Soc. Berl. 2021, 152, 33–50. [Google Scholar] [CrossRef]
- Schoen, V.; Blythe, C.; Caputo, S.; Fox-Kämper, R.; Specht, K.; Fargue-Lelièvre, A.; Cohen, N.; Poniży, L.; Fedeńczak, K. “We Have Been Part of the Response”: The Effects of COVID-19 on Community and Allotment Gardens in the Global North. Front. Sustain. Food Syst. 2021, 5, 732641. [Google Scholar] [CrossRef]
- Bell, S.; Fox-Kämper, R.; Keshavarz, N.; Benson, M.; Caputo, S.; Noori, S.; Voigt, A. (Eds.) Urban Allotment Gardens in Europe; Routledge: London, UK; Taylor & Francis Group: New York, NY, USA, 2016; ISBN 978-1-315-68660-8. [Google Scholar]
- Chalmin-Pui, L.S.; Roe, J.; Griffiths, A.; Smyth, N.; Heaton, T.; Clayden, A.; Cameron, R. “It Made Me Feel Brighter in Myself”—The Health and Well-Being Impacts of a Residential Front Garden Horticultural Intervention. Landsc. Urban Plan. 2021, 205, 103958. [Google Scholar] [CrossRef]
- Mokras-Grabowska, J. Contemporary Trends in Urban Allotment Gardening: The Example of Family Plots in Warsaw. KWOM 2021, 34, 99–105. [Google Scholar] [CrossRef]
- Breuste, J.H.; Artmann, M. Allotment Gardens Contribute to Urban Ecosystem Service: Case Study Salzburg, Austria. J. Urban Plann. Dev. 2015, 141, A5014005. [Google Scholar] [CrossRef]
- Sovová, L. Self-Provisioning, Sustainability and Environmental Consciousness in Brno Allotment Gardens. Sociální Stud./Soc. Stud. 2015, 12, 11–26. [Google Scholar] [CrossRef]
- Edmondson, J.L.; Childs, D.Z.; Dobson, M.C.; Gaston, K.J.; Warren, P.H.; Leake, J.R. Feeding a City—Leicester as a Case Study of the Importance of Allotments for Horticultural Production in the UK. Sci. Total Environ. 2020, 705, 135930. [Google Scholar] [CrossRef]
- Borysiak, J.; Mizgajski, A.; Speak, A. Floral Biodiversity of Allotment Gardens and Its Contribution to Urban Green Infrastructure. Urban Ecosyst. 2017, 20, 323–335. [Google Scholar] [CrossRef]
- Cabral, I.; Keim, J.; Engelmann, R.; Kraemer, R.; Siebert, J.; Bonn, A. Ecosystem Services of Allotment and Community Gardens: A Leipzig, Germany Case Study. Urban For. Urban Green. 2017, 23, 44–53. [Google Scholar] [CrossRef]
- Goddard, M.A.; Dougill, A.J.; Benton, T.G. Scaling up from Gardens: Biodiversity Conservation in Urban Environments. Trends Ecol. Evol. 2010, 25, 90–98. [Google Scholar] [CrossRef]
- Lin, B.B.; Philpott, S.M.; Jha, S. The Future of Urban Agriculture and Biodiversity-Ecosystem Services: Challenges and next Steps. Basic Appl. Ecol. 2015, 16, 189–201. [Google Scholar] [CrossRef]
- Speak, A.F.; Mizgajski, A.; Borysiak, J. Allotment Gardens and Parks: Provision of Ecosystem Services with an Emphasis on Biodiversity. Urban For. Urban Green. 2015, 14, 772–781. [Google Scholar] [CrossRef]
- Baldock, K.C. Opportunities and Threats for Pollinator Conservation in Global Towns and Cities. Curr. Opin. Insect Sci. 2020, 38, 63–71. [Google Scholar] [CrossRef]
- Ahrné, K.; Bengtsson, J.; Elmqvist, T. Bumble Bees (Bombus Spp) along a Gradient of Increasing Urbanization. PLoS ONE 2009, 4, e5574. [Google Scholar] [CrossRef]
- Fetridge, E.D.; Ascher, J.S.; Langellotto, G.A. The Bee Fauna of Residential Gardens in a Suburb of New York City (Hymenoptera: Apoidea). Ann. Entomol. Soc. Am. 2008, 101, 1067–1077. [Google Scholar] [CrossRef]
- Smith, R.M.; Warren, P.H.; Thompson, K.; Gaston, K.J. Urban Domestic Gardens (VI): Environmental Correlates of Invertebrate Species Richness. Biodivers. Conserv. 2006, 15, 2415–2438. [Google Scholar] [CrossRef]
- Ignatieva, M.; Haase, D.; Dushkova, D.; Haase, A. Lawns in Cities: From a Globalised Urban Green Space Phenomenon to Sustainable Nature-Based Solutions. Land 2020, 9, 73. [Google Scholar] [CrossRef]
- Ignatieva, M.; Hedblom, M. An Alternative Urban Green Carpet. Science 2018, 362, 148–149. [Google Scholar] [CrossRef]
- Robbins, P. Lawn People: How Grasses, Weeds, and Chemicals Make Us Who We Are; Temple University Press: Philadelphia, PA, USA, 2007; ISBN 978-1-59213-578-3. [Google Scholar]
- Liu, S.; Ward, S.E.; Wilby, A.; Manning, P.; Gong, M.; Davies, J.; Killick, R.; Quinton, J.N.; Bardgett, R.D. Multiple Targeted Grassland Restoration Interventions Enhance Ecosystem Service Multifunctionality. Nat. Commun. 2025, 16, 3971. [Google Scholar] [CrossRef]
- Jin, G.; Chen, K.; Liao, T.; Zhang, L.; Najmuddin, O. Measuring Ecosystem Services Based on Government Intentions for Future Land Use in Hubei Province: Implications for Sustainable Landscape Management. Landsc. Ecol 2021, 36, 2025–2042. [Google Scholar] [CrossRef]
- Bartłomiejski, R.; Kowalewski, M. Polish Urban Allotment Gardens as ‘Slow City’ Enclaves. Sustainability 2019, 11, 3228. [Google Scholar] [CrossRef]
- Aronson, M.F.; Lepczyk, C.A.; Evans, K.L.; Goddard, M.A.; Lerman, S.B.; MacIvor, J.S.; Nilon, C.H.; Vargo, T. Biodiversity in the City: Key Challenges for Urban Green Space Management. Front. Ecol Env. 2017, 15, 189–196. [Google Scholar] [CrossRef]
- Kowarik, I. Novel Urban Ecosystems, Biodiversity, and Conservation. Environ. Pollut. 2011, 159, 1974–1983. [Google Scholar] [CrossRef]
- Nassauer, J.I.; Wang, Z.; Dayrell, E. What Will the Neighbors Think? Cultural Norms and Ecological Design. Landsc. Urban Plan. 2009, 92, 282–292. [Google Scholar] [CrossRef]
- Ignatieva, M.; Ahrné, K.; Wissman, J.; Eriksson, T.; Tidåker, P.; Hedblom, M.; Kätterer, T.; Marstorp, H.; Berg, P.; Eriksson, T.; et al. Lawn as a Cultural and Ecological Phenomenon: A Conceptual Framework for Transdisciplinary Research. Urban For. Urban Green. 2015, 14, 383–387. [Google Scholar] [CrossRef]
- Magurran, A.E. Measuring Biological Diversity; Blackwell Pub: Malden, MA, USA, 2004; ISBN 978-0-632-05633-0. [Google Scholar]
- Luo, S.; Patuano, A. Multiple Ecosystem Services of Informal Green Spaces: A Literature Review. Urban For. Urban Green. 2023, 81, 127849. [Google Scholar] [CrossRef]
- Robinson, S.L.; Lundholm, J.T. Ecosystem Services Provided by Urban Spontaneous Vegetation. Urban Ecosyst. 2012, 15, 545–557. [Google Scholar] [CrossRef]
- Threlfall, C.G.; Kendal, D. The Distinct Ecological and Social Roles That Wild Spaces Play in Urban Ecosystems. Urban For. Urban Green. 2018, 29, 348–356. [Google Scholar] [CrossRef]
- Vereecken, N.J.; Weekers, T.; Marshall, L.; D’Haeseleer, J.; Cuypers, M.; Pauly, A.; Pasau, B.; Leclercq, N.; Tshibungu, A.; Molenberg, J.; et al. Five Years of Citizen Science and Standardised Field Surveys in an Informal Urban Green Space Reveal a Threatened Eden for Wild Bees in Brussels, Belgium. Insect Conserv. Divers. 2021, 14, 868–876. [Google Scholar] [CrossRef]
- Gawryszewska, B.J.; Łepkowski, M.; Pietrych, Ł.; Wilczyńska, A.; Archiciński, P. The Structure of Beauty: Informal Green Spaces in Their Users’ Eyes. Sustainability 2024, 16, 1619. [Google Scholar] [CrossRef]
- Sikorski, P.; Gawryszewska, B.; Sikorska, D.; Chormański, J.; Schwerk, A.; Jojczyk, A.; Ciężkowski, W.; Archiciński, P.; Łepkowski, M.; Dymitryszyn, I.; et al. The Value of Doing Nothing—How Informal Green Spaces Can Provide Comparable Ecosystem Services to Cultivated Urban Parks. Ecosyst. Serv. 2021, 50, 101339. [Google Scholar] [CrossRef]
- CBOS. Opinions on Allotment Gardens; CBOS Centrum Badania Opinii Społecznej: Warszawa, Poland, 2012. (In Polish) [Google Scholar]
- Pradhan, P.; Callaghan, M.; Hu, Y.; Dahal, K.; Hunecke, C.; Reusswig, F.; Lotze-Campen, H.; Kropp, J.P. A Systematic Review Highlights That There Are Multiple Benefits of Urban Agriculture besides Food. Glob. Food Secur. 2023, 38, 100700. [Google Scholar] [CrossRef]
- Ribeiro, A.; Madureira, L.; Carvalho, R. Evidence on How Urban Gardens Help Citizens and Cities to Enhance Sustainable Development. Review and Bibliometric Analysis. Landsc. Urban Plan. 2023, 236, 104766. [Google Scholar] [CrossRef]
- Zutter, C.; Stoltz, A. Community Gardens and Urban Agriculture: Healthy Environment/Healthy Citizens. Int. J. Ment. Health Nurs. 2023, 32, 1452–1461. [Google Scholar] [CrossRef]
- Kimic, K. The Orchard as a Distinctive Element of an Urban Park—History and Modernity; Urbanity and Architecture Files; Wydział PAN: Krakow, Poland, 2023; (In Polish). [Google Scholar] [CrossRef]
- Pająkowski, J.; Sobieralska, R. (Eds.) Traditional Home Orchards; Society of the Friends of the Lower Vistula: The Chełmiński and Nadwiślański Landscape Parks Complex: Świecie, Poland, 2009; ISBN 978-83-61821-02-1. (In Polish) [Google Scholar]
- Mirek, Z.; Piękoś-Mirkowa, H.; Zając, A.; Zając, M. Flowering Plants and Pteridophytes of Poland a Checklist. In Biodiversity of Poland; Biernacki, L., Mirek, Z., Eds.; W. Szafer Institute of Botany, Polish Academy of Sciences: Krakow, Poland, 2002; Volume 1; ISBN 978-83-85444-83-1. (In Polish) [Google Scholar]
- Baude, M.; Kunin, W.E.; Boatman, N.D.; Conyers, S.; Davies, N.; Gillespie, M.A.K.; Morton, R.D.; Smart, S.M.; Memmott, J. Historical Nectar Assessment Reveals the Fall and Rise of Floral Resources in Britain. Nature 2016, 530, 85–88. [Google Scholar] [CrossRef] [PubMed]
- Sulborska-Różycka, A.; Konarska, A.; Weryszko-Chmielewska, E.; Dmitruk, M. Nectar Guides and Floral Nectary in Lamium Album L. Subsp. Album: Structure and Histochemistry in Light, Fluorescence, and Electron Microscopy. Micron 2023, 171, 103474. [Google Scholar] [CrossRef]
- Poniży, L.; Latkowska, M.J.; Breuste, J.; Hursthouse, A.; Joimel, S.; Külvik, M.; Leitão, T.E.; Mizgajski, A.; Voigt, A.; Kacprzak, E.; et al. The Rich Diversity of Urban Allotment Gardens in Europe: Contemporary Trends in the Context of Historical, Socio-Economic and Legal Conditions. Sustainability 2021, 13, 11076. [Google Scholar] [CrossRef]
- Nordh, H.; Wiklund, K.T.; Koppang, K.E. Norwegian Allotment Gardens—A Study of Motives and Benefits. Landsc. Res. 2016, 41, 853–868. [Google Scholar] [CrossRef]
- Venn, E.J. Community Gardens in Urban Areas: A Critical Reflection on the Extent to Which They Strenghten Social Cohesion and Provide Alternative Food; Wageningen University: Wageningen, The Netherlands, 2015. [Google Scholar]
- Melon, M.; Sikorski, P.; Archiciński, P.; Łaszkiewicz, E.; Hoppa, A.; Zaniewski, P.; Zaniewska, E.; Strużyński, W.; Sudnik-Wójcikowska, B.; Sikorska, D. Nature on Our Doorstep: How Do Residents Perceive Urban Parks vs. Biodiverse Areas? Landsc. Urban Plan. 2024, 247, 105059. [Google Scholar] [CrossRef]
- Clarke, L.W.; Jenerette, G.D. Biodiversity and Direct Ecosystem Service Regulation in the Community Gardens of Los Angeles, CA. Landsc. Ecol 2015, 30, 637–653. [Google Scholar] [CrossRef]
- Jha, S.; Egerer, M.; Bichier, P.; Cohen, H.; Liere, H.; Lin, B.; Lucatero, A.; Philpott, S.M. Multiple Ecosystem Service Synergies and Landscape Mediation of Biodiversity within Urban Agroecosystems. Ecol. Lett. 2023, 26, 369–383. [Google Scholar] [CrossRef]
- Tresch, S.; Frey, D.; Bayon, R.-C.L.; Mäder, P.; Stehle, B.; Fliessbach, A.; Moretti, M. Direct and Indirect Effects of Urban Gardening on Aboveground and Belowground Diversity Influencing Soil Multifunctionality. Sci. Rep. 2019, 9, 9769. [Google Scholar] [CrossRef]
- Wang, X.; Zhou, Z.; Xiang, Y.; Peng, C.; Peng, C. Effects of Street Plants on Atmospheric Particulate Dispersion in Urban Streets: A Review. Environ. Rev. 2024, 32, 114–130. [Google Scholar] [CrossRef]
- Abhijith, K.V.; Kumar, P.; Gallagher, J.; McNabola, A.; Baldauf, R.; Pilla, F.; Broderick, B.; Di Sabatino, S.; Pulvirenti, B. Air Pollution Abatement Performances of Green Infrastructure in Open Road and Built-up Street Canyon Environments—A Review. Atmos. Environ. 2017, 162, 71–86. [Google Scholar] [CrossRef]
- Di Pietro, R.; Azzella, M.M. Sustainable and Together: Between Ecology, Health and Governance. In Beyond the Garden; Dal Falco, F., Ed.; Designing Environments; Springer Nature Switzerland: Cham, Switzerland, 2024; pp. 39–56. ISBN 978-3-031-50566-9. [Google Scholar]
- Neumann, A.E.; Conitz, F.; Karlebowski, S.; Sturm, U.; Schmack, J.M.; Egerer, M. Flower Richness Is Key to Pollinator Abundance: The Role of Garden Features in Cities. Basic Appl. Ecol. 2024, 79, 102–113. [Google Scholar] [CrossRef]
- Schmack, J.M.; Egerer, M. Floral Richness and Seasonality Influences Bee and Non-Bee Flower Interactions in Urban Community Gardens. Urban Ecosyst. 2023, 26, 1099–1112. [Google Scholar] [CrossRef]
- Doody, B.J.; Perkins, H.C.; Sullivan, J.J.; Meurk, C.D.; Stewart, G.H. Performing Weeds: Gardening, Plant Agencies and Urban Plant Conservation. Geoforum 2014, 56, 124–136. [Google Scholar] [CrossRef]
- Erdős, L.; Krstonošić, D.; Kiss, P.J.; Bátori, Z.; Tölgyesi, C.; Škvorc, Ž. Plant Composition and Diversity at Edges in a Semi-Natural Forest–Grassland Mosaic. Plant Ecol. 2019, 220, 279–292. [Google Scholar] [CrossRef]
- Martínez-Falcón, A.P.; Zurita, G.A.; Ortega-Martínez, I.J.; Moreno, C.E. Populations and Assemblages Living on the Edge: Dung Beetles Responses to Forests-Pasture Ecotones. PeerJ 2018, 6, e6148. [Google Scholar] [CrossRef]
- Shahidan, M.F. Effects of Tree Shading in Modifying Tropical Microclimate and Urban Heat Island Effect. In Urban Forestry and Arboriculture in Malaysia; Maruthaveeran, S., Chen, W.Y., Morgenroth, J., Eds.; Springer Nature: Singapore, 2022; pp. 223–235. ISBN 978-981-19541-7-7. [Google Scholar]
- Stępniewska, M.; Mizgajski, A. (Eds.) Ecology 2000, 81. Ecosystem Services in Environmental System Management; Bogucki Wydawnictwo Naukowe: Poznań, Poland, 2023; ISBN 978-83-7986-469-0. (In Polish) [Google Scholar]


| Indicator | Indicator Measurement Method | |
|---|---|---|
| Plant species diversity | Number of species | Number of vascular plant species per plot, nomenclature according to Mirek et al. (2002) [49] |
| Shannon index | The Shannon index was calculated following Magurran (2004) [36], based on the list of species and their relative cover in the undergrowth, using the standard formula: where pi is the proportion of individuals of the i-th species relative to the total in the plot. | |
| Leaf area index (LAI) | LAI value measured near the ground, after calibrating the device at a height of 1 m. The LAI was measured with the SunScan Canopy Analysis System (Delta-T Devices). | |
| Regulatory ecosystem services | Soil retention [%] | Measurement of soil moisture 0–10 cm by the HH2 device with W.E.T. probe in % relative to reference lawn ** |
| Soil cooling [°C] | Measurement of soil temperature 0–10 cm by the HH2 device with W.E.T. probe relative to reference lawn * | |
| Air humidity [%] | Measured air temperature with the Sniffer4DMapper relative to the average outside the facility ** | |
| Air cooling [°C] | Measured air temperature with the Sniffer4DMapper relative to the average air quality measured outside the facility ** | |
| Nectar and pollen production [kg/ha] | Food potential for pollinators based on established vegetation, taking the values of pollen and nectar produced by each species in kg/ha [50,51] where . | |
| Reduction of PM 2.5 | Air pollution of PM 2.5 particulate matter was measured using the Sniffer4DMapper. Measurements taken every 1 s on the sample area were averaged. Dust reduction is calculated as the difference between the measurement at the point and the average outside the site boundary **. |
Disclaimer/Publisher’s Note: The statements, opinions and data contained in all publications are solely those of the individual author(s) and contributor(s) and not of MDPI and/or the editor(s). MDPI and/or the editor(s) disclaim responsibility for any injury to people or property resulting from any ideas, methods, instructions or products referred to in the content. |
© 2025 by the authors. Licensee MDPI, Basel, Switzerland. This article is an open access article distributed under the terms and conditions of the Creative Commons Attribution (CC BY) license (https://creativecommons.org/licenses/by/4.0/).
Share and Cite
Melon, M.; Dzieduszyński, T.; Gawryszewska, B.; Lasocki, M.; Hoppa, A.; Przybysz, A.; Sikorski, P. Urban Allotment Gardens with Turf Reduce Biodiversity and Provide Limited Regulatory Ecosystem Services. Sustainability 2025, 17, 6216. https://doi.org/10.3390/su17136216
Melon M, Dzieduszyński T, Gawryszewska B, Lasocki M, Hoppa A, Przybysz A, Sikorski P. Urban Allotment Gardens with Turf Reduce Biodiversity and Provide Limited Regulatory Ecosystem Services. Sustainability. 2025; 17(13):6216. https://doi.org/10.3390/su17136216
Chicago/Turabian StyleMelon, Marta, Tomasz Dzieduszyński, Beata Gawryszewska, Maciej Lasocki, Adrian Hoppa, Arkadiusz Przybysz, and Piotr Sikorski. 2025. "Urban Allotment Gardens with Turf Reduce Biodiversity and Provide Limited Regulatory Ecosystem Services" Sustainability 17, no. 13: 6216. https://doi.org/10.3390/su17136216
APA StyleMelon, M., Dzieduszyński, T., Gawryszewska, B., Lasocki, M., Hoppa, A., Przybysz, A., & Sikorski, P. (2025). Urban Allotment Gardens with Turf Reduce Biodiversity and Provide Limited Regulatory Ecosystem Services. Sustainability, 17(13), 6216. https://doi.org/10.3390/su17136216