
Research on the Spatiotemporal Changes and Driving Forces of Ecological Quality in Inner Mongolia Based on Long-Term Time Series

Abstract
1. Introduction
2. Materials and Methods
2.1. Overview of Study Area and Data Acquisition
2.2. Data Sources and Processing
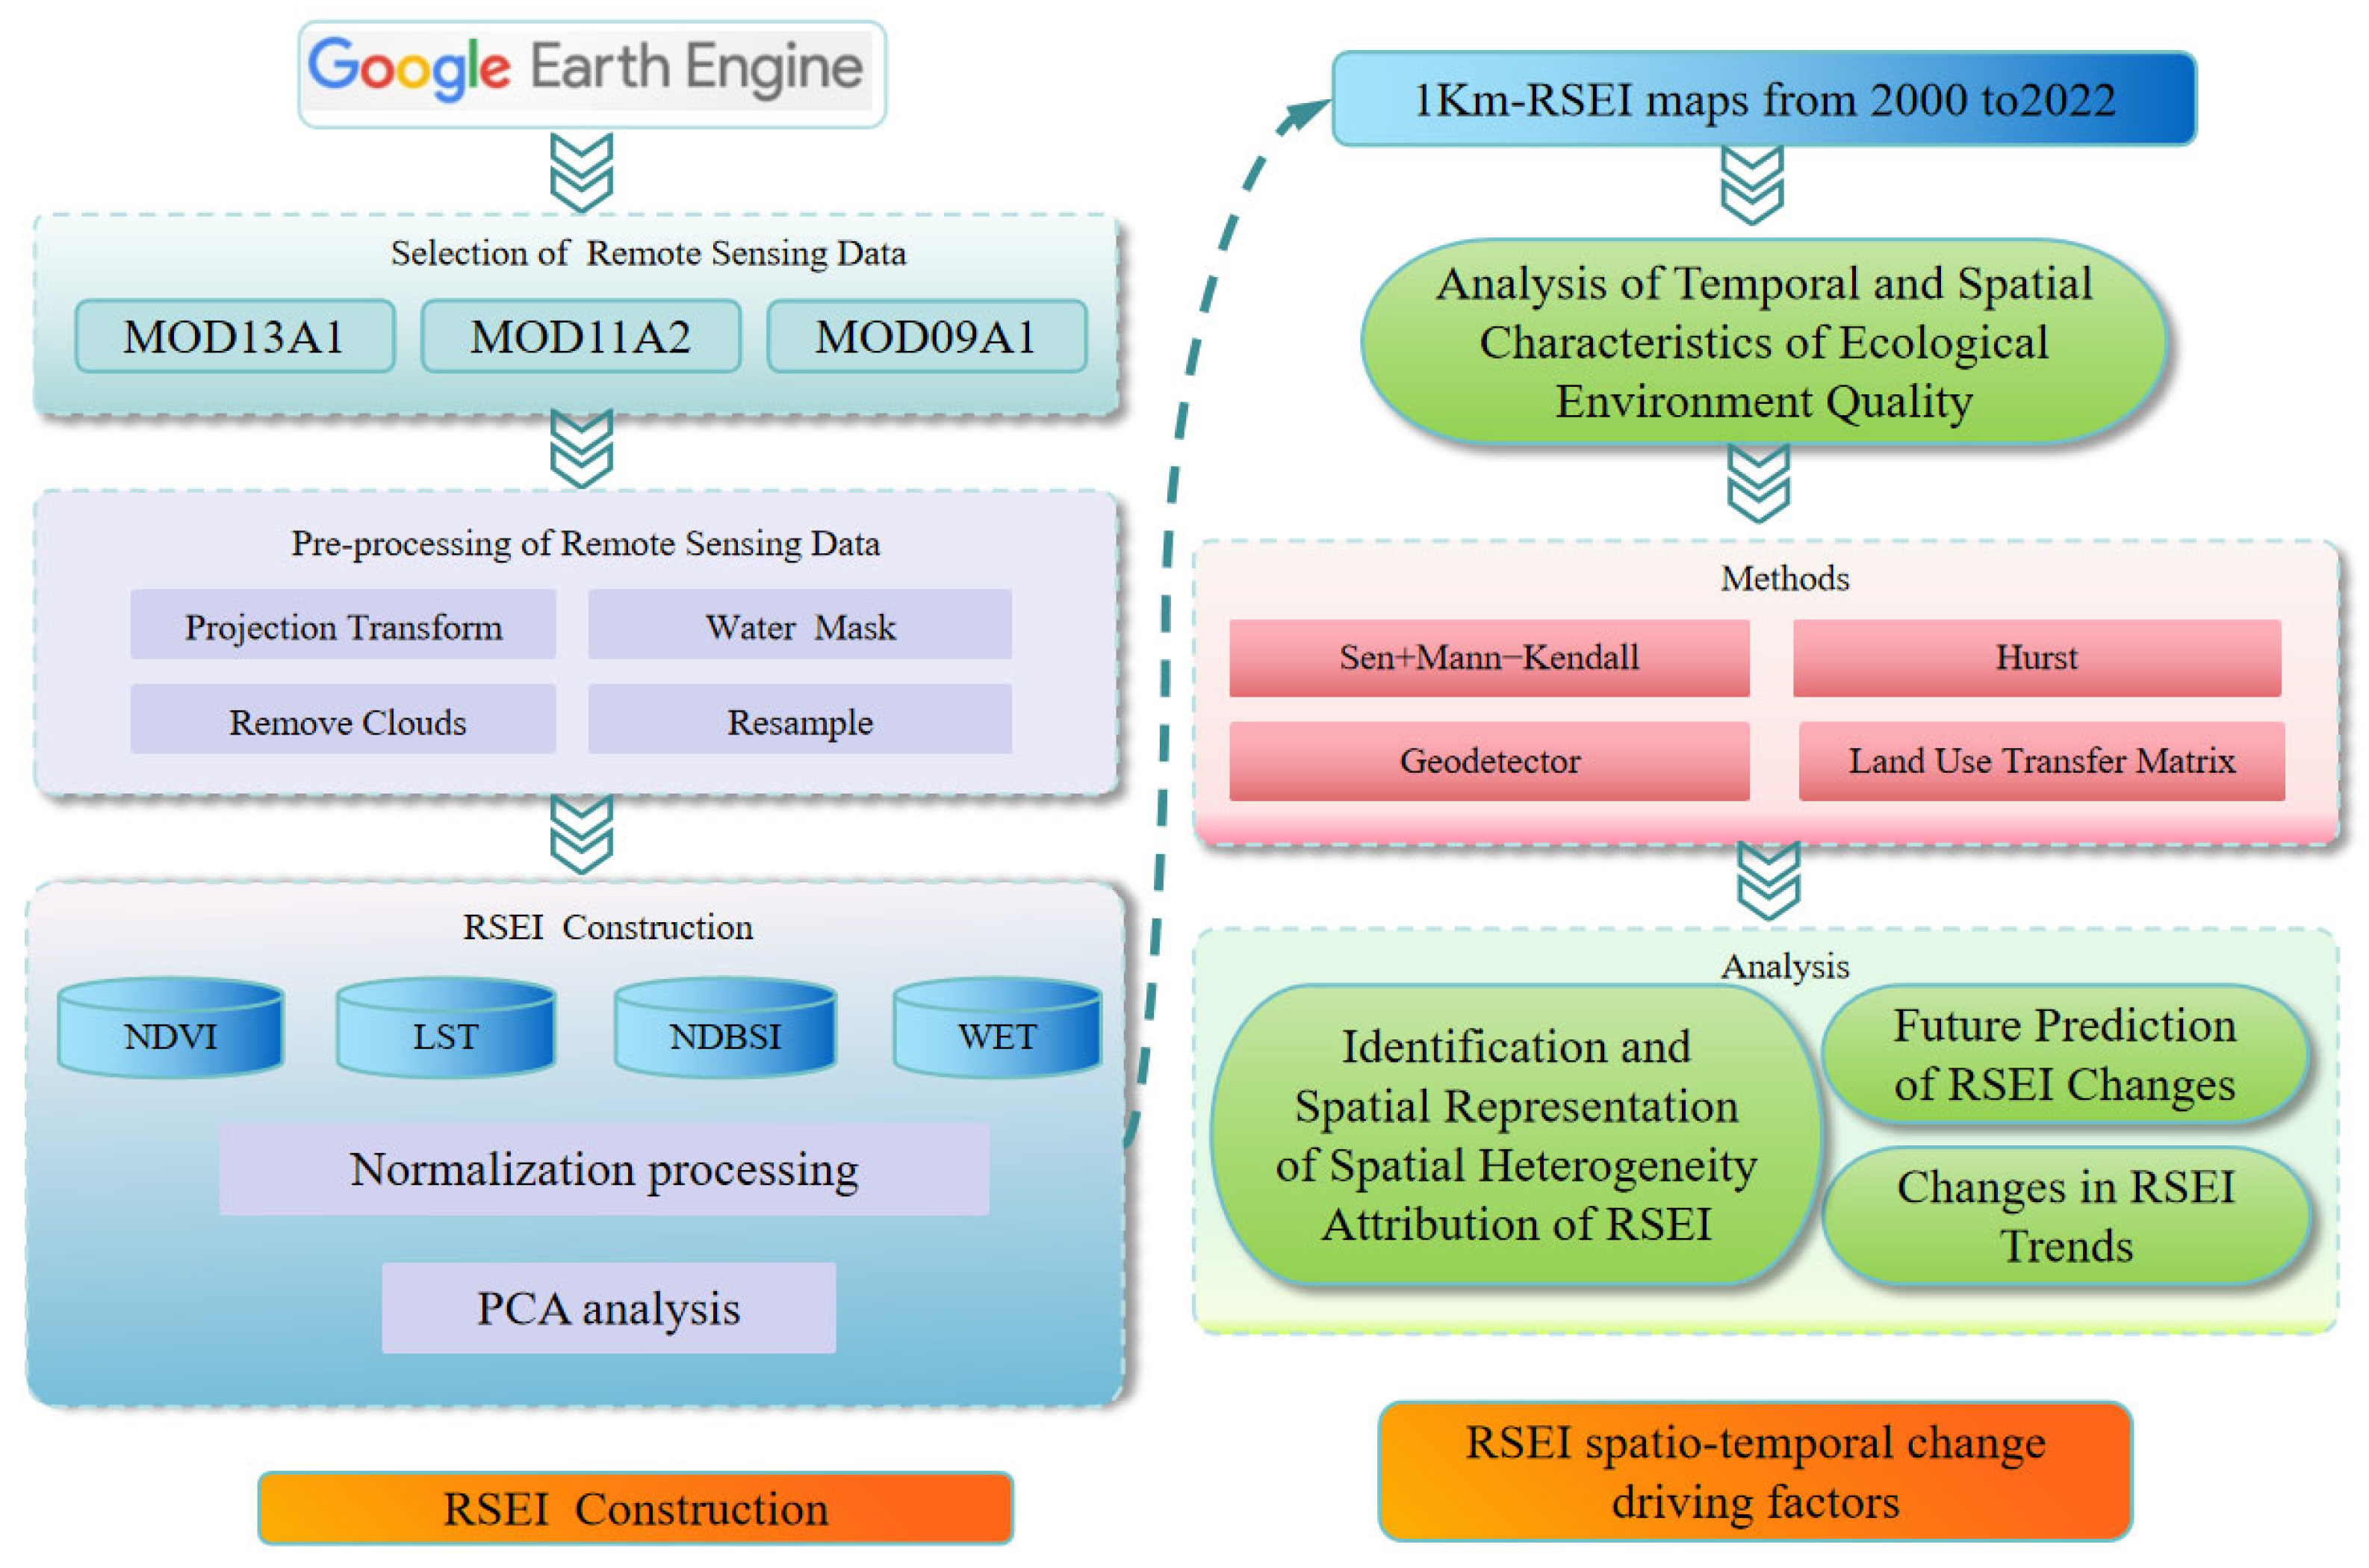
3. Methods
3.1. Remote Sensing Ecological Index (RSEI) Model Construction
- (1)
- Greenness Calculation
- (2)
- Humidity
- (3)
- Dryness
- (4)
- Temperature Calculation
- (5)
- RSEI Model Construction
3.2. Sen + Mann–Kendall Trend Analysis Method
3.3. Future Trend Analysis (Hurst Exponent)
3.4. Geodetector
3.5. Land Use Transfer Matrix
4. Results and Discussion
4.1. RSEI Quality Assessment in the Study Area
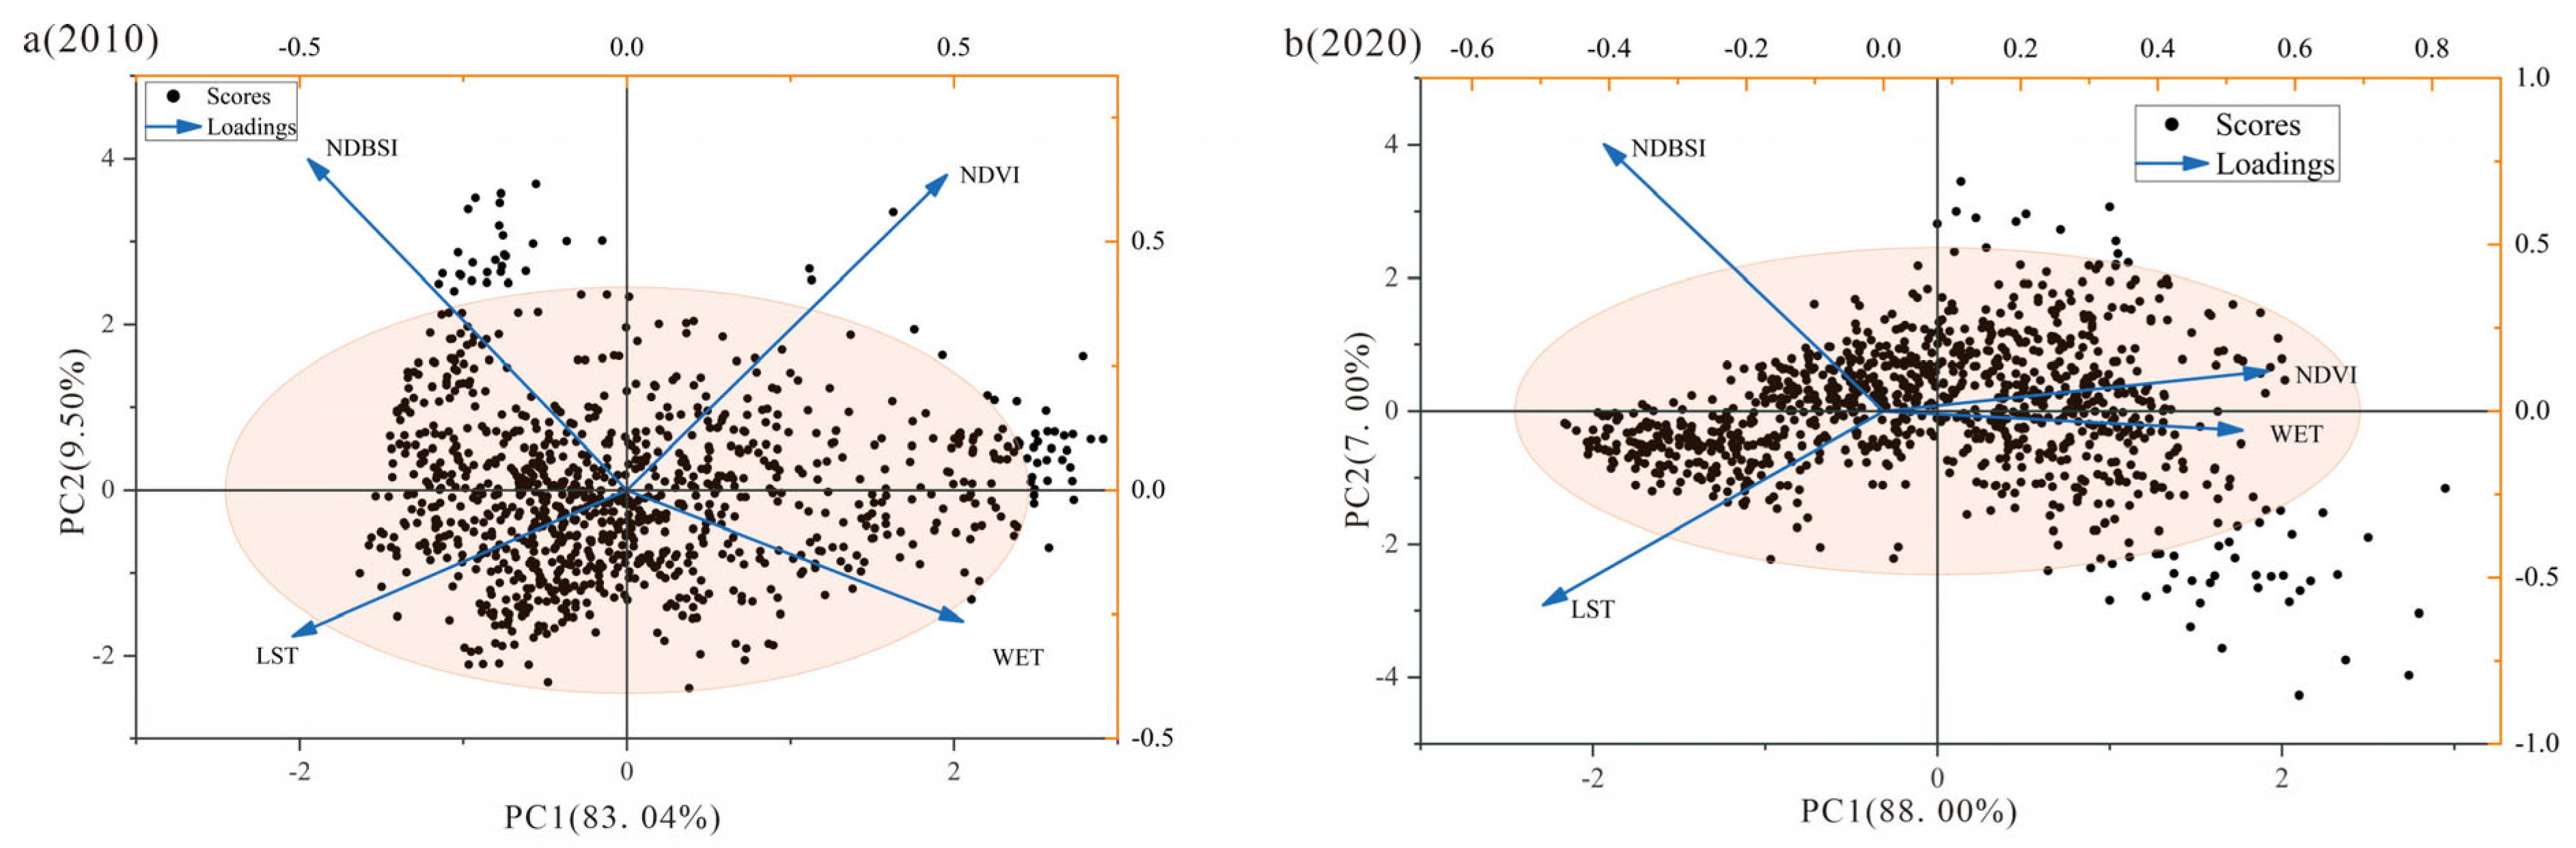
4.1.1. Results of Principal Component Analysis
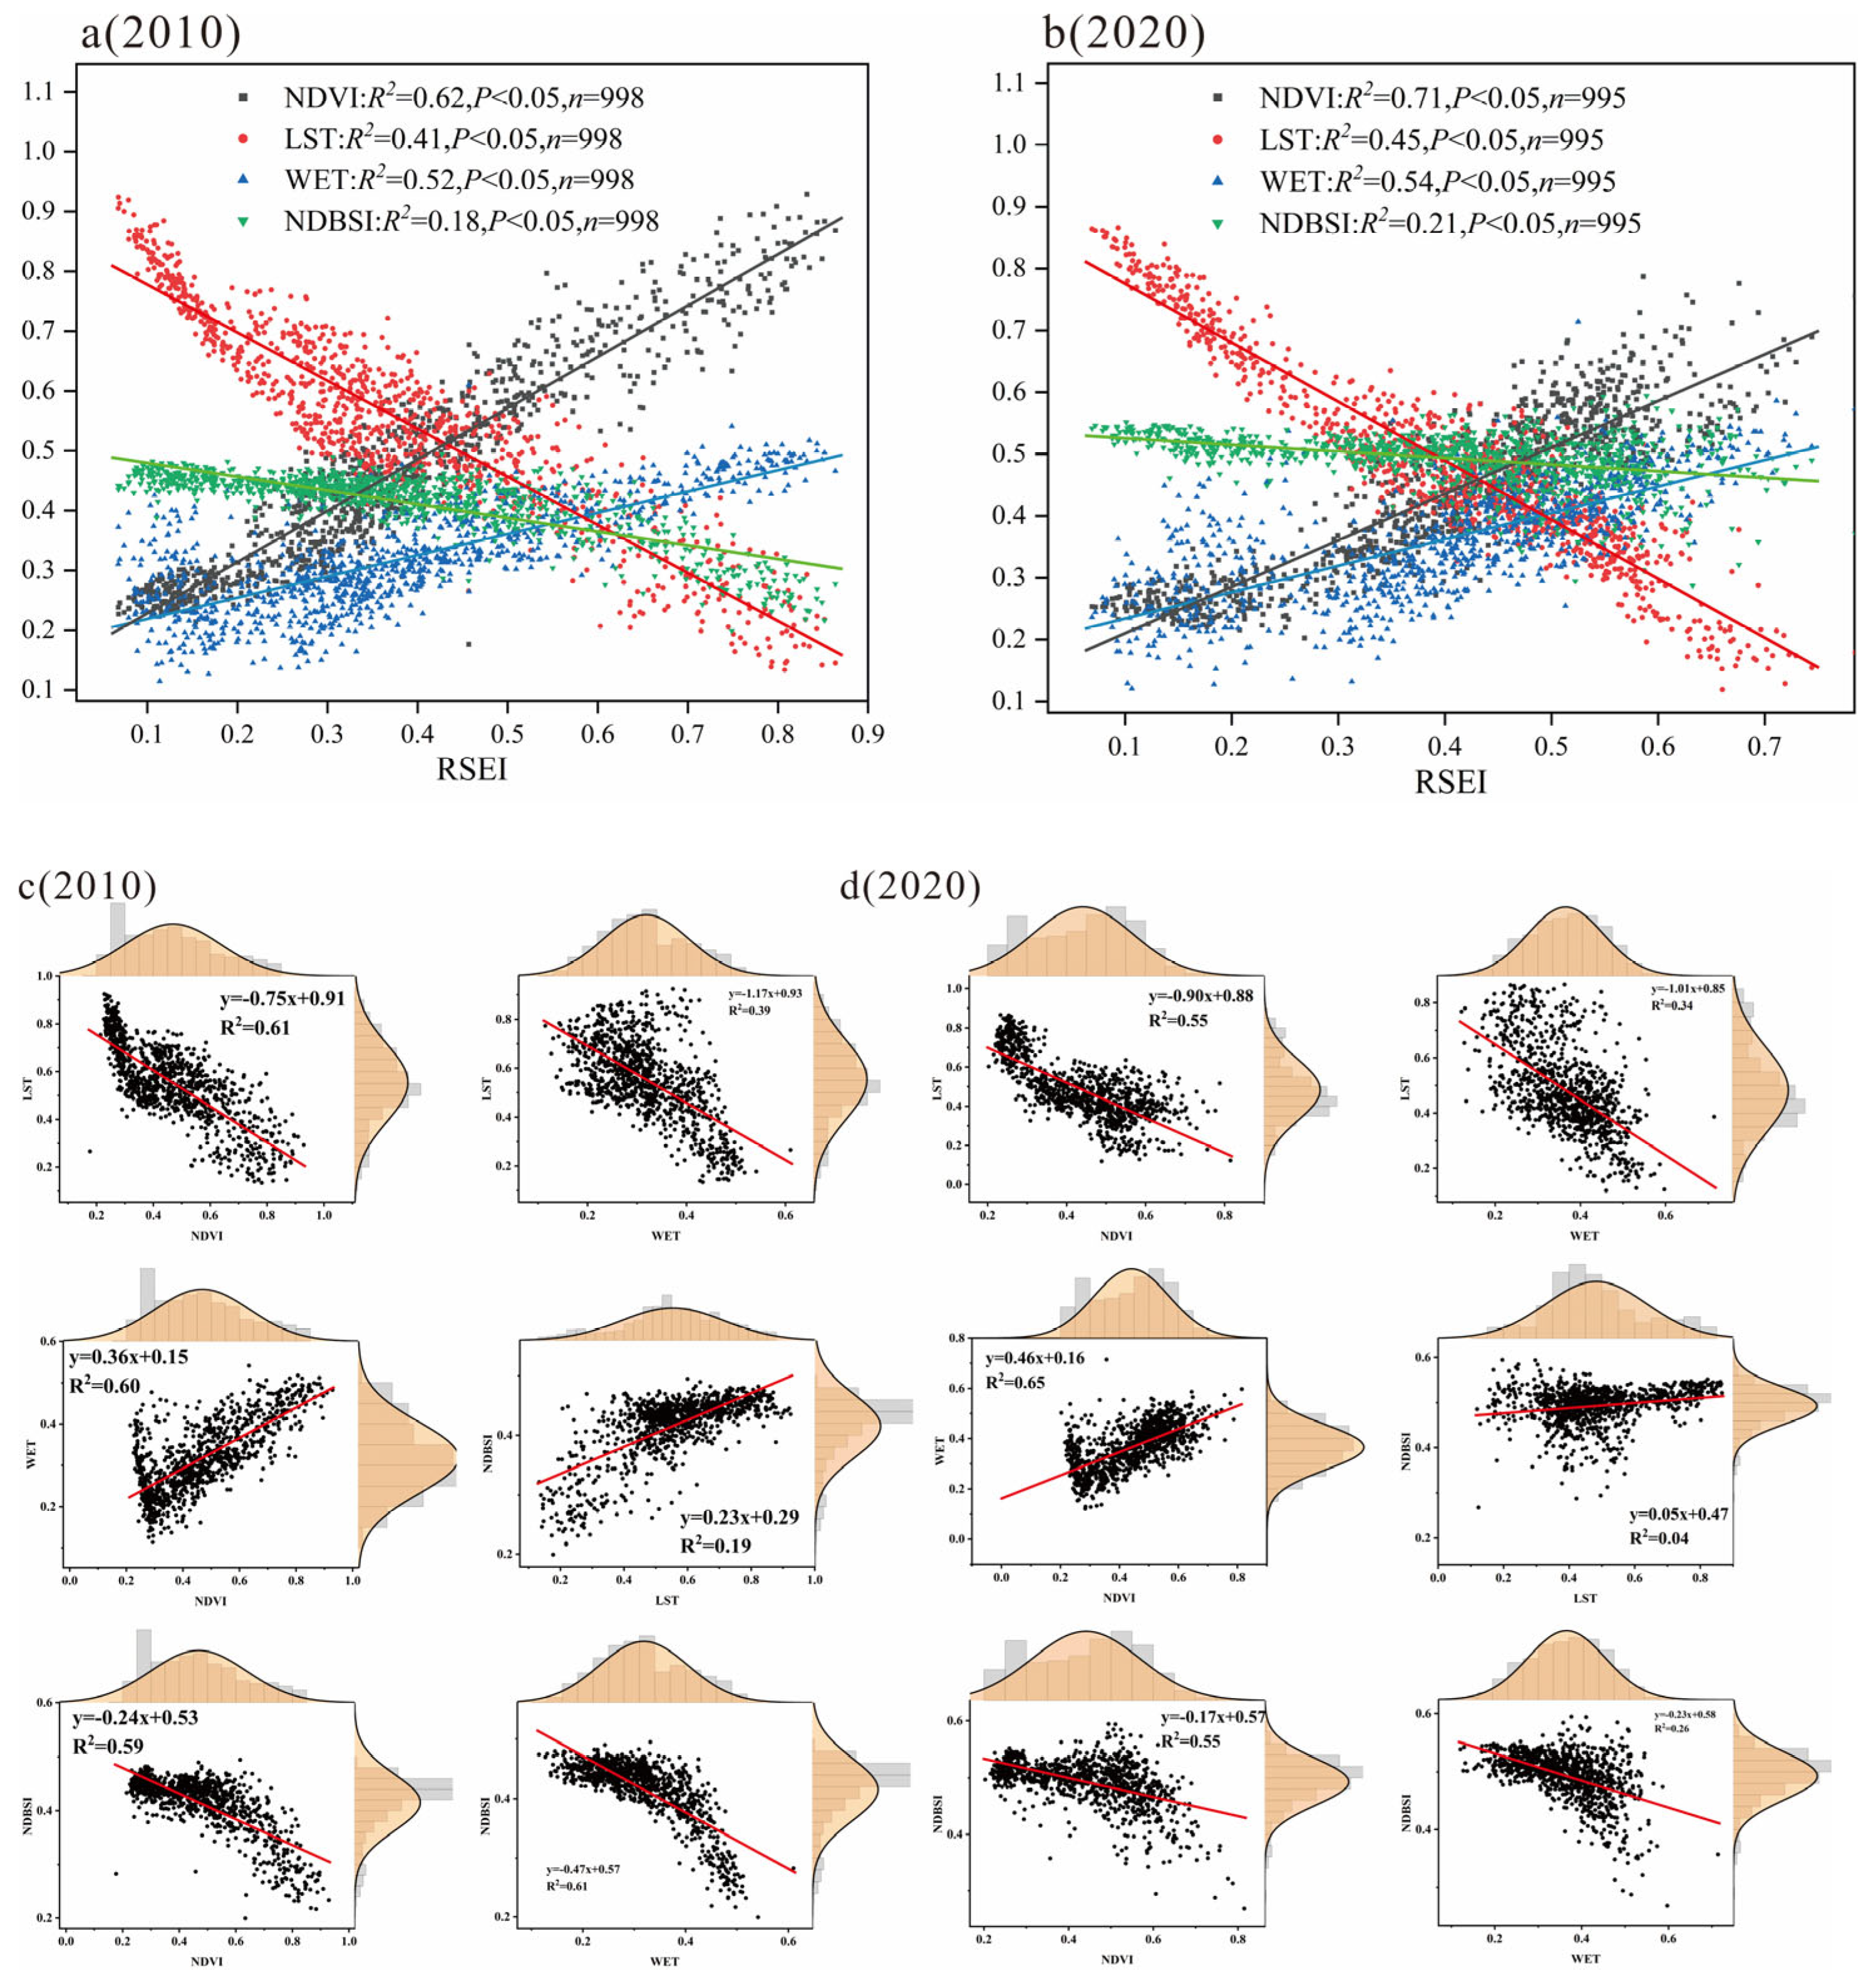
4.1.2. Evaluation of the Correlation Among Indicators
4.2. Analysis of Ecological Quality Based on RSEI
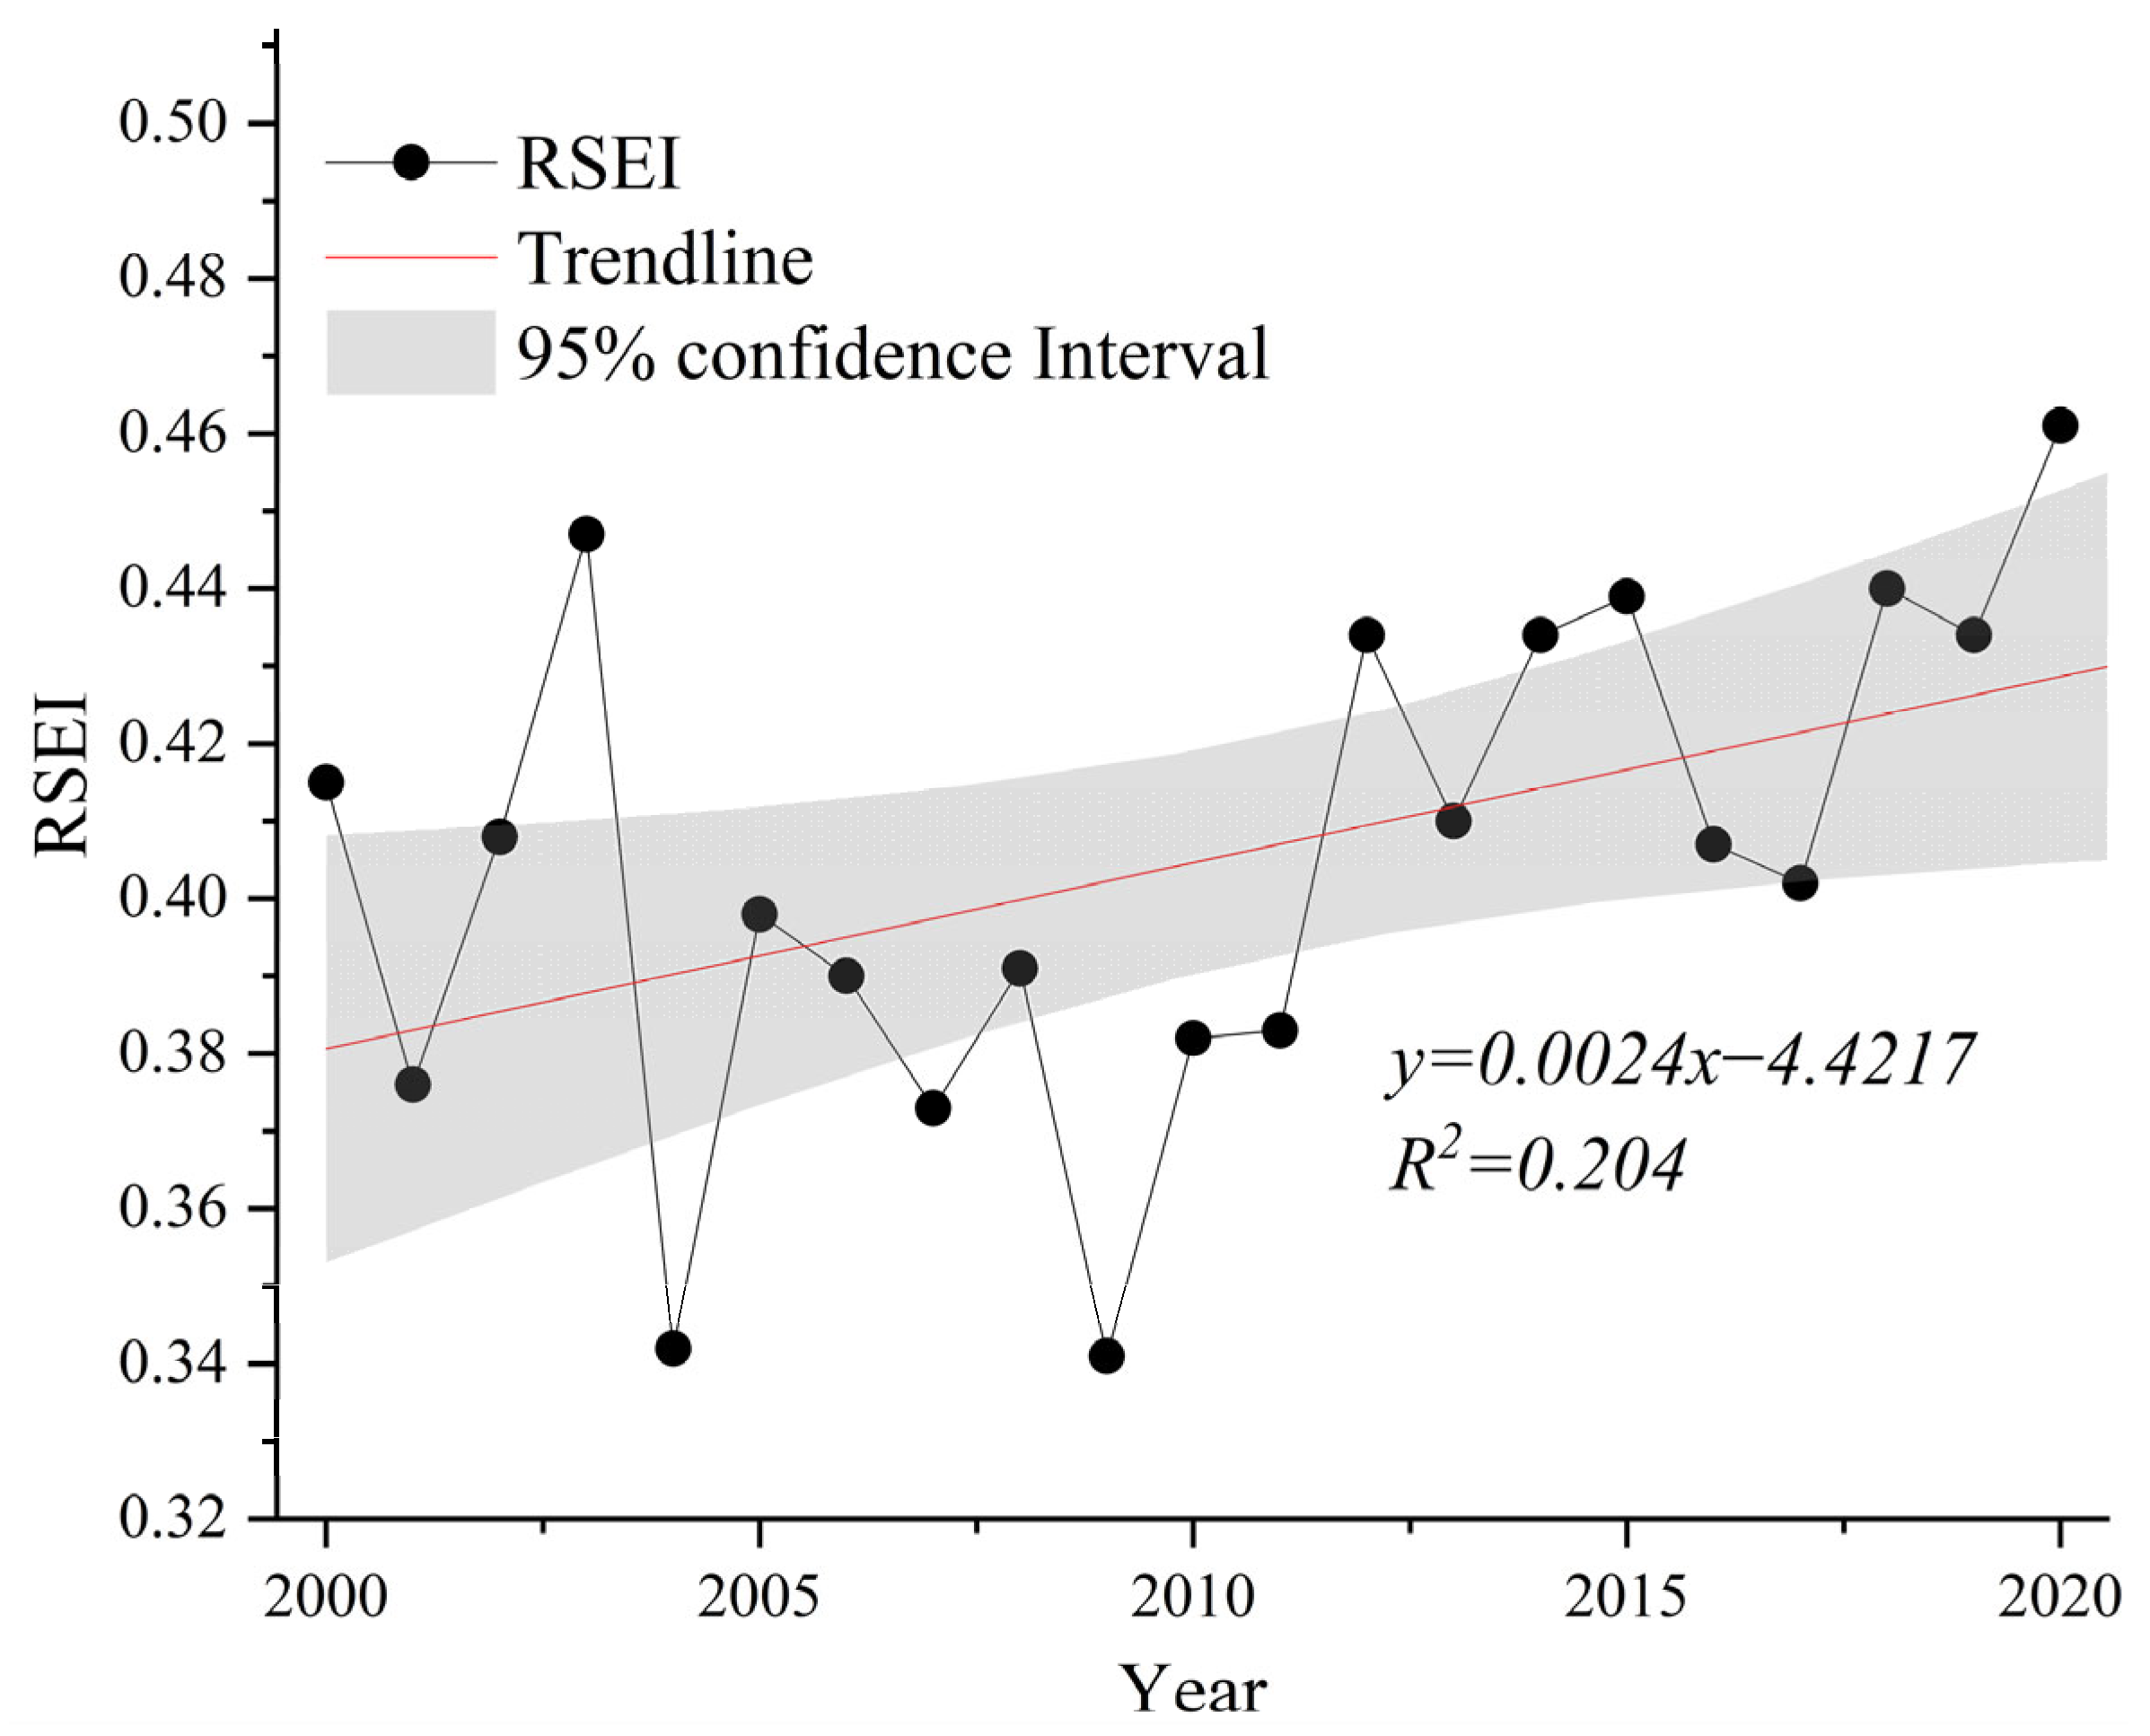
4.2.1. Interannual Variation Characteristics of Ecological Environment Quality in Inner Mongolia
4.2.2. Spatial Distribution Characteristics of Ecological Environment Quality in Inner Mongolia
4.3. Analysis of Temporal Dynamic Features of Ecological Quality
4.4. Analysis of Natural Factors Influencing RSEI in Inner Mongolia
4.4.1. Single-Factor Detection Results
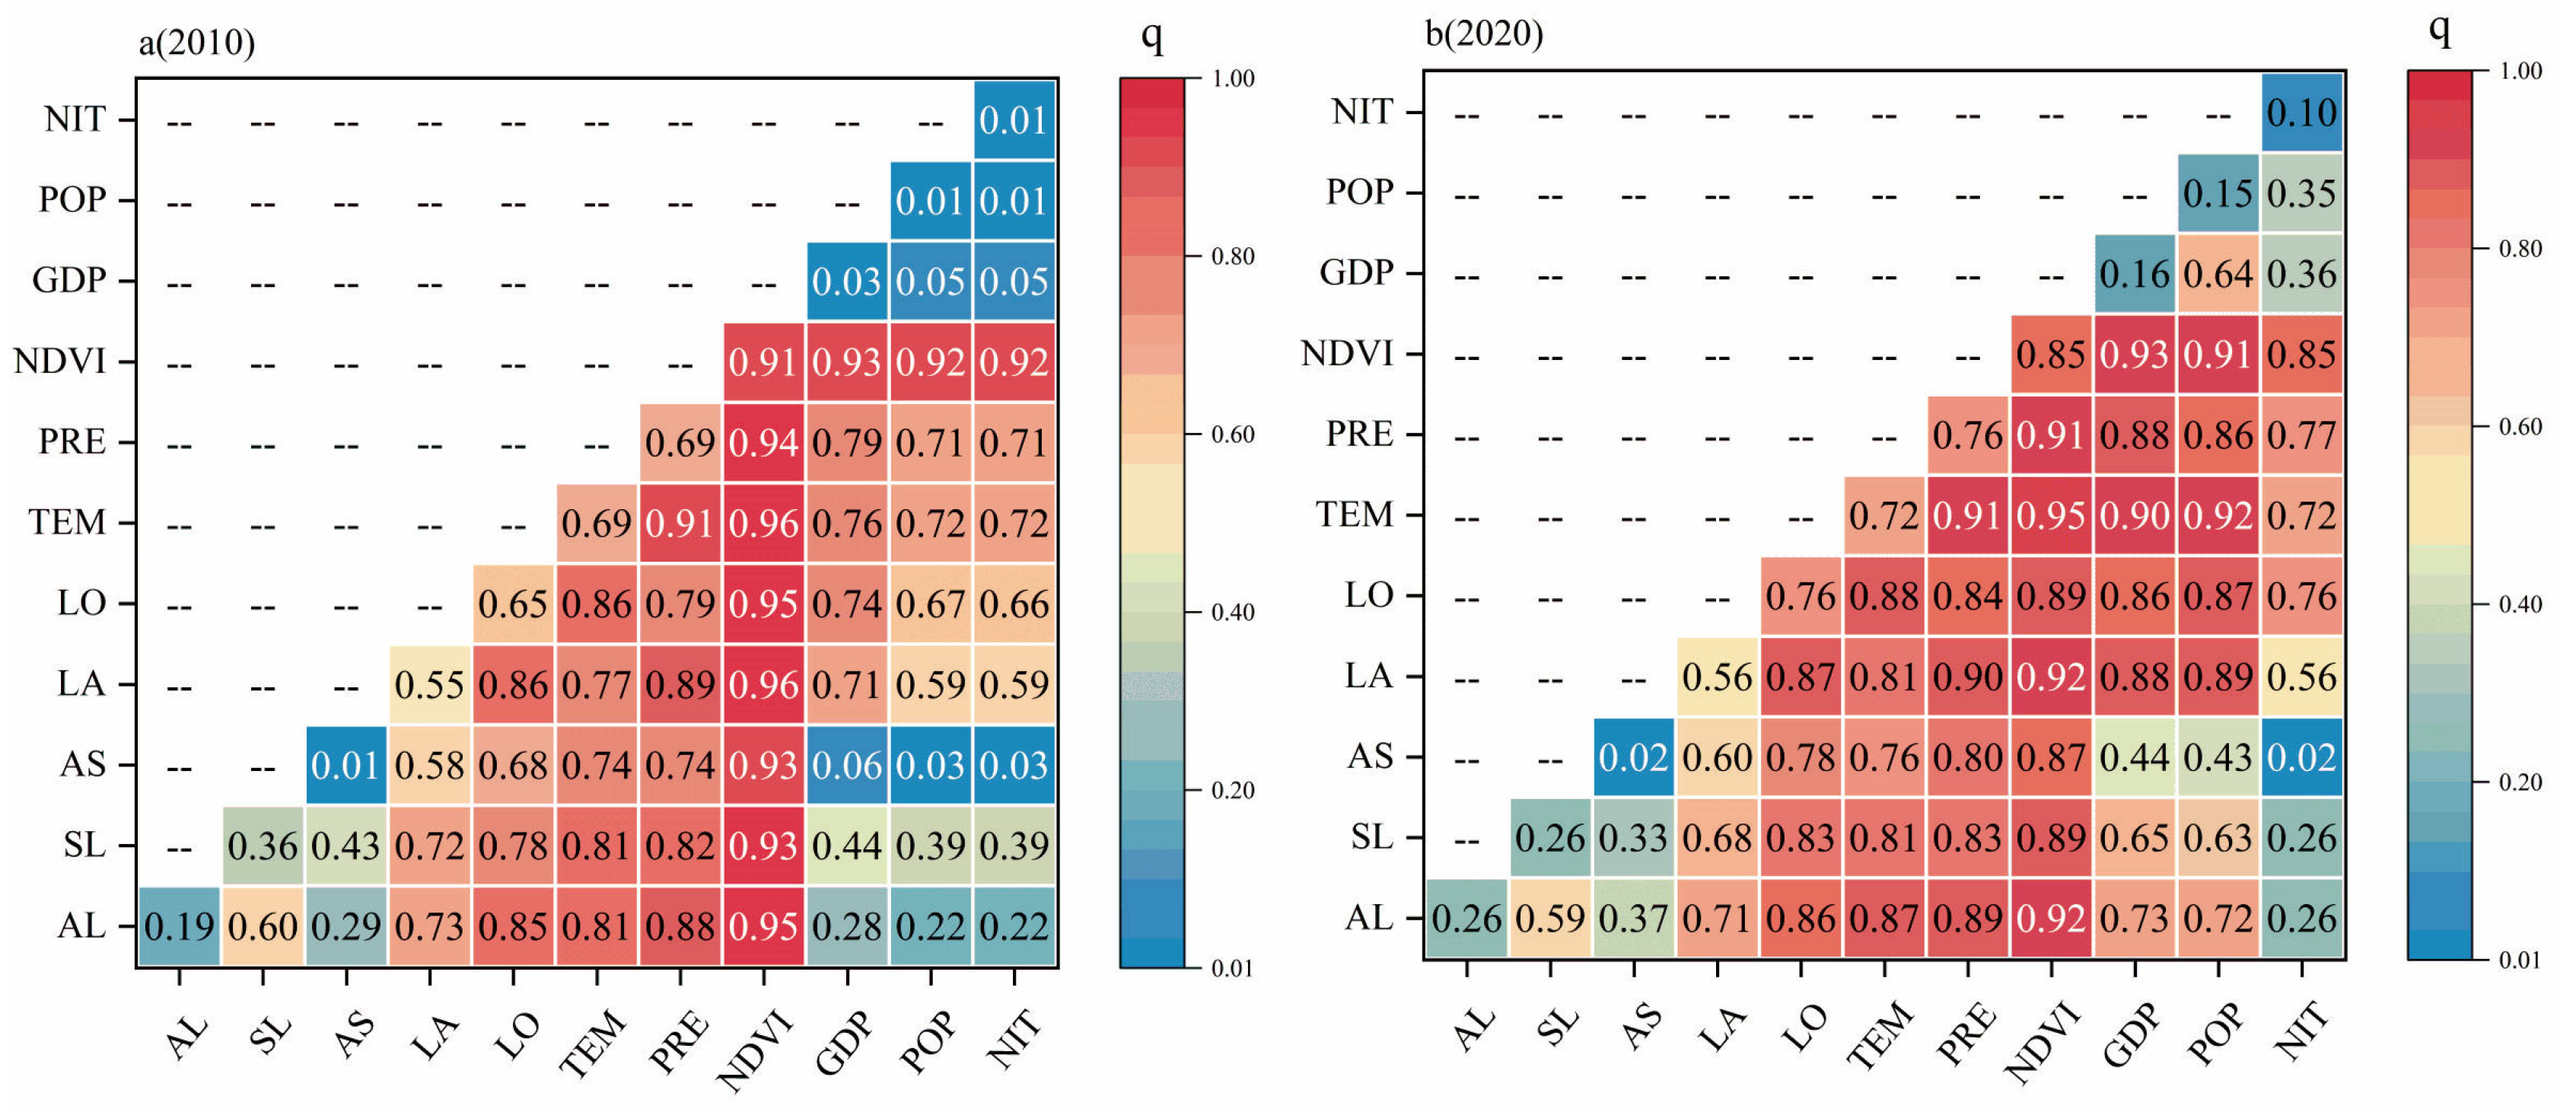
4.4.2. Interaction Detection Results
5. Discussion
- Future research directions based on this study:
- 2.
- Potential practical applications:
6. Conclusions
- The correlation between the RSEI and the NDVI, LST, NDBSI, and WET ecological indices is higher than the correlation between individual ecological indices, indicating that the RSEI can better comprehensively reflect the ecological environment quality in Inner Mongolia. Among these, changes in the NDVI have the greatest impact on the ecological environment quality in Inner Mongolia, while changes in the NDBSI have the smallest impact.
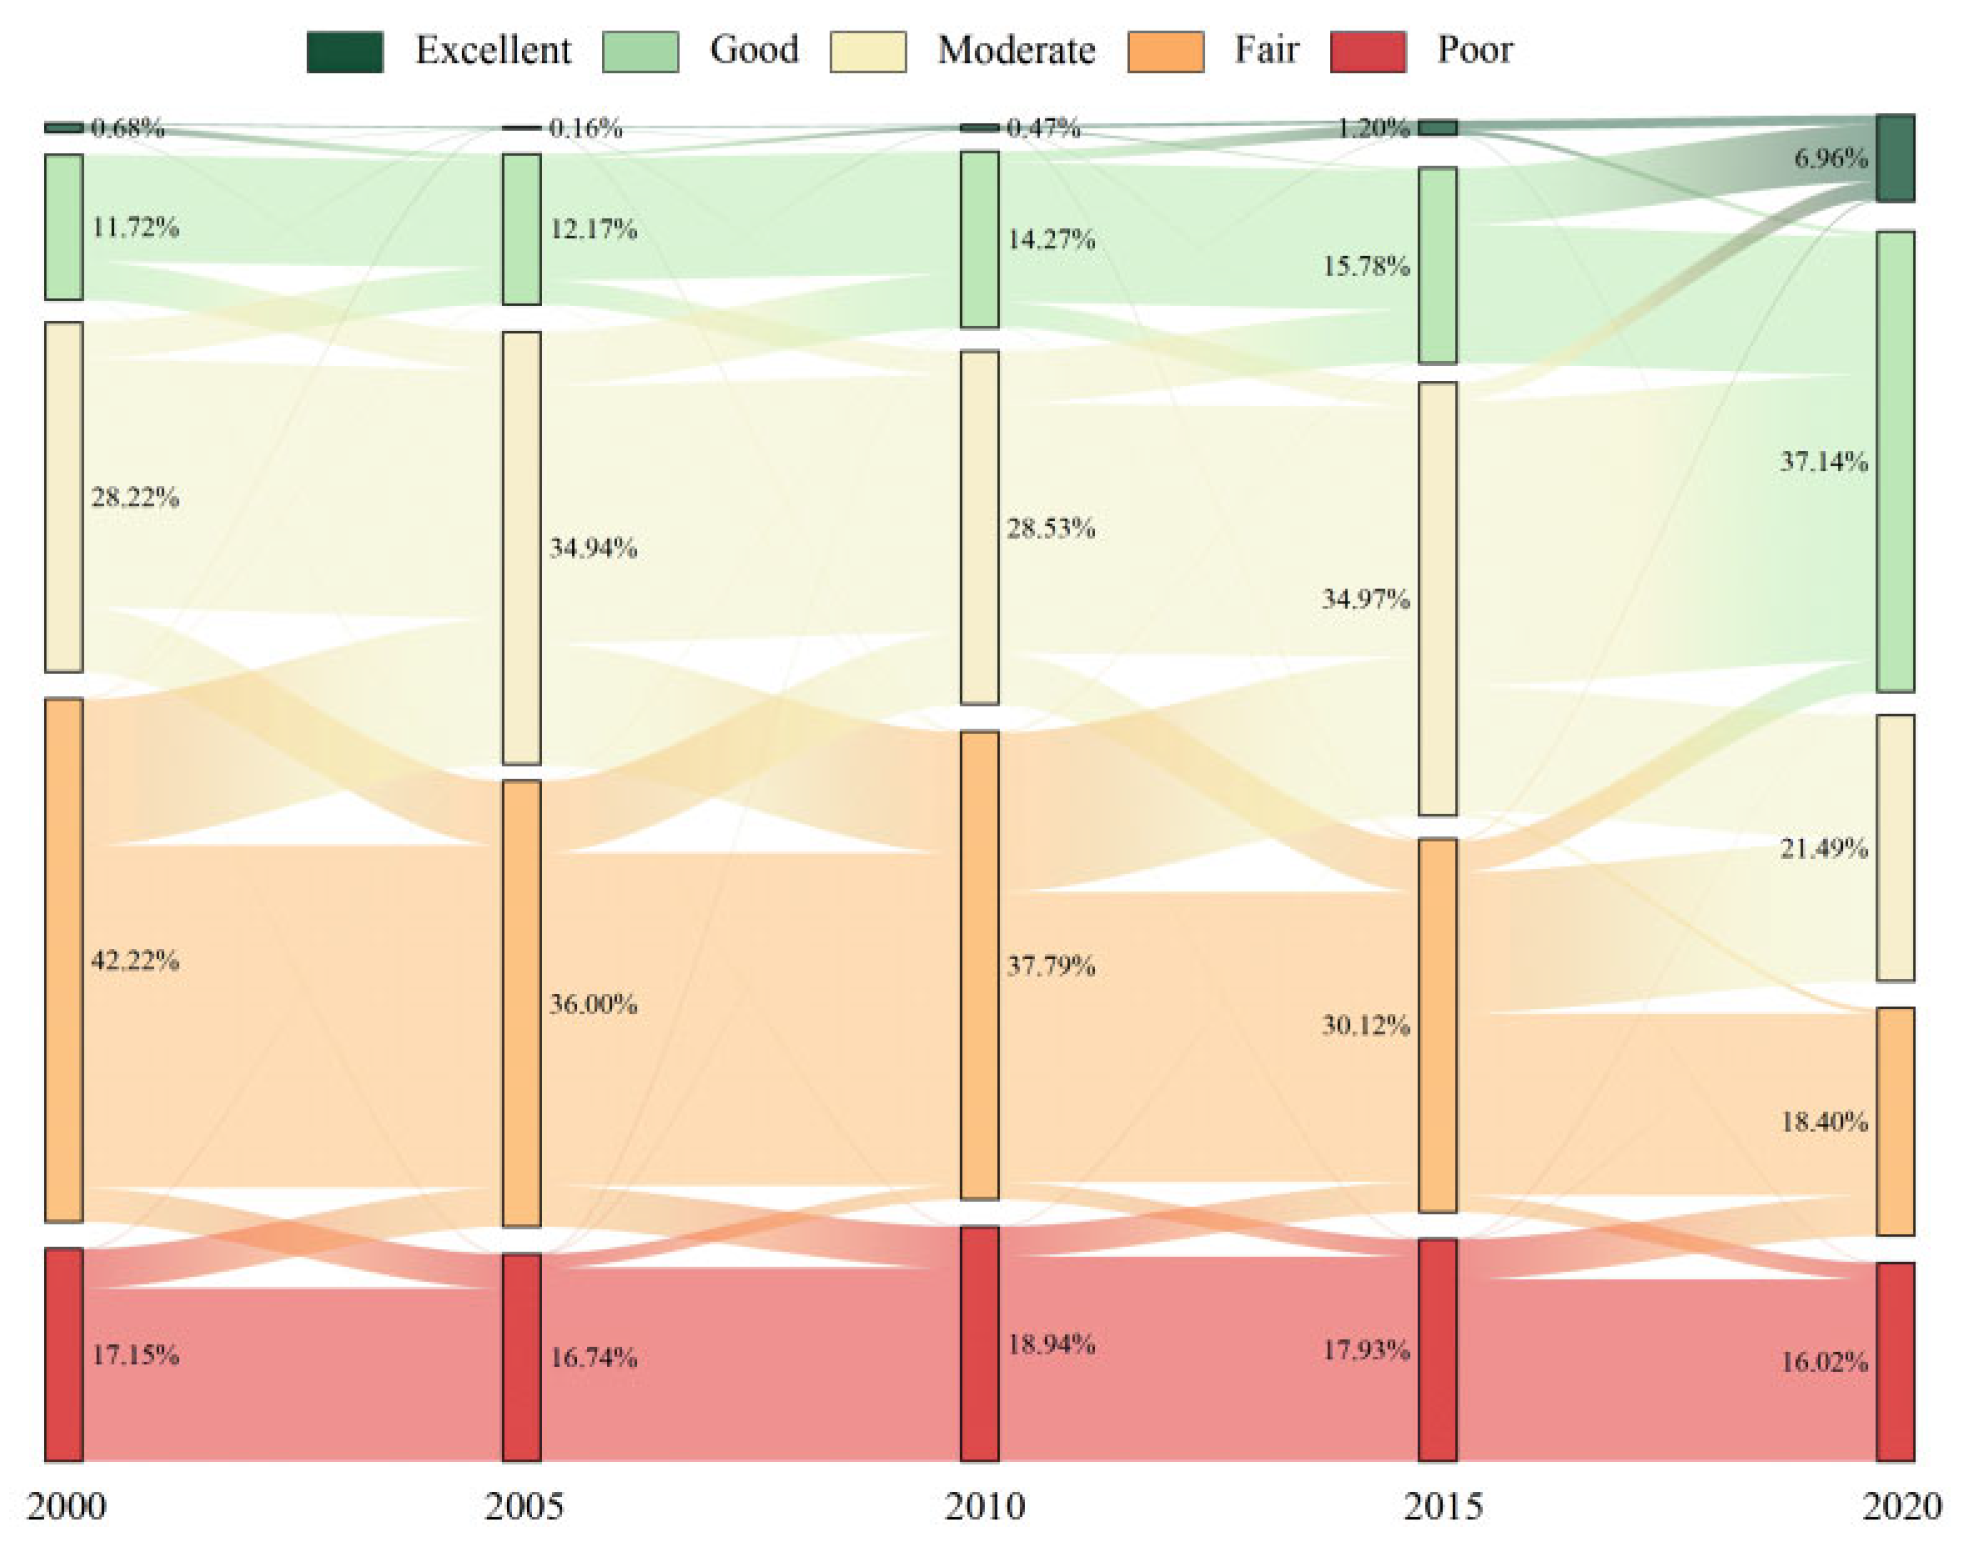
- From 2000 to 2020, the average RSEI in Inner Mongolia showed an overall upward trend with fluctuations, which has been confirmed as statistically significant at a 95% confidence level. By analyzing the spatial transition matrix, it was found that different ecological positions have shifted over the 20-year period. The major area transitions occurred between adjacent two levels, with the area of improvement greater than the area of deterioration, indicating an overall improvement in ecological quality.
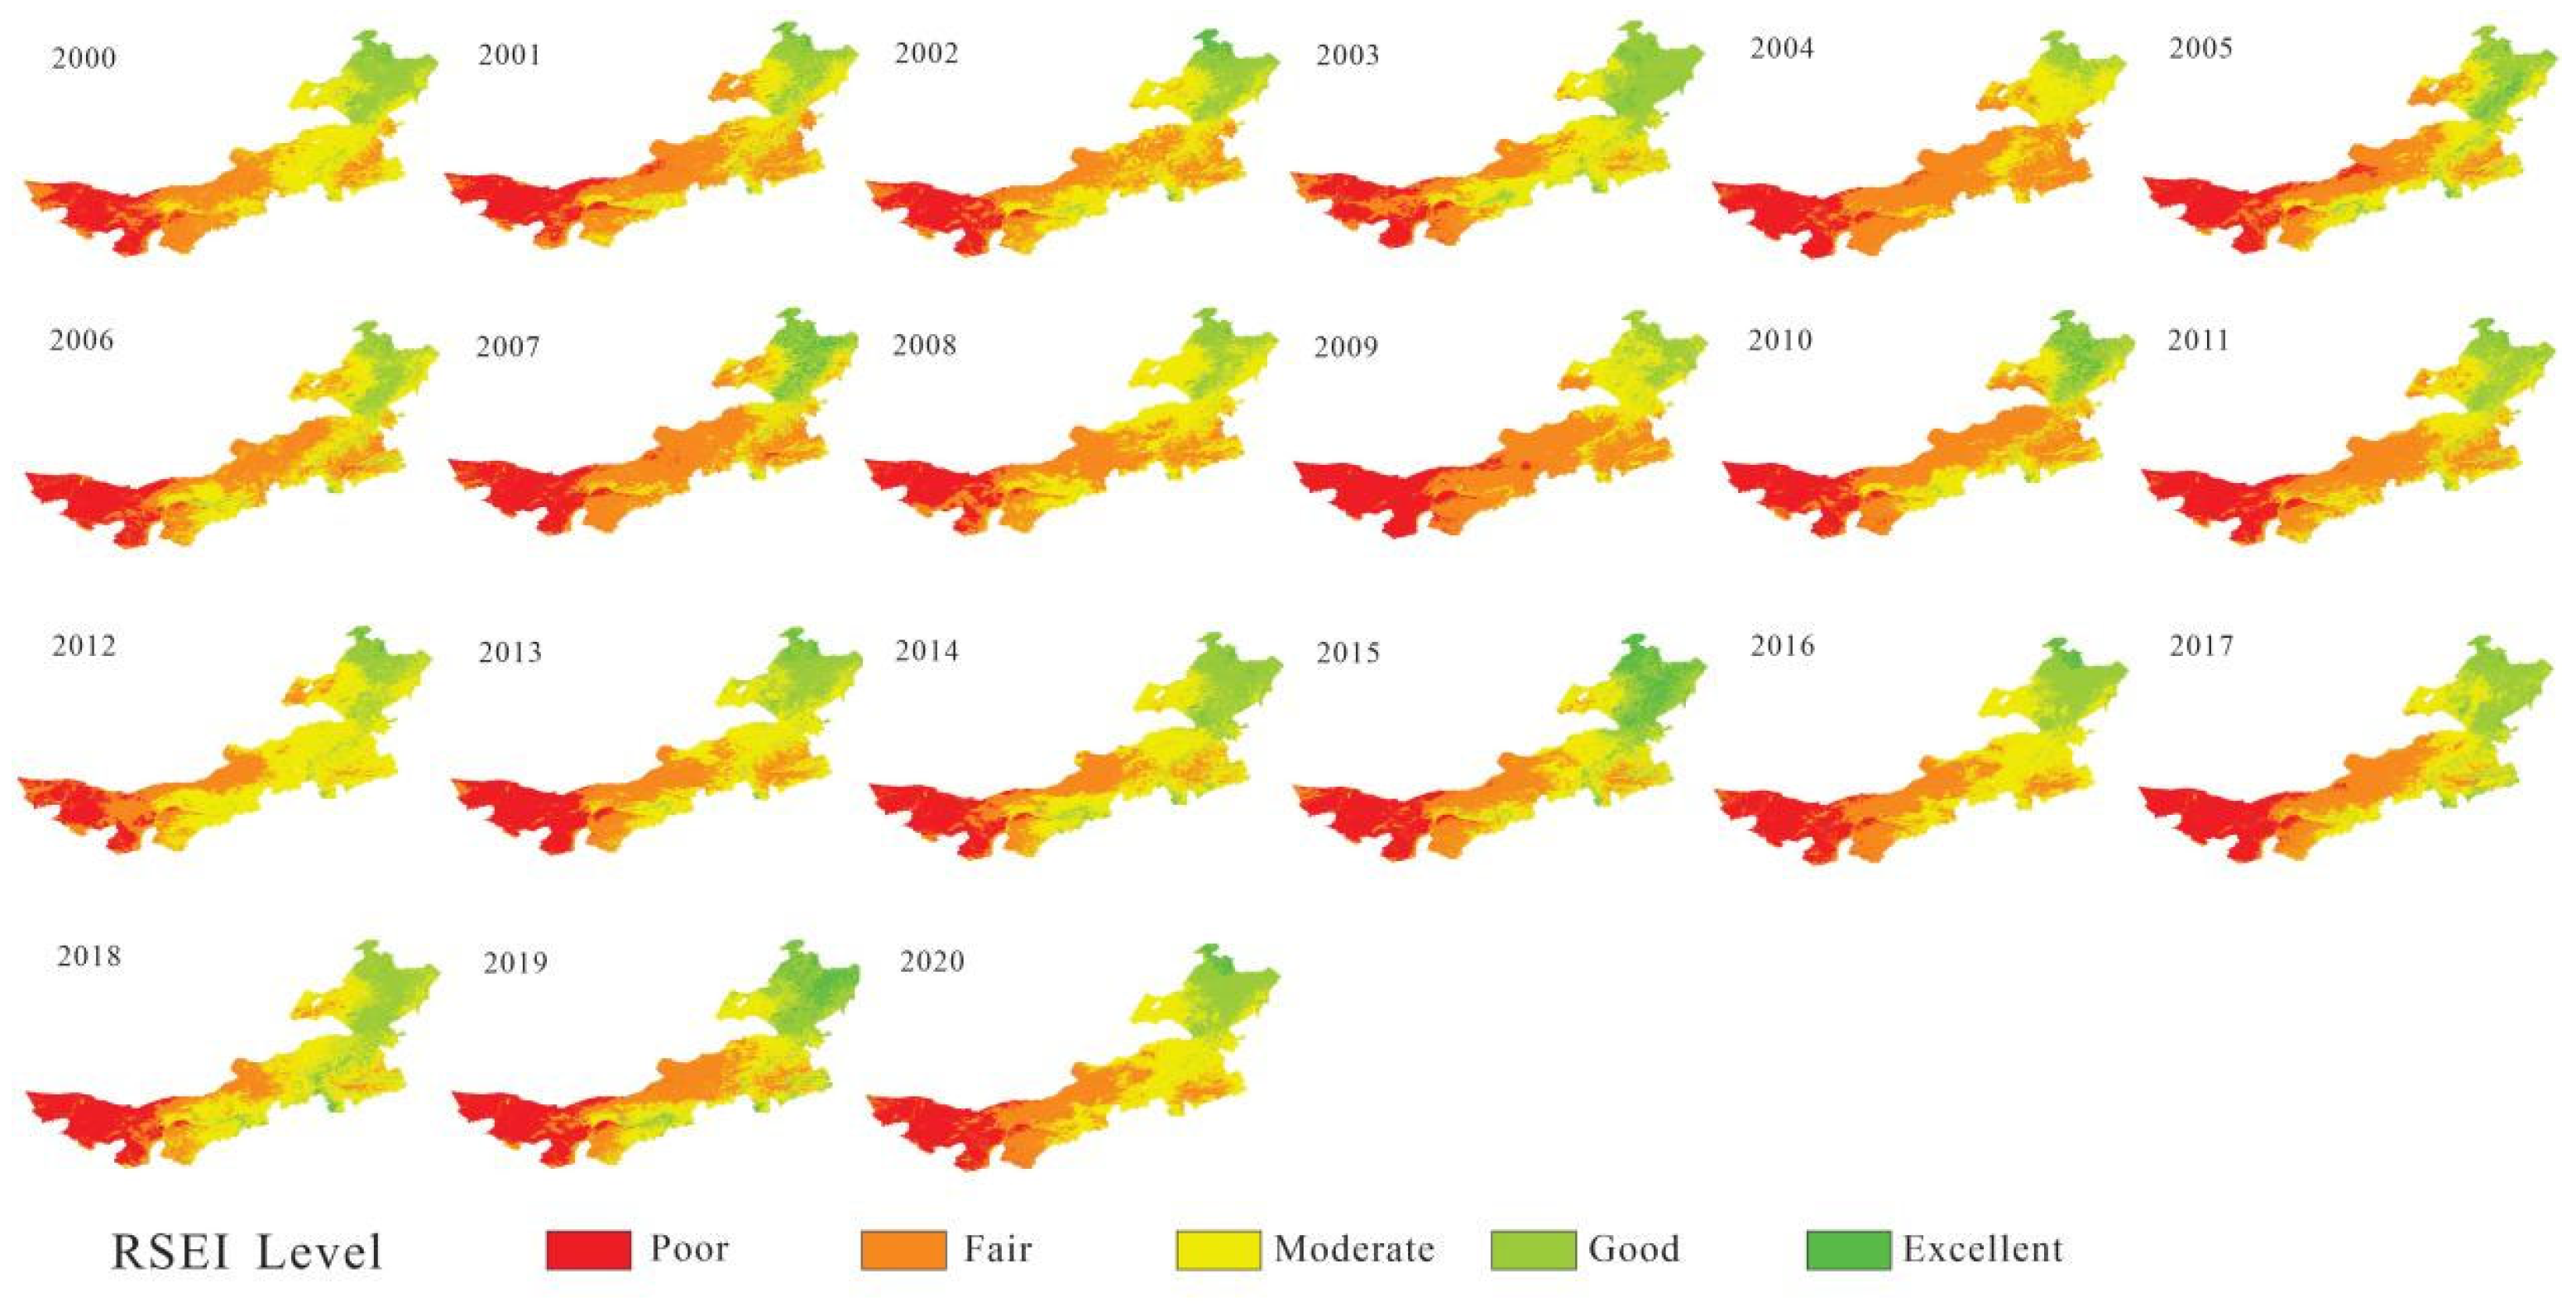
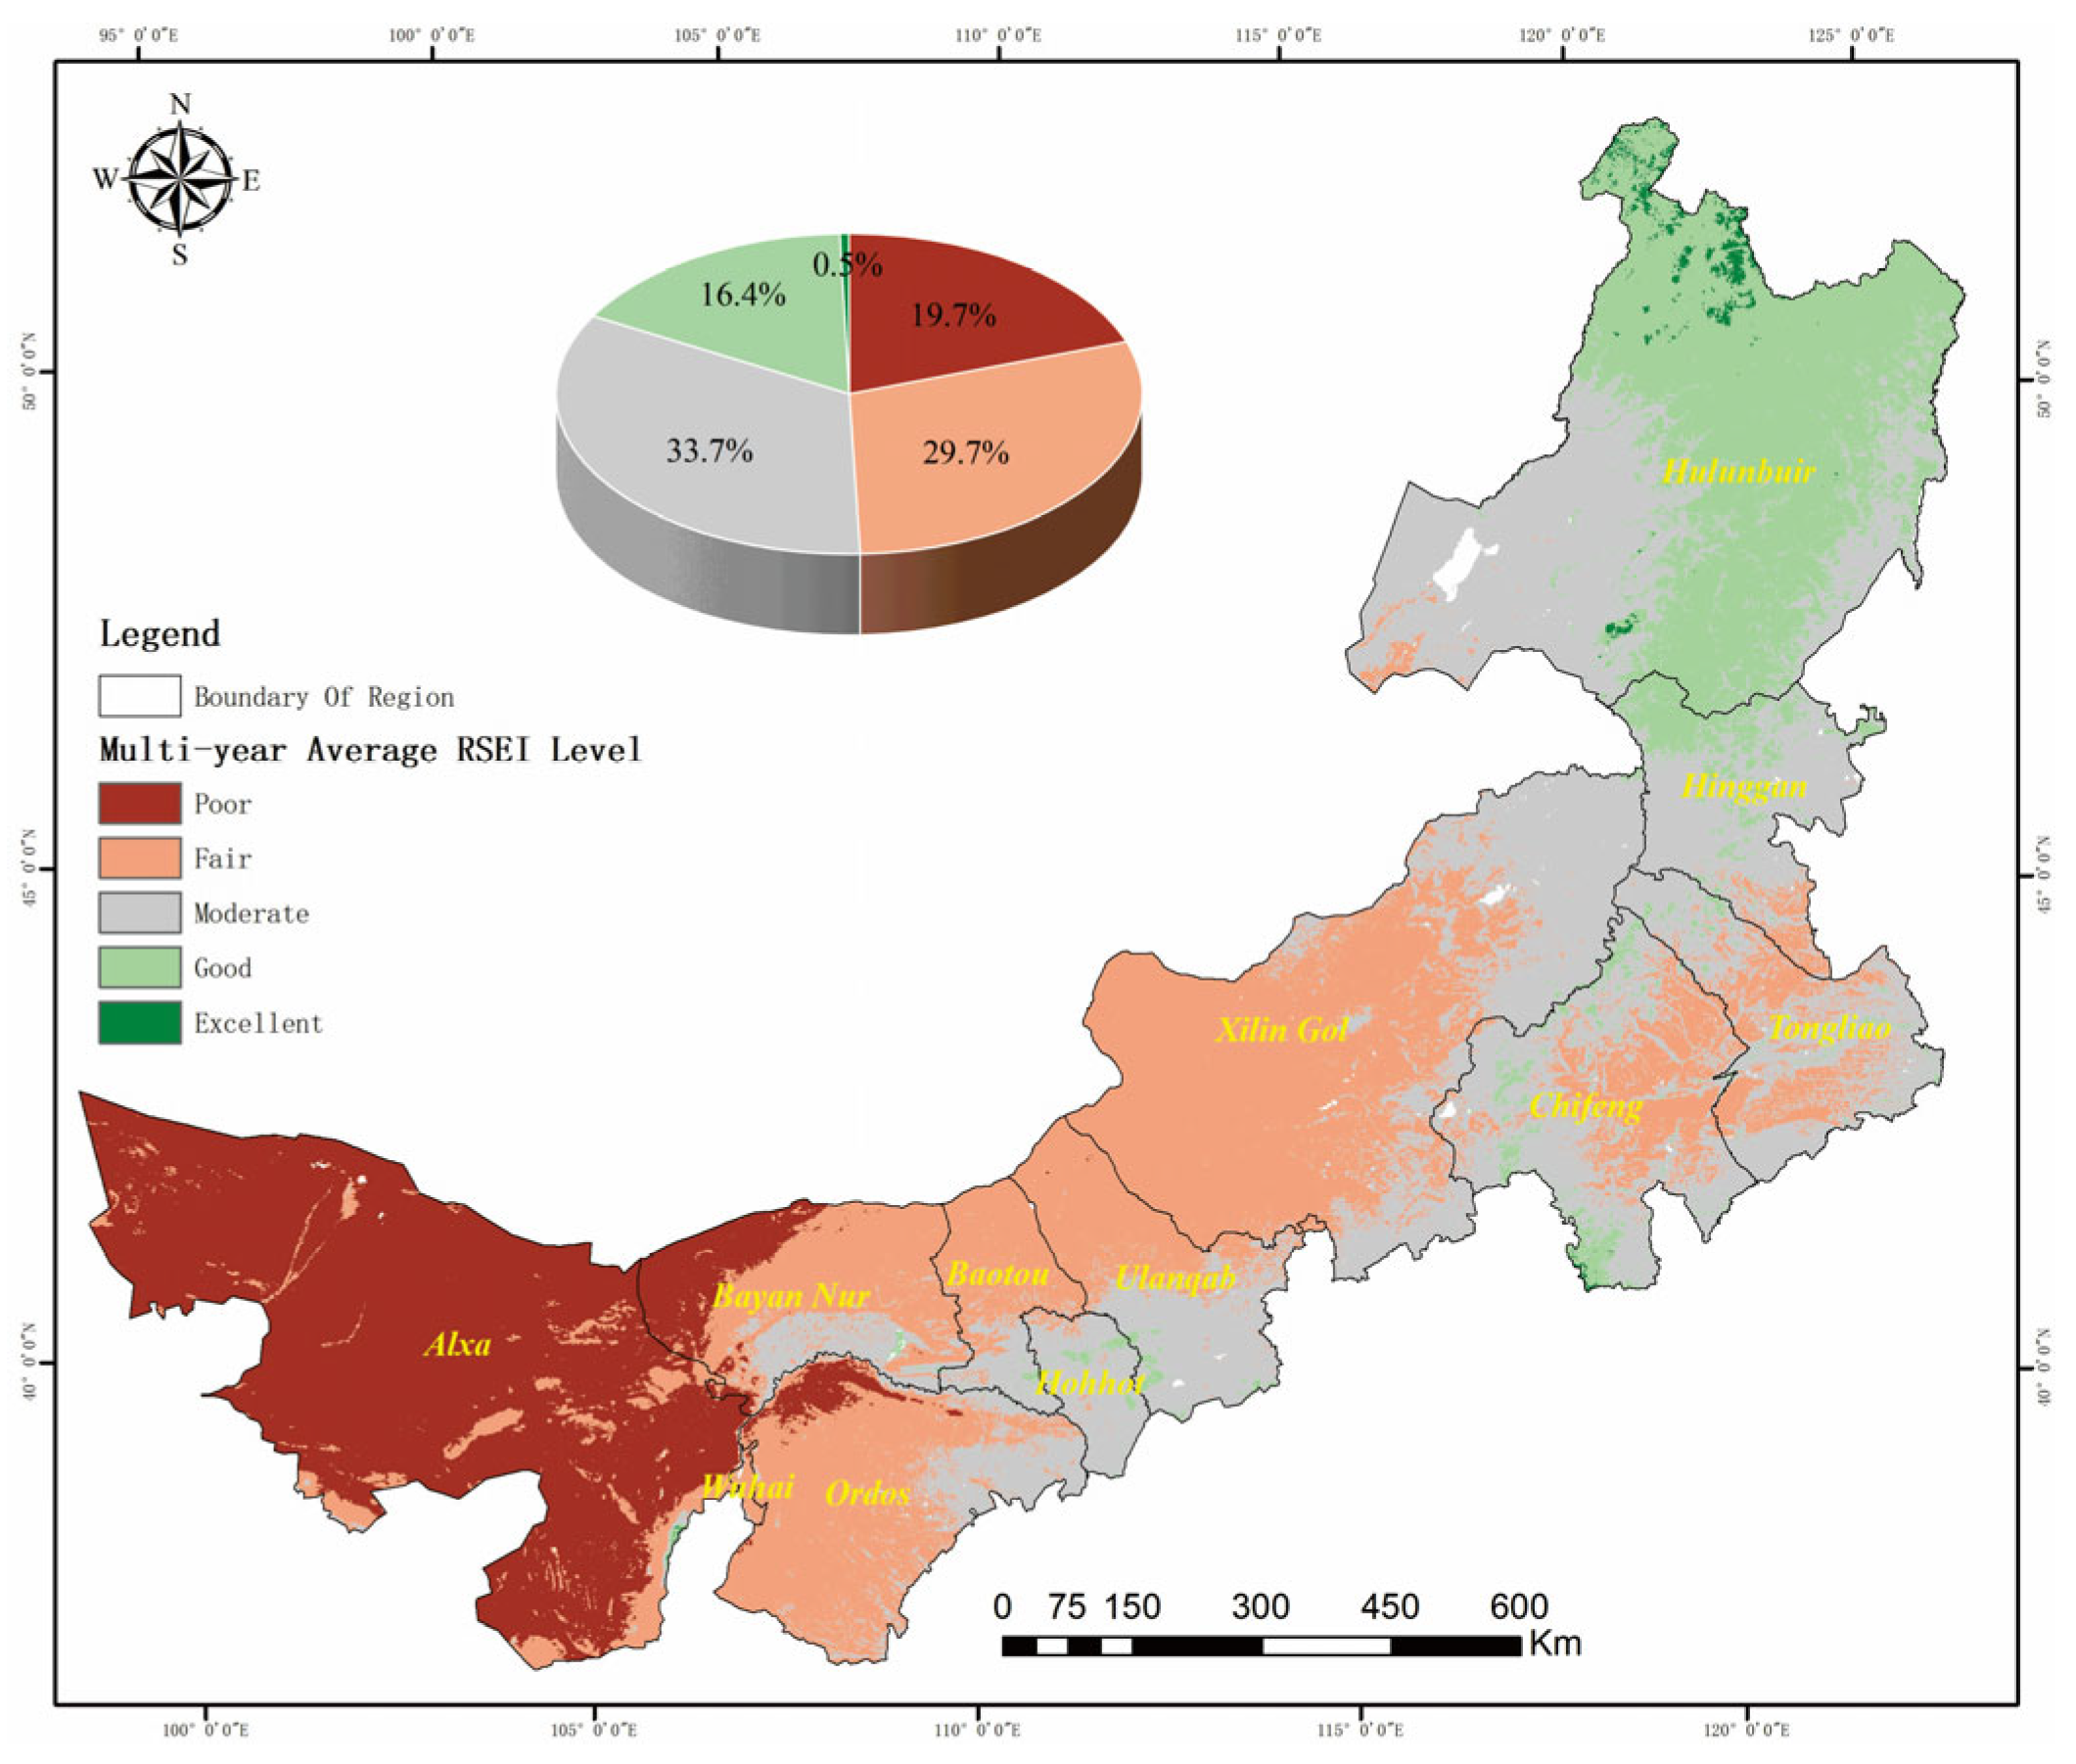
- In terms of interannual variations, the ecological environment quality in Inner Mongolia showed a non-significant fluctuating upward trend from 2000 to 2020. The areas classified as excellent, good, moderate, relatively poor, and poor, respectively, showed trends of non-significant increase, significant increase, non-significant decrease, and non-significant increase. In terms of spatial distribution, there is a polarization in the ecological environment quality, gradually deteriorating from northeast to southwest.
- The RSEI demonstrated stronger correlations with individual ecological indicators (NDVI, LST, NDBSI, WET) than between the indicators themselves, confirming its superior comprehensive representation of ecological quality. Among these, NDVI changes exerted the greatest influence on ecological quality, while NDBSI showed the least impact.
- From 2000 to 2020, the average RSEI in Inner Mongolia showed a significant upward trend with fluctuations (p < 0.05). Spatial transition matrix analysis indicated that changes in ecological quality primarily occurred between adjacent grades, with the area of improvement significantly exceeding that of degradation. Despite periodic fluctuations, the overall ecological quality demonstrated progressive enhancement, suggesting effective implementation of ecological restoration measures across the region.
- Interannual variation analysis revealed a non-significant but consistent improving trend in overall ecological quality. Notably, areas classified as “Good” experienced significant expansion, while spatial distribution patterns exhibited clear polarization—displaying a distinct northeast-to-southwest degradation gradient. This spatial heterogeneity reflects the varying effectiveness of conservation measures across different ecological zones.
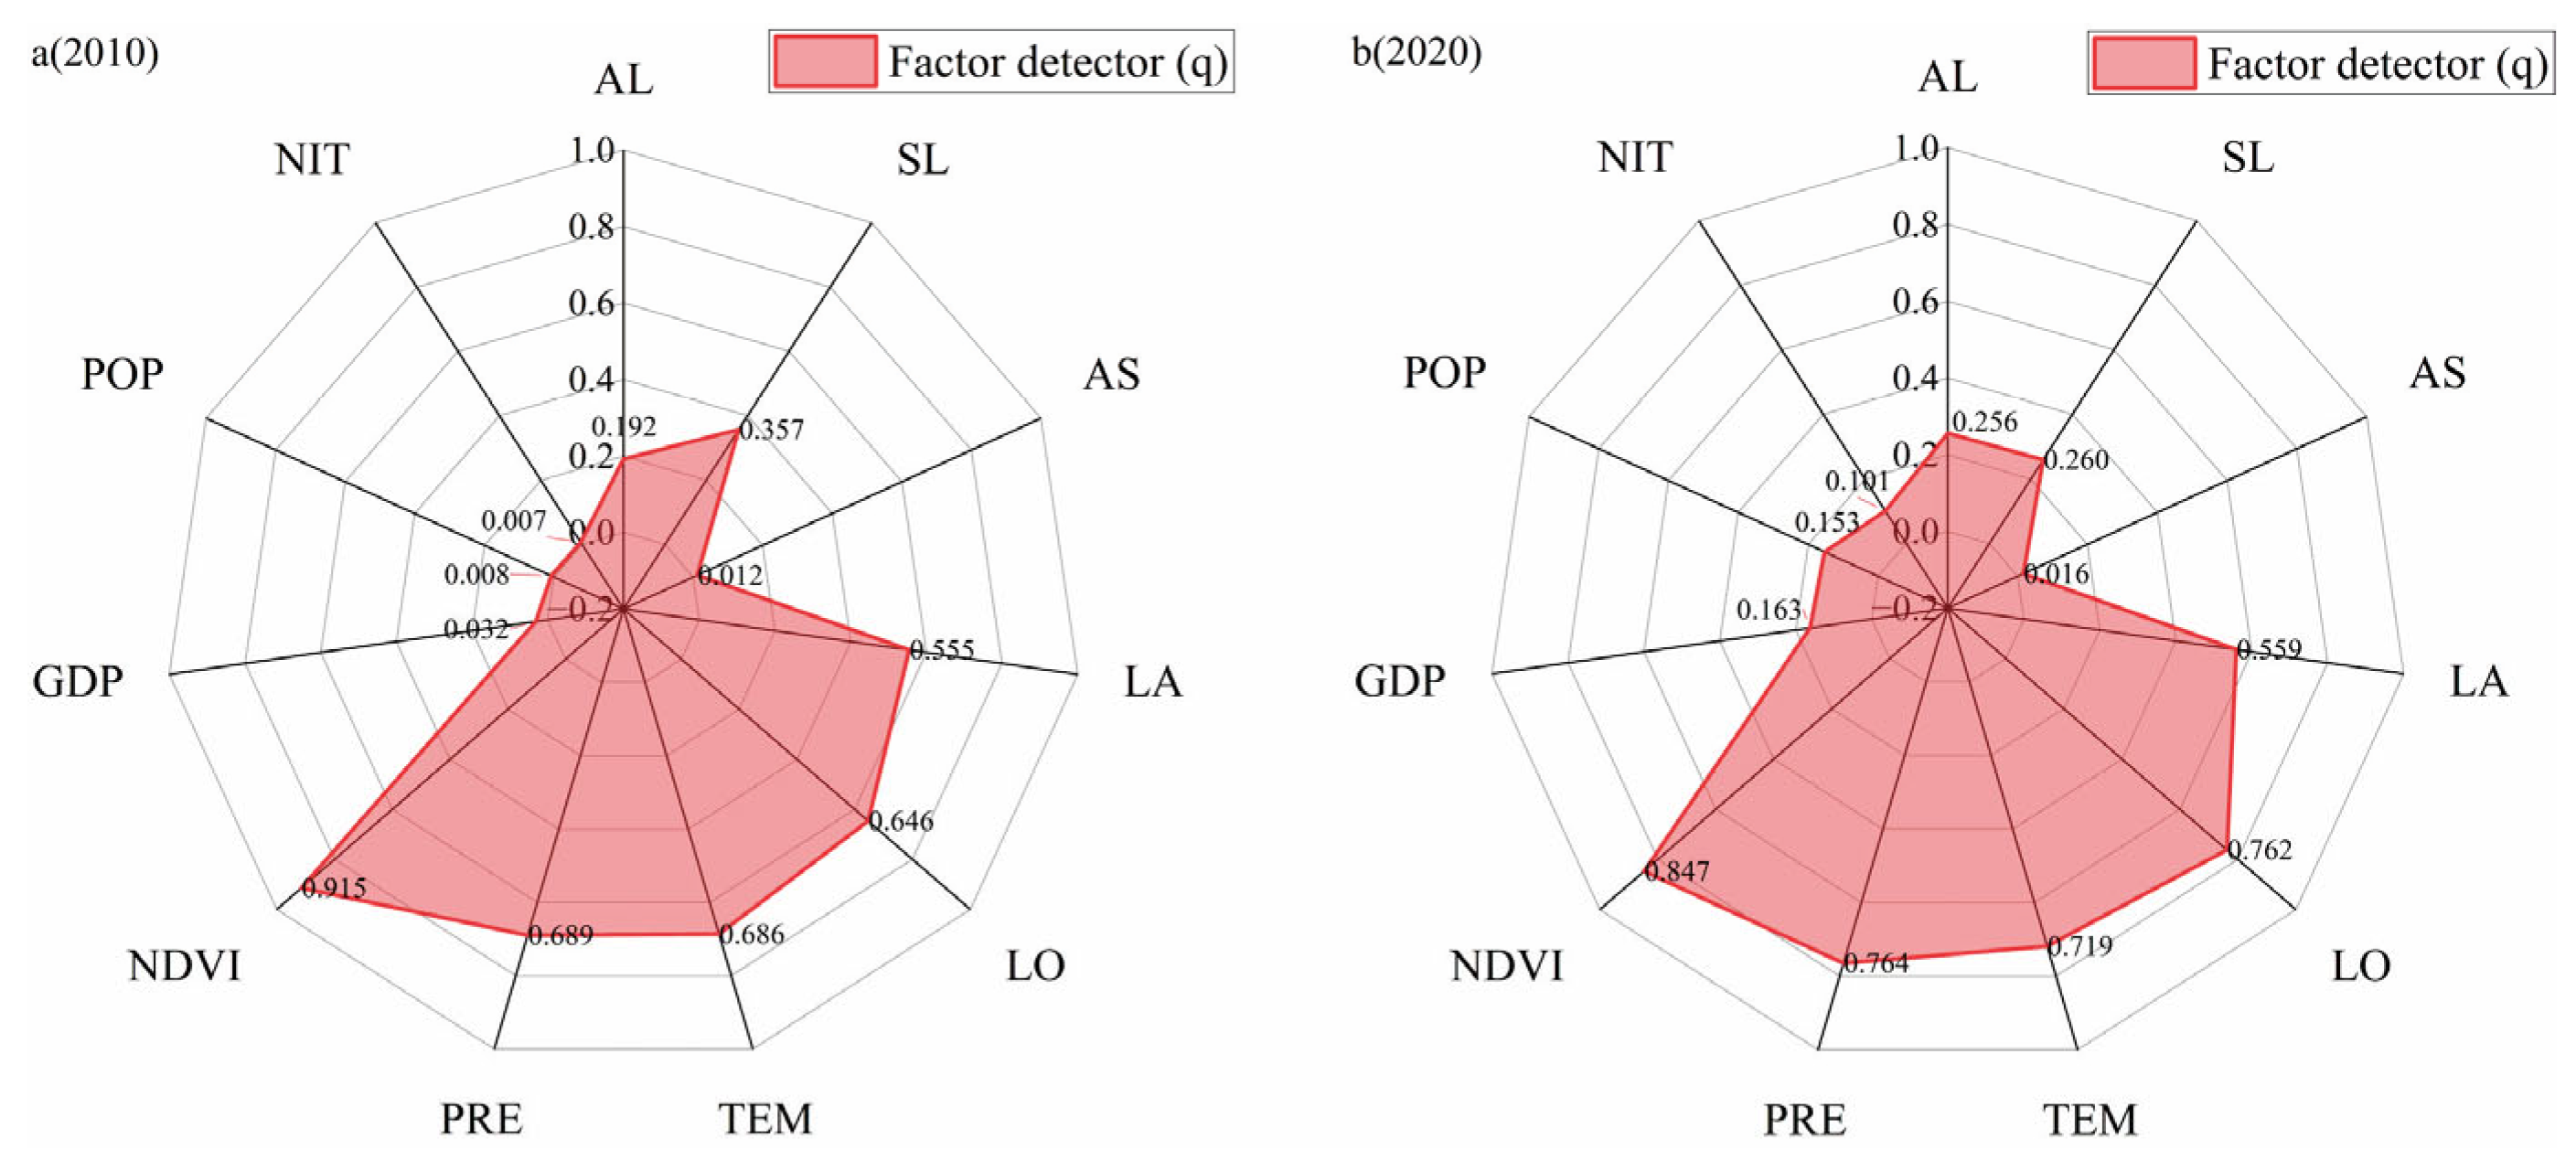
- Future projections suggest divergent trends: over 50% of regions (predominantly located west of the Greater Khingan Range) may undergo trend reversals, potentially due to climate change impacts and human pressure. Conversely, other areas are projected to maintain their current improvement trajectories, particularly where ecological protection policies have been consistently implemented. Driving factor analysis demonstrated the predominant influence of natural factors (NDVI, precipitation and temperature) on ecological changes. However, human activities exhibited amplified effects through interactive processes (e.g., GDP × precipitation synergy). Remarkably, these interaction effects accounted for an additional 22% of spatial variance beyond what single factors could explain, highlighting the complex nature of ecological quality dynamics in arid and semi-arid environments.
Author Contributions
Funding
Institutional Review Board Statement
Informed Consent Statement
Data Availability Statement
Conflicts of Interest
References
- Xu, H.Q. A remote sensing urban ecological index and its application. Acta Ecol. Sin. 2013, 33, 7853–7862. [Google Scholar]
- Xu, H.; Wang, Y.; Guan, H.; Shi, T.; Hu, X. Detecting ecological changes with a remote sensing based ecological index (RSEl) produced time series and change vector analysis. Remote Sens. 2019, 11, 2345. [Google Scholar] [CrossRef]
- Wu, Y.J.; Zhao, X.; Xi, Y.; Liu, H.; Li, C. Comprehensive evaluation and spatial-temporal changes of eco-environmental quality based on MODIS in Tibet during 2006–2016. Acta Geogr. Sin. 2019, 74, 1438–1449. [Google Scholar]
- Ye, B.W.; Sun, B.; Shi, X.H.; Zhao, Y.L.; Pang, J.Q.; Guo, Y.Y.; Yao, W.Z. Land use changes and its impact on ecological environment quality in Bayannur City. Environ. Sci. 2024, 45, 6899–6909. [Google Scholar]
- Yang, P.; Zhou, A.N.; Fu, K.X.; Wang, Y.K.; Luo, H. Assessment and analysis on roadside ecological environment quality along typical sections of Qinghai-Tibet Highway based on remote sensing ecological indices. J. Arid. Land Resour. Environ. 2024, 38, 39–48. [Google Scholar]
- Zhang, H.B.; Wang, W.; Song, Y.J.; Miao, L.G.; Ma, C. Ecological index evaluation of arid inflow area based on the modified remote sensing ecological index: A case study of Tabu River Basin at the northern foot of the Yin Mountains. Acta Ecol. Sin. 2024, 44, 523–543. [Google Scholar]
- Wen, Y.H. Assessment and spatial-temporal evolution environment in Gansu Province from 2011 to 2021. J. Arid. Land Resour. Environ. 2024, 38, 110–119. [Google Scholar]
- Li, X.; Yu, K.X.; Xu, G.C.; Li, P.; Li, Z.B.; Shi, P. Spatial characteristics and driving factors of net primary productivity of vegetation in the upper and middle Yellow River Basin. Environ. Sci. 2024, 45, 6448–6457. [Google Scholar] [CrossRef]
- Li, P.; Wang, J.; Liu, M.; Xue, Z.; Bagherzadeh, A.; Liu, M. Spatio-temporal variation characteristics of NDVI and its response to climate on the Loess Plateau from 1985 to 2015. Catena 2021, 203, 105331. [Google Scholar] [CrossRef]
- Gao, W.; Zheng, C.; Liu, X.; Lu, Y.; Chen, Y.; Wei, Y.; Ma, Y. NDVI-based vegetation dynamics and their reponses to climate change and human activities from 1982 to 2020: A case study in the Mu Us Sandy Land, China. Ecol. Indic. 2022, 137, 108745. [Google Scholar] [CrossRef]
- Mu, X.; Guo, X.; Ming, Q.; Hu, C. Dynamic evolution characteristics and driving factors of tourism ecological security in the Yellow River Basin. Acta Geogr. Sin. 2022, 77, 714–735. [Google Scholar]
- Wang, M.Y.; Wang, L.C.; Mo, L.; Mo, L.; Mu, X.D.; Ma, Z.W.; Wang, S.; Chen, X.L.; Liu, C.; Wang, L.; et al. Theoretical research and practice of water ecological assessment in tropical island watershed: A case study in Hainan Province. China Environ. Sci. 2024, 44, 3334–3341. [Google Scholar]
- Carlson, T.N.; Ripley, D.A. On the relation between NDVl, fractional vegetation cover, and leaf area index. Remote Sens. Environ. 1997, 62, 241–252. [Google Scholar] [CrossRef]
- Li, Y.; Li, Y.; Yang, X.; Feng, X.; Lv, S. Evaluation and driving force analysis of ecological quality in Central yunnan urban Agglomeration. Ecol. Indic. 2024, 158, 111598. [Google Scholar] [CrossRef]
- Qlao, M.; Zhang, Y.; Yu, L. Dynamic Monitoring of Ecological Environment Quality in Beijing Based on Remote Sensing Ecological Index. J. N. China Univ. Sci. Technol. Nat. Sci. Ed. 2020, 42, 17–23. [Google Scholar]
- Li, H.X.; Huang, J.J.; Liang, Y.J. Evaluating the quality of ecological environment in Wuhan based on remote sensing ecological index. J. Yunnan Univ. Nat. Sci. Ed. 2020, 42, 81–90. [Google Scholar]
- Feng, L.; Jia, Z.; Li, Q.; Zhao, A.; Zhao, Y.; Zhang, Z. Spatiotemporal change of sparse vegetation coverage in Northern China. J. Indian Soc. Remote Sens. 2019, 47, 359–366. [Google Scholar] [CrossRef]
- Chen, C.; Fu, J.; Zhang, S.; Zhao, X. Coastline information extraction based on the tasseled cap transformation of Landsat-8 0LI images. Estuar. Coast. Shelf Sci. 2019, 217, 281–291. [Google Scholar] [CrossRef]
- Wang, W.; Wang, X.L.; Feng, Z.K.; Dong, S. Dynamic evaluation of eco-environmental quality in the capital economic circle based on RS and GIS. J. Anhui Agric. Univ. 2015, 42, 257–262. [Google Scholar]
- Yuan, L.; Jiang, W.; Shen, W.; Liu, Y. The spatiotemporal variations of vegetation cover in the Yellow River Basin from 2000 to 2010. Acta Ecol. Sin. 2013, 33, 7798–7806. [Google Scholar]
- Gao, Z.X.; Bao, A.M.; Zheng, G.X.; Huang, X. Grassland degradation assessment based on spatial heterogeneity in Kwlusitai. J. Univ. Chin. Acad. Sci. 2023, 40, 735–742. [Google Scholar]
- Tian, Z.H.; Ren, Z.G.; Wei, H.T. Driving mechanism of the spatiotemporal evolution of vegetation in the Yellow River Basin from 2000 to 2020. Environ. Sci. 2022, 43, 743–751. [Google Scholar]
- Wu, S.; Gao, X.; Lei, J.; Zhou, N.; Guo, Z.; Shang, B. Ecological environment quality evaluation of the Sahel region in Africa based on remote sensing ecological index. J. Arid. Land 2022, 14, 14–33. [Google Scholar] [CrossRef]
- Chen, L.W. Spatiotemporal variation of water use efficiency and its responses to environ mental factors in Yellow River Basin during 2001–2020. Bull. Soil Water Conserv. 2022, 42, 222–230. [Google Scholar]
- Wang, Y.; Xu, Y.; Yang, J.; Chen, Y.; Wei, J.; Zhou, J.; Zhang, W.; Cheng, W. Dynamic monitoring and spatio-temporal pattern evolution analysis of eco-environmental quality in Chongqing based on remote sensing. Acta Ecol. Sin. 2023, 43, 6278–6292. [Google Scholar]
- Wang, J.; Xu, C. Geodetector: Principle and prospective. ACTA Geogr. Sin. 2017, 43, 116–134. [Google Scholar] [CrossRef]
- Hu, Y.; Luo, H.; Dai, S.; Deng, C.; Li, H.; Liang, W.; Zheng, Q. Evaluation of ecological environment quality and analysis of driving mechanism in Wuzhishan City of Hainan Island based on remote sensing ecological indices. Ecol. Environ. Sci. 2024, 33, 1624–1633. [Google Scholar]
- Fu, S.T.; He, C.X.; Ma, J.K.; Wang, B.; Zhen, Z.L. Ecological environment quality of the Shanxi section of the Yellow River Basin under different development scenarios. Chin. J. Appl. Ecol. 2024, 35, 1337–1346. [Google Scholar]
- Zhou, X.; Guo, H.; Deng, Z.; Liang, B. Change of remote sensing ecological index of an oasis city in the arid area. Resour. Sci. 2019, 41, 1002–1012. [Google Scholar]
- Zhang, A.-S. Dynamic Monitoring and Analysis of Ecological Environment in Wuhai City based on the RSEI Model. J. Heilongjiang Inst. Ecol. Eng. 2019, 32, 1–5. [Google Scholar]
- Yao, C.; Zhao, H.; Ren, Y. Assessment of Urban Ecological Environment Quality Change in Taiyuan City Based on Remote Sensing Ecological Index. Meteorol. Environ. Sci. 2024, 47, 85–89. [Google Scholar]
- Xu, H.Q.; Ding, F.; Wen, X. Urban expansion and heat island dynamics in the Quanzhou region, China. IEEE J. Sel. Top. Appl. Earth Obs. Remote Sens. 2009, 2, 74–79. [Google Scholar] [CrossRef]
- Xu, D.; Yang, F.; Yu, L.; Zhou, Y.; Li, H.; Ma, J.; Huang, J.; Wei, J.; Xu, Y.; Zhang, C.; et al. Quantization of the coupling mechanism between eco-environmental quality and urbanization from multisource remote sensing data. J. Clean. Prod. 2021, 321, 128948. [Google Scholar] [CrossRef]
- Yu, H.J.; Zhang, F.M.; Ma, H.; Lu, Y.Y. Quality in the Huai River Basin baed on RSEl spatio-temporal evolution and driving factors of ecological environment. Environ. Sci. 2024, 45, 4112–4121. [Google Scholar]
- Fu, L.; Zhou, Y.; Liu, G.; Song, K.; Tao, H.; Zhao, F.; Li, S.; Shi, S.; Shang, Y. Retrieval of Chla concentrations in Lake Xingkai using OLCl images. Remote Sens. 2023, 15, 3809. [Google Scholar] [CrossRef]
- Jayaram, C.; Patidar, G.; Swain, D.; Chowdary, V.M.; Bandyopadhyay, S. Total suspended matter distribution in the hooghly river estuary and the sundarbans: A remote sensing approach. IEEE J. Sel. Top. Appl. Earth Obs. Remote Sens. 2021, 14, 9064–9070. [Google Scholar] [CrossRef]
- Lu, S.; Deng, R.; Liang, Y.; Xiong, L.; Ai, X.; Qin, Y. Remote sensing retrieval of total phosphorus in the pearl river chanels based on the GF-l remote sensing data. Remote Sens. 2020, 12, 1420. [Google Scholar] [CrossRef]
- Wang, S.M.; Qin, B.Q. Research progress on remote sensing monitoring of lake water quality parameters. Environ. Sci. 2023, 44, 1228–1243. [Google Scholar]
- Wei, J.; Li, Z.; Lyapustin, A.; Sun, L.; Peng, Y.; Xue, W.; Su, T.; Cribb, M. Reconstructing 1-km-resolution high-quality PM2.5 data records from 2000 to 2018 in China: Spatiotemporal variations and policy implications. Remote Sens. Environ. 2021, 252, 112136. [Google Scholar] [CrossRef]
- Dai, Y.Y.; Gong, S.Q.; Zhang, C.J.; Min, A.L.; Wang, H.J. Remote sensing model for estimating atmospheric PM, concentration in the Guanedong-Hong Kone-Macao Greater Bay Area. Environ. Sci. 2024, 45, 8–22. [Google Scholar]
- Li, S.X.; Zou, B.; Zhang, F.Y.; Liu, N.; Xue, C.H.; Liu, J. Regionalization and analysis of PM2.5 and O3 synergetic prevention and control areas based on remote sensing data. Environ. Sci. 2022, 43, 4293–4304. [Google Scholar]
- Crist, E.P.; Cicone, R.C. A physically-based transformation of the Matic mapper data—The TM tasseled cap. IEEE Trans. Geosci. Remote Sens. 1984, 3, 256–263. [Google Scholar] [CrossRef]
- Derdouri, A.; Murayama, Y.; Morimoto, T. Spatiotemporal thermal variations in Moroccan cities: A comparative analysis. Sensors 2023, 23, 6229. [Google Scholar] [CrossRef] [PubMed]
- Gan, X.; Wilson, M.; Zhao, Y.; Wu, J.; Fernandez, I.C.; Guo, J.; Zhou, B. When to use what: Methods for weighting and aggregating sustainability indicators. Ecol. Indic. 2017, 81, 491–502. [Google Scholar] [CrossRef]
- Gong, C.; Lyu, F.; Wang, Y. Spatiotemporal change and drivers of ecosystem quality in the Loess Plateau based on RSEI: A case study of Shanxi, China. Ecol. Indic. 2023, 155, 111060. [Google Scholar] [CrossRef]
- Huang, C.; Wylie, B.; Yang, L.; Homer, C.; Zylstra, G. Derivation of atasselled cap transformation based on Landsat 7 at-satellite reflectance. Int. J. Remote Sens. 2002, 23, 1741–1748. [Google Scholar] [CrossRef]
- Xu, H.Q. A new index for delineating built-up land features insatellite imagery. Int. J. Remote Sens. 2008, 29, 4269–4276. [Google Scholar] [CrossRef]
- Li, X.; Xu, H.Q.; Li, J.; Guo, Y. Extraction of bare soil features from SPOT-5 imagery based on NDSI and NDISI. J. Geo Inf. Sci. 2016, 18, 117–123. [Google Scholar]
- Xu, Z.; Dai, Y.; Liu, W. Does environmental audit help to improve water quality Evidence from the China National Environmental Monitoring Centre. Sci. Total Environ. 2022, 823, 153485. [Google Scholar] [CrossRef]
- Yang, H.; Yu, J.; Xu, W.; Wu, Y.; Lei, X.; Ye, J.; Geng, J.; Ding, Z. Long-time series ecological environment quality monitoring and cause analysis in the Dianchi Lake Basin, China. Ecol. Indic. 2023, 148, 110084. [Google Scholar] [CrossRef]
- Yan, Z.Y.; Zhang, S.W.; Wang, Y.X. Spatiotemporal dynamics of fractional vegetation cover and climate response in Inner Mongolia during 1982–2021 based on GEE. Trans. Chin. Soc. Agric. Eng. 2023, 39, 94–102. [Google Scholar]


| |ZMK| | Sen (10−4) | ||
|---|---|---|---|
| ≥5 | −5~5 | ≤−5 | |
| >2.58 | Highly Significant Improvement | virtually unchanged | Highly Significant Decrease |
| 1.96~2.58 | Significant Improvement | Significant Decrease | |
| 1.65~1.96 | Moderate Improvement | Moderate Decrease | |
| ≤1.65 | Not Significant Improvement | Not Significant Decrease | |
| Sen | Hurst | ||
|---|---|---|---|
| 0~0.45 | 0.45~0.55 | 0.55~1 | |
| ≤−5 | transition from deterioration to improvement | random fluctuations | continuous deterioration |
| ≥5 | transition from improvement to deterioration | continuous improvement | |
| −5~5 | virtually unchanged | virtually unchanged | |
| Year | PCA | NDVI | LST | WET | NDBSI | Eigenvalues | Contribution Rate of Eigenvalues (%) |
|---|---|---|---|---|---|---|---|
| 2000 | PC1 | 0.574 | −0.679 | 0.417 | −0.188 | 0.047 | 76.37% |
| PC2 | −0.415 | −0.723 | −0.512 | 0.206 | 0.007 | 11.80% | |
| PC3 | 0.702 | 0.128 | −0.678 | 0.178 | 0.006 | 9.41% | |
| PC4 | −0.073 | 0.002 | −0.323 | −0.944 | 0.001 | 2.41% | |
| 2005 | PC1 | 0.666 | −0.597 | 0.424 | −0.144 | 0.054 | 80.16% |
| PC2 | −0.581 | −0.788 | −0.150 | 0.135 | 0.008 | 9.41% | |
| PC3 | 0.454 | −0.144 | −0.867 | 0.145 | 0.006 | 8.26% | |
| PC4 | −0.112 | −0.042 | −0.214 | −0.969 | 0.001 | 2.18% | |
| 2010 | PC1 | 0.655 | −0.673 | 0.272 | −0.210 | 0.068 | 83.04% |
| PC2 | −0.596 | −0.737 | −0.186 | 0.260 | 0.005 | 9.50% | |
| PC3 | 0.450 | −0.013 | −0.778 | 0.438 | 0.003 | 5.41% | |
| PC4 | −0.114 | −0.067 | −0.535 | −0.835 | 0.001 | 2.06% | |
| 2015 | PC1 | 0.482 | −0.844 | 0.225 | −0.064 | 0.056 | 85.92% |
| PC2 | −0.764 | −0.529 | −0.277 | 0.245 | 0.004 | 8.13% | |
| PC3 | 0.411 | −0.018 | −0.877 | 0.250 | 0.003 | 4.94% | |
| PC4 | −0.123 | −0.086 | −0.322 | −0.935 | 0.001 | 1.01% | |
| 2020 | PC1 | 0.638 | −0.703 | 0.304 | −0.076 | 0.073 | 88.00% |
| PC2 | −0.587 | −0.702 | −0.335 | 0.225 | 0.006 | 7.00% | |
| PC3 | 0.478 | 0.046 | −0.873 | 0.089 | 0.004 | 4.44% | |
| PC4 | −0.142 | −0.104 | −0.182 | −0.967 | 0.000 | 0.56% |
| RSEI Level | 2000 | 2005 | 2010 | 2015 | 2020 | |||||
|---|---|---|---|---|---|---|---|---|---|---|
| Area | Proportion | Area | Proportion | Area | Proportion | Area | Proportion | Area | Proportion | |
| Excellent | 7695.89 | 0.68 | 1810.80 | 0.16 | 5319.22 | 0.47 | 13,580.99 | 1.20 | 78,769.73 | 6.96 |
| Good | 132,640.98 | 11.72 | 137,733.85 | 12.17 | 161,500.58 | 14.27 | 178,589.99 | 15.78 | 420,331.57 | 37.14 |
| Moderate | 319,379.56 | 28.22 | 395,433.09 | 34.94 | 322,887.98 | 28.53 | 395,772.62 | 34.97 | 243,212.85 | 21.49 |
| Fair | 477,824.42 | 42.22 | 407,429.63 | 36.00 | 427,687.94 | 37.79 | 340,882.79 | 30.12 | 208,241.81 | 18.40 |
| Poor | 194,094.95 | 17.15 | 189,454.78 | 16.74 | 214,353.26 | 18.94 | 202,922.59 | 17.93 | 181,306.19 | 16.02 |
| Region | Sen | |Z| | RSEI Trend |
|---|---|---|---|
| Hinggan | 70.73 | 1.931 | MI |
| Hohhot | 27.65 | 0.906 | NSI |
| Baotou | 15.10 | 0.499 | NSI |
| Xilin Gol | 27.52 | 1.022 | NSI |
| Wuhai | 11.09 | 0.413 | NSI |
| Chifeng | 33.99 | 1.207 | NSI |
| Tongliao | 48.15 | 1.690 | SI |
| Ordos | 21.76 | 0.870 | NSI |
| Alxa | −6.25 | −0.440 | NSD |
| Hulunbuir | 32.30 | 1.090 | NSI |
| Bayan Nur | 11.29 | 0.477 | NSI |
| Ulanqab | 27.07 | 0.836 | NSI |
| Type | Highly Significant Decrease | Significant Decrease | Moderate Decrease | Non-Significant Decrease | Virtually Unchanged | Highly Significant Improvement | Significant Improvement | Moderate Improvement | Non-Significant Improvement |
|---|---|---|---|---|---|---|---|---|---|
| Area/km2 | 441.72 | 4687.49 | 9333.27 | 255,233.98 | 1279.20 | 600,815.30 | 89,786.01 | 117,613.15 | 52,558.87 |
| Proportion (%) | 0.04% | 0.41% | 0.82% | 22.55% | 0.11% | 53.09% | 7.93% | 10.39% | 4.64% |
| TYPE | Factors | Abbreviation |
|---|---|---|
| Geographical factors | altitude | AL |
| slope | SL | |
| aspect | AS | |
| latitude | LA | |
| longitude | LO | |
| normalized difference vegetation index | NDVI | |
| Climate factors | air temperature | TEM |
| precipitation | PRE | |
| Humanistic factors | gross domestic product | GDP |
| population density | PD | |
| night light intensity | NTI |
Disclaimer/Publisher’s Note: The statements, opinions and data contained in all publications are solely those of the individual author(s) and contributor(s) and not of MDPI and/or the editor(s). MDPI and/or the editor(s) disclaim responsibility for any injury to people or property resulting from any ideas, methods, instructions or products referred to in the content. |
© 2025 by the authors. Licensee MDPI, Basel, Switzerland. This article is an open access article distributed under the terms and conditions of the Creative Commons Attribution (CC BY) license (https://creativecommons.org/licenses/by/4.0/).
Share and Cite
Ji, G.; Liao, Z.; Li, K.; Liu, T.; Feng, Y.; Han, Z. Research on the Spatiotemporal Changes and Driving Forces of Ecological Quality in Inner Mongolia Based on Long-Term Time Series. Sustainability 2025, 17, 6213. https://doi.org/10.3390/su17136213
Ji G, Liao Z, Li K, Liu T, Feng Y, Han Z. Research on the Spatiotemporal Changes and Driving Forces of Ecological Quality in Inner Mongolia Based on Long-Term Time Series. Sustainability. 2025; 17(13):6213. https://doi.org/10.3390/su17136213
Chicago/Turabian StyleJi, Gang, Zilong Liao, Kaixuan Li, Tiejun Liu, Yaru Feng, and Zhenhua Han. 2025. "Research on the Spatiotemporal Changes and Driving Forces of Ecological Quality in Inner Mongolia Based on Long-Term Time Series" Sustainability 17, no. 13: 6213. https://doi.org/10.3390/su17136213
APA StyleJi, G., Liao, Z., Li, K., Liu, T., Feng, Y., & Han, Z. (2025). Research on the Spatiotemporal Changes and Driving Forces of Ecological Quality in Inner Mongolia Based on Long-Term Time Series. Sustainability, 17(13), 6213. https://doi.org/10.3390/su17136213