Abstract
The increasingly severe ecological and environmental problems in rural areas pose a serious threat to agricultural sustainability and human well-being. Protecting the ecological environment of cultivated land is fundamental to ensuring food security and achieving sustainable development goals. The effective integration of digital technology into farmers’ production and daily life is a key driver for transforming farming practices and advancing the ecological protection of cultivated land. This study draws on data from the 2020 China Rural Revitalization Survey (CRRS) to systematically examine the impact of farmers’ digital participation on the ecological protection of cultivated land. The main findings are as follows: (1) Digital participation significantly promotes ecological conservation of cultivated land, with each unit increase associated with a 7.8% reduction in fertilizer use intensity; (2) the results are robust across various empirical strategies, including instrumental variable estimation, the ERM approach, residual analysis, and alternative indicator specifications; (3) mechanism analysis indicates that digital participation reduces fertilizer use through three main channels: expansion of social networks (accounting for 7.10%), enhancement of subjective cognition (29.66%), and adoption of agricultural technologies (10.18%); and (4) heterogeneity analysis shows that the protective effects on cultivated land are more pronounced among households with off-farm employment experience, in villages where leaders have higher educational attainment, and in regions with more advanced digital environments. Based on these findings, the following policy recommendations are proposed: enhancing digital infrastructure in rural areas, strengthening the training of agricultural practitioners, and developing localized digital environments tailored to local conditions.
1. Introduction
Cultivated land preservation is fundamental to national food security but is increasingly challenged by sustainability pressures amid China’s agricultural modernization [1]. While high-input, intensive farming has historically ensured food sufficiency, it has also generated substantial ecological costs—particularly soil degradation and ecosystem decline—threatening long-term productivity. According to the Food and Agriculture Organization (FAO), pesticide application in China rose by 66.4% between 1990 and 2021, from 1.1 kg/ha to 1.83 kg/ha (data source: https://www.fao.org/faostat/en/#release_calendar, accessed on 9 October 2024), exceeding both Asian and European averages (data source: Pesticides Use and Trade 1990–2021: https://www.fao.org/documents/card/en?details=cc6958en, accessed on 9 October 2024). Fertilizer use reached 319.70 kg/ha, placing China among the highest agrochemical consumers globally. Moreover, only 31.24% of cultivated land currently meets high soil quality standards (Ministry of Ecology and Environment, 2023) (data source: Ministry of Ecology and Environment of the People’s Republic of China: https://www.mee.gov.cn/hjzl/sthjzk/zghjzkgb/202406/P020240604551536165161.pdf, accessed on 10 October 2024. Cultivated land quality grading: Ten-tier system (Grade 1 = highest quality, Grade 10 = lowest quality). These environmental pressures are compounded by two major demographic trends: growing staple crop demand due to population growth and increasing dietary diversification driven by rising incomes. Together, they underscore the urgent need to balance agricultural productivity with ecological resilience.
In response, the Chinese government has strengthened cultivated land protection through a policy framework emphasizing quantity control, quality improvement, and ecological sustainability. This strategic direction was reaffirmed at the 2024 Central Rural Work Conference. In February 2024, the State Council issued the Opinions on Strengthening Cultivated Land Protection, Improving Land Quality, and Optimizing the Compensation Balance of Land Use, formally embedding sustainable land-use practices into national policy.
However, the effectiveness of these policies ultimately depends on farmers’ behavioral responses. A major challenge lies in farmers’ limited awareness, knowledge, and incentives to actively participate in land protection. Digital village initiatives offer a potential solution by enhancing rural households’ access to information and digital capacity. Since 2013, initiatives such as Bringing Information to Rural Households and the 14th Five-Year Plan for the Development of the Digital Economy have aimed to expand rural digital infrastructure and improve digital literacy.
Existing research shows that digitalization can enhance farmers’ socioeconomic capabilities [2], facilitate employment and entrepreneurship [3], improve transaction efficiency [4], optimize production factor allocation [5], increase agricultural productivity [6], and promote income growth [7,8]. Yet, a critical question remains underexplored: Can digital participation effectively motivate farmers to engage in cultivated land protection? Addressing this question is crucial for advancing sustainable agriculture.
Current literature on the determinants of farmers’ land protection behavior focuses mainly on three dimensions. At the macro-policy level, tools such as agricultural subsidies [9], penalties [10], and high-standard farmland construction [11] influence input decisions. At the individual level, characteristics like capacity, risk preferences [12], and technical literacy [13] matter. At the social level, factors including land tenure security [14], property rights reforms [15], and agricultural service access [16] shape conservation behavior. However, the role of digital participation in driving such behavior remains insufficiently examined.
To fill this gap, this study utilizes nationally representative data from the China Rural Revitalization Survey (CRRS) to empirically assess how farmers’ digital participation affects their cultivated land protection behaviors. It further explores the underlying mechanisms, focusing on the mediating roles of social networks, subjective cognition, and agricultural technology adoption. In particular, we investigate how digital participation reduces spatial and kinship-based constraints on information transmission [17], thereby reshaping decision-making processes. These findings contribute to understanding how digital tools can support ecological conservation and sustainable agricultural development.
The primary contributions of this study are as follows. First, by establishing a causal relationship between farmers’ digital participation and their ecological protection behaviors concerning cultivated land, this study deepens the understanding of the determinants of farmers’ conservation practices. It also enriches the analysis of the mechanisms through which digital participation influences these behaviors—specifically through social networks, subjective cognition, and the adoption of agricultural technologies—thus contributing a novel analytical perspective to the discourse on sustainable agricultural development. Second, the study innovatively quantifies digital participation from two dimensions—resource endowment and behavioral capacity—thereby offering a systematic framework for evaluating farmers’ engagement in the digital economy. Moreover, it draws on representative data from multiple provinces across diverse agricultural functional zones in China, enhancing the comprehensiveness and generalizability of the findings compared to earlier studies based on single-province data. Third, this study provides policy-relevant insights into environmental governance within the context of digital rural development. Prior research has shown that farmers’ ecological awareness in China is often constrained by geographic isolation and kinship-based information flows. Our findings demonstrate that digital participation significantly encourages ecological protection behaviors, offering empirical support for the strategic use of digital tools to enhance rural environmental governance. These insights may also inform sustainable agricultural transitions in other developing countries facing similar challenges.
2. Theoretical Analysis and Research Hypothesis
2.1. Impact of Farmers’ Digital Participation on Cultivated Land Ecological Protection
In the context of digital village construction, digital elements are increasingly being integrated into various aspects of rural production and daily life, including ecological and environmental governance [18]. The level of farmers’ digital participation significantly influences their willingness and initiative to engage in environmental governance efforts [19]. Scholars and institutions have proposed diverse frameworks to define and assess digital participation. For example, institutions within the European Union define digital participation as farmers’ capacity to apply digital technologies, emphasizing their ability to use these tools confidently, critically, and responsibly in learning, work, and social engagement. Similarly, Cheng et al. (2024) measure digital participation through multiple dimensions, including access to technology, knowledge, policy, and market information [20]. Hennessy et al. (2016) conceptualize digital participation as the ability of farmers to incorporate internet-based information resources into agricultural practices, reflecting their broader capacity to utilize digital media effectively [21]. In regions with limited digital infrastructure, such as rural Ghana, digital participation is often assessed by the extent of mobile device usage among farmers, reflecting basic levels of access and adoption [22].
According to neoclassical economics, farmers are rational decision-makers who adjust the allocation of production factors in response to changes in their resource endowments. Therefore, increased ownership of digital devices and enhanced capacity to utilize digital resources can have far-reaching impacts on agricultural economies and rural societies. From an information acquisition perspective, Liu et al. (2022) found that the application of digital technologies broadens farmers’ access to agricultural knowledge and environmental policies, enhancing their awareness of environmentally friendly production practices and their understanding of the adverse effects of excessive fertilizer and pesticide use on soil health [23]. This, in turn, leads to more sustainable farming behaviors. Similarly, Tao et al. (2025) demonstrated that improved digital literacy significantly increases farmers’ willingness to participate in pesticide packaging recycling programs [24]. From a social network perspective, digital participation enables online interactions among farmers, expands their social networks, and facilitates peer learning through the sharing of green and sustainable production experiences and technologies. From a collaborative perspective, digital participation fosters synergy between smallholder farmers and agricultural service providers, enhances technology adoption, and promotes the efficient allocation of production inputs [25], ultimately generating both ecological [26] and economic benefits.
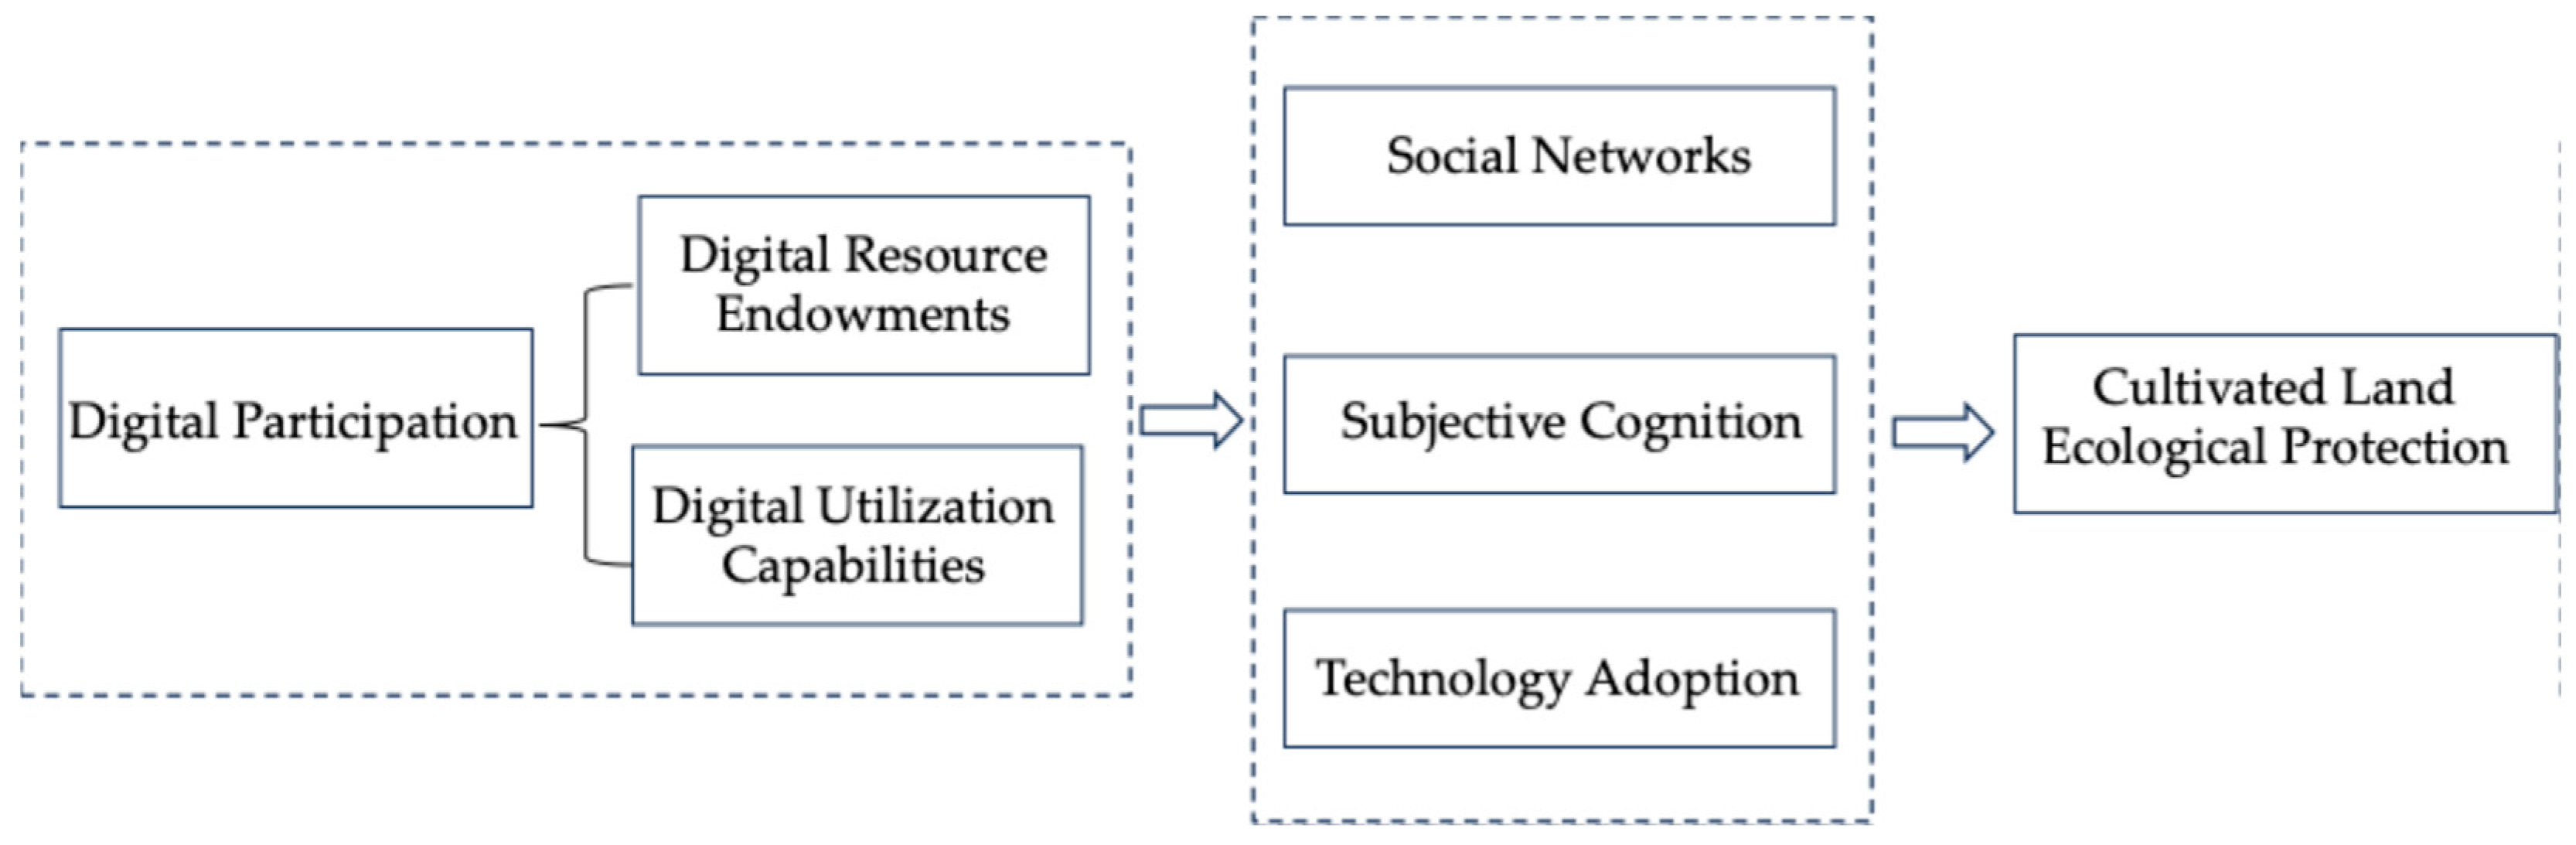
Figure 1 presents the theoretical analytical framework.
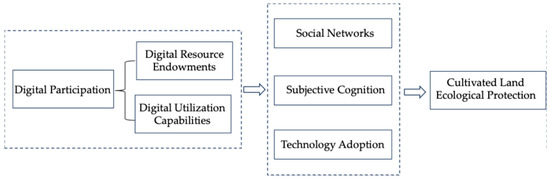
Figure 1.
Theoretical analytical framework.
Digital participation enables farmers to obtain ecological benefits by influencing their social networks, subjective cognition, and access to technical services. These changes contribute to reduced use of chemical agricultural inputs and promote the ecological conservation of cultivated land. Based on this premise, the following first hypothesis is proposed.
H1:
Farmers’ digital participation reduces agrochemical inputs and promotes agroecological sustainability in cultivated land.
2.2. Mechanisms of Influence
Digital participation contributes to improving farmers’ resource endowments and production conditions. This study identifies three primary mechanisms through which digital participation influences the ecological conservation of cultivated land: (1) expanding farmers’ social networks, (2) improving subjective cognition, and (3) promoting the adoption of agricultural technologies. These mechanisms collectively encourage more sustainable farmland management practices.
According to Granovetter’s theory of strong and weak ties [27], individual economic behavior is shaped by social interactions [28]. Digital participation facilitates online connections between farmers and other actors, such as fellow farmers and agricultural organizations [29], thereby establishing efficient communication channels and significantly expanding farmers’ social networks. This reduces communication barriers associated with time and distance, mitigates delays in information dissemination [30], and enhances farmers’ access to new technologies and knowledge.
Empirical evidence shows that neighborhood interactions increase farmers’ awareness of the value of green agricultural practices and the economic advantages of using organic fertilizers [31]. By building digital communication bridges with social service organizations, farmers can obtain timely information on emerging technologies [32], helping them recognize the importance of reducing chemical inputs and adopting green control measures. Moreover, digital participation strengthens farmers’ connections across multiple layers of the social network, facilitating the accumulation of social capital. For example, developing trust-based relationships with agricultural extension agents, input suppliers, and financial service providers enables farmers to access technical, market, and financial resources more efficiently—key factors influencing agricultural decision-making [33]. This analysis highlights the critical role of social networks. Accordingly, we propose the following hypothesis.
H2:
Digital participation promotes cultivated land conservation practices by expanding farmers’ social networks.
Both the theory of planned behavior and the theory of behavior change suggest that information is a key determinant of individual behavior. In the context of digitalization, rural households can actively engage with various online platforms—including media, social networks, and service-oriented applications—which significantly facilitate information flow and access. This digital participation enhances farmers’ cognitive capacity and environmental awareness [20], while enabling them to adopt scientific approaches to improve soil fertility [34]. For instance, online agricultural knowledge platforms provide guidance on soil fertility management and the rational application of fertilizers and pesticides, thereby enabling farmers to strengthen their land management strategies [35]. Big data and artificial intelligence algorithms can also be used to develop site-specific land use plans, improving soil fertility through optimized fallow rotations and other sustainable practices [36]. Moreover, drones and remote sensing technologies allow for timely assessment of farmland ecological conditions [37], supporting real-time adjustments in the ratio of organic to chemical fertilizer applications [38].
In summary, digital participation enhances farmers’ knowledge and promotes sustainable land management. Accordingly, we propose the following hypothesis.
H3:
Digital participation reduces farmers’ dependence on chemical fertilizers and pesticides by improving cultivated land fertility.
According to the theory of technology diffusion, digital technologies offer significant comparative advantages in the management of agricultural production, thereby contributing to the advancement of sustainable agricultural development. By leveraging digital tools, agricultural technology service providers can more effectively identify market demands and industry trends, develop advanced, efficient, and environmentally friendly agricultural equipment, guide farmers in adjusting their production methods, and enhance the levels of standardization and specialization. Intelligent agricultural machinery is increasingly replacing traditional equipment and manual labor by enabling integrated water and fertilizer application, which, in turn, improves resource use efficiency. Furthermore, it allows for the precise identification of pest- and disease-affected areas, facilitating targeted application of fertilizers and pesticides. By supporting the customization of site-specific fertilizer and pesticide management plans [39], digital technologies contribute to the ecological protection of cultivated land. On the demand side, farmers now have more convenient access to agricultural technology services through mobile applications and agricultural information platforms [40]. Technologies such as big data analytics enable the precise delivery of personalized service recommendations, assisting farmers in selecting agricultural solutions tailored to their specific production needs. The above analysis suggests that digital participation increases the likelihood of farmers adopting relevant agricultural technologies [41]. Accordingly, we propose the following hypothesis.
H4:
Digital participation promotes the protection of cultivated land by enhancing farmers’ adoption of agricultural technologies.
In summary, the analysis suggests that groups with rich social experience and extensive social networks are more susceptible to peer effects, making it easier to establish a “demonstration–diffusion” mechanism for ecological conservation behaviors. Furthermore, the development of digital technologies has increased the demand for skilled human capital. For example, village leaders with higher levels of education are likely to have stronger governance capacities, enabling them to better integrate digital resources and promote the agglomeration of talent and technology to support daily production management and oversight. Therefore, a higher level of education among village leaders may amplify the effects of digital participation. In addition, the provision of technological and skill-based support relies on a sound digital infrastructure—the more developed the digital environment, the more significant the impact of digital participation.
H5:
Digital participation has heterogeneous effects on farmers’ cultivated land ecological protection behaviors.
3. Research Design
3.1. Data Sources
The data used in this study are sourced from the 2020 China Rural Revitalization Survey (CRRS), conducted by the Institute of Rural Development at the Chinese Academy of Social Sciences (CASS). This nationally representative survey employed a stratified random sampling method across ten provincial-level administrative regions: Heilongjiang, Zhejiang, Anhui, Shandong, Henan, Guangdong, Sichuan, Guizhou, Shaanxi, and the Ningxia Hui Autonomous Region. These regions span east, south, central, west, and northeast China, ensuring broad geographic representation. The survey collected detailed information on farmers’ demographic characteristics, household digitalization, land transfer, crop production, employment, income and expenditure, village-level rural industries, land conditions, and population. To ensure data quality, observations with substantial missing values or extreme outliers were excluded. In addition, households with zero cultivated land area were removed. After data cleaning, the final valid sample consists of 1515 observations.
3.2. Variable Selection
Core explanatory variable: Digital participation is measured using two latent constructs: digital resource endowment and digital behavioral capability, which together capture the access to and effective use of digital technologies by rural households.
- Digital Resource Endowment
This dimension reflects the digital infrastructure capacity of rural households. It is measured using two indicators: (1) household information and communication technology (ICT) infrastructure, referring to the availability of internet-enabled devices such as smartphones and computers, and (2) network connectivity quality, assessed by the reliability and speed of residential broadband access.
- 2.
- Digital Behavioral Capability
This dimension evaluates farmers’ practical digital literacy skills across five functional domains: (1) information acquisition—the ability to retrieve agricultural production information from digital platforms; (2) policy engagement—the capacity to access and understand policy updates and educational materials through e-government portals; (3) social networking—the use of social media platforms for community interaction and relationship maintenance; (4) technology adoption—the competence to apply smart farming technologies via digital service platforms; and (5) civic participation—the involvement in village governance through online discussion or deliberation channels. Detailed measurement items are presented in Table 1.

Table 1.
System of indicators for digital participation.
Building on prior research concerning the relationship between digitalization and farmers’ behavior [24], this study applies factor analysis to reduce the dimensionality of the original variables, supported by robust statistical evidence. As shown in Table 2, the Kaiser–Meyer–Olkin (KMO) value is 0.753 (>0.7), suggesting adequate sampling adequacy and significant partial correlations among variables. Bartlett’s test of sphericity yields a p-value less than 0.001, rejecting the null hypothesis of variable independence and confirming the appropriateness of applying factor analysis. Additionally, the eigenvalue test indicates that the first two common factors have eigenvalues greater than 1 (2.289 and 1.041, respectively), explaining a cumulative variance of 68.5%. This satisfies both the Kaiser–Guttman criterion and the commonly accepted threshold of cumulative variance contribution exceeding 60%. In the rotated factor loading matrix, all key variables exhibit absolute loadings above 0.5. These results demonstrate that factor analysis effectively captures the underlying structure of the data, reducing dimensionality while preserving core information—thereby aligning with this study’s objective of simplifying a complex indicator system.
Table 2.
Factor analysis results for farmers’ digital participation.
Dependent variables: This study uses pesticide expenditure per mu and fertilizer use intensity per mu as proxy indicators for cultivated land ecological protection. To address potential endogeneity bias, the average level of digital participation among other households in the same village is employed as an instrumental variable in the empirical analysis.
Control variables: To accurately estimate the impact of farmers’ digital participation on cultivated land ecological protection and to mitigate potential estimation bias from omitted variables, the model includes three sets of control variables: individual characteristics, household characteristics, and village-level characteristics. Individual characteristics consist of gender, age, education level, political affiliation, and household registration location. Household characteristics include total cultivated land area, cooperative membership status, and net agricultural income. Village-level characteristics encompass topography and the average land transfer price. In addition, village fixed effects are controlled for by including village dummy variables to account for unobservable regional factors—such as weather conditions and pest infestations—that may affect farmers’ use of chemical fertilizers and pesticides. This approach ensures more robust control over cross-regional heterogeneity in the empirical analysis.
Mechanism variables: This study measures the underlying mechanisms through the following variables: First, social networks are proxied by the number of individuals from whom the respondent could borrow more than CNY 5000 in times of need. Second, subjective awareness of sustainable practices is assessed using three indicators of sustainable agricultural practices: whether the farmer (1) adopts rotational plowing to improve soil quality, (2) implements fallow periods to allow land restoration, and (3) applies straw composting as a natural fertilizer. Third, technological adoption is measured by the number of mechanized services adopted by the household across six key stages of agricultural production: plowing, sowing, irrigation, fertilization, pesticide application, and harvesting. Definitions and descriptive statistics for all variables are provided in Table 3.
Table 3.
Variable definitions and descriptive statistics.
3.3. Model Specification
3.3.1. Baseline Regression Model
This study employs a village fixed-effects model to investigate the impact of digital participation on farmers’ use of fertilizers and pesticides, while controlling for other relevant covariates. The specific estimation equation is presented in Equation (1):
where the dependent variable denotes farmer i’s intensity of fertilizer application and pesticide expenditure. is the core explanatory variable representing digital participation, which is comprehensively measured along two dimensions to capture the level of digital engagement of household . denotes a set of control variables related to agricultural production and closely associated with agrochemical input use, included to mitigate potential omitted variable bias. captures village fixed effects, and is the random error term.
3.3.2. Mechanism Analysis Model
To further investigate the potential mechanisms through which digital participation influences farmers’ fertilizer and pesticide application behaviors, this study builds upon the analytical framework established in the previous section and adopts the methodological approach proposed by Heckman et al. (2013) [42] to construct a two-stage econometric model for mediation analysis. In the first stage, we examine the impact of digital participation on three key mediating variables—social networks, subjective cognition, and agricultural technology adoption. In the second stage, we analyze how these mediating variables ultimately affect farmers’ pro-environmental production decisions.
In Equations (2) and (3), denotes the mediating variables in this study, including social networks, subjective cognition, and agricultural technology adoption. All other covariates maintain the same definitions and measurements specified in Equation (1).
4. Estimation Results and Analysis
4.1. The Baseline Estimation Results
Table 4 reports the regression results evaluating the impact of digital participation on the use of chemical inputs—specifically fertilizers and pesticides—among farm households. The baseline estimates indicate that digital participation significantly reduces fertilizer application intensity. As shown in Column (3), after controlling for individual-, household-, and village-level characteristics, a one-unit increase in digital participation corresponds to a 7.8% decrease in fertilizer use intensity. This finding lends empirical support to the study’s central hypothesis.
Table 4.
Results of the baseline estimation.
However, the results presented in Columns (4) through (6) reveal that the association between digital participation and pesticide use is negative but statistically insignificant.
These contrasting outcomes suggest that chemical fertilizers may be more readily substitutable than pesticides. Fertilizers primarily serve as nutrient supplements, and in many rural areas of China, organic alternatives—such as livestock manure and compost—are readily available, low-cost, and often free, while still offering comparable effectiveness. As digital engagement raises farmers’ awareness of sustainable agricultural practices, substituting chemical fertilizers with organic inputs becomes a feasible and cost-effective strategy. Furthermore, the widespread promotion of soil testing and formula-based fertilization in recent years has also contributed to more efficient and reduced fertilizer use.
In contrast, effective substitutes for chemical pesticides remain limited. The essential functions of pesticides—including weed suppression, pest control, and disease prevention—are more difficult to replace. Although precision agriculture technologies, such as targeted pesticide application, have been developed, their diffusion and adoption remain uneven across regions. Consequently, digital participation does not appear to significantly affect pesticide usage, highlighting the structural constraints in reducing pesticide dependence through digital engagement alone.
4.2. Mechanism Analysis
Table 5 presents the results of the Heckman two-stage estimation. Columns (1) through (5) report the effects of digital participation on the mediating variables, while Column (6) assesses the joint influence of digital participation and these mediators on fertilizer application intensity. The results show that digital participation significantly expands farmers’ social networks, enhances farmland fertility (via crop rotation and straw management), and promotes agricultural technology adoption. These mechanisms collectively contribute to the reduction in fertilizer use, confirming the theoretical pathway proposed in this study. Specifically, digital participation affects fertilizer use through both direct effects (53.06%) and indirect effects via mediators (46.94%).
Table 5.
Results of mechanism analysis.
To further quantify the relative contributions of each mechanism, we apply Gelbach’s (2016) [43] decomposition method. The results reveal that among the indirect effects, 29.66% of the reduction is driven by improved farmland fertility, 10.18% by increased technology adoption, and 7.10% by enhanced social capital. The dominant role of fertility improvement underscores how digital participation strengthens farmers’ cognitive capacity regarding sustainable practices.
In addition, digital participation improves access to agricultural machinery services and significantly expands farmers’ social networks by bridging spatial barriers through platforms such as WeChat and other digital tools. These enhanced connections facilitate information sharing and peer learning, which further reinforce farmers’ adoption of sustainable input practices.
4.3. Robustness Check
4.3.1. Instrumental Variable Approach
Effectively addressing endogeneity bias is essential in analyzing farmers’ behavioral decision-making. This study considers two potential sources of endogeneity: (1) omitted variable bias, where unobserved factors—such as regional development levels or agricultural input marketing strategies—may simultaneously affect both digital participation and production behavior, and (2) sample self-selection bias, as farmers may self-select into digital participation based on individual preferences, production goals, or other unobservable characteristics.
To mitigate these concerns, we employ an instrumental variable (IV) approach. Specifically, we use the average digital participation level of other sample households within the same village as the instrument for individual household digital participation. This instrument is appropriate for two main reasons. First, frequent social interactions among villagers facilitate the diffusion and adoption of digital technologies, making the instrument strongly correlated with the endogenous explanatory variable. Second, the digital engagement of neighboring households is unlikely to be directly related to the unobserved factors influencing the focal household’s production decisions (e.g., intrinsic preferences or unmeasurable behavioral traits), thus satisfying the exogeneity condition. Furthermore, the digital participation of other households does not directly affect the focal household’s agrochemical input decisions, reinforcing the instrument’s validity.
Table 6, Column (1) reports the first-stage results of the IV−2SLS estimation with fertilizer application intensity as the dependent variable. The results show a statistically significant positive correlation between the instrumental variable () and individual digital participation, satisfying the relevance condition for a valid instrument. The first-stage F-statistic is 13.496, exceeding the conventional threshold of 10, thus indicating the absence of a weak instrument problem.
Table 6.
IV-2SLS estimation results.
Column (2) presents the second-stage IV-2SLS estimates, revealing that the digital participation coefficient remains significantly negative at the 1% level. These results are consistent with those in Column (3) of Table 4, confirming the robustness of the findings after addressing endogeneity via the instrumental variable approach.
4.3.2. Extended Regression Model
To further assess the robustness of the estimation results, this study employs an extended regression model (ERM), which is based on a multivariate normal distribution and estimated via maximum likelihood, to address potential endogeneity concerns. As reported in Table 7, the first-stage results confirm that the instrumental variables satisfy both the relevance and exclusion restriction conditions. In particular, the estimated Atanhrho_12 parameter is statistically significant at the 1% level, supporting the validity of the ERM specification. The results remain largely consistent with the baseline regression findings, thereby reinforcing the robustness of the conclusions.
Table 7.
Estimation results based on ERM modeling.
4.3.3. Semi-Reduced Form Regression Model
To further ensure the robustness of the findings, this study employs the semi-reduced form estimation approach proposed by Nunn et al. (2011) [44] as an alternative to the baseline regression model. The estimation results reported in Columns (1) and (2) of Table 8 are consistent with the benchmark findings, thereby reinforcing the reliability of the study’s conclusions.
Table 8.
Results of semi-simplified regression.
4.3.4. Alternative Measures of Digital Participation
To address potential measurement errors, this section constructs two alternative indices of digital participation using the equal weighting method and the entropy weighting method. Columns (1) through (4) of Table 9 present the corresponding estimation results, which consistently show that digital participation significantly reduces fertilizer application intensity among rural households. These findings are robust and further corroborate the main conclusions of this study.
Table 9.
Results of the robustness.
4.3.5. Residual Analysis
To assess whether the observed reduction in fertilizer application intensity from the baseline regression is influenced by outliers or nonlinear relationships, we conduct a robustness check using residual diagnostics. Specifically, we regress both the digital participation variable and fertilizer application intensity on all control variables, extract the residuals, and generate scatter plots based on these residuals (Figure 2). The plots exhibit no apparent systematic patterns, with observations symmetrically distributed around the zero line. This suggests that outliers and nonlinear effects exert minimal influence on the baseline estimates, thereby reinforcing the robustness of the finding that digital participation significantly reduces fertilizer use.
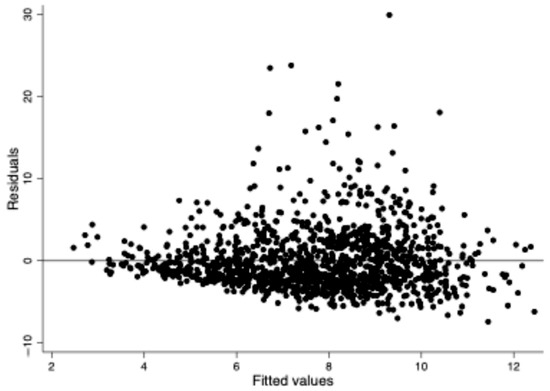
Figure 2.
Residual diagnostic plot of digital participation and fertilizer use intensity.
4.4. Heterogeneity Analysis
To explore potential heterogeneity in the effects of digital participation, we conducted subgroup analyses based on three dimensions: farmers’ off-farm employment status, the educational level of village leaders, and the local digital environment.
First, for off-farm employment, we used the survey item “Does any family member have experience working outside the local area?”, coded as 1 = Yes and 0 = No. Building on the baseline regression framework, we performed a Chow test by introducing group dummy variables and interaction terms between migration experience and the key explanatory variable. Second, we examined heterogeneity with respect to the educational background of village leaders, using the survey question on the educational level of Party branch secretaries. The education levels were categorized as follows: 1 = No formal education; 2 = Primary school; 3 = Junior high school; 4 = Senior high school; 5 = Vocational high school/technical school; 6 = Secondary specialized school; 7 = Associate degree; 8 = Bachelor’s degree; and 9 = Graduate degree. Third, we assessed heterogeneity in the local digital environment by identifying whether a village had e-commerce service stations or product consignment points. Villages were coded as 1 = Yes and 0 = No based on this criterion.
The results in Columns (1) through (3) of Table 10 indicate that the estimated coefficients of the interaction terms are all significantly negative, suggesting the presence of significant heterogeneity across different subgroups. Specifically, for households with members who have off-farm work experience, the negative effect of digital participation on fertilizer use is more pronounced. This may be attributed to the fact that these individuals benefit more from the digital dividend. For instance, in urban areas, they are exposed to better digital infrastructure, more abundant employment and learning opportunities, and broader social networks. Consequently, they have access to more diverse information sources and possess stronger capabilities in utilizing digital technologies. In addition, the fertilizer reduction effect is more evident in villages where leaders have higher levels of education. This may be because more educated leaders are better equipped to acquire knowledge through digital platforms and can serve as influential role models. Their credibility and leadership capacity may also enhance their ability to promote environmentally sustainable practices among villagers. Furthermore, the fertilizer reduction effect is more significant in regions with well-developed digital environments. This may be explained by the role of e-commerce service stations, which help connect farmers to external markets, disseminate valuable market information, and reduce information asymmetries, thereby enabling more informed and environmentally conscious production decisions.
Table 10.
Heterogeneity Analysis Results.
5. Main Conclusions and Policy Implication
5.1. Main Conclusions
This study investigates the impact of farmers’ digital participation on the ecological protection of cultivated land. As a transformative technological force, digital technology has become deeply integrated into agricultural production and rural life, accelerating information flows, reducing transaction costs, and enhancing environmental awareness among farmers. Drawing on micro-level survey data from the China Rural Research Service Center (CRRS), we construct a digital participation index based on two dimensions: digital resource endowment and digital utilization capacity. The analysis yields the following key findings.
First, digital participation significantly reduces the intensity of chemical fertilizer use, thereby promoting the ecological conservation of cultivated land. However, its effect on pesticide use is not statistically significant, likely due to the limited availability of effective pesticide alternatives.
Second, mechanism analysis based on a Heckman two-stage estimation and Gelbach decomposition reveals that digital participation influences fertilizer reduction through three key pathways: expansion of social networks (accounting for 7.10%), improvement in subjective cognition (29.66%), and increased adoption of agricultural technologies (10.18%). Among these, the enhancement of farmland fertility practices plays the most prominent mediating role.
Third, heterogeneity analysis indicates that the positive effects of digital participation are more pronounced among households with off-farm employment experience, in villages led by more highly educated leaders, and in regions with stronger digital infrastructure.
In summary, this study underscores the vital role of digital participation in advancing the green transformation of agriculture. It highlights the importance of farmers’ cognitive capacity, access to technical services, and social connectivity in fostering sustainable land use. These findings offer actionable policy insights: Enhancing rural digital infrastructure, improving farmers’ digital literacy and environmental awareness, and strengthening the integration of smallholders into modern agricultural service systems are essential for promoting sustainable agricultural development and realizing China’s rural revitalization and ecological goals.
5.2. Policy Implications
Based on the above findings, this study proposes the following policy recommendations to enhance farmers’ digital participation and promote ecological protection of cultivated land.
First, improve rural digital infrastructure. Efforts should be made to further expand broadband network coverage and enhance signal quality in rural areas, while simultaneously reducing internet access costs. This will provide a solid foundation for facilitating digital participation among farmers. On this basis, a digital agricultural service platform should be established to support intelligent farmland monitoring systems. Additionally, fertilization and pesticide management applications should be developed using intelligent algorithms capable of providing personalized crop management recommendations based on real-time soil conditions and crop growth data, thereby enabling more precise and dynamic farmland management.
Second, foster skilled agricultural operators. For general farmers, targeted training programs should be offered to strengthen their digital literacy and technical skills. These programs can focus on the use of smartphones, operation of IoT devices, and engagement with online agricultural service platforms, thereby improving their capacity to utilize digital resources effectively. For new-type agricultural operators, policies should encourage the establishment of digital agriculture demonstration zones to promote the diffusion of replicable green production techniques. Emphasis should also be placed on developing expertise in practices such as soil testing and formulated fertilization, as well as integrated water–fertilizer management. Moreover, fostering exchanges and cooperation between smallholder farmers and new-type agricultural entities can help expand farmers’ social capital and maximize the social resource value of modern agricultural operators.
Third, build a supportive digital business environment. Local governments should be encouraged to develop e-commerce platforms that align with regional agricultural strengths, thereby facilitating direct connections between producers and consumers. Promoting organic agriculture that responds to increasing consumer demand for healthy food can further enhance sustainable practices. In addition, digital platforms can be used to establish online agricultural supply stores that offer instructional videos and usage guidance, helping to address the common issue of low literacy among some farmers, which can limit their ability to interpret written instructions on product packaging. These measures can help correct improper fertilization and pesticide application behaviors in a timely manner, ultimately contributing to reduced reliance on chemical inputs and improved environmental outcomes.
5.3. Limitations and Future Research Directions of This Study
Although this study systematically investigates the impact of farmers’ digital participation on cultivated land ecological protection under the digital economy from a micro-level perspective, it still has several limitations.
First, due to data availability constraints, the analysis is based solely on the first wave (2020) of the CRRS dataset. Since updated data were not available at the time of writing, the findings may be subject to data timeliness limitations. Future research could employ panel data as they become available to verify the stability and causal mechanisms of the results over time. Second, while this study focuses on the reduction of agricultural input intensity as a key ecological outcome, cultivated land ecological protection is inherently multifaceted. Future research could extend the analytical scope to include additional environmental dimensions—such as water-saving irrigation, plastic film recycling, and the utilization of agricultural waste—which are critical for achieving rural green transformation and sustainable agricultural development. Third, other important factors that may influence ecological outcomes—such as climate change, regional environmental conditions, and variations in policy implementation across local governments—are not explicitly incorporated in this study. Future studies could integrate meteorological data, examine institutional enforcement differences, or assess climate adaptability to provide a more comprehensive understanding of the determinants of ecological conservation. These extensions would not only help to verify the robustness and generalizability of the current findings but also contribute valuable empirical evidence to address global environmental challenges and promote sustainable rural development.
Author Contributions
Q.X.: data curation, statistical analysis, and writing—original draft preparation. B.W.: critically edited and reviewed the original draft. Y.S.: participated in writing and critically edited and reviewed the original draft. All authors have read and agreed to the published version of the manuscript.
Funding
This study was funded by the Major Program of the National Social Science Fund of China [21AZD036].
Institutional Review Board Statement
Not applicable.
Informed Consent Statement
Written informed consent was obtained from all participants.
Data Availability Statement
The data used in this study were provided by the Rural Development Institute, Chinese Academy of Social Sciences. The data are third-party data, and the authors did not produce any of the original data.
Acknowledgments
The authors thank the Rural Development Institute and the Chinese Academy of Social Sciences for providing the data and all persons who provided guidance for this study.
Conflicts of Interest
The authors declare that they have no competing interests.
References
- Wu, Y.; Xi, X.; Tang, X.; Luo, D.; Gu, B.; Lam, S.K.; Vitousek, P.M.; Chen, D. Policy Distortions, Farm Size, and the Overuse of Agricultural Chemicals in China. Proc. Natl. Acad. Sci. USA 2018, 115, 7010–7015. [Google Scholar] [CrossRef] [PubMed]
- Wang, Y.; Wu, Y. Digital Economy, Rural E-Commerce Development, and Farmers’ Employment Quality. Sustainability 2025, 17, 2949. [Google Scholar] [CrossRef]
- Tang, G.; Ren, F.; Zhou, J. Does the digital economy promote “innovation and entrepreneurship” in rural tourism in China? Front. Psychol. 2022, 13, 979027. [Google Scholar] [CrossRef] [PubMed]
- Zhang, F.; Bao, X.; Deng, X.; Xu, D. Rural land transfer in the information age: Can internet use affect farmers’ land transfer-in? Land 2022, 11, 1761. [Google Scholar] [CrossRef]
- Zhang, H.; Millan, E.; Money, K.; Guo, P. E-commerce development, poverty reduction and income growth in rural China. J. Strategy Manag. 2025, 18, 148–176. [Google Scholar] [CrossRef]
- Zhu, Q.; Bai, J.; Peng, C.; Zhu, C. Has Informatization Improved Agricultural Productivity. Chin. Rural. Econ. 2019, 4, 22–40. [Google Scholar]
- Liu, Y.; Zhou, M. Can rural e-commerce narrow the urban–rural income gap? Evidence from coverage of Taobao villages in China. China Agric. Econ. Rev. 2023, 15, 580–603. [Google Scholar] [CrossRef]
- Shen, J.; Zhao, H.; Xiao, F. Empowerment and Pathways of Digital Economy in Rural Revitalization: A Case Study of Low Urbanization Areas in China. Sustainability 2025, 17, 2797. [Google Scholar] [CrossRef]
- Guo, L.; Li, H.; Cao, X.; Cao, A.; Huang, M. Effect of Agricultural Subsidies on the Use of Chemical Fertilizer. J. Environ. Manag. 2021, 299, 113621. [Google Scholar] [CrossRef]
- Chen, L.; Gao, Y.; Ma, Y. Does the Chinese Government’s System of Rewards and Punishments Encourage Farmers to Use Green Agricultural Technologies? Analysis Based on Three-Party Evolutionary Game. Pol. J. Environ. Stud. 2025, 34, 1039–1055. [Google Scholar] [CrossRef]
- Wang, Y.; Li, G.; Wang, S.; Zhang, Y.; Li, D.; Zhou, H.; Yu, W.; Xu, S. A comprehensive evaluation of benefit of high-standard farmland development in China. Sustainability 2022, 14, 10361. [Google Scholar] [CrossRef]
- Sharifzadeh, M.S.; Abdollahzadeh, G.; Damalas, C.A.; Rezaei, R. Farmers’ criteria for pesticide selection and use in the pest control process. Agriculture 2018, 8, 24. [Google Scholar] [CrossRef]
- Li, S.; Sun, S.; Zhang, C. Internet-Based Information Acquisition, Technical Knowledge and Farmers’ Pesticide Use: Evidence from Rice Production in China. Agriculture 2024, 14, 1447. [Google Scholar] [CrossRef]
- Wang, H.; Tao, R.; Wang, L.; Su, F. Farmland preservation and land development rights trading in Zhejiang, China. Habitat Int. 2010, 34, 454–463. [Google Scholar] [CrossRef]
- Baopeng, X.; Ying, C.; Tingting, P.; Mak-Mensah, E. A comprehensive review of the impact of farmland property rights stability on farmers’ land use and protection behaviors. Land Degrad. Dev. 2024, 35, 3215–3225. [Google Scholar] [CrossRef]
- Chen, X.; Liu, T. Can agricultural socialized services promote the reduction in chemical fertilizer? Analysis based on the moderating effect of farm size. Int. J. Environ. Res. Public Health 2023, 20, 2323. [Google Scholar] [CrossRef]
- Kong, X.; Jia, F. Intergenerational transmission of environmental knowledge and pro-environmental behavior: A dyadic relationship. J. Environ. Psychol. 2023, 89, 102058. [Google Scholar] [CrossRef]
- Yang, C.; Ji, X.; Cheng, C.; Liao, S.; Obuobi, B.; Zhang, Y. Digital economy empowers sustainable agriculture: Implications for farmers’ adoption of ecological agricultural technologies. Ecol. Indic. 2024, 159, 111723. [Google Scholar] [CrossRef]
- Peng, X.; Zhang, Y.; Wang, H. Digital technology, community capacity, and farmers’ participation in rural human settlement governance. Environ. Dev. Sustain. 2025, 1–23. [Google Scholar] [CrossRef]
- Cheng, C.; Gao, Q.; Ju, K.; Ma, Y. How digital skills affect farmers’ agricultural entrepreneurship? An explanation from factor availability. J. Innov. Knowl. 2024, 9, 100477. [Google Scholar] [CrossRef]
- Hennessy, T.; Läpple, D.; Moran, B. The digital divide in farming: A problem of access or engagement? Appl. Econ. Perspect. Policy 2016, 38, 474–491. [Google Scholar] [CrossRef]
- Abdulai, A.R.; Quarshie, P.T.; Duncan, E.; Fraser, E. Is agricultural digitization a reality among smallholder farmers in Africa? Unpacking farmers’ lived realities of engagement with digital tools and services in rural Northern Ghana. Agric. Food Secur. 2023, 12, 11. [Google Scholar] [CrossRef]
- Liu, W.; Long, S.; Wei, S.; Xie, D.; Wang, J.; Liu, X. Smart logistics ecological cooperation with data sharing and platform empowerment: An examination with evolutionary game model. Int. J. Prod. Res. 2022, 60, 4295–4315. [Google Scholar] [CrossRef]
- Tao, H.; Fang, L.; Lu, J.; Shi, X. The Impact of Digital Literacy on Farmers’ Pesticide Packaging Waste Recycling Behavior. Sustainability 2025, 17, 2071. [Google Scholar] [CrossRef]
- Xia, X.L.; Chen, Z.; Zhang, H.L.; Zhao, M.J. High-quality development of agriculture: Digital empowerment and realization path. China’s Rural Econ. 2019, 12, 2–15. [Google Scholar]
- Zhang, M.; Chen, E.; Zhang, C.; Liu, C.; Li, J. Multi-scenario simulation of land use change and ecosystem service value based on the markov–FLUS model in Ezhou city, China. Sustainability 2024, 16, 6237. [Google Scholar] [CrossRef]
- Easley, D.; Kleinberg, J. Networks, Crowds, and Markets: Reasoning About a Highly Connected World; Cambridge University Press: Cambridge, UK, 2010. [Google Scholar]
- Ren, Z.; Fu, Z.; Zhong, K. The influence of social capital on farmers’ green control technology adoption behavior. Front. Psychol. 2022, 13, 1001442. [Google Scholar] [CrossRef]
- Wang, Y.; Weng, F.; Huo, X. Can digital finance promote professional farmers’ income growth in China?—An examination based on the perspective of income structure. Agriculture 2023, 13, 1103. [Google Scholar] [CrossRef]
- Peng, X.; Yan, X.; Wang, H. Study on the Effect of Digital Technology Adoption and Farmers’ Cognition on Fertilizer Reduction and Efficiency Improvement Behavior. Agriculture 2024, 14, 973. [Google Scholar] [CrossRef]
- Qiao, D.; Li, N.; Cao, L.; Zhang, D.; Zheng, Y.; Xu, T. How agricultural extension services improve farmers’ organic fertilizer use in China? The perspective of neighborhood effect and ecological cognition. Sustainability 2022, 14, 7166. [Google Scholar] [CrossRef]
- Rahman, M.M.; Connor, J.D. Impact of agricultural extension services on fertilizer use and farmers’ welfare: Evidence from Bangladesh. Sustainability 2022, 14, 9385. [Google Scholar] [CrossRef]
- Agarwal, R.; Gupta, A.K.; Kraut, R. Editorial overview—The interplay between digital and social networks. Inf. Syst. Res. 2008, 19, 243–252. [Google Scholar] [CrossRef]
- Sarker, M.N.; Islam, M.S.; Ali, M.A.; Islam, M.S.; Salam, M.A.; Mahmud, S.M. Promoting digital agriculture through big data for sustainable farm management. Int. J. Innov. Appl. Stud. 2019, 25, 1235–1240. [Google Scholar]
- Ding, J.; Jia, X.; Zhang, W.; Klerkx, L. The effects of combined digital and human advisory services on reducing nitrogen fertilizer use: Lessons from China’s national research programs on low carbon agriculture. Int. J. Agric. Sustain. 2022, 20, 1136–1149. [Google Scholar] [CrossRef]
- Sereenonchai, S.; Arunrat, N. Farmers’ perceptions, insight behavior and communication strategies for rice straw and stubble management in Thailand. Agronomy 2022, 12, 200. [Google Scholar] [CrossRef]
- Zhu, X.; Xiao, G.; Wang, S. Suitability evaluation of potential arable land in the Mediterranean region. J. Environ. Manag. 2022, 313, 115011. [Google Scholar] [CrossRef]
- Radočaj, D.; Jurišić, M.; Gašparović, M. The role of remote sensing data and methods in a modern approach to fertilization in precision agriculture. Remote Sens. 2022, 14, 778. [Google Scholar] [CrossRef]
- Li, B.; Zhuo, N.; Ji, C.; Zhu, Q. Influence of smartphone-based digital extension service on farmers’ sustainable agricultural technology adoption in China. Int. J. Environ. Res. Public Health 2022, 19, 9639. [Google Scholar] [CrossRef]
- Zheng, Y.; Wei, J. Does Internet use promote the adoption of agricultural technology? Evidence from 1449 farm households in 14 Chinese provinces. J. Integr. Agric. 2022, 21, 282–292. [Google Scholar] [CrossRef]
- Khan, N.; Ray, R.L.; Zhang, S.; Osabuohien, E.; Ihtisham, M. Influence of mobile phone and internet technology on income of rural farmers: Evidence from Khyber Pakhtunkhwa Province, Pakistan. Technol. Soc. 2022, 68, 101866. [Google Scholar] [CrossRef]
- Heckman, J.; Pinto, R.; Savelyev, P. Understanding the mechanisms through which an influential early childhood program boosted adult outcomes. Am. Econ. Rev. 2013, 103, 2052–2086. [Google Scholar] [CrossRef] [PubMed]
- Gelbach, J.B. When do covariates matter? and which ones, and how much? J. Labor. Econ. 2016, 34, 509–543. [Google Scholar] [CrossRef]
- Nunn, N.; Wantchekon, L. The slave trade and the origins of mistrust in Africa. Am. Econ. Rev. 2011, 101, 3221–3252. [Google Scholar] [CrossRef]

Disclaimer/Publisher’s Note: The statements, opinions and data contained in all publications are solely those of the individual author(s) and contributor(s) and not of MDPI and/or the editor(s). MDPI and/or the editor(s) disclaim responsibility for any injury to people or property resulting from any ideas, methods, instructions or products referred to in the content. |
© 2025 by the authors. Licensee MDPI, Basel, Switzerland. This article is an open access article distributed under the terms and conditions of the Creative Commons Attribution (CC BY) license (https://creativecommons.org/licenses/by/4.0/).